
Abstract
Objectives:
The consumption of whole grains is widely recognised as healthy and included in several national dietary guidelines. Despite that, the consumption of whole grain products remains sub-optimal.
Methods:
We developed a questionnaire investigating perceptions of price, taste, positive and negative health effects, sustainability and versatility of whole grains and the consumption frequency of whole grain food products. This questionnaire was administered to a sample of 1,014 individuals in Northern Italy.
Results:
We observed an overall positive attitude towards whole grain products, especially in relation to positive health effects, versatility and taste, that resulted in strong drivers for whole grain consumption. Age, gender and educational level were identified as influences on whole grain perceptions, especially for taste and positive health effects. Respondents were clustered according to the attitudes they expressed.
Conclusion:
The characteristics of these clusters could be used to customise future nutritional education programmes.
Whole grains perception and consumption attitudes: results of an Italian survey
According to the definition provided by the EU HEALTHGRAIN project, whole grains …. consist of the intact, ground, cracked or flaked kernel after the removal of inedible parts such as the hull and husk. The principal anatomical components – the starchy endosperm, germ and bran – are present in the same relative proportions as they exist in the intact kernel. Small losses of components – that is, less than 2% of the grain/10% of the bran – that occur through processing methods consistent with safety and quality are allowed. (van der Kamp et al., 2014).
Whole grains are a key component of a healthy diet, as recommended by a number of health and education organisations and authorities (Harvard University, TH Chan School of Public Health, 2017; U.S. Department of Health and Human Services and U.S. Department of Agriculture, 2015; World Cancer Research Fund/American Institute for Cancer Research, 2018). Regular whole grain consumption as a part of a balanced diet may reduce the risk of chronic diseases as cardiovascular disease, stroke, type 2 diabetes and certain types of cancer. (Benisi-Kohansal et al., 2016; Micha et al., 2017; Song et al., 2018). Moreover, the daily consumption of whole grains may contribute to weight control, preventing being overweight and obesity (Mozaffarian et al., 2011). According to a recent international review of the food-based dietary guidelines undertaken by the Food and Agriculture Organisation, recommendations concerning whole grain consumption are explicitly mentioned in national dietary guidelines – mostly in Europe (in 70% of the European guidelines considered), North America (in 100% of the guidelines considered) and the Near East (in 75% of the guidelines considered). Moreover, 53% of food-based dietary guidelines (mainly in Europe) clearly include whole grains in their graphical representations of dietary guidelines (Herforth et al., 2019).
Despite the evidence on whole grains’ potential health benefits, dietary recommendations concerning their consumption and their increasing availability in the market, whole grain consumption is still internationally sub-optimal. In 2017, the mean consumption of whole grains was globally estimated to be around 29 g per day, while the assessed mean of the optimal level for adult population was estimated to be 125 g (100–150 g is the optimal range of intake) (Afshin et al., 2019; Herforth et al., 2019). In an Italian study involving 3,270 subjects (children, adolescents, adults and elderly people), only 23% of respondents reported consuming whole grains, with a mean daily intake ranging from 6.0 g in female children to 19.1 g in older women (Ruggiero et al., 2019; Sette et al., 2017).
Food choice is a complex process influenced by many interrelated factors (Shepherd, 2005). Personal attitudes play a role in supporting or preventing change in dietary habits (Aggarwal et al., 2014). In previous research, lack of awareness of the health benefits, perceived negative sensory properties, high price, misconceptions about availability and preparatory techniques have been reported as possible barriers to whole grain intake (Kamar et al., 2016). Among these factors, negative perception of sensory properties is generally recognised as the most relevant barrier to whole grain consumption (Gellar et al., 2009; Gellynck et al., 2009; McMackin et al., 2013). Many people understand whole grain products to be healthier, but they believe that benefits of consuming whole grain products instead of refined ones are minimal and not sufficient to trigger change in behaviour (Arvola et al., 2007).
Because of this, whole grain consumption in Italy remains largely below the recommended level. In 2019, new Italian food-based guidelines sought to further address the importance of a healthy diet rich in whole grains, stressing that efforts to implement dietary change in any age group in Italy should be mandatory and urgent (Consiglio per la ricerca in agricoltura e l’analisi dell’economia agraria, 2019). Knowledge concerning attitudes, awareness and perceived barriers to whole grain consumption is central to planning dietary interventions to improve willingness to eat whole grain products. Despite this, and to our knowledge, no previous study had explored attitudes towards whole grain intake in Italy.
The aim of the present study was to assess people’s perceptions of whole grain food products and investigate if attitudes relate to whole grain intake and socio-demographic characteristics. For this purpose, we developed a questionnaire for self-administration and administered it to a random sample of people recruited in a city in Northern Italy.
Materials and methods
Survey instrument
The questionnaire was informed by those used in several international studies (Bakke and Vickers, 2007; Magalis et al., 2016; McMackin et al., 2013; Mellette et al., 2018). It consisted of three parts. In the first part, attitudes about six dimensions of whole grain food products were investigated: price, taste, positive health effects, negative health effects, environmental sustainability and versatility. Respondents had to indicate their degree of agreement using a 10-point Likert-type scale or by selecting the ‘I don’t know’ option. The scale for price ranged from ‘cheap’ (1) to ‘expensive’ (10) for taste; from ‘disgusting’ (1) to ‘very tasty’ (10) for positive and negative health effects; from ‘not present’ (1) to ‘high’ (10) for environmental sustainability; from ‘not-sustainable’ (1) to ‘very sustainable’ (10) for versatility and from ‘difficult to use’ (1) to ‘easy to use’ (10).
In the second part of the questionnaire, respondents were invited to indicate their frequency of consumption of whole grain products using a six-point scale: ‘many times a day’; ‘once a day’; ‘almost every day’; ‘2–3 times a week’; ‘occasionally’ and ‘never’. In addition, they were asked to detail to what extent they choose whole grain products when they consumed five food categories: pasta, rice, bread, other bakery products (e.g. pizza, biscuits and cakes) and flour. The consumption frequencies were ‘never’, ‘less than 25% [of the time]’, ‘25–50% [of the time]’, ‘50–75%’, ‘more than 75% [of the time]’ and ‘food category not consumed’.
In the third part of the questionnaire, data on the socio-demographic characteristics of the respondents were collected: age (choosing between 12 age group categories from ‘under 16’ to ‘over 65’), gender, number of family members and educational level. The survey was completed anonymously, and no sensitive personal data were collected.
Participants
The target population in this study comprised adolescents and adults randomly sampled between September 2018 and May 2019 in Brescia, a city in the north of Italy. People waiting to visit friends and relatives at the main city hospital were approached along with those attending a public event organised in May 2019 at the University of Brescia. In both the settings, questionnaires were distributed by trained students and teachers from the degree course in dietetics of the University of Brescia. After a quick description of the research purpose and the questionnaire’s characteristics, respondents were allowed to compile it on their own. The questionnaire was designed to be completed in 3 minutes on average.
Data analysis
Perceptions of the six dimensions related to whole grains were analysed in relation to whole grain consumption habits and the socio-demographic characteristics of the respondents. We divided respondents into two groups: consumers, who reported consuming whole grain products at least twice a week; and non-consumers, who reported not consuming whole grain products or consuming them at most occasionally. Since the distributions of perceptions did not meet assumptions of normality, the Kruskal–Wallis and the Mann–Whitney tests were used to test differences in ranks of these distributions. The level of significance (α) considered is .05. We then carried out a hierarchical cluster analysis on perception data in order to identify different patterns of attitudes about whole grain products. Euclidean distance matrix of perception scores was calculated based on the assessments made on the six dimensions. Ward’s method was used to conduct the cluster analysis and prepare the hierarchical dendrogram (the analysis was performed with R software, version 3.5.3).
Results and discussion
The questionnaire was completed by 1,014 individuals: 62% women, 38% men, one respondent did not declare their gender. The mean age of participants was 33.5 ± 16.4 years.
Concerning family composition, 41% of respondents reported belonging to a four-person household. Two- and three-person households comprised 15% and 21% of the respondents, respectively. Families with five or more members represented 16% of the sample. About 7% of the respondents were living alone.
According to the International Standard Classification of Education (UNESCO Institute for Statistics, 2012), 28% of respondents had finished lower secondary education, 45% had completed upper secondary education and 27% of the sample had completed at least the first stage of tertiary education (with 8, 13 and at least 16 years of schooling, respectively).
The distribution of respondents’ perceptions of whole grain food products and the results of the Kruskal–Wallis test performed on each perception distribution considering age, gender and education level are shown in Table 1.
Respondents’ perceptions of whole grain products’ characteristics.
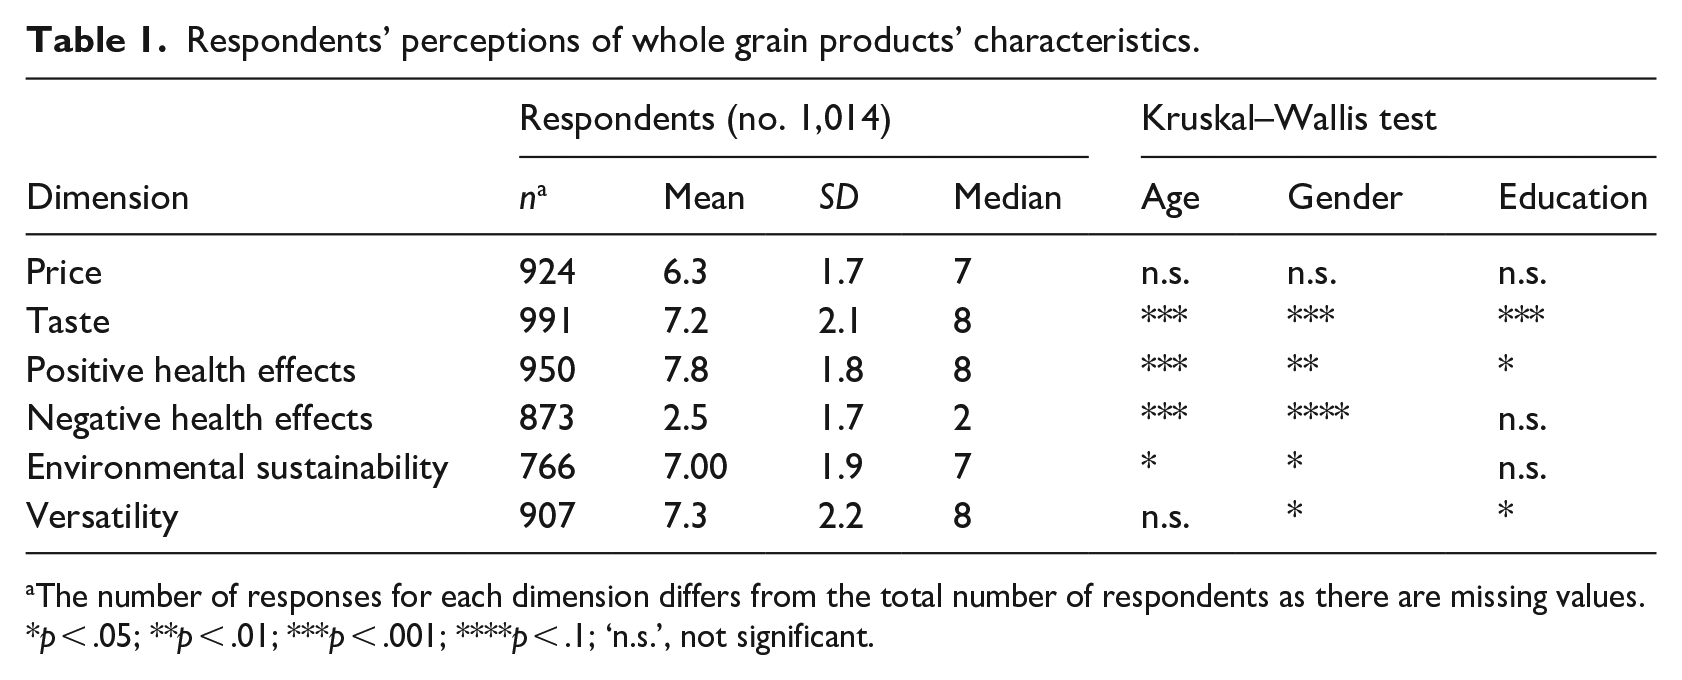
The number of responses for each dimension differs from the total number of respondents as there are missing values.
p < .05; **p < .01; ***p < .001; ****p < .1; ‘n.s.’, not significant.
The mean score of price perception was 6.3, without significant differences in age, gender and level of education categories (p = .169, .358 and .916, respectively).
With respect to taste perception, differences in age, gender and educational level were statistically significant (p = .002, <.001 and <.001, respectively). Respondents aged between 21 and 35 years showed the highest mean score (7.6). The mean perceptions of younger respondents (under 21 years of age) and adults (over 35 years of age) were lower (6.8 and 7.1, respectively). Women reported higher scores than men (7.4 and 6.6, respectively). Respondents with lower secondary education reported lower scores than university graduate respondents (mean scores were 6.7 and 7.4, respectively).
Age, gender and educational level significantly affected perceptions about the positive health effects of whole grains (p ⩽ .001, .001 and .02, respectively). Elderly people (over 65 years of age) perceived a lower level of positive health benefit of whole grains than others (mean scores were 6.9 and 7.8, respectively). The mean-score-perceived health benefits among women was 7.9, and that among men was 7.6. The mean score increased as education level increased (the mean score for respondents with an educational level lower than a secondary school leaving certificate was 7.4, and that for university graduates was 7.9).
In relation to perceptions of negative health effects, age significantly affected reported scores (p ⩽ .001), but differences by gender were only weakly significant (p = .052), while education level did not significantly affect perceptions (p = .6). People older than 65 years perceived a lower level of negative health effects from whole grains than adults of the age range 21–65 years and people younger than 21 years. The mean scores were 1.8, 2.5 and 2.5, respectively.
Perceptions of the environmental sustainability of whole grain consumption showed no significant differences between educational levels (p = .209), while statistically significant differences between age and gender (p = .013 and .040, respectively) were observed. People younger than 21 years and older than 50 years reported the highest levels of environmental sustainability perceptions. Adults between the age range of 21 and 50 years in contrast indicated a lower level of perception of sustainability (mean scores were 7.2, 7 and 6.8, respectively). The mean score for women was 7.1, and that for men was 6.8.
Versatility perception scores were significantly affected by gender (p = .012, mean scores were 7.5 for women and 7.1 for men) and education level (p = .021). The mean score increased as the educational level increased (6.9 for respondents with an education level lower than a secondary school certificate and 7.5 for university graduates).
The results of the comparisons between consumers and non-consumers of whole grains are reported in Table 2. Out of the 666 consumers, 113 respondents (11% of the total sample) are consuming whole grain products daily or more than once a day. The non-consumers category included 347 persons (34% of the total sample) who reported consuming whole grain products at most occasionally. The reported rate of consumption was higher among female consumers (p < .001), while the mean number of family members was higher among non-consumers (p = .036). For all dimensions, the mean scores were significantly higher for consumers than for non-consumers, with the exception of price and negative health effects. For these two dimensions, lower values on the perception scale corresponded to characteristics that were more favourable towards whole grains (cheap and low/absent negative effects on health).
Socio-demographic profile and attitudes towards whole grains of consumers and non-consumers. a
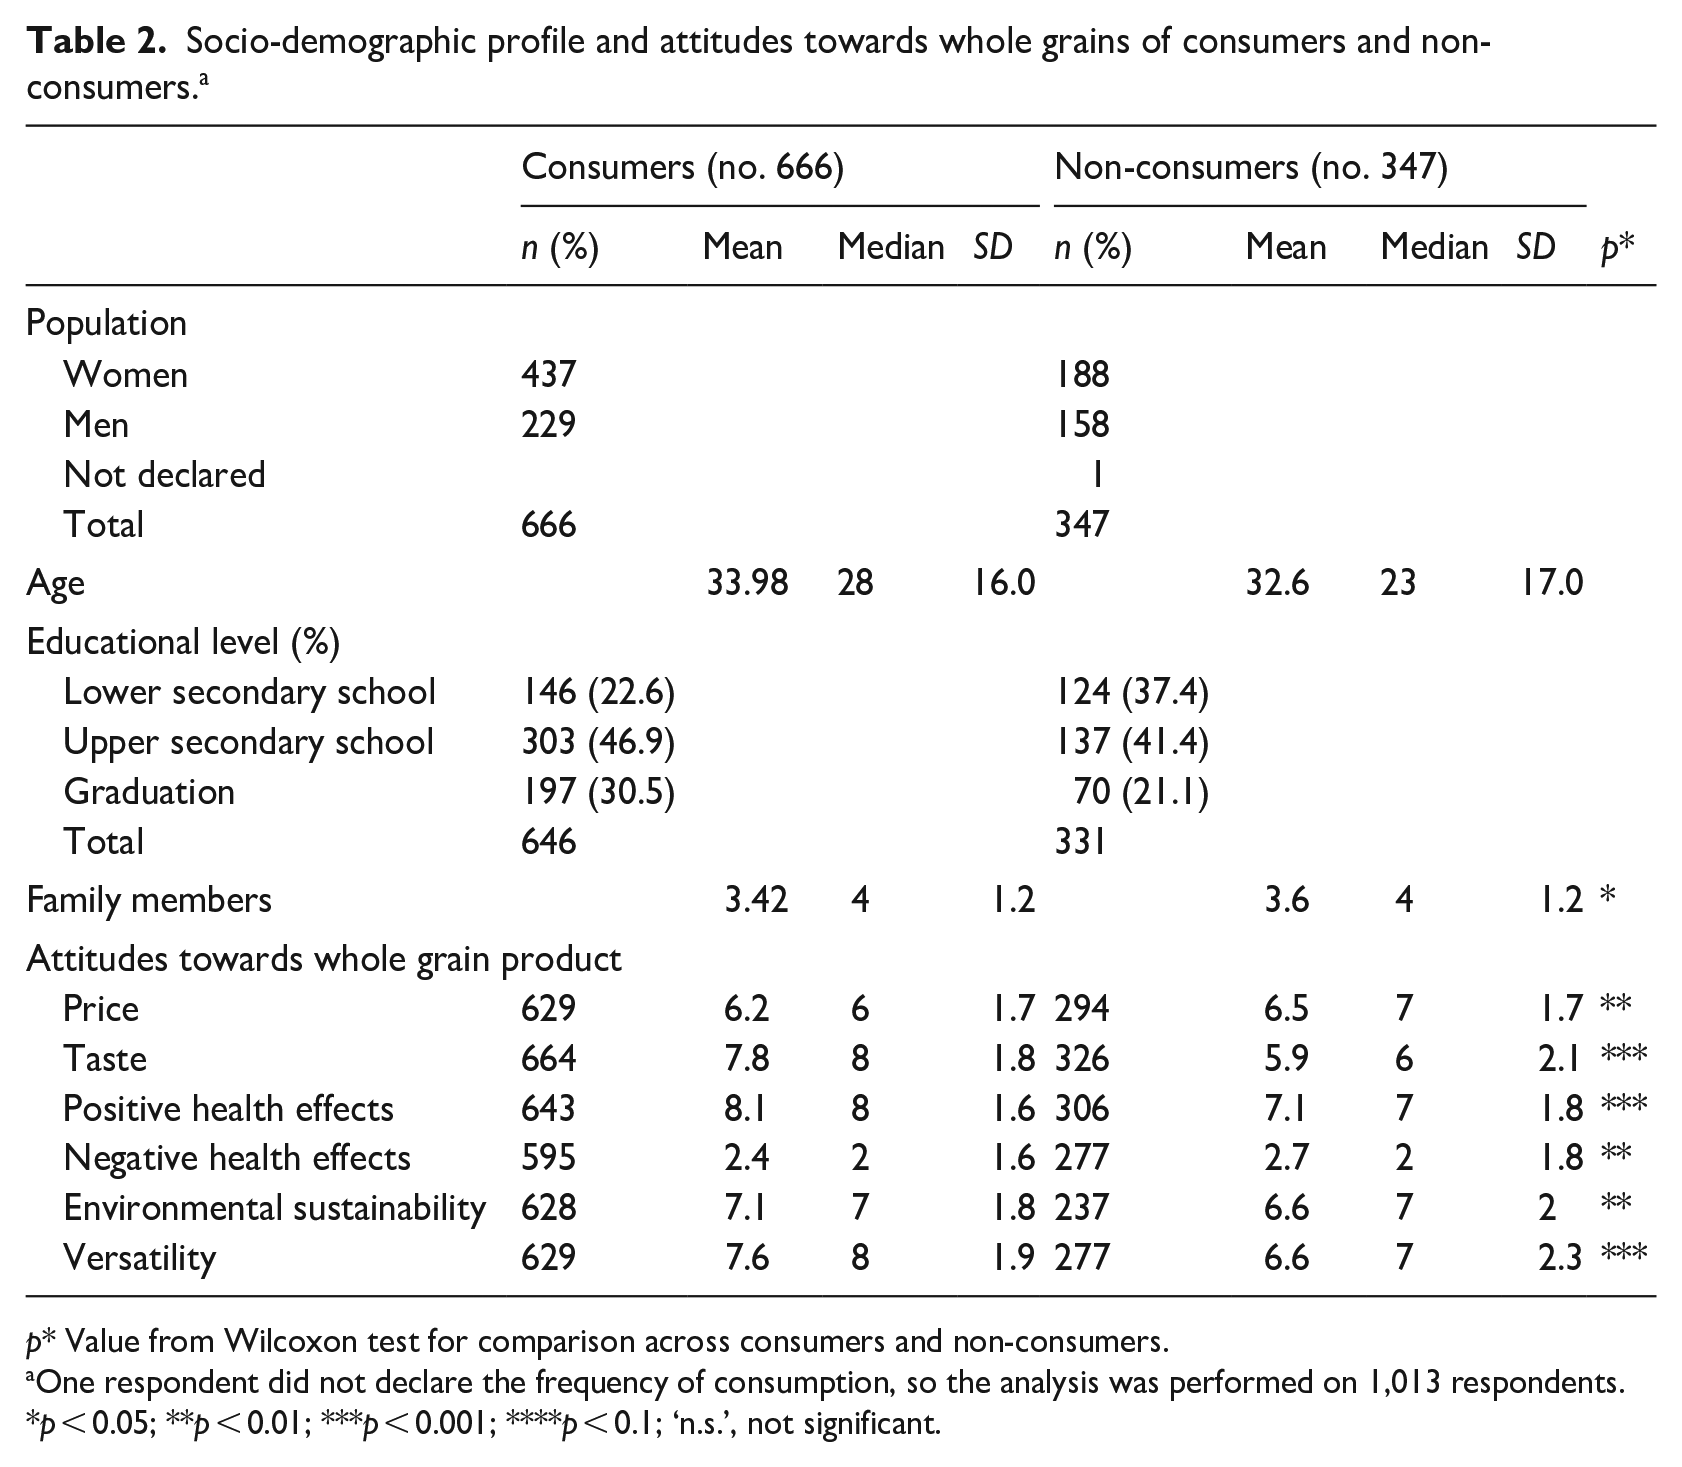
p* Value from Wilcoxon test for comparison across consumers and non-consumers.
One respondent did not declare the frequency of consumption, so the analysis was performed on 1,013 respondents.
p < 0.05; **p < 0.01; ***p < 0.001; ****p < 0.1; ‘n.s.’, not significant.
From the comparison between consumers and non-consumers, it can be inferred that the perception of whole grain products was an important driver of whole grain consumption. This relationship became evident when analysing the distribution of taste and versatility perception scores according to the six categories of whole grain consumption (Figure 1). The boxplots revealed a positive correlation between ‘tasty’ and ‘easy to use’ whole grain perception and higher consumption frequency.
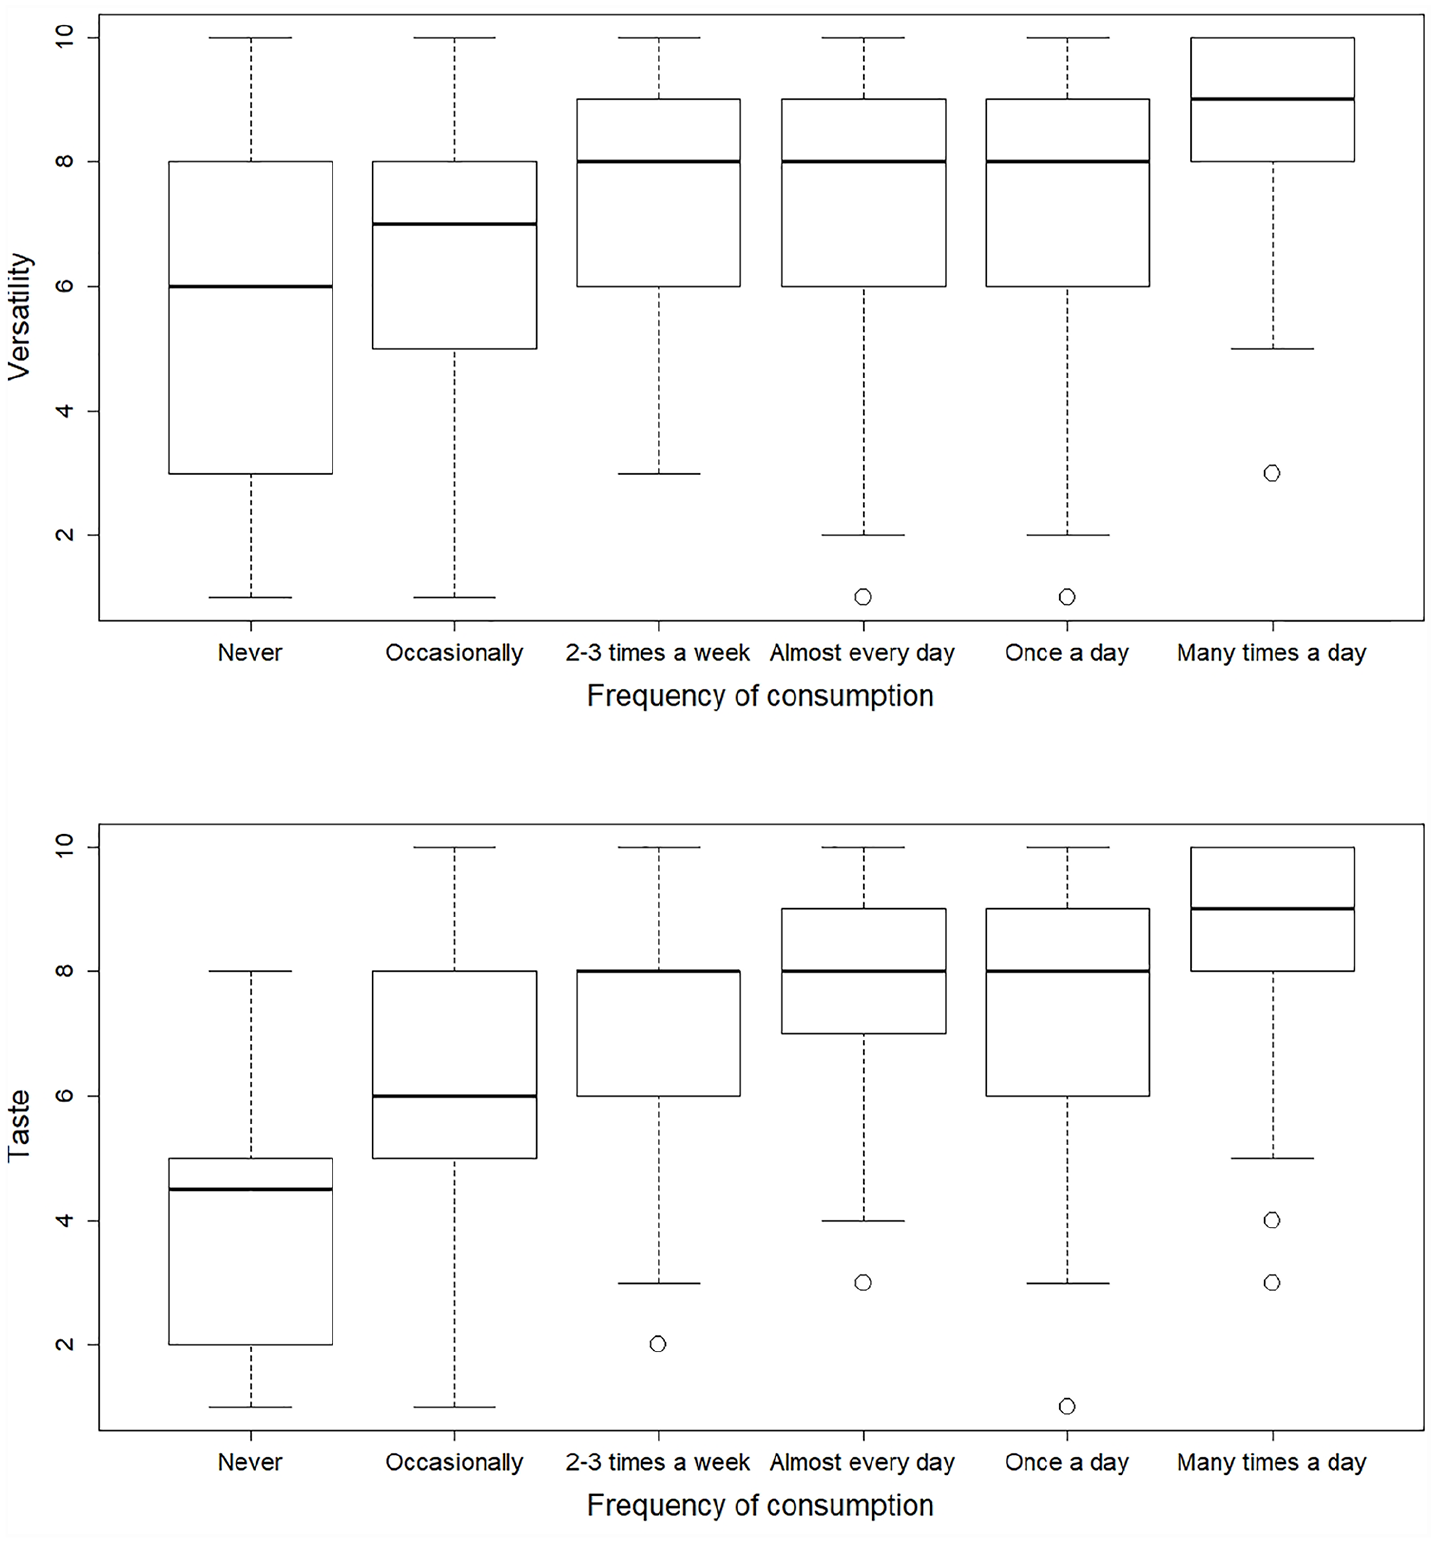
Box plot representations of distributions of perception scores on versatility and taste according to consumption frequency. Points represent scores that are outside the range (mean ± 1.5*interquartile range).
In the second part of the questionnaire, we investigated the frequencies of consumption of specific whole grain products such as pasta, rice, bread, bakery products and flours. The results of this analysis are detailed in Table 3 and Figure 2. Bread and pasta were the most frequently consumed whole grain products while flour and rice were the least frequently used whole grain products (29% of respondents never chose whole grain flour, and 27% never consumed whole grain rice). In contrast, wholemeal bread was reported to be consumed at least once a week by 87% of respondents.
Whole grain consumption frequency of different whole grain food products.
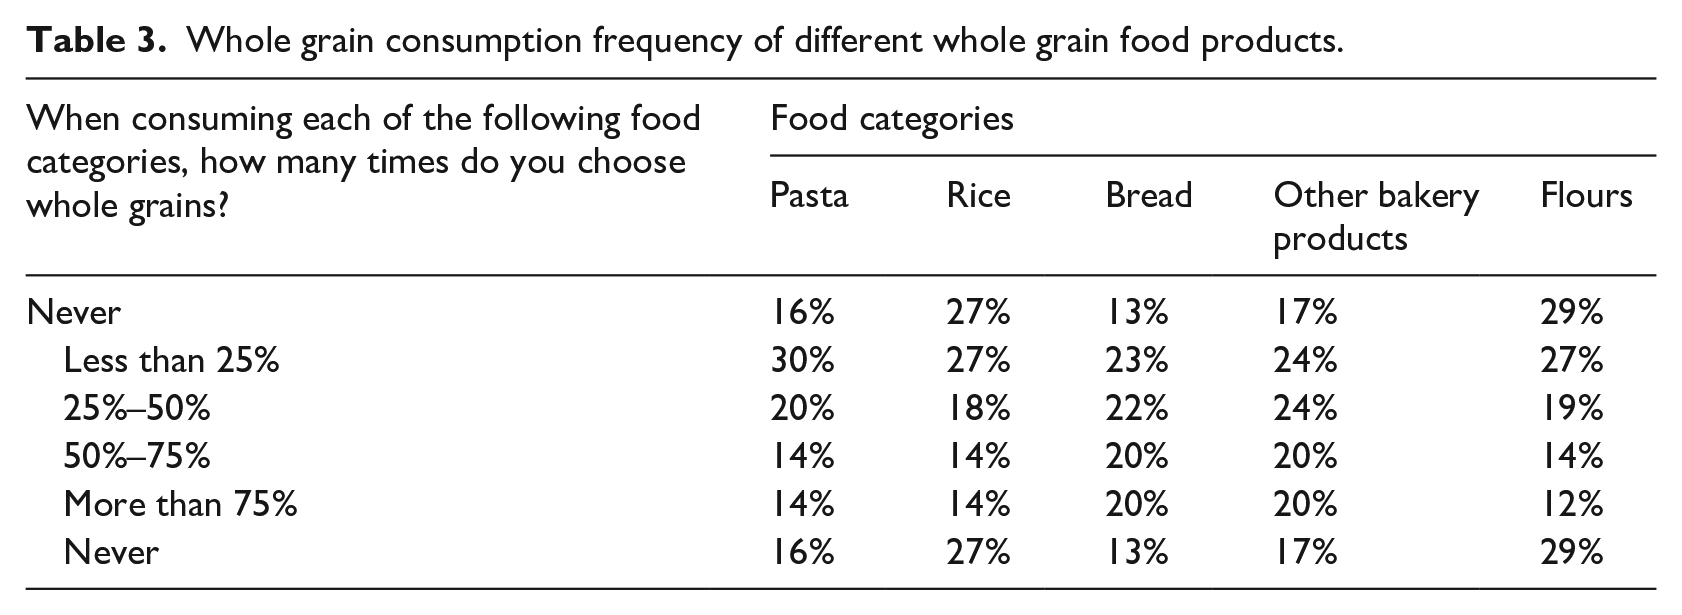
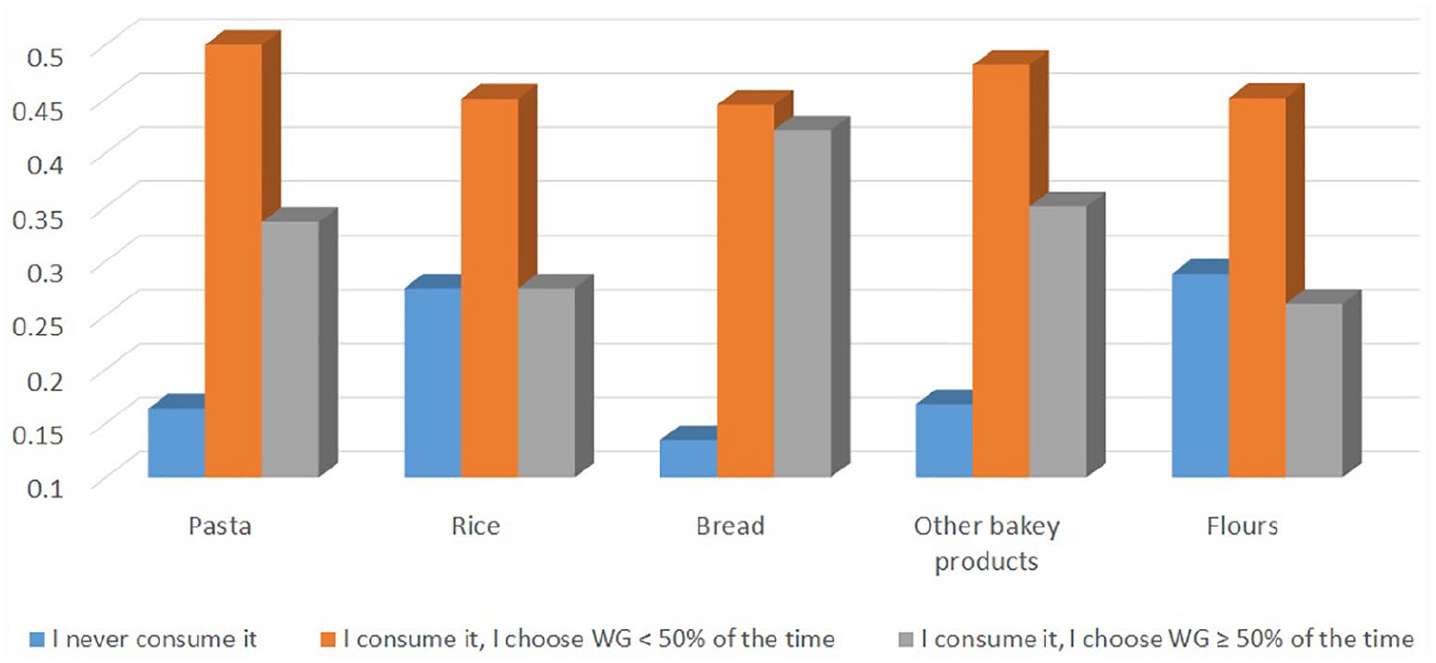
Whole grain choices according to food categories.
Cluster analysis
We performed a cluster analysis to classify respondents according to their pattern of attitudes towards whole grains. Three clusters were identified (Table 4 and Figure 3). We included in the analysis only respondents with a perception profile for all six dimensions (624 out of 1,014 respondents comprised the subset for the cluster analysis).
Socio-demographic profiles and attitudes towards whole grains of the three clusters.
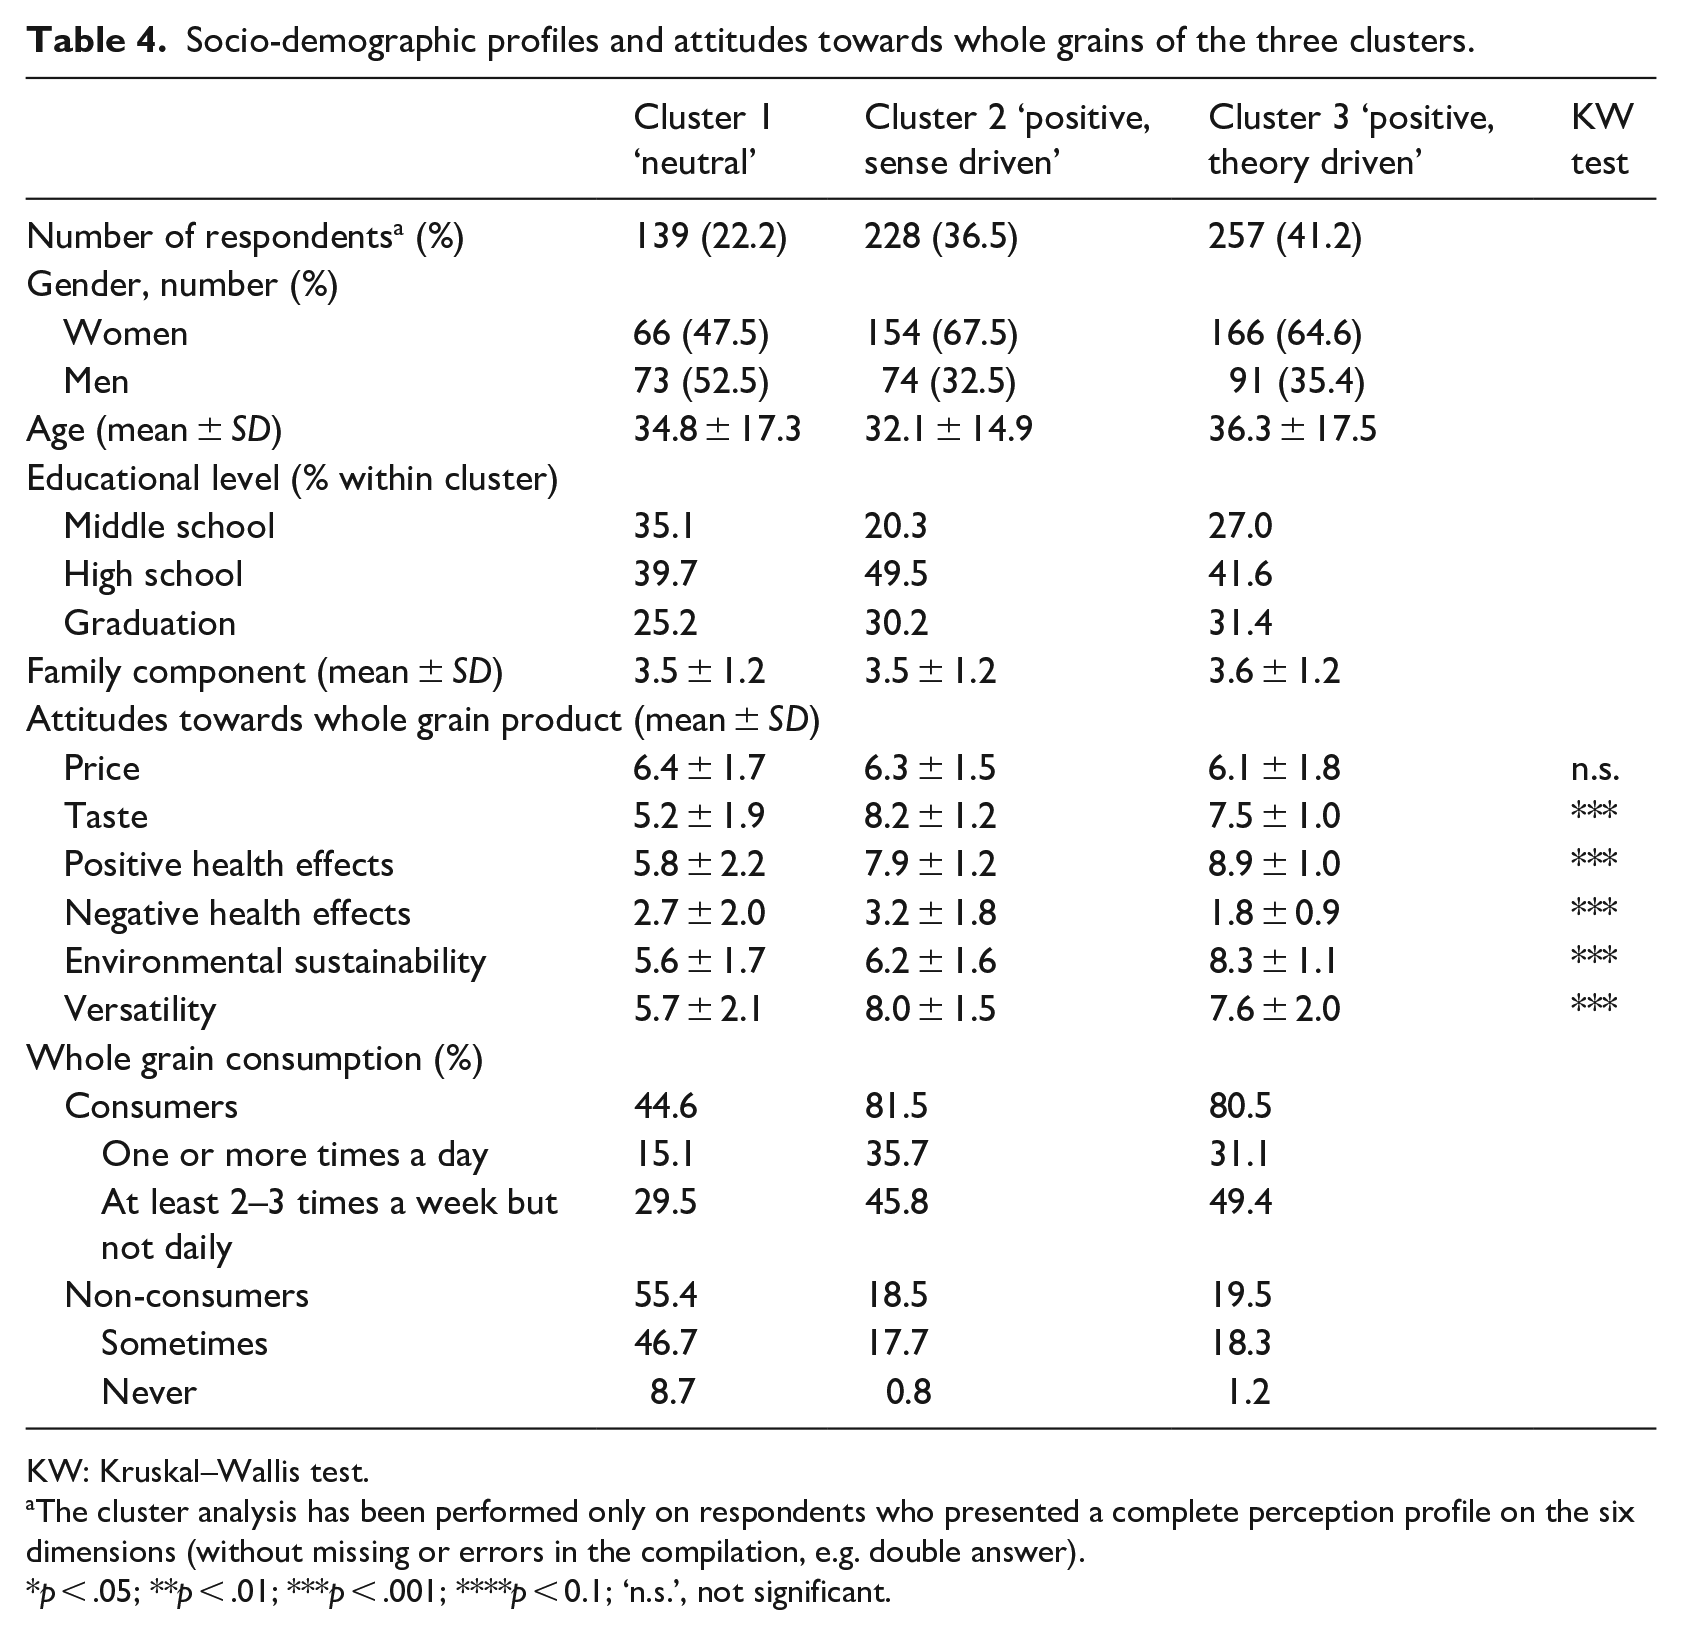
KW: Kruskal–Wallis test.
The cluster analysis has been performed only on respondents who presented a complete perception profile on the six dimensions (without missing or errors in the compilation, e.g. double answer).
p < .05; **p < .01; ***p < .001; ****p < 0.1; ‘n.s.’, not significant.
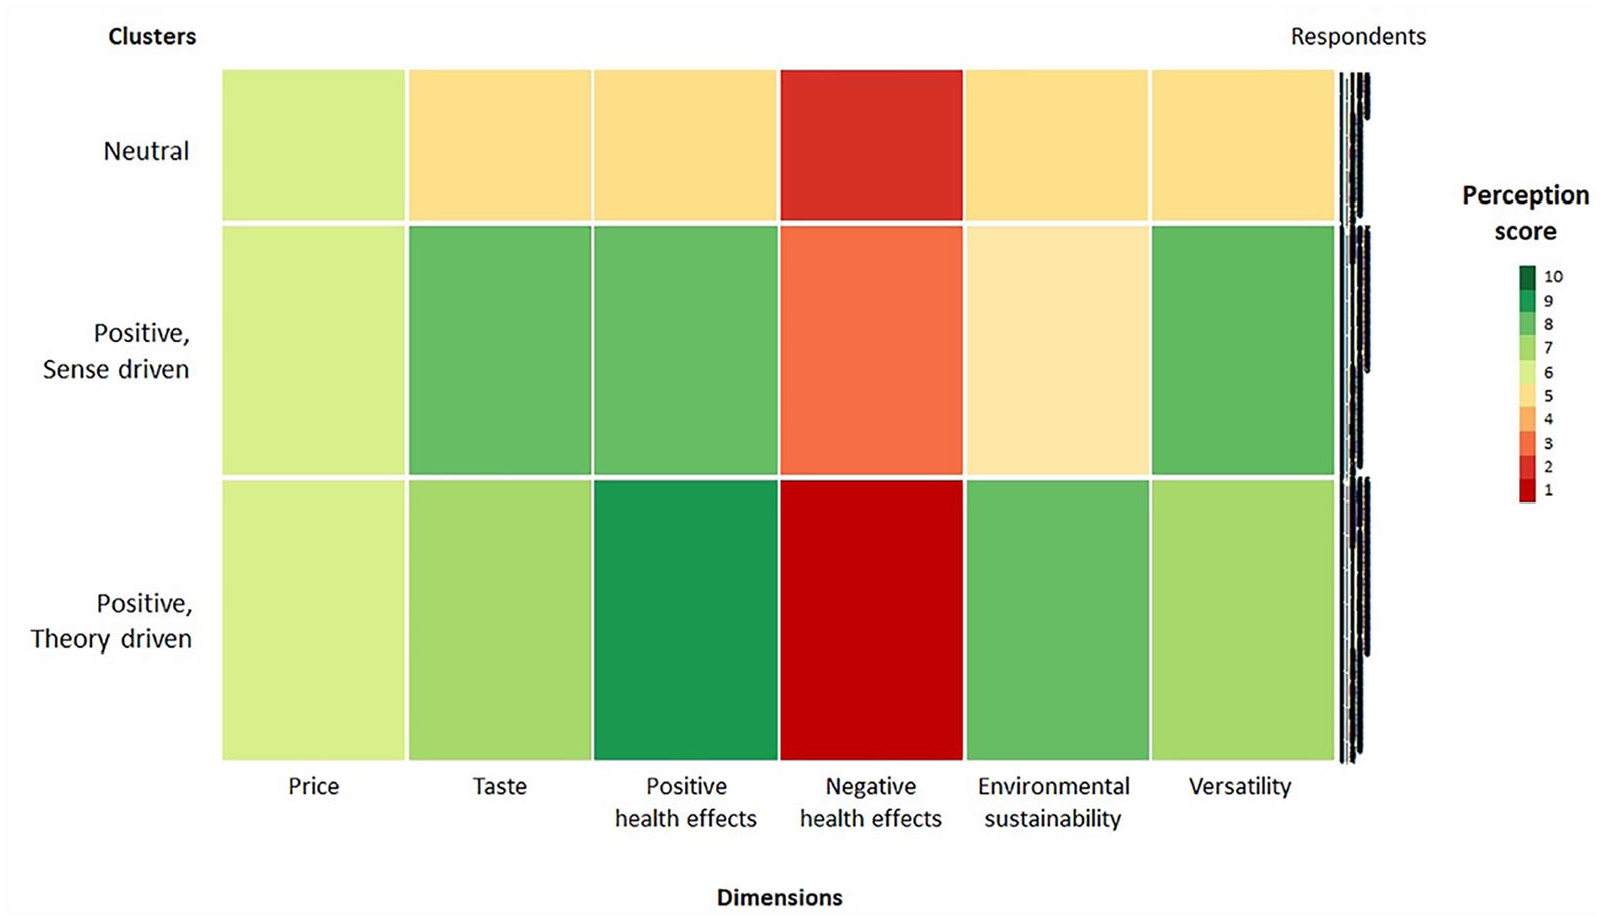
Heatmap of cluster analysis. Respondents are represented by row and grouped by cluster. The mean perception scores within each cluster for each dimension are represented by column: red to orange colours indicate low scores (⩽3), yellow and pale green colours represent intermediate scores (from 4 to 6) and light to dark green are high scores (⩾7).
Respondents in the first cluster (22% of the subset) showed some concern about whole grain price, taste, environmental sustainability, positive health effect and versatility (the mean scores for these dimensions were between 5 and 6) despite recognising a low level of negative health effects. In line with these characteristics, we named this cluster ‘neutral’ (mean 2.7).
Subjects belonging to the second cluster (37% of the subset) had an overall generally positive perception about whole grains. They considered whole grain food products neither convenient nor expensive and saw them as characterised by positive health and environmental effects. Their perceptions of taste and versatility showed the highest scores among the three clusters. We therefore named this cluster ‘positive, sense driven’.
The respondents in the third cluster (41% of the subset) had an overall generally positive attitude towards whole grain products. In comparison to the second cluster, they reported higher levels of positive health effects and environmental sustainability and lower levels of taste and versatility. As with the other clusters, price was considered neither too high nor too cheap. This cluster was given the name ‘positive, theory driven’.
The neutral cluster comprised slightly more men than women (52% vs 48%, respectively) and contained the highest proportion of people with an education level lower than a secondary school certificate. The positive, sense-driven cluster was mainly composed of women (68%), 50% of the individuals within this cluster had completed upper secondary education and 30% had a university degree. The positive, theory-driven cluster contained the highest percentage of respondents (41%) and women within it (65%). No significant differences were detected in relation to family composition and age between the clusters. Consumers were more prevalent in the second and third clusters, with the highest prevalence of daily whole grain consumers being in the positive, sense-driven cluster (35.7% of the sample).
Discussion
The estimated daily intake of whole grains is lower than the optimal level, especially in the USA and Europe (Ruggiero et al., 2019; Sette et al., 2017). Many factors influence the low consumption of whole grains: undesirable taste, the perception of whole grains being more expensive and less versatile than refined ones, limited time/knowledge to cook whole grain products, and difficulty identifying real whole grain food products (Burgess-Champoux et al., 2006; Kantor et al., 2001; MacNab et al., 2017). Several studies have observed a positive relationship between nutrition knowledge and healthy eating behaviours. Therefore, a lack of understanding of the health benefits and limited awareness of the recommended intakes of whole grains are important limiting factors in increasing consumers’ whole grain choice (Barrett et al., 2020; Królak et al., 2017; Tuuri et al., 2016). A positive personal attitude towards whole grain consumption could be an important starting point when it comes to increasing whole grain intake (Aggarwal et al., 2014; Shepherd, 2005).
In this study, we observed an overall positive perception towards whole grain products, especially in relation to positive health effects, versatility and taste (with a median value for these three dimensions of 8 in a 10-point Likert-type scale). Age, gender and educational level strongly influenced whole grain perceptions, especially with respect to taste perception and positive health effects. In line with previous studies (Hearty et al., 2007; Królak et al., 2017), we observed that women with a higher educational level reported higher scores in many whole grain dimensions (taste, positive health effects, absence of negative health effect, environmental sustainability and versatility), in comparison to men with an education level lower than a secondary school certificate. Interestingly, in our study, socio-demographic characteristics do not affect price perception in contrast to previous research (Tuuri et al., 2016).
Our findings showed that respondents regularly (i.e. twice or more a week) consuming whole grain products comprised 66% of the whole sample, with bread and pasta being the most frequently consumed whole grain products. Only 11% of the respondents consumed whole grain foods every day, as recommended by Italian dietary guidelines (CREA, 2019). These results are partially in line with previous studies conducted in Italy. Ruggiero et al. reported a regular consumption of whole grain products (defined as more than once a week) by 27.2% of adult population, with whole grain bread representing the major whole grain source of food (Ruggiero et al., 2019). Sette et al. reported similar findings: Overall, 24% of their sample consumed whole grain products over a reporting period of three consecutive days, with whole grain bread comprising 46% of whole grain intake among adults (Sette et al., 2017). In comparing these results, some methodological differences should be recognised, namely different methods of whole grain intake estimation (our questionnaire vs a 24-h dietary recall interview vs a 3-day food diary); sample size (1,014; 9,422 and 3,323 subjects, respectively) and locality (the north of Italy vs nationwide).
Classifying participants in relation to whole grain consumption frequency (Table 2) allowed us to confirm that men tend to consume fewer whole grain food products than women, probably due to reduced taste acceptability and a low perception of positive health benefits and versatility (Table 1). Other authors have observed the same differences between men and women in relation to attitudes, interest in nutrition and eating behaviours (Królak et al., 2017; Wardle et al., 2004; Wronka et al., 2013). With respect to educational level, consumers had a higher percentage of university graduates (32%) and a lower percentage of people with an education level lower than a secondary school certificate (22%) than non-consumers (25% and 37%, respectively), confirming, as in previous studies, the positive relationship between school education and healthy eating habits (Bonaccio et al., 2013; Ruggiero et al., 2019).
The classification of respondents into clusters according to their attitude patterns is the point of originality of our study. The identified patterns of attitudes towards whole grains could support the future targeting of nutrition education programmes (NEPs) in Italy. Robust socio-psychological theory clearly shows that attitudes, classified as positive, negative and neutral, affect health behaviours (Crisp and Turner, 2014; Madigan et al., 2014). In our analysis, while we did not identify a clearly negative cluster of attitudes, we found two positive and one neutral attitude patterns. The two larger clusters were the positive ones (comprising 36.5% and 41.2% of the cluster subset). However, only 33% of the respondents within these clusters consumed whole grains daily. The cluster containing the highest prevalence of daily whole grain consumers was the positive, sense-driven one. Within this cluster, taste and versatility scores were the highest, reflecting the fact that these two dimensions are strong predictors of daily food choice, as confirmed by other recent research (Doma et al., 2019). Taste is closely related to the emotional experience of food, while versatility is related to cooking skills and ability. Food industry and manufacturers therefore face the challenge of formulating products high in whole grain content while maintaining appeal in terms of taste, texture and flavour (Schaffer-Lequart et al., 2017). Two previous studies, among young adults (Larson et al., 2010) and older people (MacNab et al., 2017), have signalled the importance of providing the opportunity to taste whole grain products as part of a NEP so as to overcome barriers about taste. It would be useful to include technical information about whole grain processing and cooking in future NEPs. Importantly, in this study, the positive, theory-driven cluster had the highest awareness about whole grains’ health effects and environmental sustainability but had lower mean scores on taste and versatility than the positive, sense-driven cluster. These data confirm the strength of perceptions of taste and versatility in driving whole grain choice.
Our results provide insight into whole grain product attitudes and frequency consumption, which could help improve future NEPs in which taste and versatility dimensions need to be reinforced.
Limitations and strengths
Like all research, our study has some limitations and strengths. One of the main limitations was its focus on just one area in the country (Brescia). The descriptive analysis of respondents’ socio-demographic characteristics showed that gender and educational levels were adequately represented. Another limitation derived from the fact that our questionnaire did not provide a direct estimate of whole grain consumption in terms of servings or grammes per day. Only a preliminary estimate of frequency of consumption was obtained. A significant point of originality in our study was the assessment methodology used. The newly developed questionnaire allowed us to investigate attitudes towards whole grains and use them to classify respondents. The questionnaire was brief, facilitating timely completion, was self-administered and did not require extensive interviewer training. Thanks to these characteristics, it offers a low-cost tool that can be effectively used in larger sample surveys.
Conclusion
This study explored attitudes towards whole grains and related them to whole grain intake and socio-demographic characteristics. Despite a generally positive attitude to whole grain consumption among respondents, deeper analysis revealed the presence of three different attitude patterns: neutral, positive sense-driven and positive theory-driven. Taking these different clusters into account may help with future nutrition education planning to change eating behaviour through correct nutritional knowledge (improving awareness of whole grains’ health effects and environmental sustainability) and a positive direct experience (in order to change taste and versatility perception).
Footnotes
Acknowledgements
We thank Giuseppe Bertoli and Dario Mariotti for their support in the development of the survey. We also acknowledge the assistance provided by Marica Scala, Roberta Cò, Andrea Macetti, Sara Coffinardi and students in the 2017 Matriculation Cohort of the Dietistics Degree Course of the University of Brescia in the administration of the questionnaires.
Funding
The author(s) received no financial support for the research, authorship, and/or publication of this article.