
Abstract
Objective:
Our objective is to provide thumb reach envelopes to help guide the placement of controls on handheld devices and to provide useful methods to gather and analyze thumb reach data.
Background:
With the proliferation of handheld, interactive devices, such as cameras, mobile phones, game systems, and remote controls, human factors professionals involved in designing these products need data to help guide the placement of controls. Previous studies have not provided adequate two-dimensional thumb reach envelopes for the primary control surfaces of handheld devices.
Method:
A total of 90 participants in three groups (adolescent females, young mothers, and young fathers) placed representations of primary controls in preferred locations on a device model and “painted” their individual reach envelopes on a touch-screen device running a paint application.
Results:
We present two-dimensional thumb reach envelopes on the primary control surface for handheld devices. The primary reach zone for adolescent females is slightly larger and more circular than that of the adults. The preferred location for controls matches the primary thumb reach zones fairly well.
Conclusion:
The reach envelopes presented are the first of their kind and are likely to be useful to human factors professionals. The method used to obtain the data may also be useful.
Application:
The thumb reach envelopes should be applicable to the design of many handheld, interactive devices with dimensions similar to the models used in this study. The method presented allows design teams to collect and analyze thumb reach data quickly and inexpensively for different target user populations or product dimensions.
Keywords
Introduction
In a collaborative effort between industrial design and human factors professionals, we set out to design a pocket video camera intended to be held with one hand and operated primarily by the user’s thumb. The camera shape was to be rectangular, to use hardware buttons as opposed to a touch screen (software buttons), and to be held in the palm of the hand so that the vertically oriented device was positioned with the long axis of the device nearly perpendicular to the fingers. This design enables the fingers to grasp the device while permitting a considerable amount of interaction to occur with the thumb (Figure 1). Such a form factor is common in consumer electronic devices, such as cellular telephones, pocket video cameras, MP3 players, and other handheld devices.
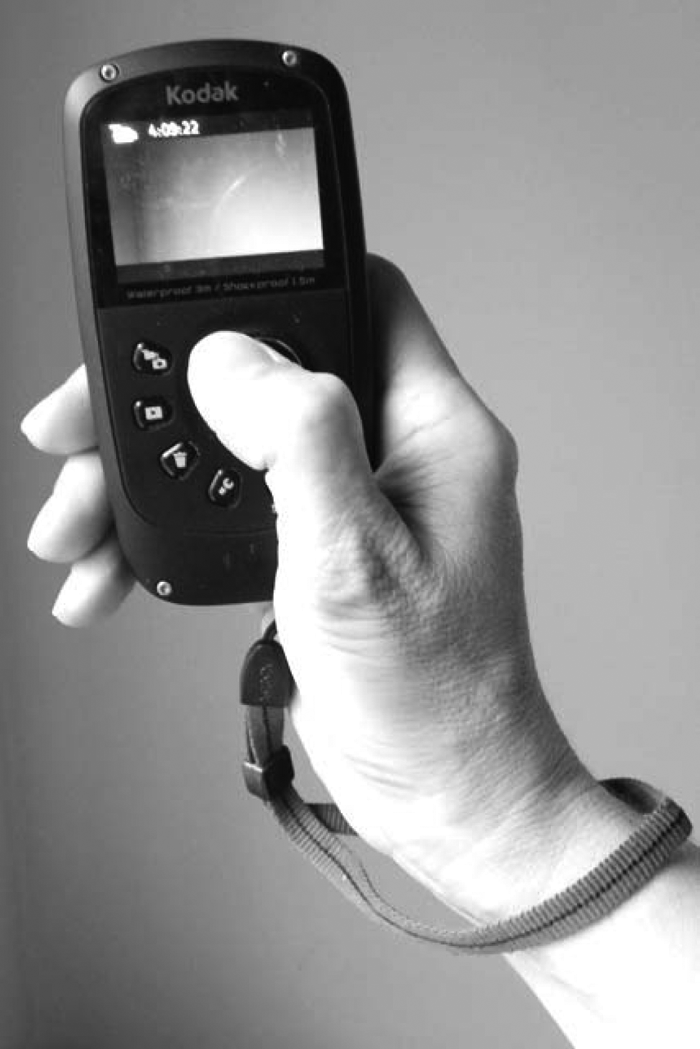
An example of a product designed for one-handed use and controlled primarily by the thumb.
To ensure a comfortable reach by users who vary in size, we hoped to rely on existing anthropometric data to help guide placement of the controls. We conducted an extensive literature review and found more than 50 sources containing anthropometric data for the hand and fingers (see, e.g., Blackwell et al., 2002; Buchholz & Armstrong, 1991; Garrett, 1970; Gilbert, Hahn, Gilmore, & Schurman, 1988; Gordon, 1996; Greiner, 1991; Webb Associates, 1978; White, 1980). Our marketing organization had previously identified three specific target user populations for our design: adolescent females, adult females, and adult males. The adults were specified further as parents of young children and all three groups as North American. We found many anthropometric studies focused on adult males and adult females, but only Snyder et al. (1977) addressed the adolescent population.
Unfortunately, all but a few of the sources that we found presented only static or structural anthropometric measures between anatomical landmarks with the hand in a rigid, unnatural posture (Pheasant, 1986). There are a number of sources of dynamic or functional anthropometry representing larger-scale reach envelopes that take into account the recruitment of multiple joints and limb segments for the entire arm or leg (see, e.g., Eastman Kodak Company, 1986). Although these whole-limb reach envelopes are useful when designing workstations or cockpits, they are of little help when designing smaller, handheld devices.
Our review of the literature turned up only a few studies related to the dynamic or functional anthropometry of thumb reach. The relatively limited data related to thumb reach surprised us, given the indisputable prevalence of handheld electronic devices that are primarily operated with the thumb. The increased use of such devices has resulted in ergonomic problems (Smith, Carayon, & Cohen, 2003), including tendonitis from overuse (Brasington, 1990). Despite these issues, we found very few standards or guidelines for the design of devices that rely on thumb input (Zingale, Ahlstrom, & Kudrick, 2005).
Gilbert et al. (1988) collected data on 105 participants in an effort to determine the optimal placement of thumb-operated buttons for a large handheld instructional device. They measured the maximum angular displacement and reach of the thumb on a control surface. The results helped them establish a set of design guidelines for angular placement of the thumb and an acceptable range of movement. Gilbert et al. studied thumb movements on a much larger device (30.72 cm × 17.92 cm × 7.68 cm) compared with the device we were designing for one-handed use. As a result, grip posture is dramatically different and their data had limited relevance to our design challenges. In another study, Zhang, Braido, Lee, Hefner, and Redden (2005) collected data for three-dimensional thumb range of motion. Zhang et al. instructed participants to keep their two distal joints (metacarpophalangeal and interphalangeal) of their thumbs straight and stiff during their dynamic mapping of the range of motion. This method makes their results of little relevance to most handheld products, whereby users bend the thumb joints to grip and operate the device.
A few recent studies have attempted to define two-dimensional thumb reach envelopes and preferred control locations on the primary control surface of handheld devices (Im, Cho, Park, Jung, & Park, 2010; Karlson, Benderson, & Contreras-Vidal, 2006; Kim & Jung, 2010). Karlson and colleagues (2006) tracked the trajectory of the thumb as participants (all right-handed) made movements between discrete touch targets on handheld devices of various sizes. In general, participants made faster movements between pairs of targets that required movements along a northeast-southwest line (in compass terminology) and slower movements between targets requiring movements along a northwest-southeast line. These differences in movement speed correlated with participants’ ratings of movement ease and difficulty in that the faster movements were also considered easier to accomplish.
In both the Im et al. (2010) and Kim and Jung (2010) studies, the number of participants was relatively small, 15 and 21, respectively, and both represent an adult, almost entirely male, Korean population. They based location preferences on predefined target regions and subsequent user-specified discomfort ratings rather than a more conventional definition of a reach envelope. Although discomfort is an interesting variable to plot, it is more useful for product designers to know what percentage of the user population will be accommodated comfortably by certain design decisions.
The results of all these studies certainly have utility in terms of providing some basic guidelines for design. However, as we began the development of a pocket-size video camera intended for one-hand operation (primarily with the thumb), we found insufficient data for our target demographic groups to guide our design. Therefore, we conducted our own study for collecting data to guide the placement of controls. To do so, we employed two methods. First, we used a version of the “Mr. Potato Head” method (Green, Paelke, & Boreczky, 1992) to obtain participants’ preferred locations for primary controls. Second, to determine a direct and natural, two-dimensional thumb reach envelope, we used a handheld touch screen and a paint application to record the complete area reachable by each participant’s thumb.
Method
Participants
A total of 90 participants (35 adolescent females, 35 young mothers, 20 young fathers) from southern Maryland area took part in the study. All of the participants had taken a least 50 pictures and two videos in the past year (using any type of camera, including cameras built into cell phones). The adolescent females were required to be 14 to 19 years old, to provide signed parental consent, and to have one of their parents accompany them to the study. The young mothers and young fathers were required to be 25 to 43 years old and to have at least one child younger than 18 years living at home. The participants had a mean age in years of 16 (SD = 1.3; range = 14 to 18) in the adolescent female group, 33 (SD = 4.1; range = 25 to 39) in the young mother group, and 34 (SD = 4.8; range = 26 to 39) in the young father group. We recorded, but did not screen for, dominant hand and found that 30 of the 35 adolescent females, 34 of the 35 young mothers, and 19 of the 20 young fathers were right-handed.
Materials and Equipment
Control location (Mr. Potato Head)
We used a physical model that approximated the dimensions and weight of the video camera that we were designing and associated magnetic control representations to examine the participants’ preferred locations for primary controls (Figure 2). The functions of the controls included record and navigation (typically integrated into a single square control with four-way directional surround plus a concentric center Record button), a control to review pictures and/or videos previously taken, and a control to delete pictures and/or videos previously taken. Participants selected among various types and sizes of controls. Depending on their selections, participants placed either three or four magnetic controls on the model. The user preference data for control type and size are not presented in this article.
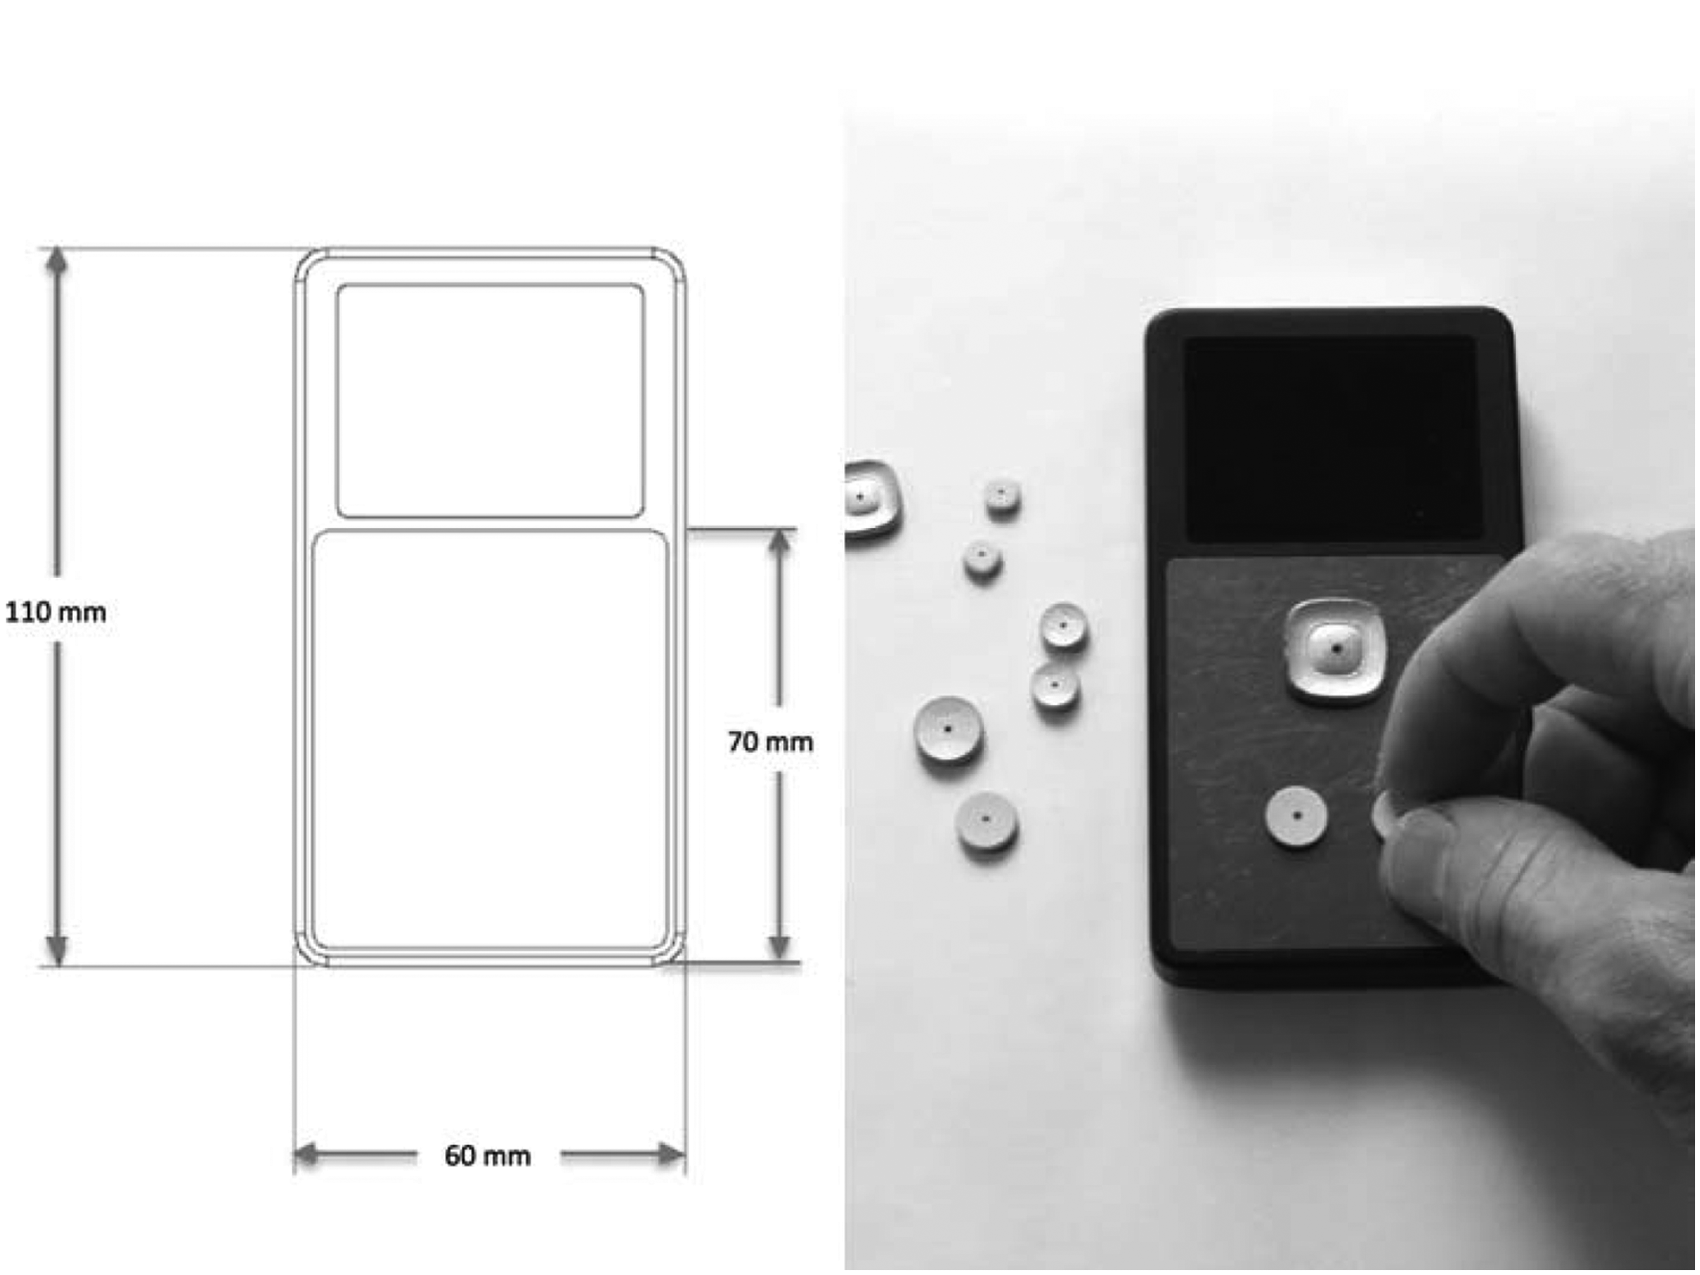
Dimensions of the physical camera model used in the Mr. Potato Head study (left). Note that only the lower area (60 mm × 70 mm) was available for control placement. Model in use for control placement task (right).
Thumb reach envelope
A handheld touch-screen device (iPod Touch, second generation; Apple, Inc., Cupertino, CA) encased in a custom removable housing to simulate the intended overall dimensions of a vertically oriented video camera served as the input device for capturing the thumb reach envelope data. On the back of the iPod Touch, a small square was attached to simulate the approximate location of the intended camera lens (Figure 3). A painting application, Sketchbook Mobile (Autodesk, Inc., San Rafael, CA) ran on the device to record the thumb reach envelopes (Figure 4). The program was set to use the maximum fixed-width brush size (approximately 6.36 mm in width).
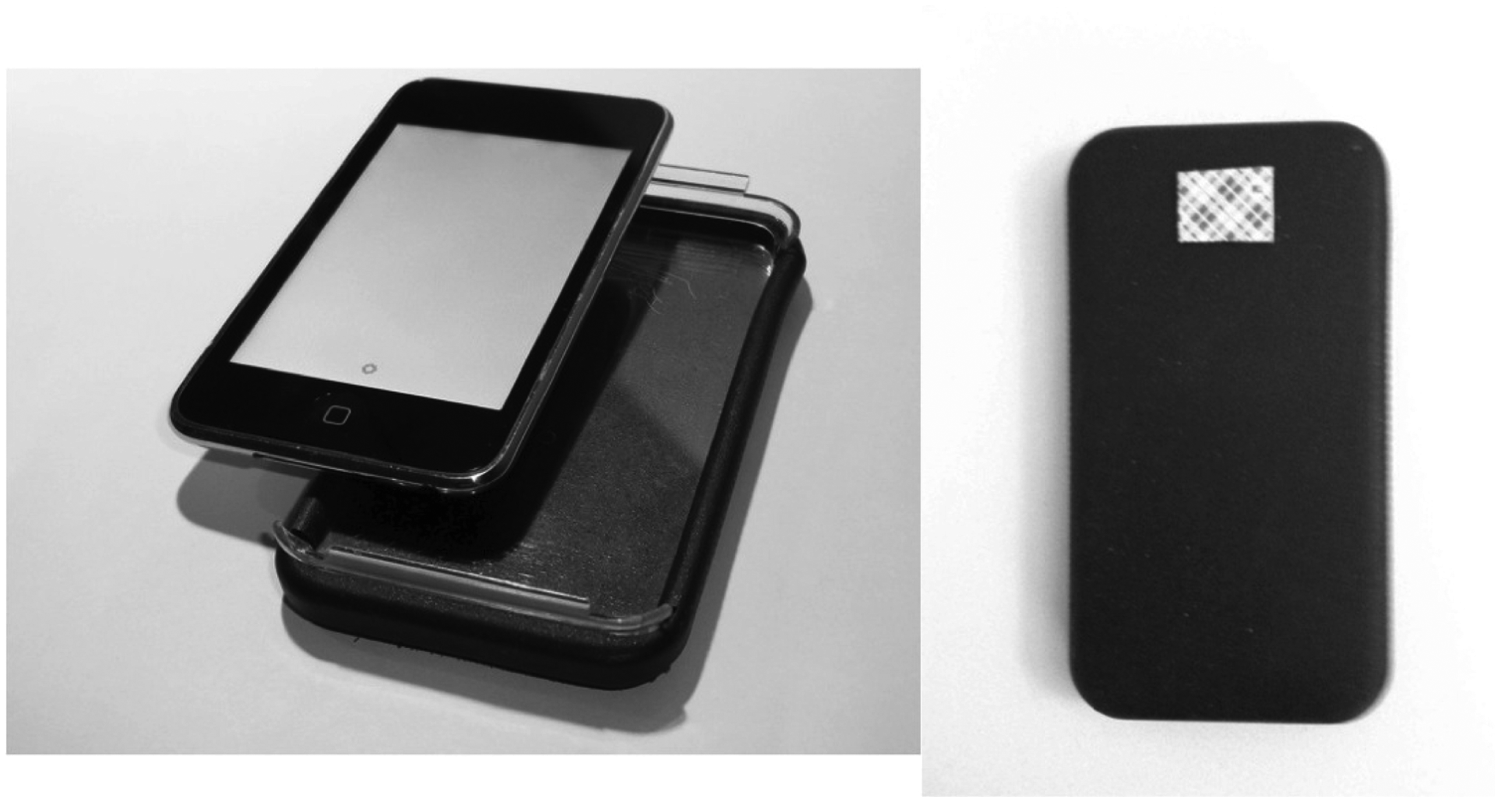
Handheld touch screen and housing (left) and simulated lens on the back of housing (right).
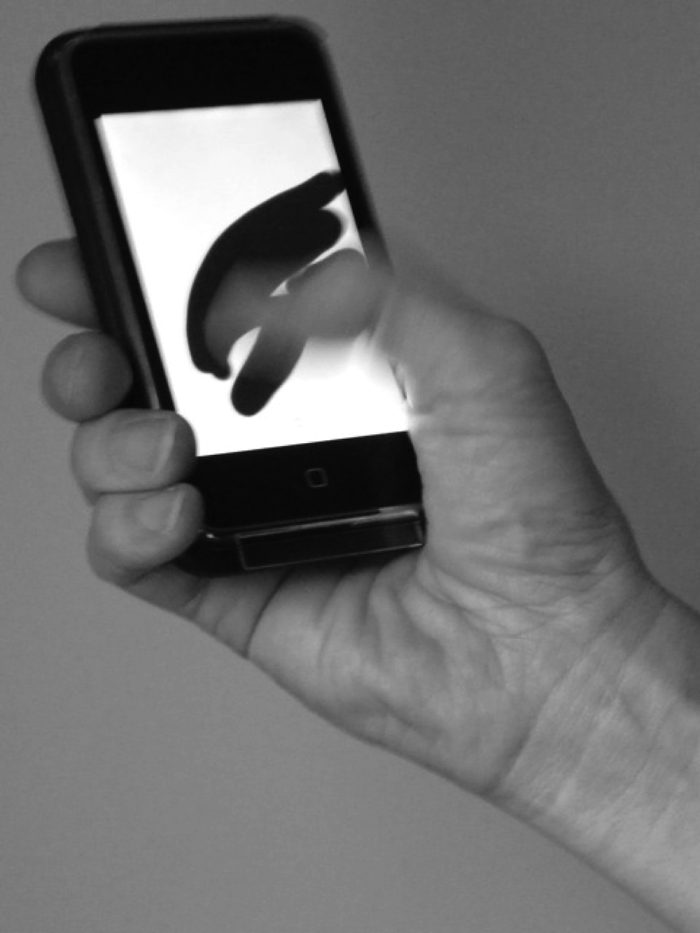
Touch screen in the housing with paint application running to record a thumb reach plot for one participant.
Procedure
After arrival, the participant received a brief overview of the study, signed a consent form, and completed a demographic questionnaire. The experimenter measured several anthropometric hand dimensions (e.g., hand width, thumb length) of the participant’s dominant hand using a ruler and caliper. The participant was then escorted to the Mr. Potato Head station and was presented with the camera model and magnetized parts representing the primary controls that would be found on a typical video camera. The participants were told that they would have the opportunity to “design” their own cameras, emphasizing the idea that they should design cameras for themselves and not consider the preferences of others. For most types of controls, the participant was given a choice of a few sizes and was asked to place the control on the camera model in his or her preferred location. All the controls were restricted to the lower portion of the side that faced the participant (the same side as the simulated display). The experimenter later used digital calipers to measure from the model’s bottom and right edges to the center of each control that the participant had placed.
At the next station, the participant received the handheld touch-screen device with the drawing application running. The participant was instructed to hold the touch-screen device as if to capture a video recording (as with either a vertically oriented video camera or a cell phone), “securely but comfortably,” with the dominant hand. The experimenter then asked the participant to swipe his or her thumb across the screen, shading any area that he or she could reach comfortably. It was also stated that when the participant had a secure and comfortable grip, he or she was not to shift or change hand position in an effort to reach more of the screen. The participant completed this task twice, and we saved the file related to each effort for later analysis (each file was treated as a distinct data point).
Results
Basic Hand Anthropometry
A one-way ANOVA for hand length showed a significant difference between demographic groups, F(2, 87) = 45.7, p < .001. Post hoc tests indicated that the hand length of young fathers was significantly larger (M = 192 mm, SD = 7.1 mm) than the hand length of the young mothers (M = 174 mm, SD = 7.1 mm), and the hand length of the young mothers was significantly larger than the hand length of adolescent females (M = 167 mm, SD = 12 mm). A one-way ANOVA for thumb length also indicated a significant difference between demographic groups, F(2, 87) = 45.7, p < .001. Post hoc tests indicated that the thumb length of young fathers was larger (M = 72.8 mm, SD = 17 mm) than that of both young mothers (M = 60.6 mm, SD = 5.3 mm) and adolescent females (M = 56.1 mm, SD = 6.4 mm), whereas adult and adolescent females showed no significant difference. These values are similar to those found in large-scale anthropometric surveys (Blackwell et al., 2002; Garrett, 1970; Greiner, 1991).
Control Location
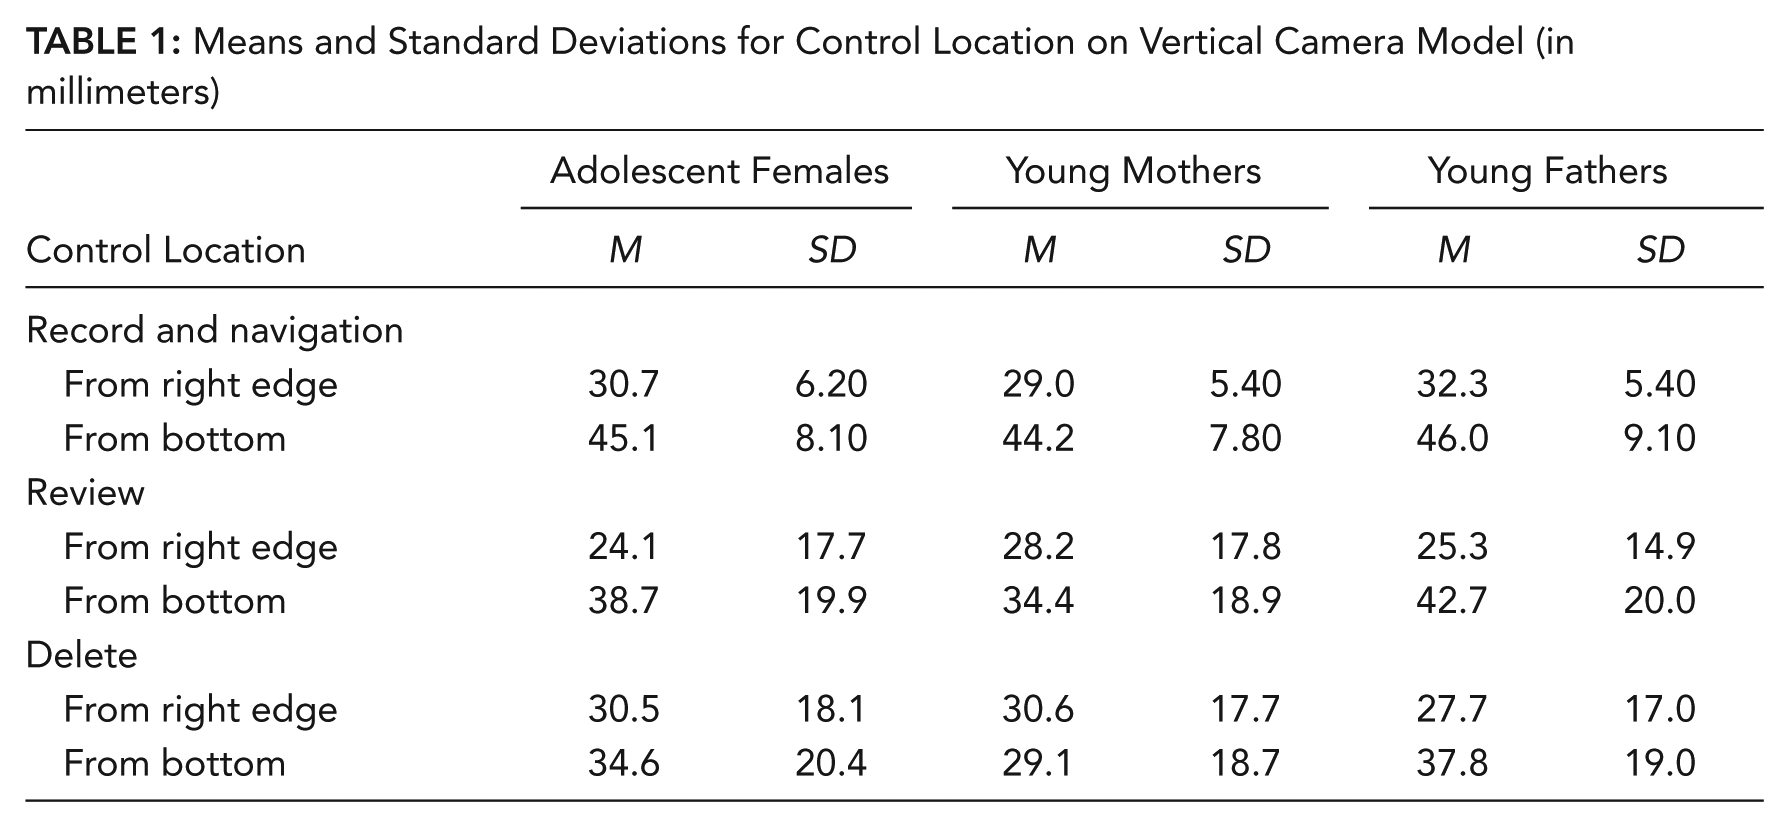
A one-way ANOVA was conducted to examine differences between preferred control locations for each of the demographic groups, measured as the distance from the right and bottom edges of the camera to the center of each control. Results indicated no significant differences (p >.05) for all distances, suggesting that adolescent females, young mothers, and young fathers placed the controls at similar distances from the right and the bottom edges of the camera model (Table 1).
Means and Standard Deviations for Control Location on Vertical Camera Model (in millimeters)
Thumb Reach Envelope
As described in the Method section, participants were asked to use a modified touch screen to swipe their thumbs across the screen, filling in the area that they could reach comfortably. Using these data, two analyses were conducted in an effort to understand the extent of the thumb reach envelope. In the first analysis, we measured the farthest distance the participants could reach with their thumbs. This analysis provided a single, simple dimension (the maximum reachable distance from the bottom-right corner) that could be compared between demographic groups. Overall, maximum thumb reach distance was significantly, but weakly, correlated with thumb length, r(88) = .26, p = .015, indicating that maximum thumb reach distance is generally greater for people with longer thumbs. A one-way ANOVA was conducted to examine differences between the demographic groups regarding maximum thumb reach. The results indicated a significant difference between the groups, F(2, 84) = 7.27, p < .01. Post hoc tests revealed that young mothers (M = 51.8 mm, SD = 7.1 mm) had a significantly smaller maximum thumb reach value than did both adolescent females (M = 58.9 mm, SD = 11.7 mm) and young fathers (M = 61.4 mm, SD = 9.7 mm), whereas adolescent females and young fathers showed no significant difference.
The second analysis was conducted to expand from a single dimension to a two-dimensional representation of the reach envelopes that would be expected to serve as a more useful tool for determining the optimal location for controls on a handheld, thumb-controlled device. Analysis of the thumb reach envelopes involved setting up a grid of 100 cells (5 cells wide and 20 cells tall; each cell 10.2 mm wide and 3.80 mm tall) and superimposing this grid over each participant’s thumb swipe, covering the entire touch screen (Figure 5). If the participant’s swipe covered at least half of a cell (on the basis of the visual judgment of the experimenter), that cell was included in the individual participant’s reach envelope. Both of the participant trials were included in the analysis, although 1 trial for 1 participant was removed because of file corruption, leaving a total of 179 trials. We calculated the percentage of participant trials in each group that reached each cell in the grid and plotted reach envelopes for the separate groups as well as for all the participants combined (Figure 6).
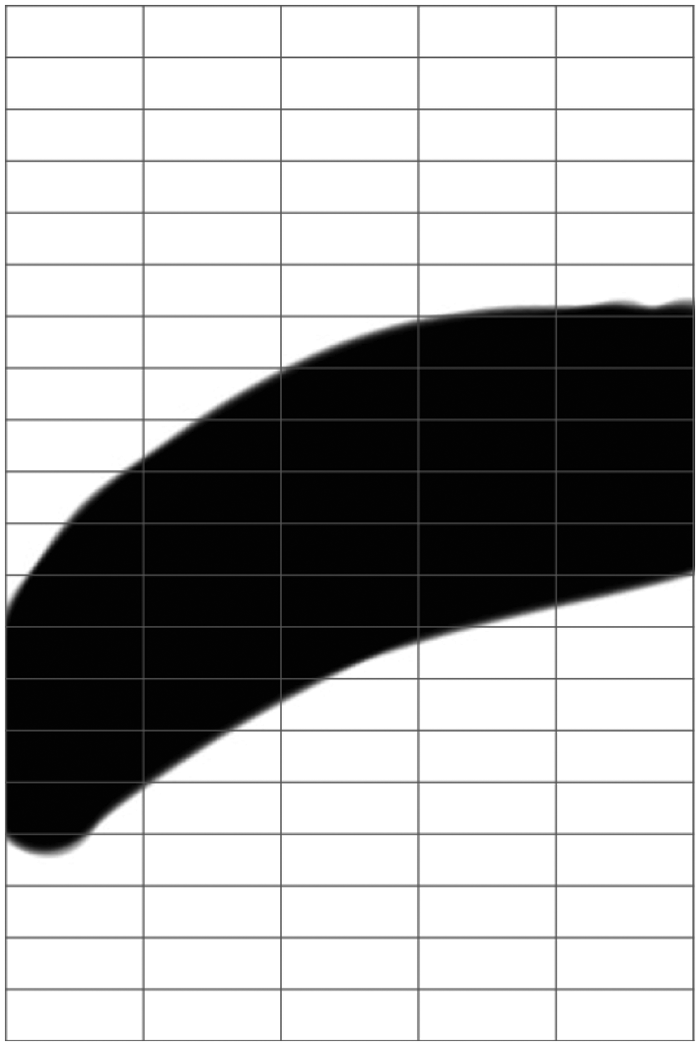
Grid superimposed over participant’s thumb reach plot from one trial.
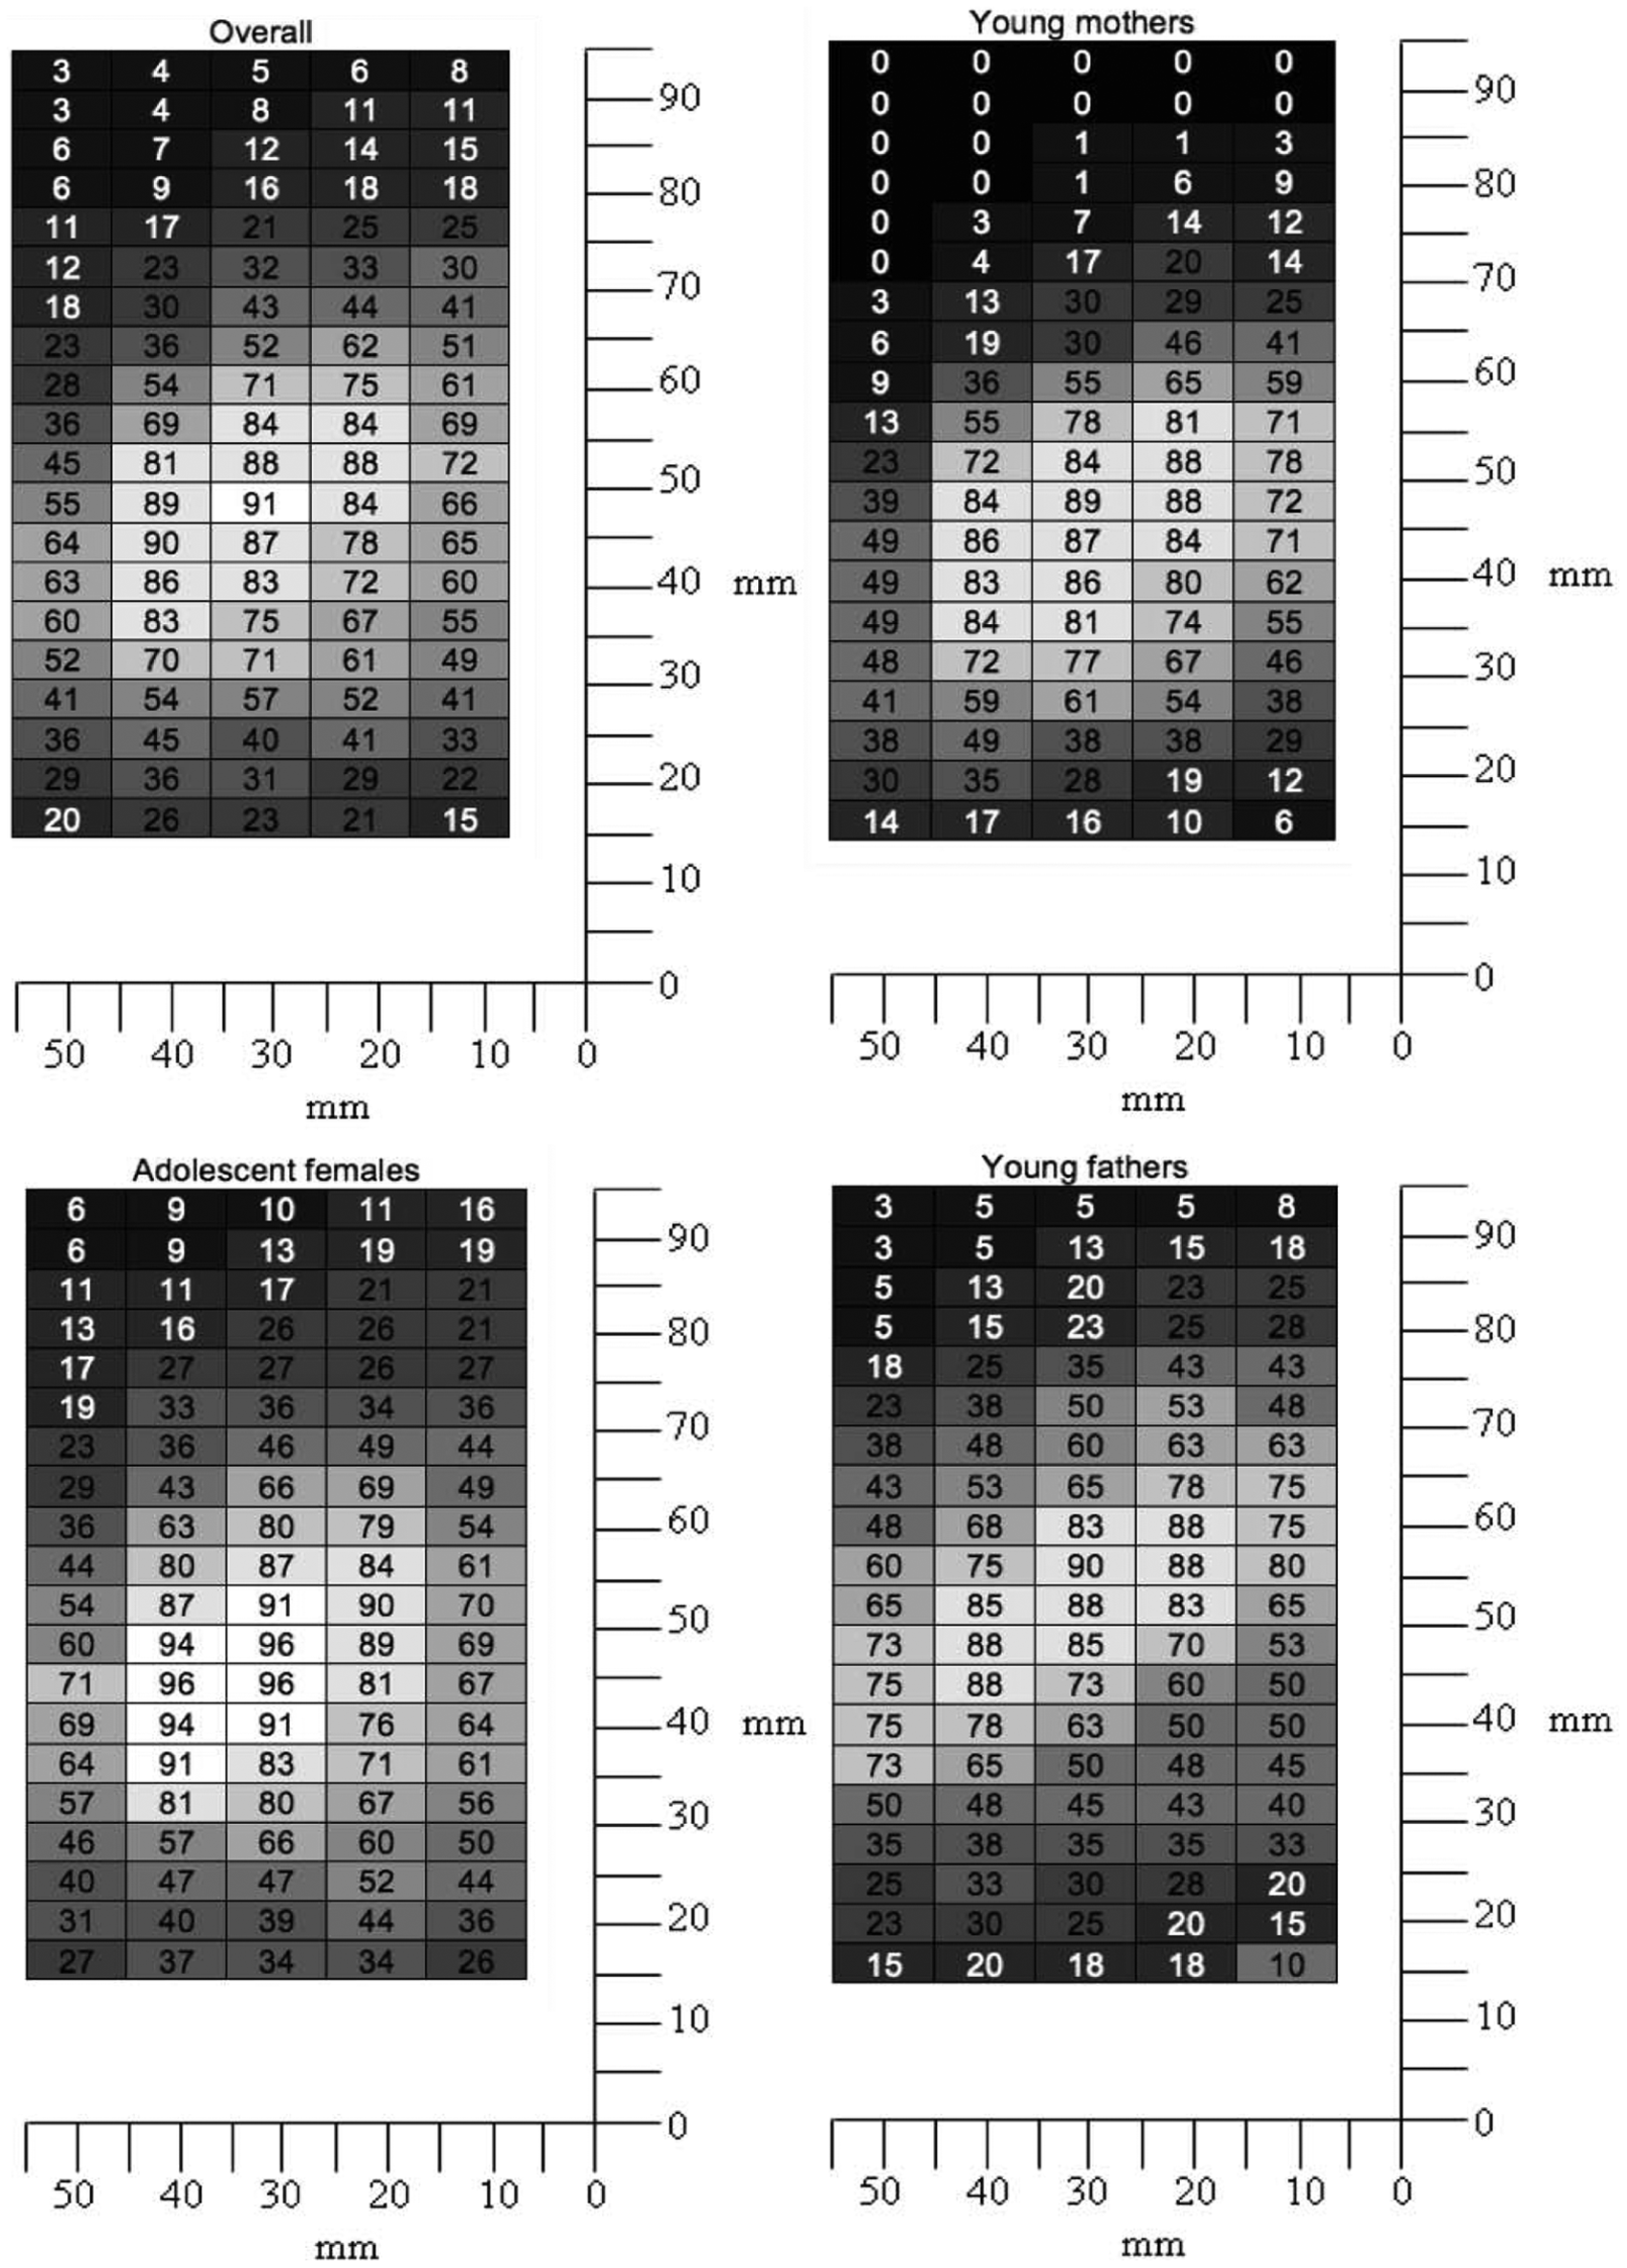
Percentage of participants who could comfortably reach an individual area overall and for each demographic group. Each shade of gray (dark to light) equaled a 10% increase, starting at zero. Scale origin represents bottom-right corner of touch-screen device.
The analysis of the heat maps showed that there was no area that all participants could reach comfortably. An area between 45.6 mm and 49.4 mm from the bottom and between 25.4 mm and 35.5 mm from the right was reached by more than 90% of participants, and an area between 34.2 mm and 56.1 mm from the bottom and 15.2 mm and 45.6 mm from the right was reached by at least 70% of the participants (Figure 6). Visual inspection of the heat maps revealed different shapes to the maps for each of the demographic groups, with the adolescent females displaying an approximately circular shape (equal size vertically and horizontally), the young fathers displaying an elliptical shape (larger horizontally than vertically), and the young mothers somewhere in between. The young mothers also showed the smallest reach envelope, with areas in the upper portion of the device, particularly, the upper-left corner, unreachable by all of the young mothers participants, whereas the adolescent females had the largest reach envelope.
Quantifying these differences, adolescent females showed a concentrated area between about 30.8 mm and 43.2 mm from the bottom and between 15.2 mm and 35.2 mm from the right that more than 90% could reach. Young mothers had no area that 90% or more could reach but had a concentrated area between about 34.2 mm and 57.0 mm from the bottom and between 15.2 mm and 45.6 mm from the right that more than 80% could reach. Finally, young fathers had only a very small area (one cell) that 90% could reach and an area between about 41.8 mm and 60.8 mm from the bottom and between 15.2 mm and 45.6 mm from the right that more than 80% of the participants could reach (Figure 6).
Preferred Control Locations Compared With Reach Envelopes
Figure 7 displays the mean preferred locations for the primary controls from the Mr. Potato Head task overlaid on the heat maps of thumb reach for each demographic group. Generally, all three demographic groups placed the controls vertically relatively close to the location that the heat maps predict, although the adolescent females were slightly above the “sweet spot.” All three groups also generally placed the controls horizontally (from the right edge of the device) close to where the heat maps predict. Comparing the mean location, the young fathers placed the controls in the smallest cluster, whereas adolescent females separated the controls from one another more. Finally, the locations for the young mothers seemed to suggest that they might prefer the controls more closely aligned to the central vertical axis.
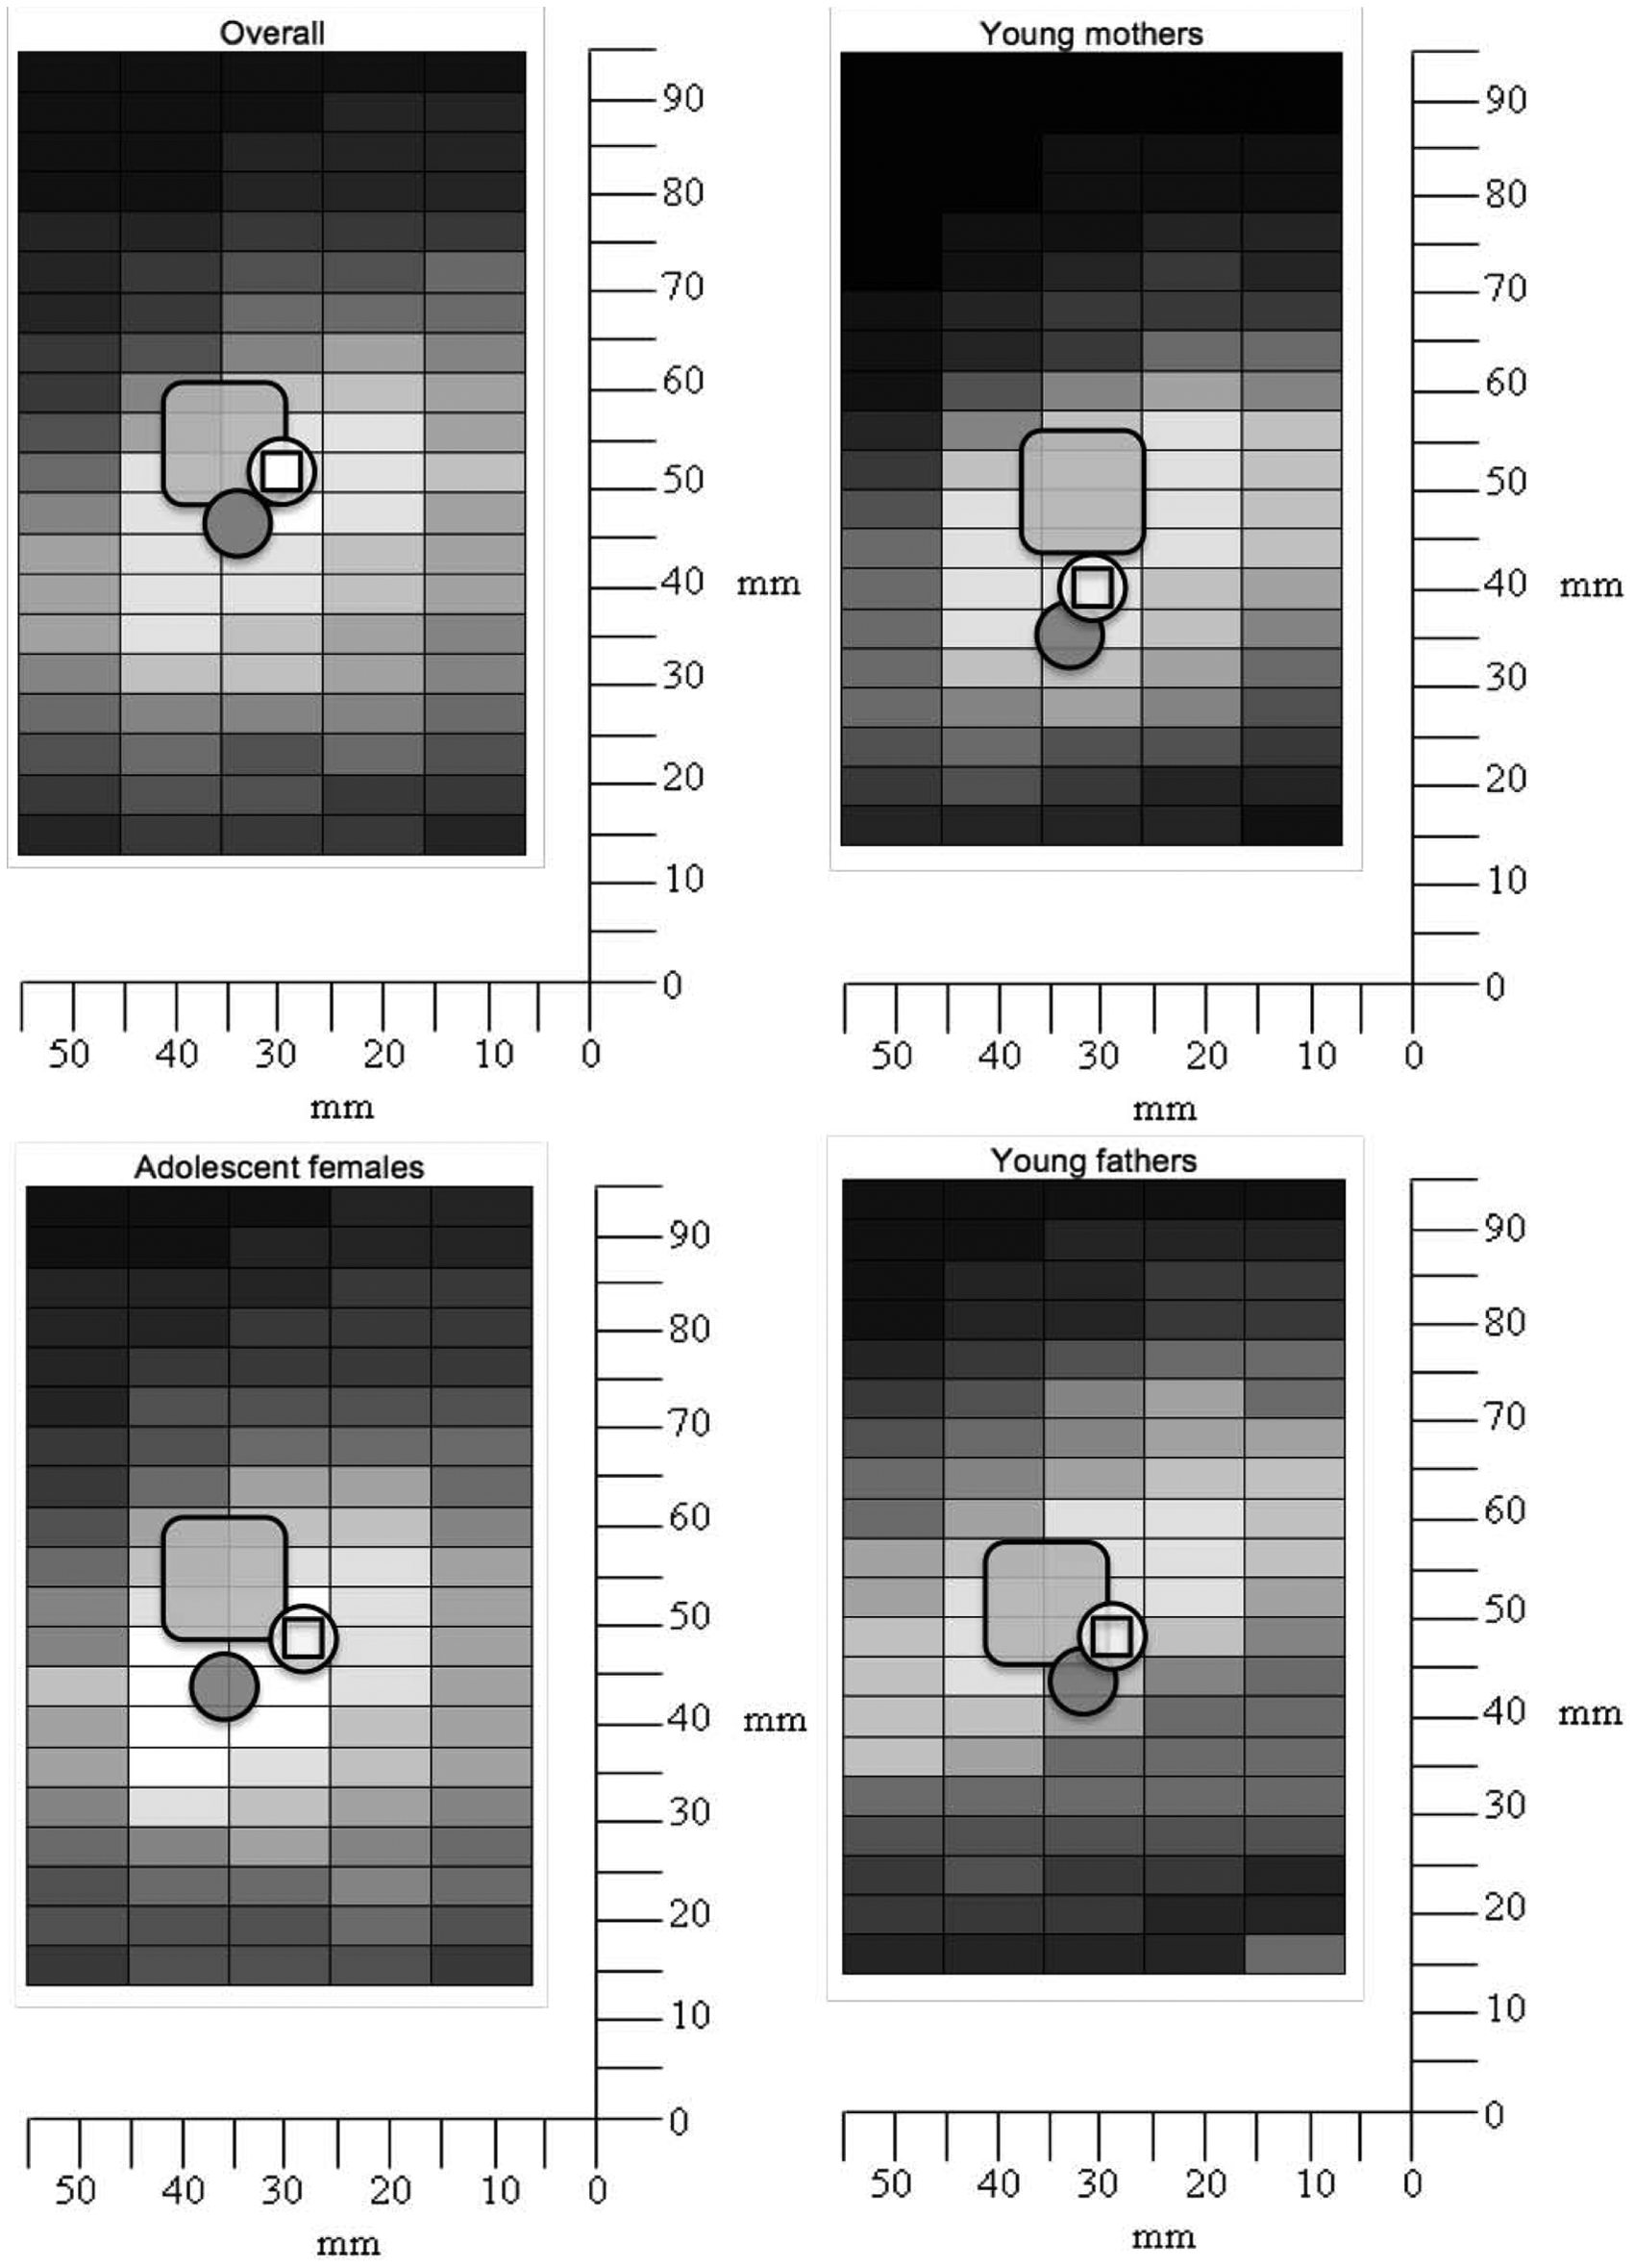
Mean location of the Record/Navigation (large square), Review (circle with square), and Delete (circle without square) controls from the Mr. Potato Head task overlaid on the thumb reach envelope heat maps overall and for each demographic group. As in Figure 6, each shade of gray (dark to light) equaled a 10% increase, starting at zero. Scale origin represents bottom-right corner of touch-screen device.
In certain cases, the controls appear to overlap one another in Figure 7. This overlap is a result of averaging across participants; no individual participant clustered the controls so close that they touched. We show the typical distance between the preferred locations of these primary controls from the Mr. Potato Head task for each group in Figure 8.
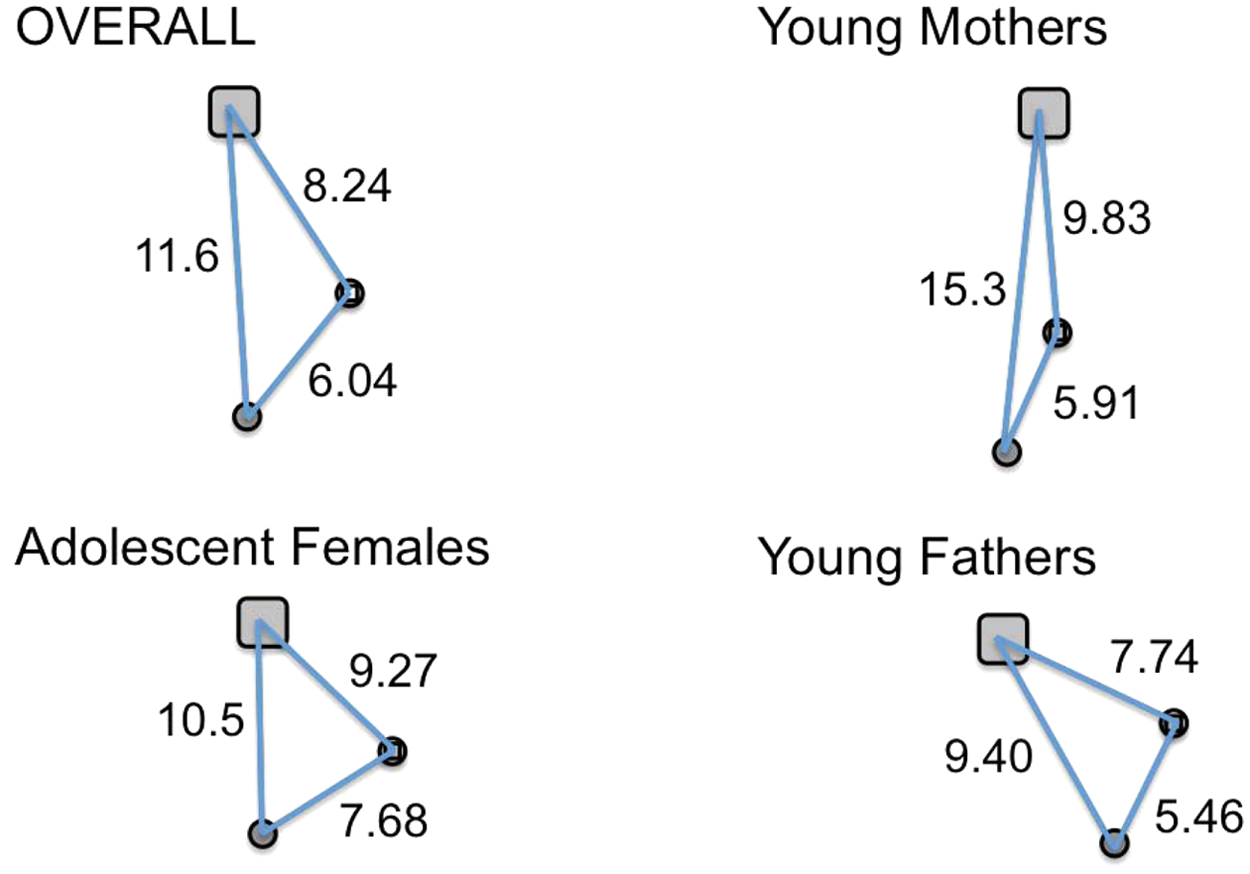
Mean distance (in millimeters) between center of three controls (Record/Navigation, Review, and Delete) used in the Mr. Potato Head task.
Discussion
We gathered thumb reach data for the primary control surface of a device intended for one-handed grip and for control primarily by the thumb. There was no location on the control surface that 100% of the study participants could reach with their thumb when gripping the device as intended. The lightest areas in Figure 6 represent the portions of the control surface that at least 80% of participants reached. This area included an ellipse with its major axis oriented approximately tangential to the long axis of the right thumb in its natural posture when gripping such a device for use. The ellipse covered an area from approximately 15 mm to 46 mm from the right edge and 34 mm to 57 mm from the bottom.
The elliptical shape of our two-dimensional thumb reach envelope and its orientation with the long axis running northeast-southwest seems to fit well with the findings of Karlson et al. (2006), in which they found movements along this axis to be perceived as easier and measurably faster. From a physiological perspective, such movements map closely to abduction and adduction (movement of the thumb toward and away from the palm). Movements in the orthogonal direction (northwest-southeast) would rely on compound movements of retropulsion (lifting of the thumb), flexion, and extension (bending and straightening), requiring coordinated movements involving multiple joints. Additional biomechanical properties of the thumb and hand, such as differences in inertia in different directions of motion, may also contribute to the shape of the reach envelope, as has been shown in arm-reaching experiments (Ghez, Gordon, Ghilardi, & Sainburg, 1994).
When participants placed controls onto a model of such a handheld device in the Mr. Potato Head task, they placed the primary control (Record button in the context of this video camera) slightly above the optimal zone predicted by the reach envelope plots (Figure 7). This result could be attributable to the need to place multiple controls on the device in the Mr. Potato Head study in a more limited space. For this reason, users may have experienced the need to compromise on location to achieve a reasonable spacing between pairs of controls.
There are considerable differences between the iso-discomfort plots of Im et al. (2010) and our reach envelope data in both the shape and location of the recommended area for optimum control placement. The Im et al. data suggest that the users can most comfortably reach an area that is lower and farther to the left on the control surface than our data would indicate. Such differences in results between these two studies can be attributable to a number of factors, including, for example, the thickness of the device (15.5 mm in our study and unspecified by Im et al., 2010), the nature of the task (rating of discomfort vs. comfortable reach), and differences in demographic groups studied. Most importantly, however, is the difference in the method of analyzing and presenting the results. The Im et al. study combines results from one-handed and two-handed use into a single contour plot of iso-discomfort. We believe that this combination of data may lead to the more circular (less elliptical) and more centered position of the primary thumb reach area in the Im et al. study.
In comparing our results to those of Kim and Jung (2010), it is difficult to understand why their computationally derived reach envelopes, although similar in elliptical shape, are oriented such that the long axis of the ellipse runs northwest-southeast, almost opposite to ours. They do not specify which hand participants used to grip the test device in their study, but since they plot their results with an origin in the lower left, it is conceivable that their data represent only left-handed operation.
We see a weak, but significant, correlation in our data between thumb length and maximum thumb reach. This evidence conflicts with Kim and Jung’s (2010) conclusion that hand size does not affect thumb reach. Our data also suggest that age is a factor in thumb reach. This finding is in conflict with the conclusion of Gilbert et al. (1988). It is clear from Figure 6 that the thumb reach envelopes for our three demographic groups (adolescent females, young mothers, and young fathers) have different shapes and sizes. For example, the thumb reach plots for the adolescent females reveal a more circular shape than those of the young mothers or young fathers. The adolescent females also appear to have a generally larger reach envelope compared with either of the adult groups. This finding seems counterintuitive, given that the young fathers generally had longer thumbs than did the adolescent females.
A possible explanation is that participants in the younger group used a looser grip. Although we instructed all participants to hold the touch-screen device “securely but comfortably,” we speculate that younger users may tend to grip handheld electronic devices more casually and loosely. This looser grip could be attributable to either lower concern for dropping the device or greater confidence in their grip because they have more experience using such devices. Older users may be more inclined to grip such electronic devices more securely and thus further limit their ability to reach with the thumb. Note that the method of using a touch-screen device for collecting data on reach envelopes has the advantage of closely simulating the nuances of grip performance associated with handling such electronic devices that would not be accounted for by more traditional anthropometric study methods.
Another possible explanation for the larger reach envelope of the adolescent female group is greater joint flexibility. Although finger dexterity decreases with age (Mathiowetz, Weber, Kashman, & Volland, 1985), we assume that such age-related restrictions in joint flexibility would not be a significant impediment to the use of handheld devices for the adult age range covered in our study (25- to 43-year-olds). Although we did not collect such background information, we believe it is likely that participants in our adolescent female group had more prior experience using handheld devices that are primarily operated with the thumbs, such as phones, game controllers, and remote controls. Additional experience may contribute to a looser grip as mentioned earlier or possibly to greater joint flexibility.
We believe that the thumb reach envelopes reported here are the first of their kind and are likely to be useful to others engaged in the design of devices intended to be held in one hand and operated primarily with the thumb, such as cell phones, video cameras, music players, and navigation devices. However, we recognize that designers of such devices cannot rely on these thumb reach envelopes alone to guide control placement but will need to consider various design constraints and other data sources to converge on specific design recommendations. We also recognize that selecting small targets on a touch screen often requires more precise targeting (i.e., using the tip of the thumb) than the style of reaching used in this study. When pressing hardware buttons, people typically use the larger pad area of the thumb. Therefore, the results of this study may have some limitations in terms of the design for touch-screen products. Additionally, the participants’ task required them to interact with the device only for a short time (about 2 min), so we cannot project how reach envelopes might vary from the impacts of sustained thumb tension and flexion in longer-duration tasks.
These data were collected for a specific project: the design of a handheld video camera with hardware buttons. Certainly other projects with different design constraints may prevent the application of the data that we have presented here. For example, another device may differ considerably from the device in this study in terms of its thickness, width, weight, intended grip posture, and so on. Additionally, modifying the participant’s task (e.g., using only the tip of the thumb to indicate reach, increasing the task duration) could help to further define the reach envelope for devices different from that used here. As Pheasant (1986) points out, “Dynamic data are generally obtained in special purpose studies which often include factors which render the data inapplicable outside the original area of concern” (p. 135). In such situations when the data themselves are not applicable, we hope that designers will find valuable the methods that we have presented here for gathering and analyzing thumb reach envelope data.
Key Points
We provide two-dimensional thumb reach envelopes for the primary control surface on handheld electronic devices for three demographic groups: adolescent females, young mothers, and young fathers.
Our data suggest that age is a factor in thumb reach.
Adolescent females appear to have a larger reach envelope compared to either of the adult groups.
The thumb reach envelopes reported here are the first of their kind and are likely to be useful to others engaged in the design of devices intended to be held in one hand and operated primarily with the thumb, such as cell phones, video cameras, music players, navigation devices, and so on.
When these results cannot be applied directly because of differing device dimensions or differing user populations, the methods that we present should allow others to easily collect additional thumb reach data.
Footnotes
Acknowledgements
The authors thank Walter Jakubowski for significant contributions to the methods used in this study and Karen Garner, Richard Poole, and Valerie James for contributions in planning the study.
One of the authors, Edward W. Otten, is an employee of Research and Engineering Development, LLC. At the time that this study was conducted, employees of Research and Engineering Development, LLC (including Edward), provided research support for this study and related work to Eastman Kodak Company, the sponsor of this study. The work was done under a fixed-price contract. None of the parties (Edward Otten; Research and Engineering Development, LLC, or its employees; or Eastman Kodak Company or its employees) will derive any financial benefit from the publication of this work. This work was funded under a fixed-price contract by Eastman Kodak Company and performed in the laboratory of Research and Engineering Development, LLC
Edward W. Otten is a human systems specialist with Research and Engineering Development, LCC, in Lexington Park, Maryland, currently tasked to support the U.S. Navy in the Human Systems Department of Naval Air Systems Command (NAVAIR). Formerly, he worked in the Department of Environmental and Safety Engineering at Toyota Motor Manufacturing North America. He received his PhD in psychology from Miami University in Oxford, Ohio, in 2008, where he studied aspects of perception and action, including postural control, motion sickness, and behavior in virtual environments.
Keith S. Karn worked in Eastman Kodak Company’s User Experience Department at their world headquarters in Rochester, New York, when this study was conducted. He was the lead user interface designer for pocket video cameras. Keith has subsequently joined the staff of Design Science Consulting in Philadelphia. Keith earned his PhD in psychology from the University of Rochester (Rochester, New York) in 1995. He also holds an MS in industrial engineering from the ergonomics program at North Carolina State University and a BS in industrial engineering from Pennsylvania State University. He has extensive experience in industry, academic, and government organizations applying human factors principals and research to the design of both hardware and software products.
Kelley S. Parsons earned her PhD in psychology from the University of Cincinnati (Cincinnati, Ohio) in 2007. At the time this work was done, she was an employee of Eastman Kodak Company (Rochester, New York). Formerly, she worked for the National Institute for Occupational Safety and Health and held a postdoc at Cornell University, where she examined the complex relationships between factors such as stress, workload, job satisfaction, and musculoskeletal disorders among home health care and hospital nursing professionals. She is currently working as an independent consultant in Syracuse, New York.