
Abstract
Objective:
The objectives were to (a) implement theoretical perspectives regarding human–automation interaction (HAI) into model-based tools to assist designers in developing systems that support effective performance and (b) conduct validations to assess the ability of the models to predict operator performance.
Background:
Two key concepts in HAI, the lumberjack analogy and black swan events, have been studied extensively. The lumberjack analogy describes the effects of imperfect automation on operator performance. In routine operations, an increased degree of automation supports performance, but in failure conditions, increased automation results in more significantly impaired performance. Black swans are the rare and unexpected failures of imperfect automation.
Method:
The lumberjack analogy and black swan concepts have been implemented into three model-based tools that predict operator performance in different systems. These tools include a flight management system, a remotely controlled robotic arm, and an environmental process control system.
Results:
Each modeling effort included a corresponding validation. In one validation, the software tool was used to compare three flight management system designs, which were ranked in the same order as predicted by subject matter experts. The second validation compared model-predicted operator complacency with empirical performance in the same conditions. The third validation compared model-predicted and empirically determined time to detect and repair faults in four automation conditions.
Conclusion:
The three model-based tools offer useful ways to predict operator performance in complex systems.
Application:
The three tools offer ways to predict the effects of different automation designs on operator performance.
Keywords
Introduction
As automation is implemented to a greater extent and across a wider range of systems, there is a need for effective, research-based guidance to support designers. This paper provides the theoretical and empirical framework for two human–automation interaction (HAI) concepts—the lumberjack analogy and black swan (totally unexpected) events—and their effects on overall operator performance. The paper then describes the implementation and validation of these concepts in three distinct and separate model-based software tools to assist designers in developing automated systems to support operator performance. There are relatively few modeling efforts that attempt to address HAI except at a very detailed level (e.g., Boehm-Davis, Holt, Diez, & Hansberger, 2002; Degani, Heymann, & Shafto, 2013; John, Blackmon, Polson, Fennell, & Teo, 2009; Lüdtke & Osterloh, 2010; Lüdtke, Osterloh, & Frische, 2012; Lüdtke, Osterloh, Mioch, Rister, & Looije, 2009), and they either do not directly assess issues of imperfect automation or do not contain firm validation data. Finally, this paper identifies lessons learned across the projects, and thus it can be informative to other human factors professionals attempting to predict HAI performance.
A stages-and-levels taxonomy of automation developed by Parasuraman, Sheridan, and Wickens (2000, 2008; Wickens, Mavor, Parasuraman, & McGee, 1998) defined automation partially in terms of the stages of human information processing that could be assisted by automation. This stage taxonomy is represented schematically in Figure 1, along with some prototypical examples of automated functions at each stage depicted at the bottom.
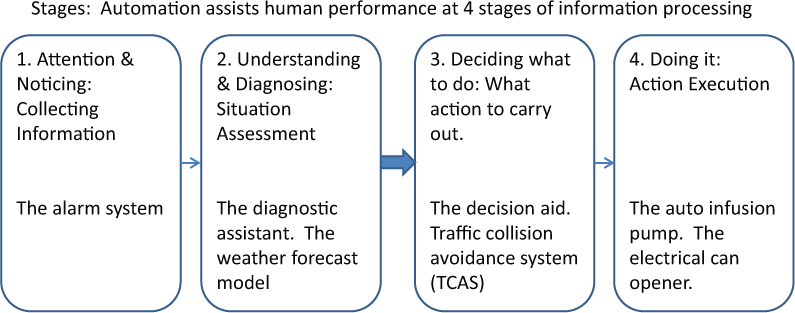
Stages in which automation can assist human performance, including examples.
Such a taxonomy provides a framework for understanding three important characteristics of human interaction with imperfect automation. First, across many applications, there is a marked distinction between automation that provides assistance to the operator regarding the diagnosis of the state of the world (Stages 1 and 2) and that which offers decision recommendations for actions and sometimes even executes the recommended action (Stages 3 and 4). Examples of this dichotomy may include, in medicine, the distinction between automated diagnostic aids and treatment recommendations (Garg et al., 2005; Morrow, Wickens, & North, 2006). In remotely controlled robotic arm design, the distinction is between displays of trajectory error and autopilot flying of the trajectory (Li, Wickens, Sarter, & Sebok, 2014). In aviation, the distinction is between midair conflict detection systems (Wickens, Rice et al., 2009) and conflict resolution advisories (Prevot, Homola, Martin, Mercer, & Cabrall, 2012; Trapsilawati, Qu, Wickens, & Chen, 2015). In statistical analysis, the distinction is between software packages that offer only an inference with a confidence interval versus those that recommend a decision to accept or reject the null hypothesis.
Second, the development of such automation aids is more problematic for later-stage (3 and 4) automation than for earlier-stage (1 and 2) automation. The reason lies in the contrast between the two clusters regarding optimal design. For earlier-stage automation, there is typically a “ground truth” of correctness. A diagnosis can ultimately be determined to be right or wrong (even though at the time it is made, it may be uncertain). Hence automated systems can be evaluated on their absolute level of diagnostic accuracy. In contrast, an automated system that recommends (and/or executes) a course of action in the face of an uncertain diagnosis (Stages 3 and 4) must, by definition, make an assessment of the values (or costs) of certain outcomes.
Consider an automated medical assistant that recommends to the physician a particular treatment in the face of an uncertain diagnosis. The assistant must account for the relative costs of recommending an unneeded treatment versus those of an untreated condition. There is no reason to assume that the automation’s value structure is identical to that of the physician (or the patient), and therefore there is no reason to assume that the recommendation is “optimal.” As a consequence, later-stage automation may more often be “wrong” in the sense of providing a recommendation that is different from that of the human operator, not because the diagnosis underlying the recommendation was incorrect but because the value structure differed. Thus the physician and automation may disagree not because one was right and the other wrong but because one felt that the cost of the unnecessary surgery (in dollars and danger to the patient) was greater. With a greater likelihood of being incorrect from the point of view of the human user, the automation’s perceived reliability will be lower and certainly harder to objectively quantify.
Third, the data on human use of imperfect automation indicate greater costs of such imperfections when automation does fail. To understand this third source of importance for the taxonomy, we must also consider the level of automation within each stage. Based on the original classic work of Sheridan and Verplank (1979), Parasuraman et al. (2000) considered that each stage within the taxonomy could be characterized by different levels of implementation. These levels can be thought of as the ratio of automation work to human work or, alternatively, how “aggressive” and authoritative the automation is in performing its assistance. The most intuitive contrast of levels, within Stage 3 automation, is between an automated agent that recommends one or more courses of action (lower level) and an agent that will execute the action within a certain period unless the human operator vetoes it (Olson & Sarter, 2001). As Table 1 shows, similar assignments of levels can be made across each of the different stages.
Multiple Examples of Automation Stages and Levels
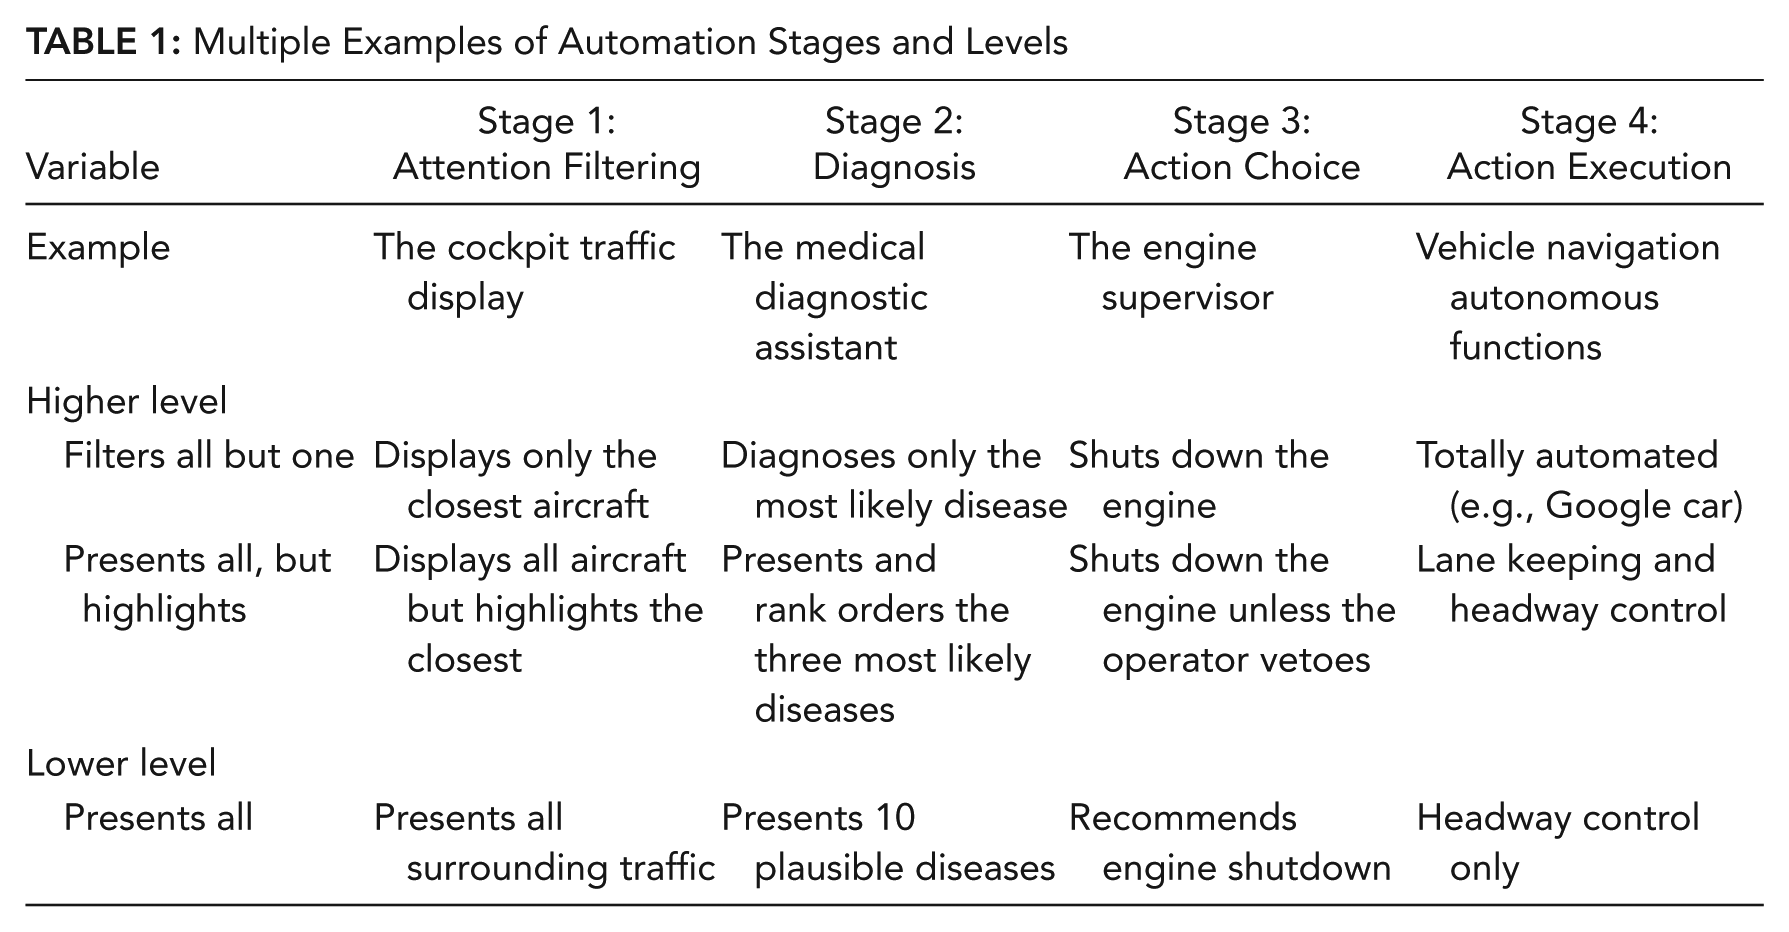
Importantly, there is no absolute number of levels that must be assigned within each stage, and indeed, Stage 3 lends itself to more possible levels than are indicated in Table 1. In addition, there are certain contingencies between levels across stages. In particular, the highest level at Stage 3 by default dictates high levels at Stage 4. That is, if an automated system “decides” to execute an action at the highest level of Stage 3 (rather than simply recommend it), it must execute the action (highest level of Stage 4). Also there is a partial contingency between Stage 2 and Stage 3 in that many decisions of automation are made on the basis of the automation’s own diagnosis. However, this automation-driven diagnosis–decision link is not invariably true, as, for example, a physician may enter his or her own independent diagnosis into an automation treatment recommendation system for the automation to recommend a course of action.
Onnasch, Wickens, Li, and Manzey (2014) used the framework provided by the matrix of stages and levels to define a new variable, degree of automation (DOA), that is increased by moving upward and/or rightward across the cells of Table 1. The importance of collapsing these two dimensions (stages and levels) onto a single one (degree) is because both stages and levels appear to have the same implications for HAI in normal and automation failure conditions. These implications are embedded in a set of four phenomena that Onnasch et al. derived from a meta-analysis of 16 experiments: nominal performance; automation failure performance, which we will refer to here specifically as a human response to unexpected automation failure (HRUAF); situation awareness (SA); and workload. All studies included within the meta-analysis varied the degree of imperfect automation (automation that could occasionally “fail”) and recorded both normal performance of the human–automation system and performance when a failure occurred. In addition, where possible, Onnasch et al. extracted and recorded SA across the manipulated DOA as a possible moderator of performance. Workload was assessed in many of these studies and was found to covary with routine performance, decreasing with higher DOA. Workload is not presented here, as it is not central to our thesis.
An important consideration is that the broader meaning of automation failure may include software bugs, hardware failure, circumstances for which the automation was not designed, and instances in which the automation performs as the designer intended but not as the user expected. Such situations could occur if the user, for example, incorrectly programmed the automation or had an inaccurate mental model of its functioning.
The results of the meta-analysis (Onnasch et al., 2014) are shown in Figure 2. Panel (a) indicates that a higher DOA increases routine performance. This finding is not surprising, as it shows that across studies, automation is functioning as intended. Panel (b), however, indicates a progressive loss in performance with higher DOA (automation is doing more work) on the infrequent occasion when automation fails and the operator must assume manual control. This trade-off is the critical aspect of the data, represented by the “lumberjack analogy”: The higher the trees (better routine performance with higher DOA), the harder they fall (worse performance in failure conditions).
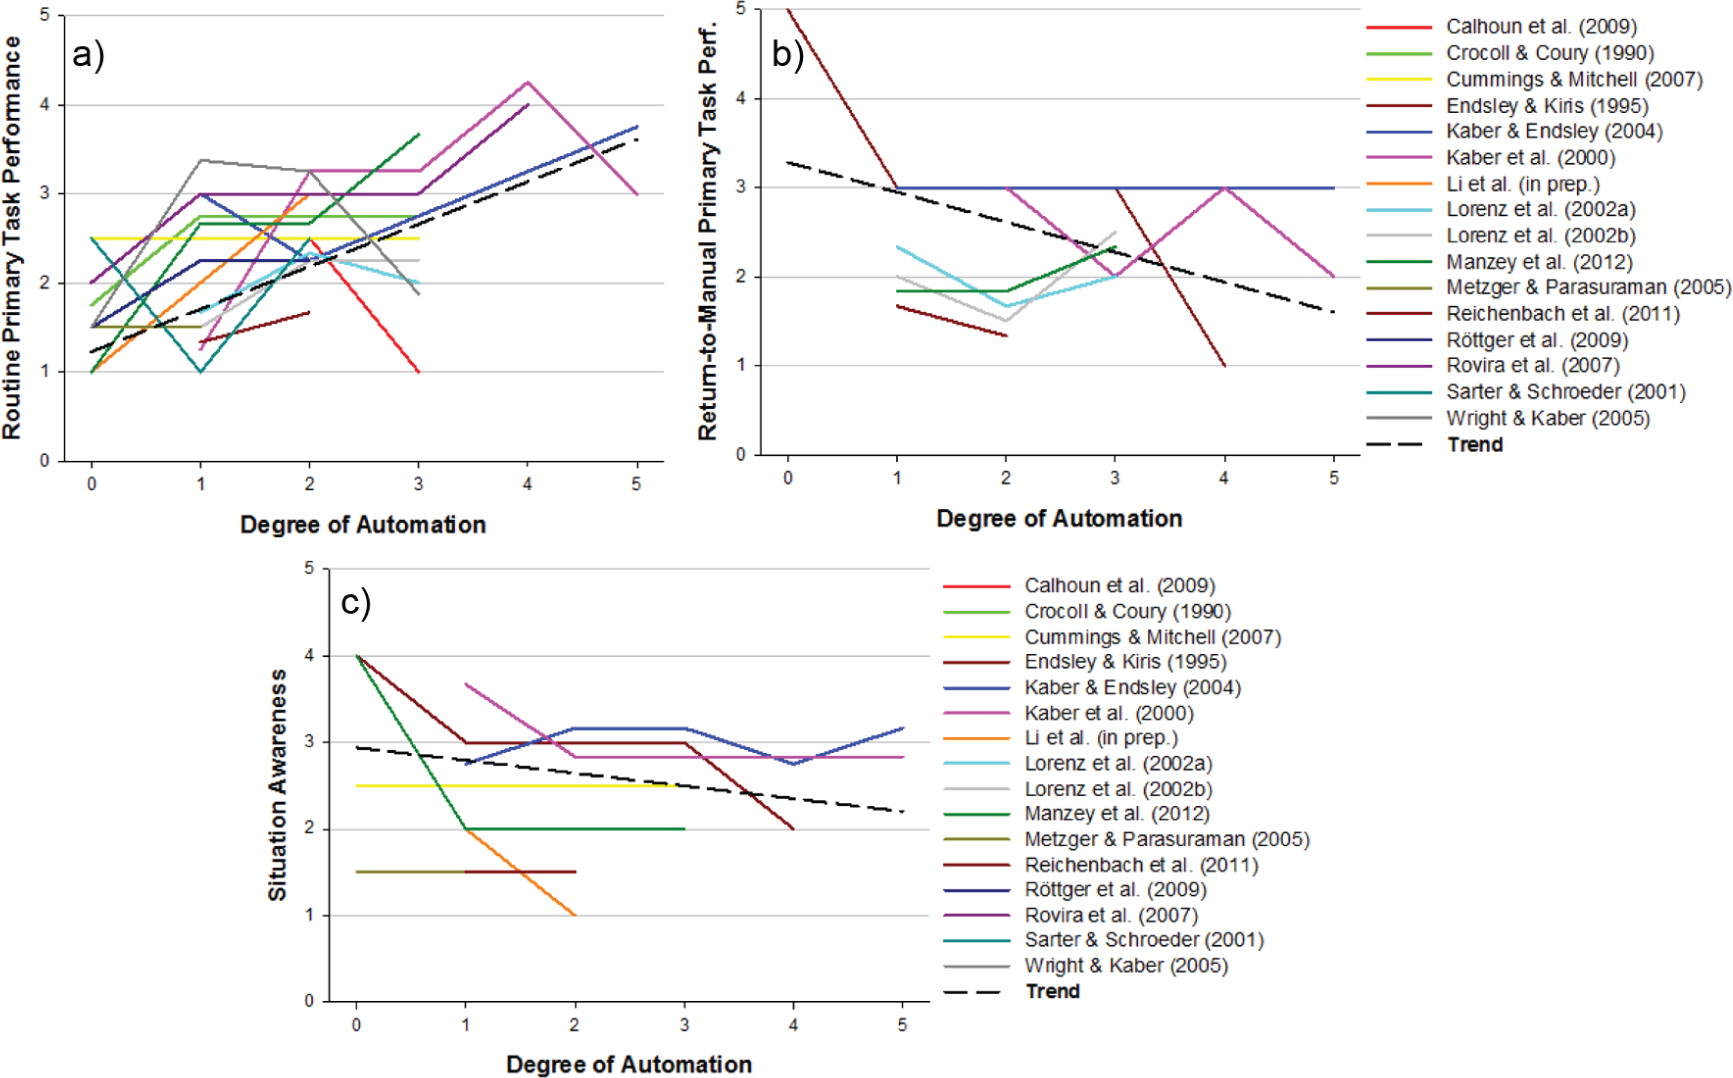
Results of meta-analysis of degrees of automaton (from Onnasch, Wickens, Li, & Manzey, 2014). The regression trend lines are the dashed lines.
Panel (c) depicts the critical variable that underlies the performance trade-off: the progressive loss of SA with higher DOA. Such a finding is also consistent with the general understanding that being out of the loop degrades awareness of what automation is doing (Endsley & Kiris, 1995; Kaber & Endsley, 2004), with a progressively greater loss as automation does more work and the human does less work. Such a phenomenon, sometimes referred to as “out-of-the-loop unfamiliarity,” or OOTLUF, can be seen as resulting from a combination of three components:
Complacency, inducing in the operator a failure to monitor and hence a failure to notice effectively when a fault occurs. The irony of automation is that the more reliable the automation is, the rarer failure events are, becoming essentially “black swans” (Taleb, 2007) that are missed altogether (Molloy & Parasuraman, 1996; Wickens, Hooey, Gore, Sebok, & Koenecke, 2009).
The reduction of active responding and engagement with the system, which induces in the operator a failure to learn and remember the dynamically evolving state of automation and to understand fully the environment in which automation is functioning. This reduction is amplified in moving to higher DOAs. The resulting loss of SA in turn degrades the appropriate response to the failure.
The progressive loss of skill of the operators with increasing DOA (Casner, Geven, Recker, & Schooler, 2014), which degrades the quality of an appropriate intervention.
Thus the key performance variables in this trade-off model are the divergence of the two performance curves as DOA increases, creating the higher “tree” and the harder “fall”; the key mediating variable is the loss of SA. The DOA trade-off model is embodied in the straight regression trend lines shown in the figure; the data that validate the model are seen in the “spaghetti graphs” of the individual studies underlying the trend lines.
Naturally, designers should be concerned about such a trade-off, given that almost all automation can fail. These failures are likely to be unexpected black swans, not anticipated by the designer. A host of possible approaches or solutions exist, four of which are described next.
A higher DOA is appropriate if failure analysis indicates that the consequences of failures are not sufficiently serious to outweigh the benefits of higher DOA, given the frequency of correct operation, and there are only very modest costs of such failures (Sheridan & Parasuraman, 2000). This may be the case for routine automation in non-safety-critical environments, such as a photocopier or other office equipment.
Simply automate less: Choose a lower DOA, and accept that the human will be required to perform additional work, if the reduced costs of the automation failure outweigh the additional workload. For example, continue with automation diagnostic systems (earlier stage), or implement automation decision systems only at a low level.
Capitalize on the meaning of the “loss of SA curve” and carefully craft intuitive displays of dynamic processes that can improve SA without imposing significant mental effort on the operator, in the spirit of ecological displays (Burns et al., 2008; Hoff & Bashir, 2015; Mercado et al., 2016). Such a design approach can reduce or even eliminate the downward slope of the dynamic performance loss function (Figure 2b) without decreasing benefit of automation (Figure 2a).
Provide training specifically on the experience of automation failures (Hoff & Bashir, 2015; Sauer, Chavaillaz, & Wastell, 2015; Schaefer, Chen, Szaslmas, & Hancock, 2016). This training may be simply verbal instruction that automation could fail (and how it might). But the full impact of the findings of active learning benefits (Wickens, Hutchins, Carolan, & Cumming, 2013) suggest that actually experiencing an automation failure during training, for example, in a simulator, can be a compelling way to establish the operator’s mental model that automation is imperfect (Bahner, Hüper, & Manzey, 2008).
Earlier, we described the phenomenon of HRUAF: the human response to the black swan events of unexpected automation failure. We also described how the lumberjack analogy characterizes how the human response is affected by increasing DOAs, as mediated by the reduction of SA. We also identified four potential solutions to the problem. In the following section, we focus explicitly on three validated models of HRUAF (or models of HAI that contain an explicit HRUAF component). Such models have the advantages that they provide quantitative predictions of operator performance in routine and failure conditions, they offer metrics of HAI quality, and they can predict the effects of proposed design solutions listed earlier.
Modeling
The benefits of quantitative computational modeling in general are well documented elsewhere (e.g., Byrne, 2013; Foyle & Hooey, 2008; Gray, 2007; Laughery, Lebiere, & Archer, 2006; Pew & Mavor, 1997), as are the requirements that such models be validated against human performance data in order to be trusted and useful (Wickens & Sebok, 2014). Indeed, such validated human performance models of HRUAF are rare, particularly as that response is moderated by DOA. In this section, we describe three such modeling efforts that we have conducted and from which we have extracted lessons learned. We note that all three efforts addressed automation in complex safety critical aerospace systems: flight deck automation, automated robotic arm control, and automated environmental process control.
All three models are embedded in software tools that provide an interface through which the user interacts with the model. The interface allows the user to investigate questions about the effects of automation properties on HRUAF and other aspects of performance and cognition. Finally, and critically, all three software tools incorporate a model of human noticing of the unexpected visual event. In these projects, the unexpected event is the visual manifestation of the automation failure. The visual noticing model, NSEEV (noticing, salience, expectancy, effort, and value), describes the quantitative manner in which detection of a visual indicator of the automation failure (or any other discrete visual event) is influenced by factors such as the expectancy of the event and salience of the failure indication. For example, the low expectancy of the black swan failure will increase detection time, whereas the high salience of a flashing “no data” message will shorten it. The model also predicts the degrading effects of cognitive workload to response time and, most importantly, the degrading effect of greater retinal eccentricity away from the operator’s momentary fixation at the time of the failure. This fixation in turn is driven by the visual demands of the ongoing task at the time of the failure. The NSEEV model is described in detail elsewhere (Wickens, 2015; Wickens, Sebok, Li, Sarter, & Gacy, 2015; Steelman, McCarley, & Wickens, 2011).
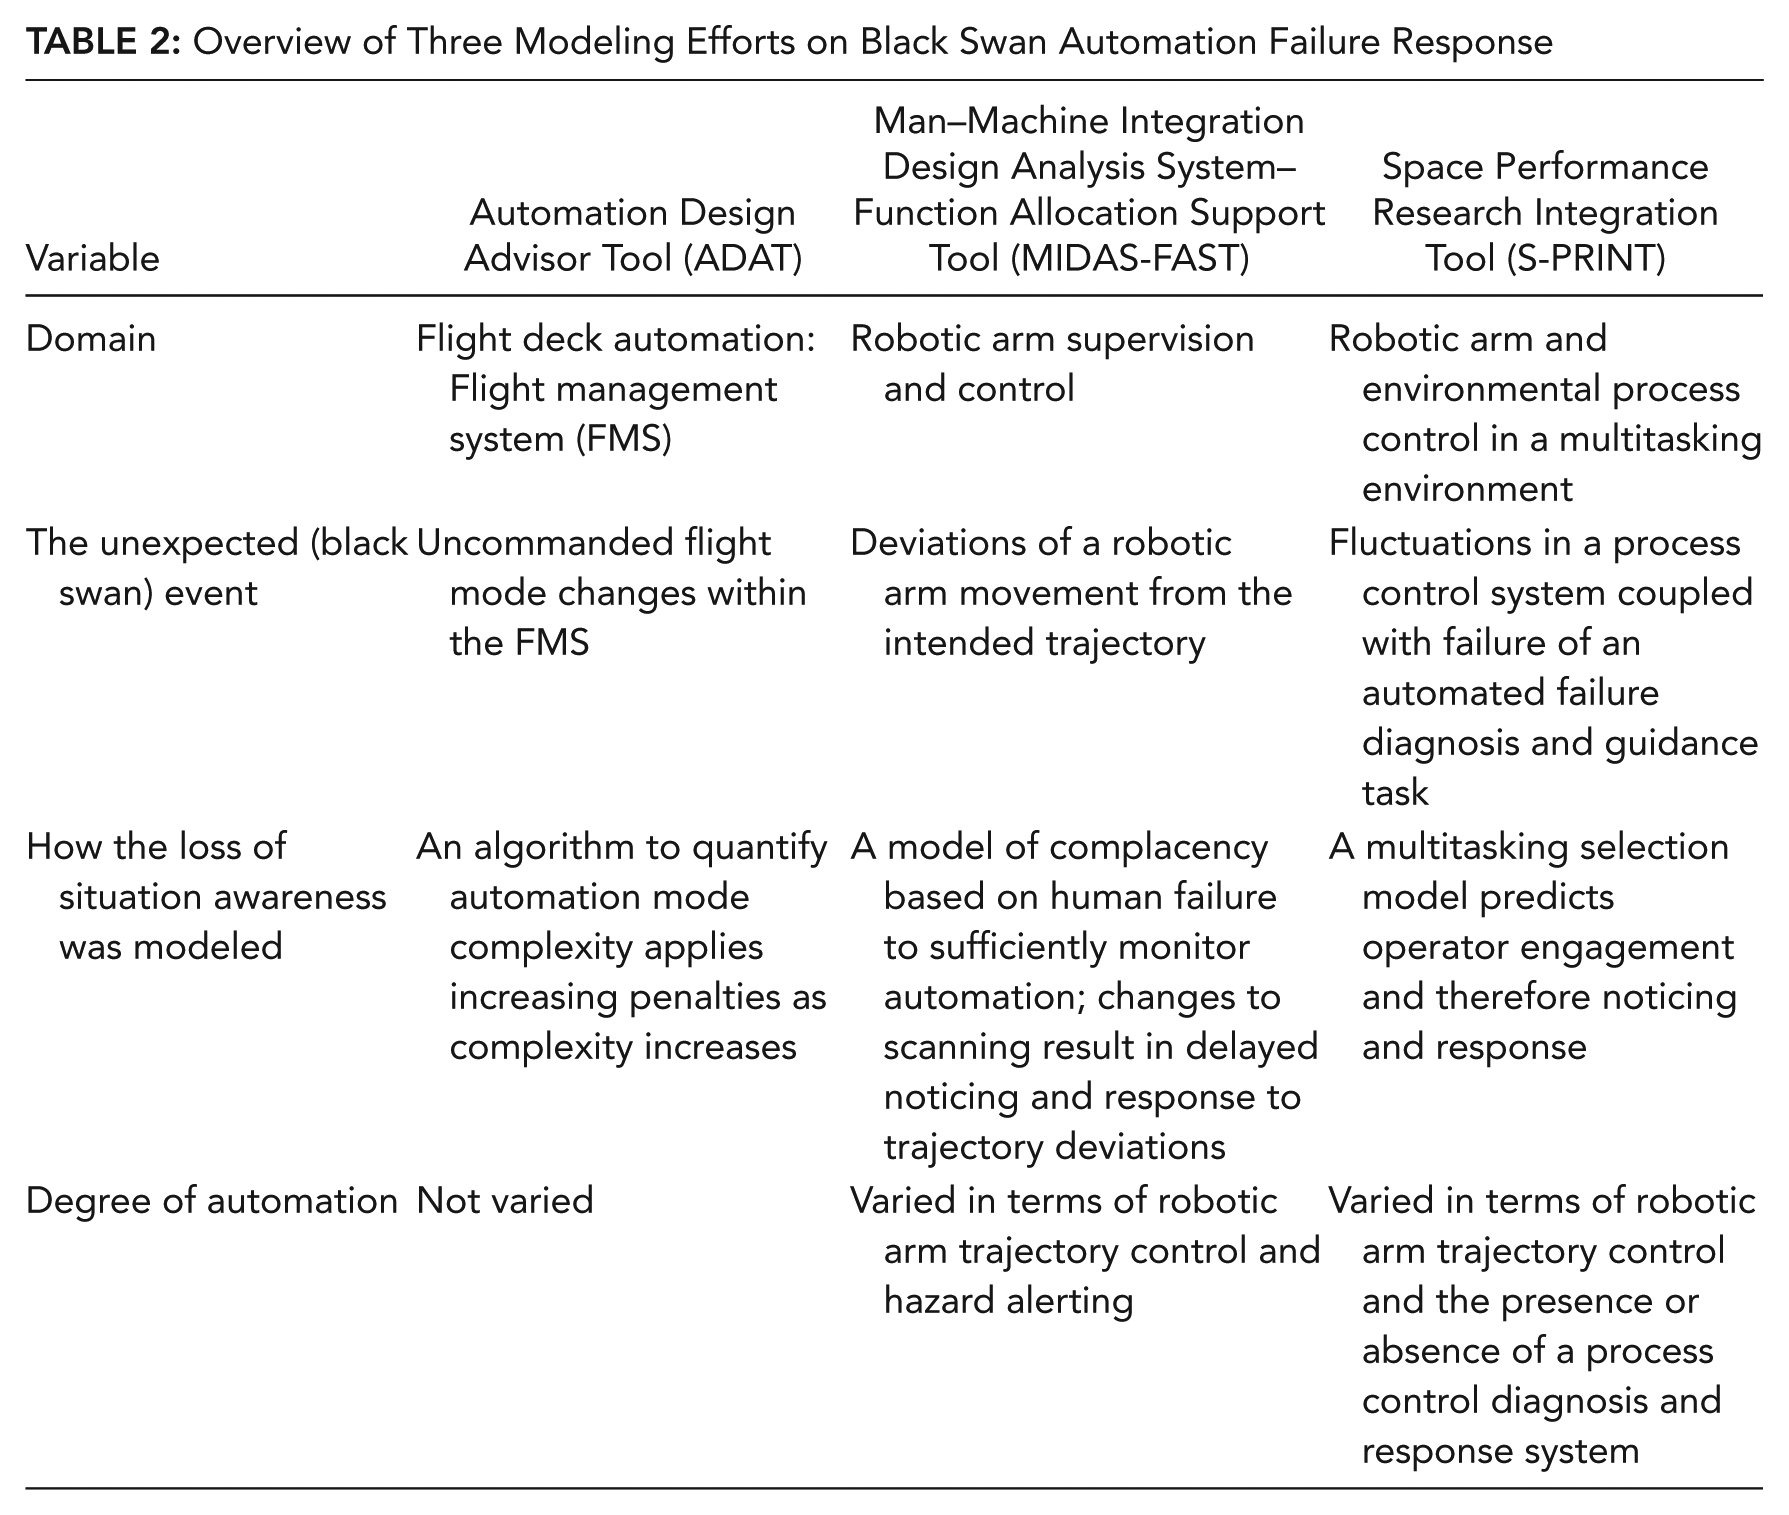
Table 2 provides an overview of critical features of the three modeling efforts to predict human interaction with automation. The table identifies the domains, the unexpected event(s) they address, and how they treat the HRUAF. In addition to this overview, we describe each modeling effort in more detail.
Overview of Three Modeling Efforts on Black Swan Automation Failure Response
Automation Design Advisor Tool (ADAT)
The flight management system (FMS) is a complex, yet highly useful, automated aviation system (Ferris, Wickens, & Sarter, 2010; Sebok et al., 2012) that helps pilots plan and execute flight paths to maximize efficiency while maintaining safe performance (Degani, 2004; Pritchett, 2009). The FMS has been on flight decks since the 1970s, providing a wealth of lessons learned regarding the challenges it presents to pilots. Briefly summarized and as reflected in the literature on the challenges of HAI, the FMS (1) affects complex, interacting flight control systems; (b) operates in ways that pilots, at times, do not expect; (c) presents nonsalient, alphabetic-code indications of the current mode, requiring the pilot to interpret the code and visualize the mode’s effects on the flight path; (d) can have different outcomes for pilot actions, depending on the current mode; (e) has many modes of operation; and (f) has multiple ways to trigger mode transitions (Fennell, Sherry, Roberts, & Feary, 2006; Sarter & Woods, 1992, 1994, 2000; Sherry, Feary, Polson, & Fennell, 2003). As a consequence, subtle mode changes, initially unnoticed by pilots, may sometimes be perceived as automation failures and lead to confusion in response.
ADAT was developed to help FMS designers identify potential design concerns that might be expected to impair pilot performance by using the software tool to replicate the layout of the FMS design and then characterize the user interactions. Figure 3 shows a screenshot of the tool (Sebok et al., 2012), where the user re-creates the layout of the FMS components on the flight deck. Specifically, ADAT evaluates six aspects of FMS design in six modules, each based upon computational models (metrics) of factors influencing human performance: (a) layout of the displays and controls, (b) noticeability of changes, (c) meaningfulness of terms, (d) confusability of terms and symbols, (e) complexity of modes, and (f) procedures performed when using the FMS. Each area, referred to as a module in ADAT, has concerns that could adversely affect pilot performance. These six modules were selected through iterative discussions with subject matter experts (pilots, avionics designers, pilot trainers, and airline procedure writers) to identify critical FMS design issues. The current paper focuses on the two most relevant modules (noticing changes and complexity; see Sebok et al., 2012, for a more detailed discussion of other modules). Note that these modules are tabs shown at the top of the screenshot in Figure 3.
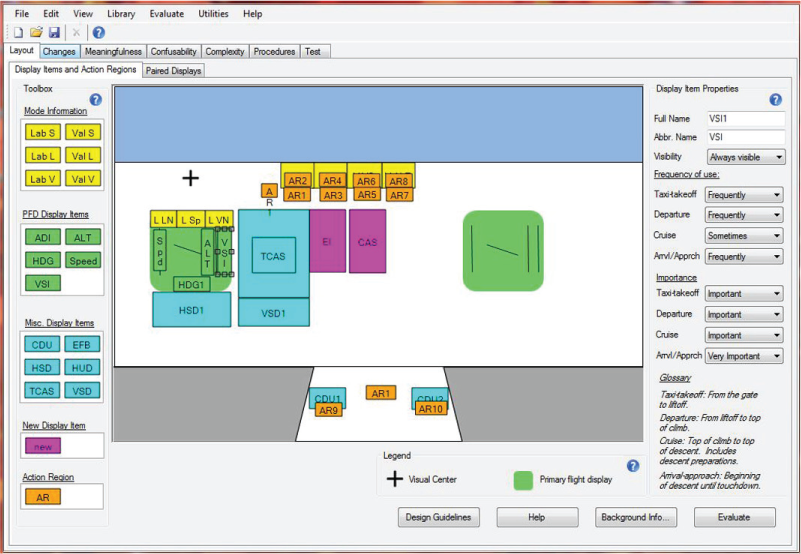
Screenshot of the Automation Design Advisor Tool layout module, where designers locate and characterize the flight management system displays and controls.
Based on user inputs, ADAT provides feedback about potential human factors concerns for each of the aforementioned aspects. The results of the six computational metrics are indicated with a stoplight status code for each of the design factors and their expected impacts on pilot performance. When ADAT identifies a design concern, it provides links to empirical research summaries in the tool that explain the problem or present potential solutions.
The changes module addresses a well-documented finding that pilots are sometimes unaware of display changes that indicate important aspects of aircraft behavior pertaining, in particular, to modes of automation. When mode transitions occur that are not commanded by the pilot, they are sometimes unexpected (Nikolic, Orr, & Sarter, 2004; Sarter, Mumaw & Wickens, 2007; Wickens & Alexander, 2009; Wickens, Hooey, et al., 2009). The changes module, based heavily on the NSEEV model described earlier, reflects the well-known phenomenon of change blindness (Rensink, 2002). This lack of awareness of changes can negatively affect safety. The changes module uses the NSEEV model of visual noticing (Steelman et al., 2011; Wickens, 2015; Wickens & McCarley, 2008) to predict whether or not pilots will notice mode transitions based on (a) salience, expectancy, and location of changes; (b) phase of flight and the associated expected pilot workload (higher workload results in decreased noticing of unexpected events); and (c) time elapsed since the change occurred. Time elapsed is important because change blindness research suggests that if a visual change is not detected within 5 to 10 s after its occurrence, the change is likely to be missed (Rensink, 2002). Such a failure of detection represents a breakdown in the first component of OOTLUF, described earlier. The model penalizes designs to the extent that important events, such as subtle mode changes, are not salient, are located in the peripheral visual field, are unexpected, or are encountered during high-workload conditions.
The complexity module assesses the problems associated with understanding and predicting the many different FMS behaviors (Degani et al., 2013; Funk et al., 1999; Sarter & Woods, 1994, 2000). The number of modes, the interactions or couplings between the modes (Halford, Baker, McCredden, & Bain, 2005), and the agent that activates a mode transition (pilot or automation) all affect system complexity and thus are assumed to affect pilot SA, the second component of OOTLUF. Finally, the feedback presented to the pilot regarding the effects of mode transitions on the flight path is evaluated. Graphical displays that show the flight path could greatly enhance pilot mode awareness, but the typical feedback is a three- or four-letter code, from which pilots should remember flight performance implications. This code is a poor display for supporting SA. The complexity module evaluates these relevant design issues that affect pilot SA and hence should influence the quality of the HRUAF failure response.
In the validation of ADAT ratings of FMS designs, five expert raters evaluated three types of FMS systems and found that ADAT rankings matched a priori expectations, as described next. The raters included four people trained in human factors; four of the five had piloting experience (two were commercial pilots, two were former private pilots or student pilots), and one was an avionics designer. The only non–human factors person was a professional pilot. A commercial FMS, with known issues, was rated lowest. A more modern corporate design, developed to remediate earlier problems, received intermediate ratings. The third design, specifically developed by human factors specialists to address automation complexity and interface design concerns (Boorman & Mumaw, 2004; Mumaw, Boorman & Prada, 2006), received the highest ratings.
Man–Machine Integration Design Analysis System–Function Allocation Support Tool (MIDAS-FAST)
Our second automation modeling effort is of the robotic arm, such as one used to conduct inspections and repairs on the International Space Station (Li et al., 2014; Wickens, Sebok, et al., 2015). Astronauts manipulate the arm using joysticks and monitor arm movement through camera and window views, which typically provide suboptimal perspectives of the task environment. The arm contains moving segments and joints that pose potential collision hazards with surrounding structure. Figure 4 shows the simulated robotic arm environment, with a trajectory (orange “staple”) indicating the recommended flight path around an obstacle. Given the complexity and criticality of robotic arm operations, astronauts receive hundreds of hours of robotic control training (Z. Tomlinson, personal communication, May 10, 2010). Automation offers a potential way to further support operator performance.
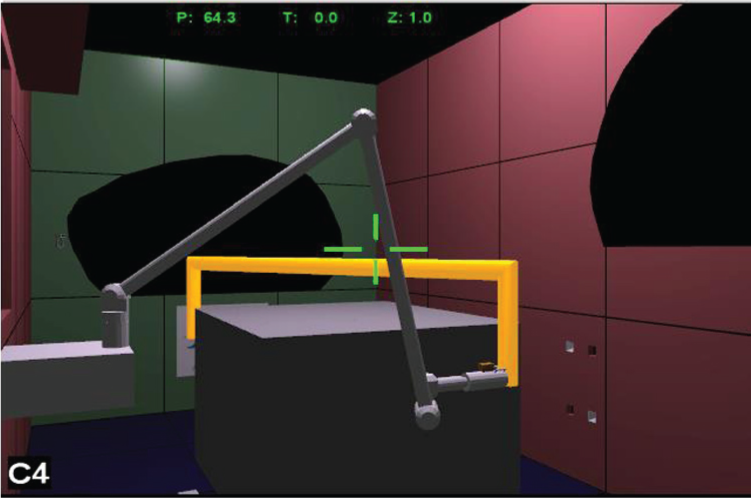
One view of the robotic arm, with the end effector aimed at the recommended trajectory for traversing an obstruction.
This project used modeling, simulation, and human-in-the-loop (HITL) research to investigate how different DOAs applied to the movement and supervision of the arm could be expected to influence operator performance. A human performance model and a robotic simulation were integrated in the MIDAS-FAST software (Sebok et al., 2013). The model was implemented in MIDAS (Gore, 2010), a product of NASA Ames Research Center, and the robotic simulation was the Basic Operational Robotics Instructional System, from the NASA Johnson Space Center.
The operator model included six components, elaborated in Wickens, Sebok, et al. (2015). The NSEEV model (used in ADAT) predicted complacency in terms of failure to monitor automation for unexpected events, hence compromising failure management.
The complacency model predicted the loss of SA resulting from a higher DOA, as underlies the lumberjack analogy (see Figure 2). Details of this model are provided in Wickens, Sebok, et al. (2015), but its function was to predict the progressive reduction of scanning (and resulting degradation of SA) to the display panels vital to detecting robotic arm failures (errant trajectories) as the operator relied on progressively higher DOAs. These degrees varied from manual performance, to performance supported by a display of the path (supporting SA: Stage 2 automation) to automation that provided direct control (Stages 3 and 4). The reduction in scanning (to the display showing the errant trajectory) results both from the smoother control (lower bandwidth) at higher DOA and from the lower expectancy of failure under autopilot control. Both effects are embodied in the NSEEV model. An experiment with 36 highly trained participants (Li et al., 2014) indicated that, compared with manual performance, increasing the DOA improved routine performance in arm manipulation and reduced operator workload. However, failure detection and fault management were increasingly compromised by the higher DOA. The complacency model correctly predicted this differential failure response across the three DOA conditions, with a correlation of 0.97 between model predictions and empirical findings (Wickens, Sebok, et al., 2015).
Space Performance Research Integration Tool (S-PRINT)
The third project investigated HAI in a multitasking environment. The S-PRINT tool predicts human performance in unexpected workload transitions due to automation failures. S-PRINT was developed to support astronaut performance on long-duration missions, where fatigue and potential task overload are concerns. The HAI component of S-PRINT focuses on the features of any automation system that can degrade the failure detection, diagnosis, and response, thus invoking the lumberjack analogy. This HAI model contains four quantitative components or performance shaping functions (PSFs) that influence monitoring, failure detection, and SA, and hence the overall quality of the failure response. These are as follows:
DOA, as described earlier and as implemented in MIDAS-FAST.
The reliability of the automation. As research indicates (Moray & Inagaki, 2000; Rovira, McGarry, & Parasuraman, 2007; Wickens, Hooey, et al., 2009), the more reliable a system, the less likely an operator is to expect a failure. The less likely the failure is thought to be, the less frequently the operator scans the system displays (Hegerth, Lorenz, Villmek, & Krems, 2016) as predicted by components of the NSEEV model. S-PRINT users specify whether a failure is expected or unexpected for each type of failure. Reliability is associated with a PSF that affects operator performance more severely for unexpected automation failures.
The salience of the failure indication affects operator noticing of automation failures, as we highlighted in NSEEV and ADAT earlier. S-PRINT users input the salience of a particular failure, which affects the PSF applied to operator performance. Less salient failure indications result in longer detection times and hence impaired response in automation failure conditions.
The type of automation failure can affect operator performance. Although there are many ways any given automation system can fail, based on the work of Mosier, Skitka, Heers, and Burdick (1998) and Parasuraman and Manzey (2010), an important dichotomy built into our S-PRINT model of automation failure detection was whether automation decision aid failed because it gave incorrect advice—an error of commission—or because it unexpectedly gave no advice at all—an error of omission (Wickens, Clegg, Vieane, Sebok, & Janes, 2015). These two types of automation errors were expected to have qualitatively different effects on failure detection and recovery.
We note here that all four of these are objective metrics and that 1, 2, and 3 can be defined on a quantitative ordinal scale. Thus S-PRINT aggregates these factors into a single metric that predicts the adequacy of automation support for an effective human response to automation failure.
The model of operator performance in the multitasking environment was implemented as a discrete event simulation. The operator conducts a robotic arm task, as described earlier in the context of MIDAS-FAST, by moving the arm around an obstruction while monitoring—and intervening with as needed—an environmental process control system, AutoCAMS (Manzey et al., 2008). In robotic arm control, the operator tasks of planning the route, executing the route, and making decisions about rate and changing direction are each modeled explicitly. Similarly, the decisions to scan and intervene with the process control system when it fails are modeled as specific subtasks. These tasks include distributions of operator performance time and accuracy, based on interviews with subject matter experts.
The human performance model in S-PRINT was implemented using the Improved Performance Research Integration Tool (IMPRINT; Allender, 2000). Thus, the operator model for robotic arm control in S-PRINT used the same concepts (e.g., differences in trajectory control tasks and workload were modeled across the trajectory control conditions) as the operator model in MIDAS-FAST. However, the specific implementations varied, as MIDAS and IMPRINT are different types of modeling architectures and address human performance in somewhat different ways (Wickens, Sebok, et al., 2013).
The S-PRINT model was validated in an empirical study that utilized a multitask environment. The robotic arm task used in MIDAS-FAST was employed in both the higher-workload Stage 2 mode (automation-supported SA by presenting trajectory deviations) and the lower-workload Stage 3 mode (automated control). The robotic task was time-shared with monitoring AutoCAMS, the environmental process control simulation to control the astronaut’s cabin atmospheric environment (Wickens, Clegg, et al., 2015). The automation supporting routine performance of this system could occasionally fail, and failure management was supported by an automated decision aid that provided both diagnostic advice (Stage 2) and guidance for repair (Stage 3). On a totally unexpected black swan occasion, at the end of the experiment, the diagnosis and guidance failed to appear, which induced the HRUAF.
As anticipated, operator performance suffered when the automation decision aid was unexpectedly gone. Of greatest relevance, the discrete event simulation model and the four-component HAI performance-shaping function described earlier accurately predicted both detection time and total repair time. These times were predicted for conditions in which the decision aid was present and when it was unexpectedly gone. These times were also predicted under both higher- and lower-workload conditions created by the lower and higher DOA of the concurrent robotic arm task described earlier.
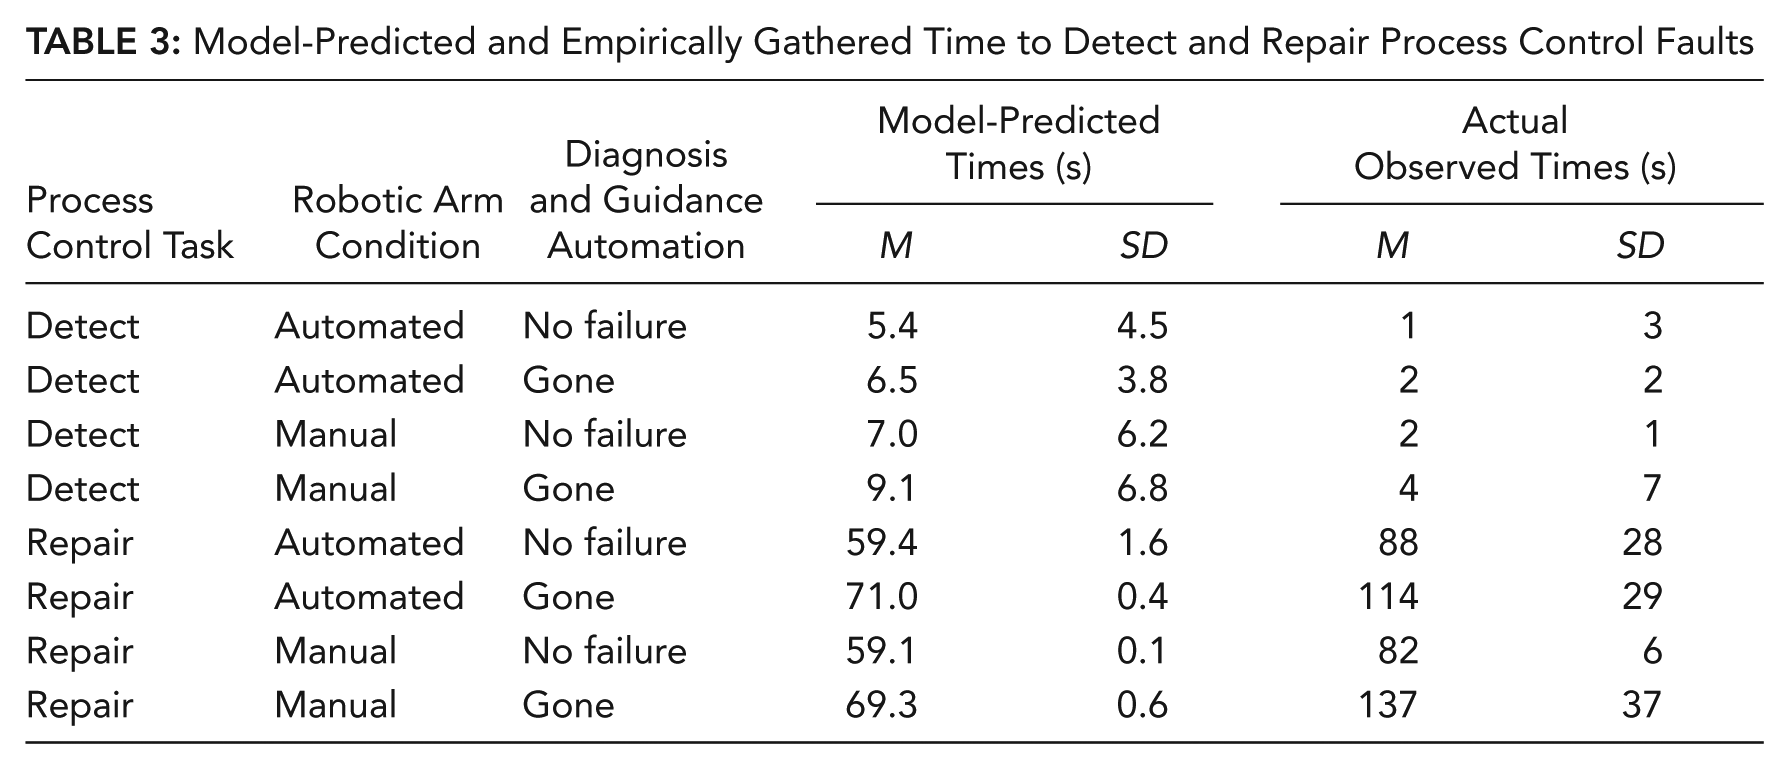
The S-PRINT model predictions and performance data are shown in Table 3 and Figures 5 (detection) and 6 (total repair time) and reveal the high degree of correlation (r = .99 for detection, r = .88 for repair).
Model-Predicted and Empirically Gathered Time to Detect and Repair Process Control Faults
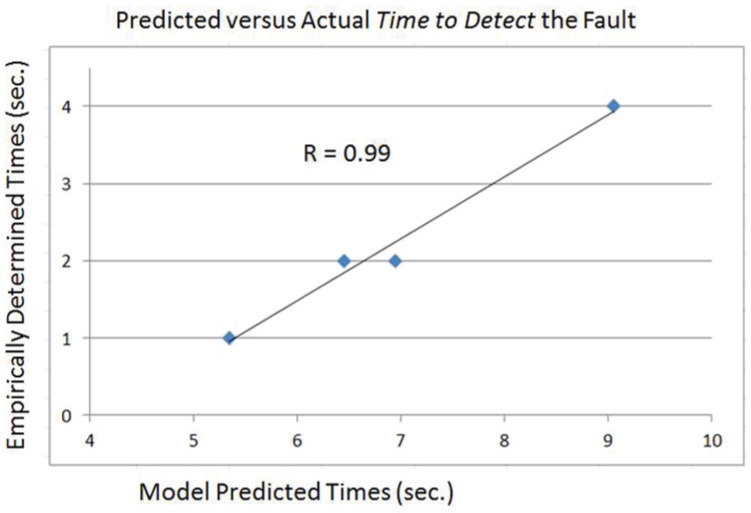
Plot of mean model-predicted (x-axis) and mean empirically determined time (y-axis) to detect fault in the process control system (r = .99).
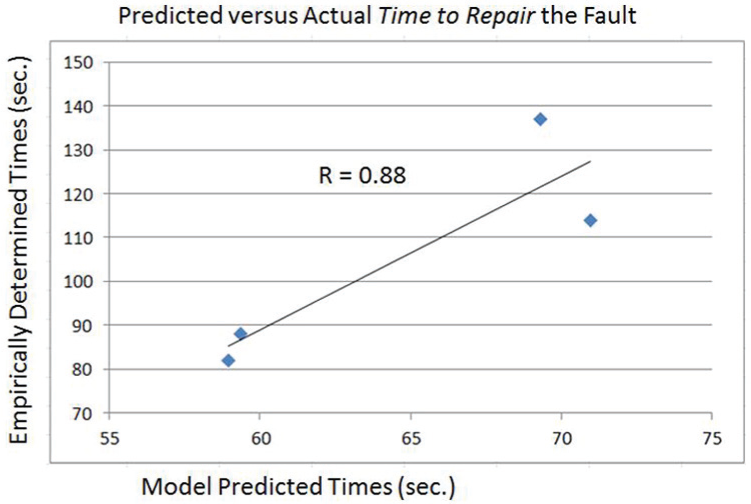
Plot of mean model-predicted (x-axis) and mean empirically determined (y-axis) time to repair fault in the process control system (r = .88).
Discussion and Conclusions
In this paper we argue, and data support the conclusion, that the higher DOA (the higher tree), as operationalized by both later stages and higher levels of automation, increasingly compromises the human response to automation failures (the harder fall following the lumberjack axe). This compromise results from the higher DOA inducing more complacency, which delays or prevents noticing the black swan automation failure. The higher DOA supports less operator engagement, decreasing understanding and lowering SA in more highly automated conditions. The loss of SA is an undesirable state fostered by increasing automation complexity and decreasing transparency and mode feedback.
The aforementioned effects were modeled in different ways to characterize three different complex systems. In all cases, these model predictions were validated with reasonably high correlations between predicted and obtained values (Wickens & Sebok, 2014). In ADAT, the validation was based on the rankings of FMS designs. In MIDAS-FAST and S-PRINT, validations were performed against actual HITL responses to unexpected automation failures in simulation studies. The capability of such modeling efforts is vital to being able to predict the appropriate DOAs and other automation system design factors that effectively support operator performance.
Importantly, each model utilized specific metrics that characterize the quality of HAI in terms of support for HRUAF. In ADAT, this metric was support for failure noticing and automation complexity. In MIDAS-FAST, it was the automation-induced complacency prediction, and in S-PRINT, it was the combined metrics of reliability, DOA, automation complexity, and failure detection and interpretation.
These three projects, summarized in Table 4, were performed sequentially, and lessons learned during one project were applied to subsequent projects. Comparing these three projects offers a set of lessons learned, divided into (a) scope, modeling, and software tool development lessons and (b) validation study lessons.
Summary and Comparison of the Three Modeling Efforts
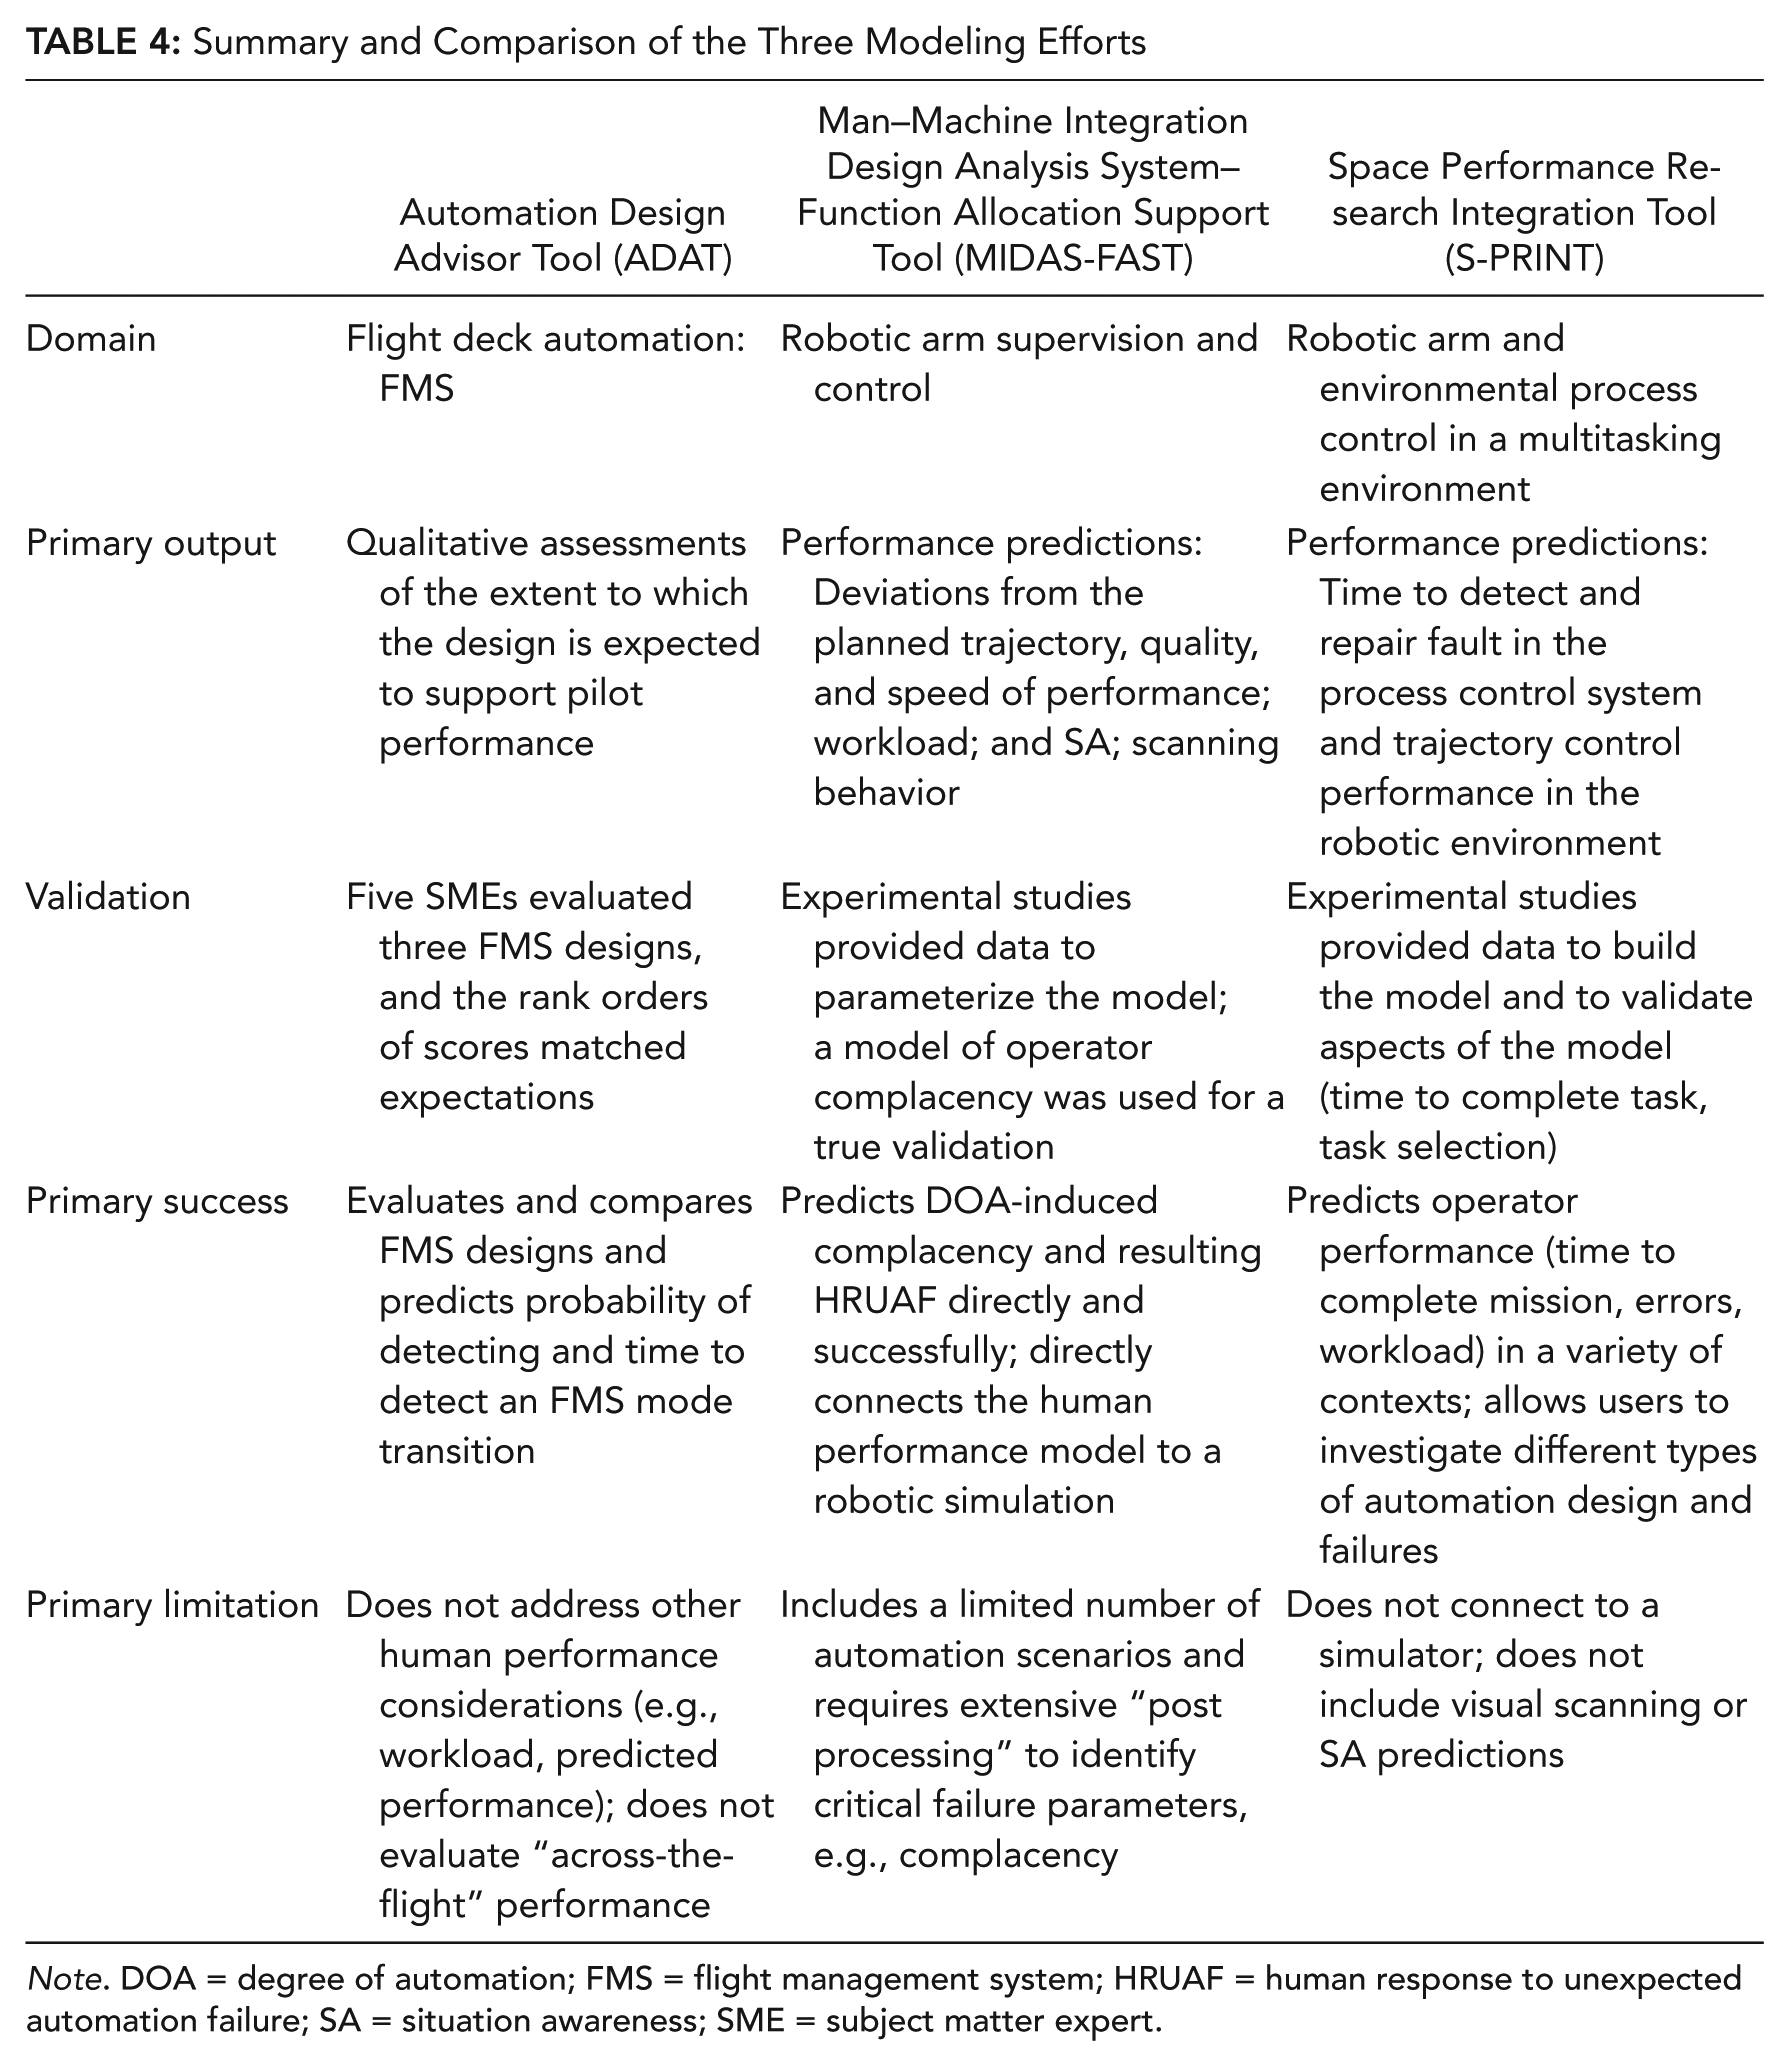
Note. DOA = degree of automation; FMS = flight management system; HRUAF = human response to unexpected automation failure; SA = situation awareness; SME = subject matter expert.
Regarding scope issues, many factors have the potential to influence HAI. Careful analysis is needed beforehand to identify those factors that are likely to have the greatest impact on operator and system performance (e.g., frame-of-reference transformation in robotic arm control; Gacy, Wickens, Sebok, Gore, & Hooey, 2011; fatigue effects on long-duration missions; Wickens, Hutchins, Laux, & Sebok, 2015). Second, trade-offs are needed to decide what should be modeled. The additional realism gained by connecting a model to a simulator can result in more accurate predictions, but it can create a less usable system. Third, a dynamic model of human performance that predicts a variety of performance parameters across the mission offers far more insights into expected human–system performance than a simple design assessment tool. Such a model, running multiple iterations, can provide measures of variance in outputs, such as response time to failure. Fourth, if failure response is of interest, there should be ways for users to identify a variety of failure types, such as the distinction between errors of omission (failing to detect) and errors of commission (following an inappropriate automation recommendation for action; Wickens, Clegg, et al., 2015). Fifth, the tool should be developed to allow extensibility. S-PRINT, as an example, allows users to develop completely new human performance models to evaluate a wide variety of automation types.
Another key point from this work is that validation efforts are necessary for establishing model credibility, particularly when the models attempt to predict human performance in complex work environments. It is sometimes possible through knowledge of previous studies in the empirical literature to identify a study with conditions that are similar to those predicted by the model. The empirical findings can be compared with model predictions and provide support for the validity of model predictions. One important caveat is that the scenarios investigated in the experiment must be similar enough to those predicted by the model that comparisons can be justified.
Although previous studies can be useful for validation, it is generally desirable to perform targeted empirical studies that specifically examine the same scenarios as the model predicts. These studies need to be planned carefully to identify what parameters will be compared and then ensure that the experiment includes those performance measures. Targeted validation studies must gather the same performance parameters (e.g., time to complete mission, deviations from the trajectory) as the model predicts. It is also highly desirable to include the same types of measures in the experiment as are predicted by the model (e.g., workload, SA). However, collecting the same types of measures is typically challenging, as models often predict continuous workload or SA, and experiments typically gather discrete subjective workload measures and SA snapshots. It is possible to gather continuous physiological measures of workload to compare with model-predicted workload functions, and it is also possible to collapse (integrate or average) model-predicted workload or SA across a scenario.
Finally, for stochastic models that attempt to predict a variety of human performance metrics, a full model validation is virtually impossible. Models that predict multiple parameters quickly extend beyond what is possible to evaluate in an HITL experiment. However, by identifying key parameters—those considered most important for the end users of the model—it is possible to develop the study to test these most relevant issues and thereby validate models for these critical parameters.
Key Points
The lumberjack analogy specifies that as the degree of automation increases, routine performance improves, but performance is more severely degraded in automation failure conditions.
Automation failures, particularly in highly reliable systems, are unexpected “black swan” events that are vulnerable to being overlooked by operators.
Three human performance model–based tools that include these two principles have been developed to predict operator performance in different automation conditions.
Subject matter expert and empirical validations provide evidence for the quality of model predictions in identifying the impacts of automation design and failure on operator performance.
Footnotes
Acknowledgements
The projects described in this paper were supported by three NASA grants: NNX07AT79A (ADAT), NNX09AM81G (MIDAS-FAST), and NNX12AE69G (S-PRINT). The authors would like to thank the NASA project sponsors and our fellow researchers. In addition, we thank the many subject matter experts who contributed to each of these projects. Any opinions, findings, conclusions, or recommendations expressed in this publication are those of the authors and do not necessarily reflect the views of NASA.
Angelia Sebok is a principal human factors engineer and program manager at Alion Science and Technology. She earned her MS degree in industrial and systems engineering from Virginia Tech in 1991, and she is a Certified Human Factors Professional (CHFP).
Christopher D. Wickens is a professor emeritus of aviation and psychology at the University of Illinois. He is currently a consulting senior scientist for Alion Science and Technology and a researcher and visiting professor at Colorado State University.