
Abstract
Objective:
Assess the influence of background music tempo on driving performance.
Background:
Music with a fast tempo is known to increase the level of arousal, whereas the reverse is observed for slow music. The relationship between driving performance and level of arousal was expected to take the form of an inverted U-curve.
Method:
Three experiments were undertaken to manipulate the musical background during driving. In Experiment 1, the driver’s preferred music track played at its original and modified (plus or minus 30%) tempo were used together with the simple ticking of a metronome. In Experiment 2, music tracks of different tempos were played during driving. In Experiment 3, music tracks were categorized as arousing or relaxing based on the associated perceived level of arousal.
Results:
Listening to music tended to influence drivers’ performances in a car-following task by improving coherence and gain adjustments relative to the followed vehicle but simultaneously shortened the intervehicular time. Although the tempo of the music per se did not directly affect driving behavior, arousing music tracks improved drivers’ adjustments to the followed vehicle (Experiment 3).
Conclusion:
The tempo of the music listened to behind the wheel was not found to influence driving behaviors. However, arousing music improved drivers’ responsiveness to changes in the speed of the followed vehicle. However, this benefit was canceled out by a reduction in the drivers’ intervehicle safety margin.
Application:
Listening to arousing music while driving cannot be considered to improve road safety, at least in a car-following task without attentional impairments.
Introduction
Listening to music is a crucial human activity that is associated with about 130 functions. These are grouped together into three meta-functions called the “Big Three of music listening.” Thus, music has the effect of (a) regulating arousal and mood, (b) promoting self-awareness, and (c) expressing social relatedness (Schäfer, Sedlmeier, Städtler, & Huron, 2013). Music listening takes place in a variety of locations (Rentfrow & Gosling, 2003). People report that they mostly listen to music in their vehicles, more so than at home or while exercising. Indeed, drivers listen to music about 75% of the time when they are behind the wheel (Dibben & Williamson, 2007).
Music can be described as a complex stimulus consisting of various components such as mode, tempo, harmony, rhythm, pitch, and tone. Among all the characteristics of music, tempo has received a great deal of attention and is known to have a major impact on a variety of human behaviors (e.g., Angel, Polzella, & Elvers, 2010; de Waard, Edlinger, & Brookhuis, 2011; Edworthy & Waring, 2006). The purpose of this contribution is to better describe and understand the influence of music tempo on driving. Tempo is defined as the speed of a piece of music in beats per minute (BPM): from largo (40 or fewer BPM) to prestissimo (200 or more BPM). A relationship exists between the tempo of the music and the listener’s level of arousal. Fast music increases the level of arousal, whereas slow music reduces arousal (Dillman Carpentier & Potter, 2007; Holbrook & Anand, 1990; Husain, Thompson, & Schellenberg, 2002). Moreover, and as set out in Kahneman’s (1973) theory, the level of arousal modulates the quantity of available attentional resources. The pool of available attentional resources grows with the level of arousal until the complete pool of attentional resources is allocated. After that point, an increase in arousal causes performance to deteriorate (see Young, Brookhuis, Wickens, & Hancock, 2015, for a review).
Overall, it is expected that driving performance will be influenced by the tempo of the music due to the modulation of the level of arousal. Fast music should result in an increase in arousal, which should, in turn, affect driving behaviors (e.g., increased responsiveness to changes in the driving environment, Beh & Hirst, 1999). The reverse might be expected for slow music. However, and contrary to the relationship between music tempo and level of arousal, it should be noted that the relationship between the level of arousal and driving behaviors is not expected to be linear. Instead, an inverted U-curve is expected (Yerkes & Dodson, 1908). Thus, both excessively high and low levels of arousal should negatively affect human driving performance (Young et al., 2015).
In an early study, music was found to increase vehicle speed regardless of tempo. The number of actions on the steering wheel and pedals was also found to increase with fast music and decrease with slow music as compared to a no-music (NM) condition (Konz & Mcdougal, 1968). In a simulated driving study, four auditory backgrounds were compared: (a) NM control condition, (b) slow-tempo music (SM) tracks ranging from 40 to 70 BPM, (c) moderate tempo music tracks ranging from 85 to 110 BPM, and (d) fast-tempo music (FM) tracks ranging from 120 to 140 BPM. The tracks with the fastest tempos led to higher driving speeds and increased the number of lane crossings and ignored red traffic lights (Brodsky, 2001).
The mixed results found for music tempo on driving speed—namely, a general increase (Konz & Mcdougal, 1968) in driving speed for all tempo conditions compared to a continuous increase related to the fast tempo only (Brodsky, 2001)—might be due to the different driving environments tested. Driving is a complex situation requiring the completion of a variety of tasks (e.g., Fastenmeier & Gstalter, 2007). It is therefore possible that background music tempos may have different impacts on these driving subtasks. A task relying on visuo-attentional processes and representative of driving activity should be the most suitable driving situation for examining the influence of tempo effects on driving. We selected a well-known and controlled car-following situation as the reference task for driving situations (see Brackstone & Mcdonald, 2000, for a review). We find this task particularly well suited because in it drivers are required to give continuous attention to adjust their own vehicle speed to changes in the followed vehicle speed (Ünal, de Waard, Epstude, & Steg, 2013; Ünal, Steg, & Epstude, 2012).
In Konz and McDougal’s (1968) and Brodsky’s (2001) experiments, the tempo was manipulated by using different music tracks. As a result, the different tempo conditions were accompanied by differences in other music components (e.g., mode, rhythm, tone, and pitch). A different approach was used in Experiment 1, in which a given music (1a) or auditory (1b) track was played at different tempos in a car-following task. It was expected that this original manipulation of the auditory background tempos would further detail previous results and allow us to assess whether tempo is the only music component responsible for the observed effects on driving performances. In Experiment 2, the same music tracks as those used by Brodsky (2001) were used to evaluate the effects of music tempo in the car-following task. In Experiment 3, instead of using a tempo-centered approach, we proposed a human-centered approach to categorize the arousal level of music tracks. The main objective of this article was to assess the influence of the background music tempo on driving performance in a car-following task by manipulating the tempo in various ways: changing only the tempo of a given audio track (Experiment 1), using different music tracks with different tempos (Experiment 2), or obtaining a subjective assessment of music tempo and associated arousal level (Experiment 3). Given a medium, neutral level of arousal prior to the experiment, it was hypothesized that fast music would increase the drivers’ arousal and consequently improve driving performances. The reverse was expected for slow music, which was expected to reduce arousal and consequently also the level of attentional resources deployed. This, in turn, would lead to an impairment of driving performance.
Experiment 1
Method
Participants
Twenty-four participants (11 females and 13 males) from 20 to 35 years of age (mean age = 22.7 ± SD = 3.5 years) and with 2 to 17 years of driving experience (mean = 4.2 ± SD = 3.3 years) took part in the experiment. They were recruited by means of notices posted in the local community and advertisements in a local community newspaper. All of them had normal audition and normal or corrected-to-normal vision. None experienced motion sickness.
Simulator
These experiments (1a and 1b) were conducted on a fixed-base simulator. The driving scene was played on a 19-inch screen with force-feedback steering wheel and pedals; Logitech G27® were used to control the simulated vehicle. The open-source OpenSD2S software (Institut Image–Le2i/CNRS, ENSAM & Renault; Filliard et al., 2010) was used for the driving simulation. The same simulated environment, consisting of a two-lane main road with no traffic, was used to perform a car-following task. At the beginning of the simulation, the leading vehicle was parked at the edge of the carriageway and then pulled out 50 m in front of the driven vehicle. The car-following task then lasted for 3 min, during which the leading vehicle periodically varied its speed between 45 and 95 kph. The same constant acceleration and deceleration rate (0.463 m.s–2) was used three times (i.e., one acceleration and deceleration per minute), resulting in an increase and then a decrease of 50 kph. The leading vehicle then parked on the right side of the road, and the driver had to pass it and park about 30 s later. Analyses were carried out only on the car-following task, that is, the period during which the lead vehicle was present.
Musical backgrounds
Arousal is linked to musical preferences (Schäfer & Sedlmeier, 2011), and listening to one’s preferred music increases arousal (de Jong, Van Mourik, & Schellekens, 1973; Hirokawa, 2004). Thus, each participant’s preferred music was considered the optimum auditory background for promoting arousal. Before the experiment, the participants were asked to bring their own preferred music track, referred to as “Music” in the following. During Experiment 1, each participant performed the car-following task under seven auditory background conditions:
(1) NM control condition
Experiment 1a: musical backgrounds:
(2) Music in original tempo without modification (M) (3) M increased by 30% (M+30) (4) M decreased by 30% (M–30)
Experiment 1b: metronome backgrounds:
(5) Metronome ticking at the same tempo as the original music (Met) (6) Met increased by 30% (Met+30) (7) Met decreased by 30% (Met–30)
Half of the participants started the experiment with the musical backgrounds and the other half with the metronome backgrounds. In both cases, the order of presentation of the auditory background conditions was counterbalanced using a Latin-square design. Audacity® (http://audacity.sourceforge.net/) was used to play the music brought by the participants, and the TempoPerfect free software (http://www.nch.com.au/metronome/index.html) was used for generating the metronome ticking, both played through two lateral powered monitor speakers (Yamaha MSP3) located to the left and right of the driver for the complete duration of the car-following task, re-creating a sound quality at least as good as those of standard car stereo systems. The tempo of the music was modified without altering the pitch in any way using the SoundTouch library from Audacity® just before starting the experiment. Because music intensity (i.e., loudness) affects human performances while driving (Dalton & Behm, 2007), this was fixed at 70 dB (Audacity® amplification and normalization functions combined with a sound-level meter Manutan 8852SI®) for all the auditory backgrounds except for the NM condition. In all conditions, the car engine sound effects (±25 dB) were present.
Procedure
The study was approved by the Ethics Committee of the Department of Psychology of Lyon, and informed consent was obtained from all participants. After being welcomed and after having their preferred music track collected, the participants were equipped with a heart rate belt (combined with a Polar® RC3 watch) and were familiarized with the driving simulator. Then, they completed the Brief Mood Introspection Scale (BMIS; Mayer & Gaschke, 1988) to ensure that their level of arousal was not extremely high or low. They were then given the instructions for the car-following task and were asked to follow the leading vehicle at a close but safe constant distance, as if following a friend on an unknown route. Finally, they were asked to try out the car-following task a first time to familiarize themselves with it. Then, the experiment itself started, and each participant was exposed to the seven auditory backgrounds. A 4-min break was inserted after the completion of each task in order to prevent carry-over effects. During this period, the participants were asked to complete the BMIS. The experiment lasted for about 90 min: 15 min to equip the participants, give them their instructions, familiarize them with the driving simulator and complete the first BMIS, plus about 55 min for the experiment itself and a 20-min break between the musical and metronome backgrounds. During the break, the participants were allowed to stand up, stretch, go to the restroom, and walk around.
Data analysis
Objective and subjective data on the level of arousal, together with driving performance data, were collected for each auditory background. The level of arousal was recorded based on the mean heart rate (Brodsky, 2001; Mehler, Reimer, Coughlin, & Dusek, 2009; Ünal et al., 2013). In addition, the participant’s subjective mood on the dimensions of both arousal (referred to as level of arousal in the following) and valence (referred to as the level of pleasantness) was also assessed for each auditory background. The quality of performance on the car-following task was assessed through four dependent variables: (a) the mean intervehicular time (IVT) or the time interval that separates the driven vehicle from the leading vehicle—the higher the IVT, the greater the safety margin to the lead vehicle; (b) a coherence ratio, that is, a squared correlation indicating the accuracy of speed adjustments at the driven vehicle relative to the leading vehicle (from 0 = no coherence to 1 = perfect coherence); this reflects the quality of the adaptation of the driver’s speed to the leading vehicle speed—the higher the coherence value, the better the car-following performance; (c) delay, that is, a measure of the time needed by drivers to react to changes in the leading vehicle speed, with faster reactions leading to shorter delays; and (d) gain, an amplification factor that qualifies the amplitude of the driver’s speed adjustments (a gain of 1 would indicate a driven vehicle speed adjustment that is exactly proportional to the change in speed of the leading vehicle; a gain greater than 1 indicates an overreaction; and a gain less than 1 an underreaction). These variables were computed by adapting the CARSPAN software (Mulder, 1992) to a car-following situation (see Brookhuis, de Waard, & Mulder, 1994, for more details). The data for the musical backgrounds and NM were analyzed in Experiment 1a, and the data for metronome backgrounds and NM in Experiment 1b. Repeated-measures ANOVAs were used for all the variables, and Newman-Keuls tests were used for post hoc comparisons. The level of significance of p < .05 was used in all tests, and p < .10 was considered marginally significant.
Results
Music tempo
The participants’ preferred original tempo music tracks covered a range from 72 to 143 BPM (mean music tempo = 105 ± SD = 22 BPM). Consequently, M+30 ranged from 94 to 186 BPM (mean = 137 ± SD = 29 BPM) and M–30 ranged from 50 to 100 BPM (mean = 74 ± SD = 15 BPM). These individual values were used to set the metronome backgrounds (Met = 105 ± SD = 22 BPM, Met+30 = 137 ± SD = 29 BPM and Met–30 = 74 ± SD = 15 BPM).
Arousal
Due to a recording problem, heart rate data were lost for 1 participant, and the following data analysis was therefore conducted on 23 participants only. The statistics revealed a significant effect of the musical background on mean heart rate, F(3, 66) = 4.04, p < .02, η2 = .16 (see Figure 1, Experiment 1a), but no effect of metronome background on mean heart rate, F(3, 66) = .50, p = .68, η2 = .02 (see Figure 1, Experiment 1b). Post hoc analyses performed on Experiment 1a (musical backgrounds) revealed that the musical background with the unmodified original tempo (M) differed significantly from all other conditions (p < .05). On average, M increased heart rate by 2.7 BPM.
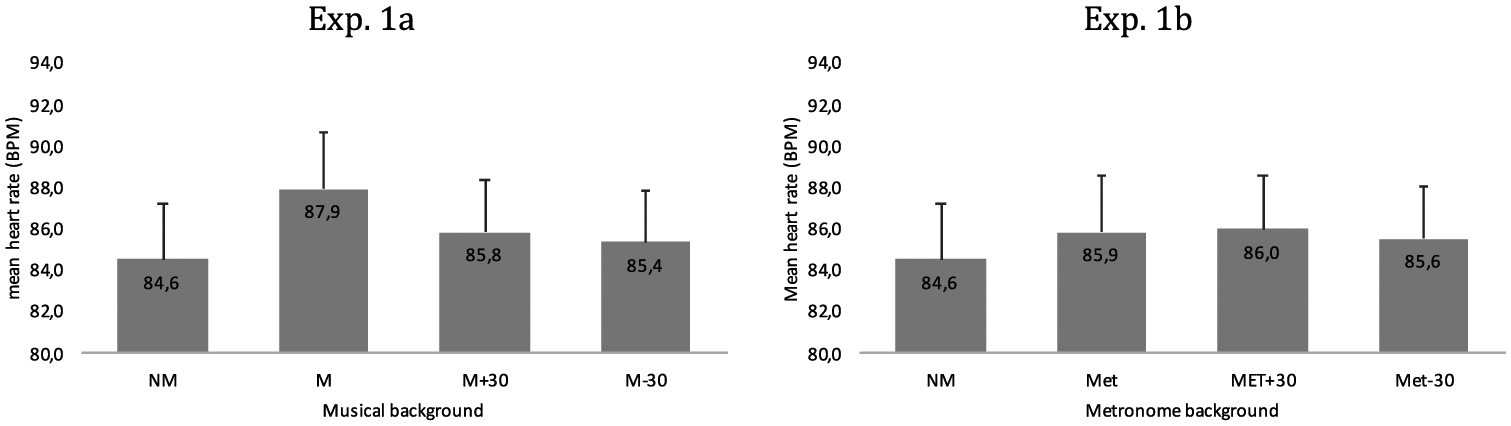
Mean heart rate in musical background conditions (Experiment 1a) and in metronome background conditions (Experiment 1b) in beats per minute.
Regarding the subjective evaluation of arousal, the data from the BMIS showed the same pattern of results, with a significant effect of musical background on the level of arousal, F(3, 69) = 5.83, p < .002, η2 = .2 (see Figure 2, Experiment 1a on top), but no effect of metronome background, F(3, 69) = 1.12, p = .35, η2 = .05 (see Figure 2, Experiment 1b on top). Post hoc analyses performed on Experiment 1a revealed that the M condition significantly differed from the NM and M–30 conditions but not from M+30 (p < .05). In addition, M+30 was found to be significantly different from the NM and M–30 conditions (p < .05).
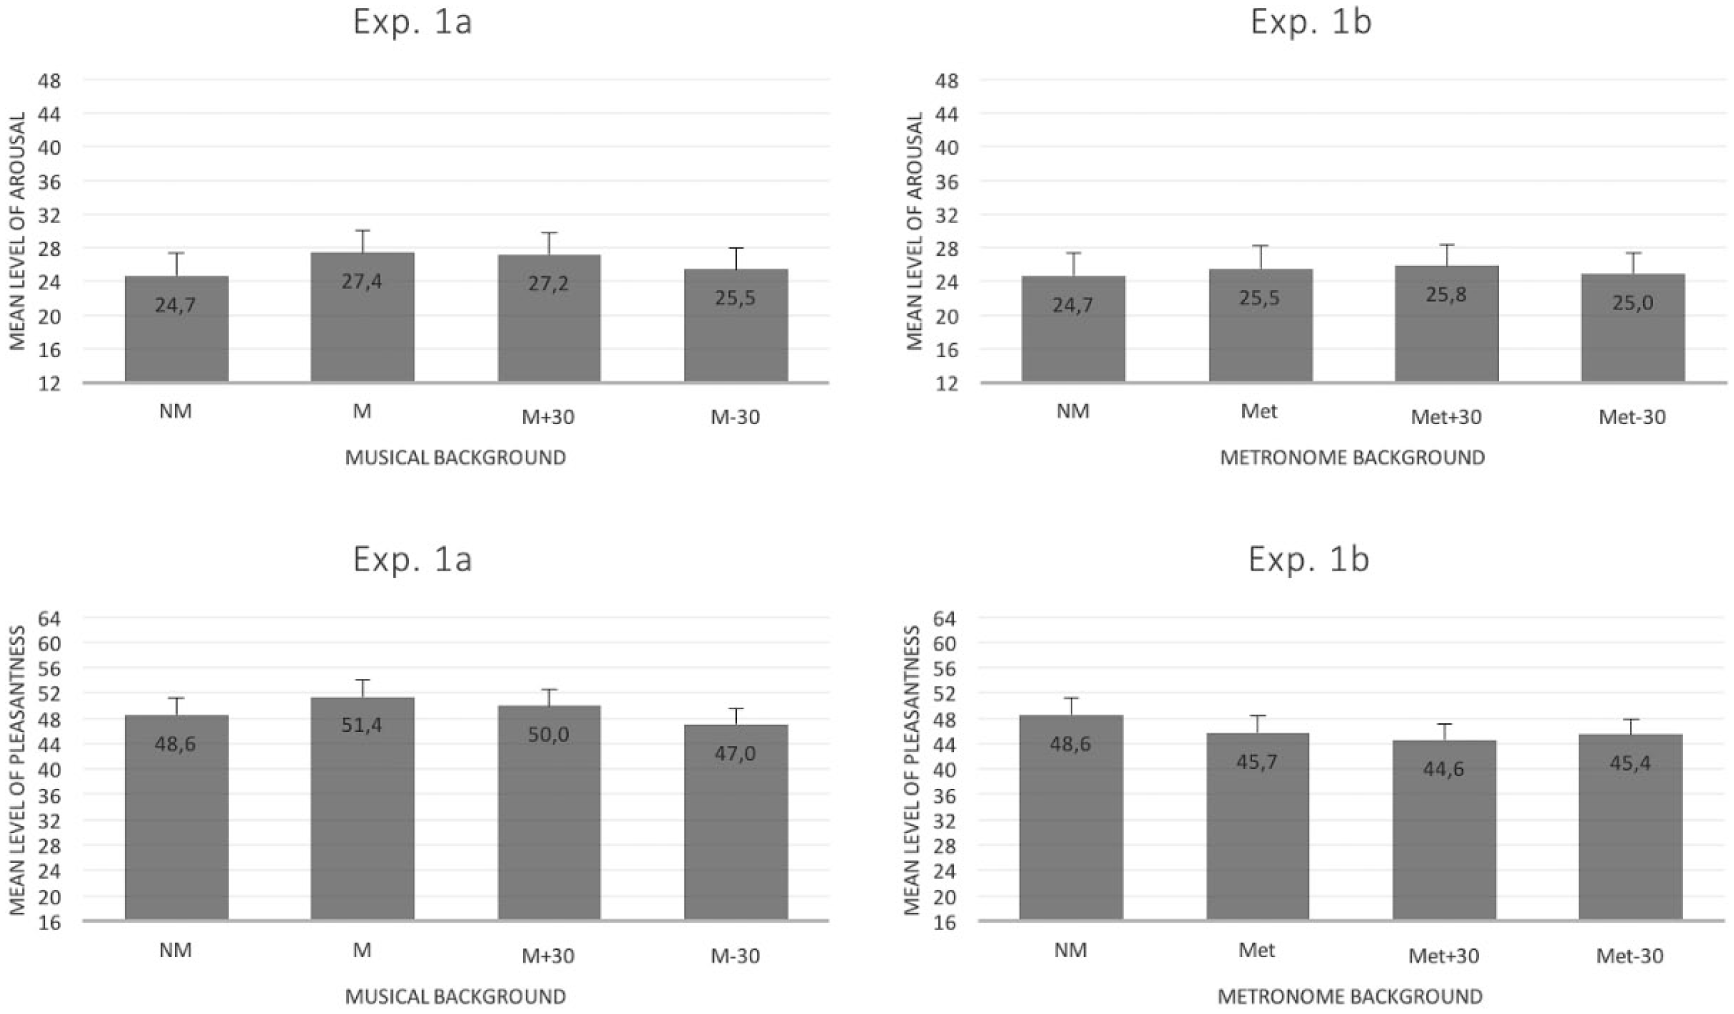
Top two graphs: mean level of arousal (score from 12 to 48) in musical background conditions (Experiment 1a) and metronome background conditions (Experiment 1b)—the higher the score, the higher the arousal level. Bottom two graphs: mean level of pleasantness (score from 16 to 64) in musical background conditions (Experiment 1a) and metronome background conditions (Experiment 1b)—the higher the score, the more pleasant the situation.
The statistical analyses also indicated a main effect of both musical background conditions, F(3, 69) = 4.19, p < .01, η2 = .15 (see Figure 2, Experiment 1a at the bottom), and metronome background conditions, F(3, 69) = 5.20, p < .01, η2 = .18 (see Figure 2, Experiment 1a at the bottom), on the level of pleasantness. Post hoc analyses revealed that M and M–30 were significantly different in Experiment 1a and that NM differed from all other conditions in Experiment 1b (p < .05).
Driving performances
The ANOVAs revealed a significant effect of musical background on IVT, F(3, 69) = 2.80, p < .05, η2 = .11 (see Figure 3, Experiment 1a), but no effect of metronome background, F(3, 69) = .55, p = .65, η2 = .02 (see Figure 3, Experiment 1b). Post hoc analyses performed on the musical backgrounds (Experiment 1a) revealed that the original music background (M) differed significantly from NM (p < .05) and marginally differed from M–30 (p < .09). Compared to NM, mean IVT was reduced by 0.63 s compared to the M background.

Mean intervehicular time in musical background conditions (Experiment 1a) and in metronome background conditions (Experiment 1b), in seconds.
The statistics did not reveal any significant effect of the musical background or metronome background conditions on coherence, delay, and gain (see Table 1).
Mean (± Standard Deviation) Coherence Ratio (From 0 to 1), Delay (in Seconds), and Gain for All Auditory Backgrounds
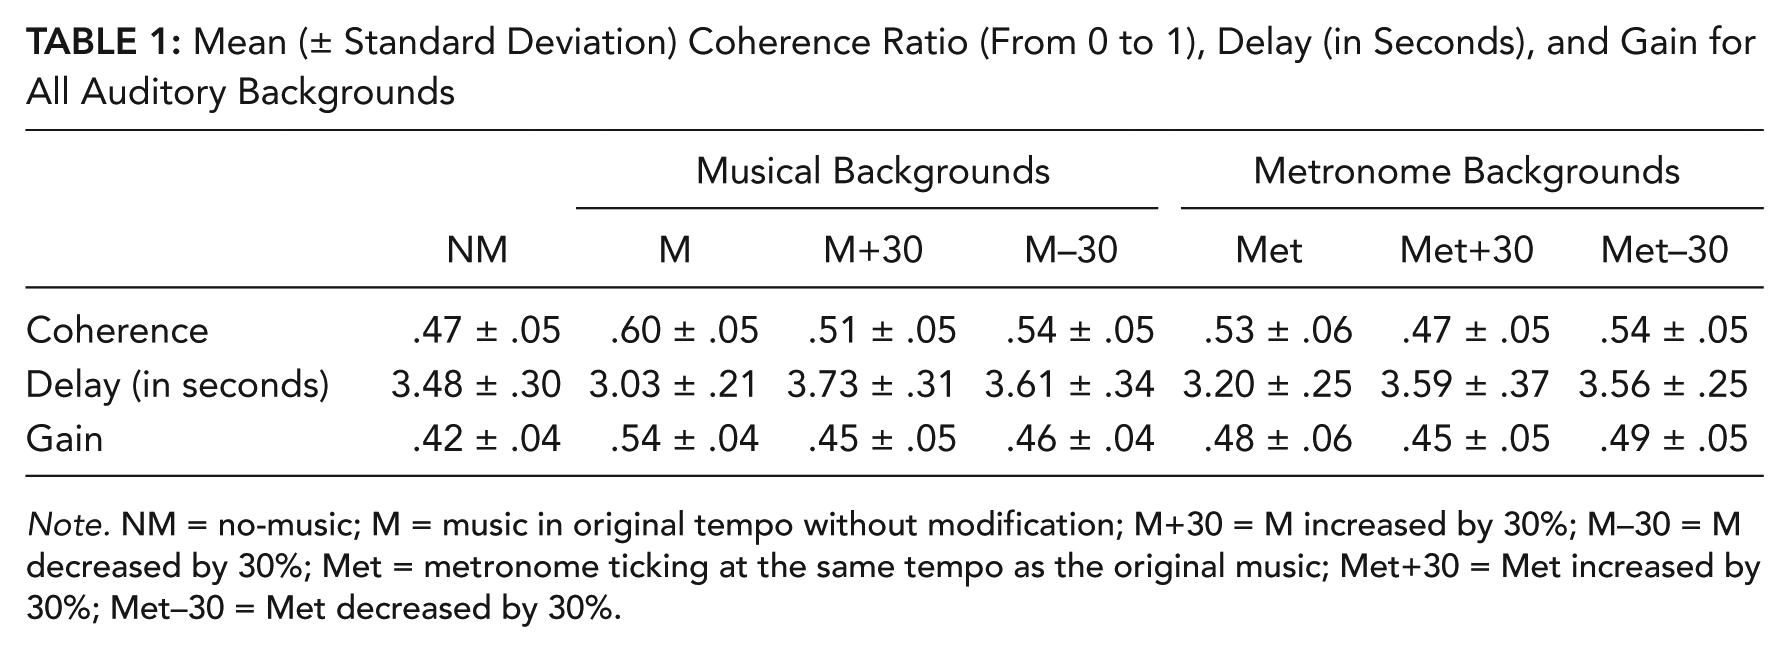
Note. NM = no-music; M = music in original tempo without modification; M+30 = M increased by 30%; M–30 = M decreased by 30%; Met = metronome ticking at the same tempo as the original music; Met+30 = Met increased by 30%; Met–30 = Met decreased by 30%.
Discussion
The use of each driver’s preferred music as musical background while performing a car-following task was found to increase the level of arousal, as determined using both objective and subjective measures of arousal, compared with the NM condition. This increased level of arousal affected driving behaviors, with IVT being shorter when the drivers listened to their original preferred music track. Listening to the preferred music reduced IVT by 15.6% on average. Although consistent with them, this effect was not observed with the other variables used to qualify car-following performances (i.e., coherence, gain, and delay). It can thus be concluded that the effect of listening to one’s preferred music on driving performances is not “overwhelming,” as previously reported for general music listening during car driving (Konz & Mcdougal, 1968). This is also confirmed by the moderate effect size that explains only 11% of the variance observed for IVT. The tempo modifications (i.e., plus or minus 30%) did not significantly affect driving performance. It should be noted that the level of arousal assessed on the basis of heart rate was not affected and that the participants judged the original music to be more arousing only than the other auditory backgrounds.
The metronome backgrounds did not have any significant effects on the participants’ levels of arousal or driving performance. This result was unexpected given our hypothesis that the tempo of the metronome and its modulations would affect drivers’ performance by modifying their arousal levels. These data reinforce the fact that modifying the tempo of a track did not bring about changes in driving performance and tend to indicate that a tempo alone, with no associated music, cannot modify either arousal or driving performance. In other words, and contrary to the observations reported in previous studies (Brodsky, 2001; Konz & Mcdougal, 1968), our data do not support the idea that the tempos of auditory backgrounds are directly responsible for changing driving behavior.
The null results on driving behaviors for Experiment 1a are particularly relevant to the overall interpretation of the results. We therefore conducted a post hoc power analysis with the program G*Power 3.1 (Baguley, 2004; Erdfelder, Faul, & Buchner, 1996; Faul, Erdfelder, Lang, & Buchner, 2007) to find out whether our design had enough power to detect an effect of different auditory backgrounds on driving behaviors. Based on IVT results, the statistical power (1 – β error probability) was of .98 and therefore well above the statistical power at the recommended .80 level (Cohen, 1988).
The average musical and metronome background tempos based on the participants’ preferred tracks were as follows: 105 BPM at original tempo M and Met, 137 BPM at M+30 and Met+30, and 74 BPM at M–30 and Met–30. This corresponds approximately to the higher range of the music tracks selected by Brodsky (2001) for moderate (85–110 BPM), slow (40–70 BPM), and fast (120–140 BPM) tempos. These correspondences were obtained based on the average tempo of the preferred music selected by participants in a previous study (Navarro, Lesourd, Osiurak, & Reynaud, 2015) and the modulation of the original tempo by plus or minus 30%. However, the influence of music tempo on driving performance reported by Brodsky (2001) was not found here whether musical backgrounds (Experiment 1a) or metronome backgrounds (Experiment 1b) were used.
Nevertheless, several limitations of the current contribution have to be considered. Using a driver’s preferred music as the baseline tempo comes at a price: The different participants did not experience either the same tempo or the same music tracks. The original tempo of the preferred music, as well as the other aspects of the music itself (e.g., style, lyrics) differed between participants. Thus, using each participant’s preferred music introduced some variability between participants, and if the experimental conditions are considered at the group level rather than at the participant level, the different musical backgrounds (M, M+30, M–30) overlap. Even if greater tempo modifications (for both M+30 and M–30 conditions) were obtained for fast-tempo original tracks compared with slow-tempo original tracks, no notable differences in terms of driving performance were observed between the different musical backgrounds. However, more systematic investigations will be required to specifically analyze whether the original music tempo might influence subsequent tempo manipulations. This limitation is not critical here, as the main objective was to compare the influence of the tempo modulation for each participant based on an individual’s preferred music track and to evaluate whether tempo manipulation results in changes in driving behavior due to changes in arousal. In sum, this manipulation was a driver-based approach rather than a music tempo–based approach, and this consequently limits comparisons with Brodsky’s (2001) music tempo–based manipulation.
Another limitation relates to the lack of control of the other aspects of the music itself and the influence of tempo manipulation on those aspects. Indeed, the strict control of music tempos in the different conditions at the participant level introduced some variability between music tracks. To overcome this limit, Experiment 1b was conducted to investigate the exclusive use of metronome ticking instead of music. The manipulation of the tempo of metronome ticks was not subject to these limitations. In addition, although the preferred music tempos were relatively homogeneous (105 ± SD = 22 BPM), tempo is only one component of music. The selected preferred music depends on each individual’s own sensibility, and correlations exist between musical tastes and a range of personality dimensions (Rentfrow & Gosling, 2003). In this regard, the BMIS questionnaires indicated at the descriptive level that although the original music (M) was perceived as the most pleasant musical background, it differed significantly only from M–30. Thus, music listening and tempo manipulation did not completely change drivers’ moods. In addition, whatever the tempo, the metronome background conditions decreased the pleasantness of the situation compared to the NM condition. Brief postexperiment interviews revealed that the participants judged the repetitive sound of the metronome to be annoying.
Overall, the data indicate that the auditory background did not have a major impact on the level of arousal and driving performance. Only the preferred music significantly affected driving performance, and no effects of metronome backgrounds or tempo changes were observed. To further investigate the influence of the tempo of selected music tracks on driving performance in the car-following task and permit a better comparison with previous results, the same musical tracks as those used by Brodsky (2001) were used in Experiment 2. The use of the same music tracks should lead to changes in driving performance similar to those reported by Brodsky (2001). Faster tracks should result in shorter mean IVTs, while slower tracks should lead to longer mean IVTs. The underlying hypothesis was that the tempo of these specific tracks combines with other musical characteristics to affect driving performance.
Experiment 2
Method
Participants
A total of 32 participants (20 females and 12 males) from 20 to 43 years of age (mean age = 23 years) and with 2 to 25 years’ driving experience (mean = 6 years) took part in the experiment. They were recruited by means of notices posted in the local community and advertisements in a local community newspaper. All of them had normal or corrected-to-normal vision. None experienced motion sickness.
Musical backgrounds
In Experiment 2, each participant performed the car-following task with four auditory backgrounds:
(1) NM control condition
(2) SM, from 40 to 70 BPM
(3) Medium-tempo music (MM), from 85 to 110 BPM
(4) FM, from 120 to 140 BPM
The 12 music tracks selected and used by Brodsky (2001) were used in this experiment (4 SM, 4 MM, and 4 FM). The order of presentation of the auditory background conditions was counterbalanced using a Latin-square design. Each participant faced a SM, a MM, and a FM track out of the 12 music tracks selected and used by Brodsky (2001). Three of these tracks were too short and thus played again for 10 to 20 s to provide a continuous music background during the car-following task. Together, all 12 music tracks were listened to within each order of presentation. Audacity® was used to play music for the complete duration of the car-following task. The intensity of the music was fixed at 70 dB for all auditory backgrounds except for the NM condition. In all conditions, the car engine sound effects (± 25 dB) were present.
Simulator, procedure, and data analysis
The simulator and driving simulation used in Experiment 1 were also used in Experiment 2. The same procedure and data analysis were followed. The experiment lasted for about 45 min per participant: 15 min to equip the participants, give them the task instructions, familiarize themselves with the driving simulator, and complete the first BMIS plus approximately 30 min for the experiment itself.
Results
Arousal
Due to a recording problem, heart rate data were lost for 1 participant, and the data of the remaining 31 participants were therefore analyzed. The statistics did not reveal any significant effect of auditory background on mean heart rate, F(3, 90) = 2.05, p = .11, η2 = .06, which varied between 85.8 BPM for the NM background and 87.5 BPM for the FM background, passing through 86.5 and 86.7 BPM for the SM and MM conditions, respectively. As far as the subjective data are concerned, the BMIS questionnaires did not reveal any significant effect of the auditory background on the level of arousal (mean observed effects: NM = 28.4, SM = 28.2, MM = 28.8, FM = 28.6; F[3, 93] = .48, p = .69, η2 = .02) or on the level of pleasantness (mean observed effects: NM = 50.3, SM = 50, MM = 50.5, FM = 50.9; F[3, 93] = .64, p = .59, η2 = .02).
Driving performances
Due to a technical problem, driving data were lost for 1 participant, and the data from the remaining 31 participants were therefore analyzed. The ANOVAs revealed a nonsignificant trend of auditory background on IVT, F(3, 90) = 2.32, p = .08, η2 = .07 (see Figure 4, top left), and a significant effect of auditory background on delay, F(3, 90) = 3.6, p < .02, η2 = .1 (see Figure 4, bottom left). Post hoc analyses revealed that the NM background significantly differed from all the musical backgrounds (p < .05). The delay in adjusting the vehicle speed to changes in the speed of the leading vehicle was reduced in the presence of music, independent of the tempo (SM, MM, and FM).
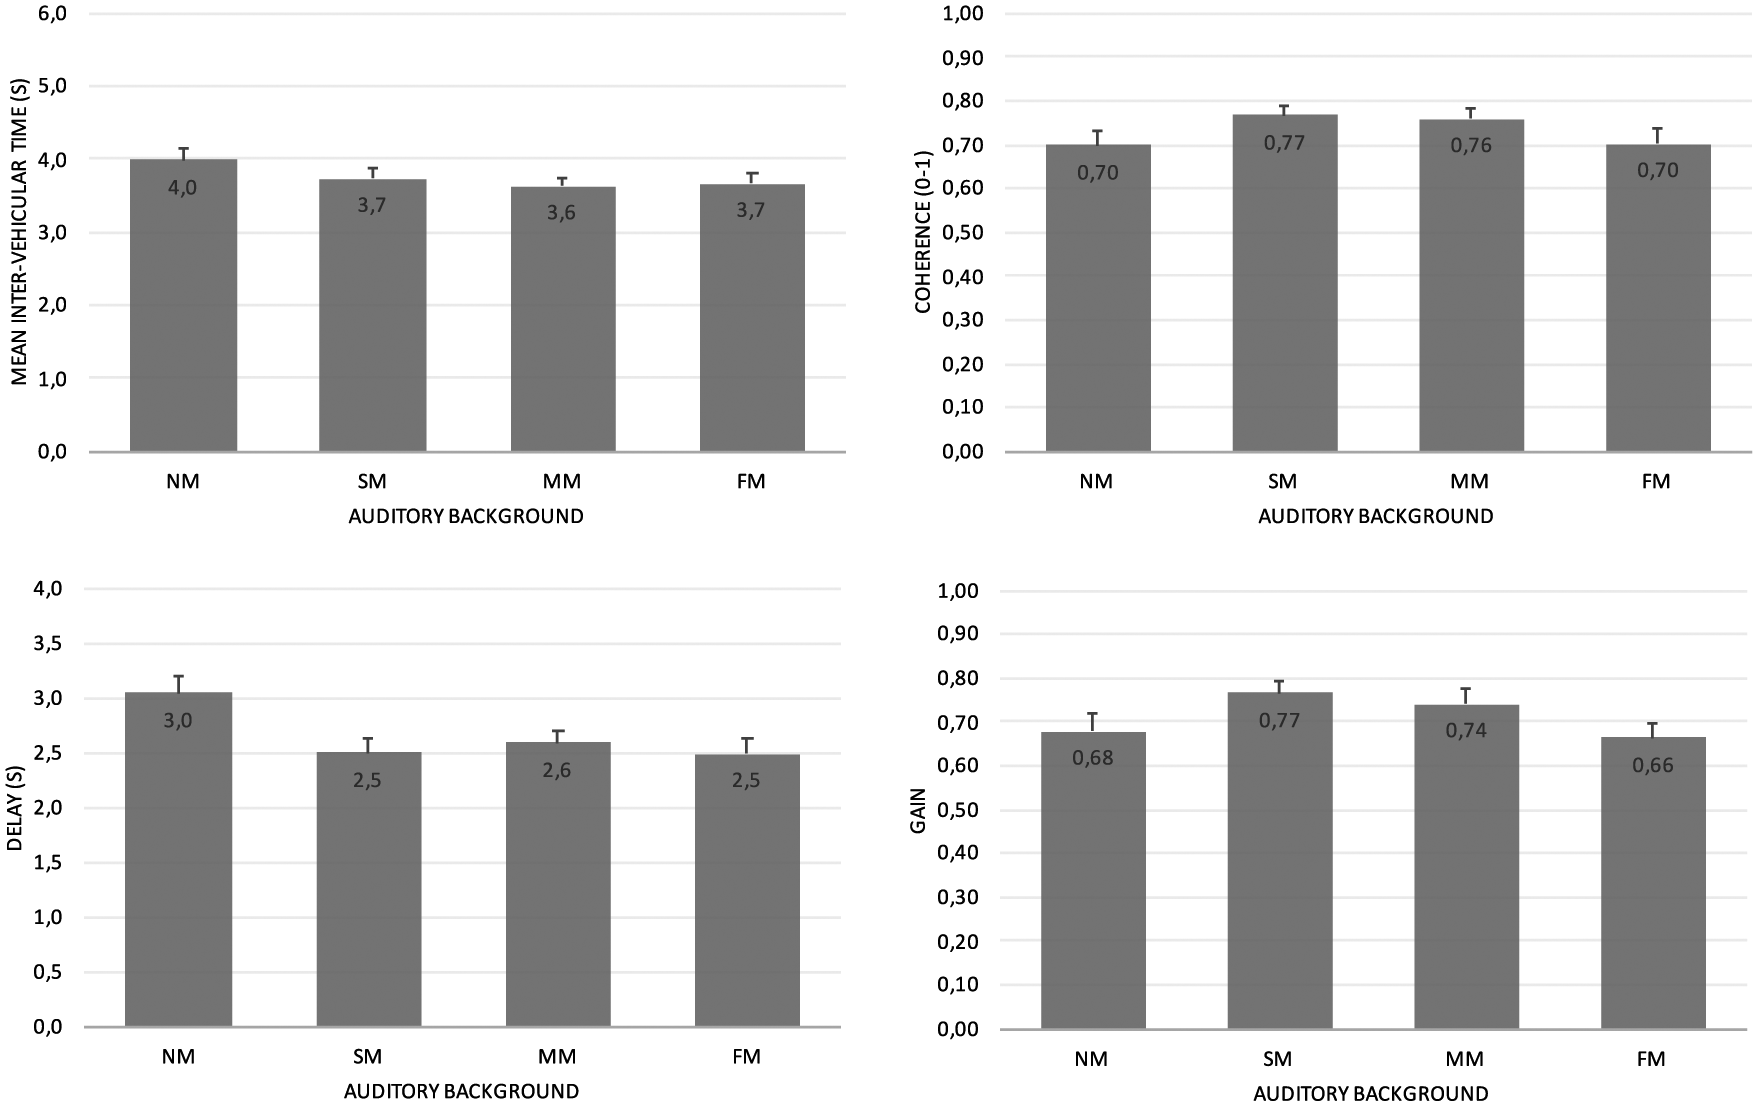
Left: mean intervehicular time (in seconds) at the top and delay (in seconds) at the bottom. Right: mean coherence (from 0 to 1) at the top and gain at the bottom.
The statistical analyses also indicated a marginally significant influence of auditory background on coherence, F(3, 90) = 2.2, p = .09, η2 = .07 (see Figure 4, top right), and a significant impact on gain, F(3, 90) = 2.95, p < .04, η2 = .09 (see Figure 4, bottom left). Post hoc analyses revealed that only the FM background differed significantly from SM (p < .05). The gain in response to changes in the speed of the leading vehicle was higher in the SM condition than in the FM condition.
Discussion
The auditory background did not have any significant impact on the participants’ objective or subjective level of arousal. This finding is consistent with the results reported by Brodsky (2001) but not with the musical background effects reported in Experiment 1a, wherein listening to preferred music was found to increase the drivers’ arousal levels. It could be hypothesized that listening to one’s preferred music is more arousing than listening to tracks selected by the experimenters as suggested in previous research (Brodsky & Slor, 2013). Despite the absence of influence on arousal, listening to music improved drivers’ reactivity to the changes of the leading vehicle speed, as revealed by the reduction in the delay in response to all musical backgrounds, independent of the tempo. This increase in reactivity is consistent with the marginally significant reduction of IVT in the presence of background music.
Slow music increased the gain in the drivers’ responses to changes in the speed of the leading vehicle compared to fast music. This was the only significant effect (although moderate in terms of size effect) of music tempo on driving performance and is consistent with the descriptive results collected for the coherence between the leading vehicle and the driven vehicle. Slow music seems to improve drivers’ reactivity (observed in the reduced delay) and improve quality of driving behavior (observed in the increase in gain and coherence) but also reduce safety margins (shorter IVT). Gain and coherence were higher in the SM condition than in the NM condition, whereas the results for the FM and NM conditions were very similar.
The nonsignificant results on driving behaviors for Experiment 2 are particularly relevant to the overall interpretation of the results. We therefore conducted a post hoc power analysis with the program G*Power 3.1 (Baguley, 2004; Erdfelder et al., 1996; Faul et al., 2007) to find out whether our design had enough power to detect an effect of auditory backgrounds on driving behaviors. Based on IVT results, the statistical power (1 – β error probability) was of .97 and therefore greater than the statistical power at the recommended .80 level (Cohen, 1988).
The effects of music tempo on driving performance previously reported by Brodsky (2001) were not reproduced in the current experiment even though the same music tracks and associated tempos were used. As in Experiment 1a, some limited amplitude effects of music in general were found on driving behavior in a car-following task, but only a very limited influence of music tempo was found, suggesting that objective music tempo is not a key factor capable of affecting driving performance.
However, it must be pointed out that Experiment 2 was not a replication of Brodsky’s (2001) experiment. Indeed, it differs from it on a number of methodological points. First, the drivers were exposed to only one variant of the same music stimuli, whereas the drivers in Brodsky’s study heard four variants per driving condition. Second, the current study investigated car-following for 3 min per tempo instead of 8 min in Brodsky’s original experiment. Third, although the driven vehicle speed was limited by the employed car-following task here, the drivers in Brodsky’s study were not given a speedometer and did not comply with speed limits, despite instructions to “simulate normal driving” and to “abide by safety and highway codes” (p. 231). Fourth, in the current study, the participants listened to music at a volume of 70 dB, whereas the drivers in Brodsky’s study heard music at a volume of 85 dB. Previous studies have shown that the listening volume of the music could have an impact on driving behavior (Beh & Hirst, 1999; North, Hargreaves, & McKendrick, 1999). Since a replication would have required the same experimental design, the purpose of Experiment 2 was to use previously validated music tracks in more ecological conditions (Hoc, 2001). This involved listening once to a short track played at a moderate volume for the duration of the exercise while driving with a speedometer in a constrained car-following task and complying with the highway code.
In Experiment 3, the focus was placed on the perceived musical tempo, arousal, and valence rather than on the objective tempo. As a result, musical valence, initially excluded from the experimental manipulations, was introduced in combination with arousal and musical tempo. In a pilot experiment, the participants were required to judge the tempo, arousal, and emotional valence of more than 100 tracks. Based on the collected results, the tracks were classified into four clusters on the basis of their perceived arousal and valence. Four groups of music tracks were created: (a) arousing and positive valence, (b) arousing and negative valence, (c) relaxing and positive valence, and (d) relaxing and negative valence. In the main driving simulator in Experiment 3, these four clusters of tracks were then played as background music in addition to a NM background.
Experiment 3
Nature of the Musical Backgrounds
Questionnaire
To classify and select music tracks based on drivers’ subjective perceptions, a questionnaire was designed containing the 160 best-selling singles in France in 2015 (official data from the French Syndicat National de l’Edition Phonographique). Participants were given the opportunity to listen to any of the tracks for as long as they needed if they wished. Each track then had to be given a rating between 0 and 10 along four dimensions assessed by means of the following questions: (a) How do you perceive the speed of the music (tempo)? From very slow (0) to very fast (10); (b) What emotion does this track cause? From very negative (0) to very positive (10); (c) How arousing is this music track? From very relaxing (0) to very arousing (10); and (d) Would you listen to this music track while driving? From not at all (0) to very much (10). Such subjective music assessments have been shown to be effective (Fairclough, van der Zwaag, Spiridon, & Westerink, 2014; van der Zwaag, Fairclough, Spiridon, & Westerink, 2011). The questionnaire was completed in early 2016 via a Web interface, and the tracks were presented in random order. The experimenters also measured the real tempo of each music track using the MixMeister BPM Analyzer® software.
Participants
Seventy participants (50 females and 20 males) from 20 to 44 years of age (mean age = 25.2 years) with 1 to 11 years’ driving experience (mean = 3.9 years) filled in the questionnaire.
Results and discussion
Table 2 summarizes the overall results in the form of correlations between the dimensions assessed and the real tempos of the tracks. Real music tempo was significantly correlated with both perceived tempo and arousal. The strength of these correlations (r = .53 and r = .48) was moderate, indicating that perceived arousal and tempo were not dependent solely on the real tempo. Furthermore, perceived arousal and perceived tempo were extremely strongly correlated (r = .94), suggesting that the participants considered tempo and arousal to be almost equivalent dimensions. A weak, positive, significant correlation (r = .23) was observed between perceived arousal and perceived valence. This indicates that the music tracks tended to be judged as either both arousing and positive or both relaxing and negative. Finally, only perceived valence was found to be linked (r = .91) to the participants’ willingness to listen to the music tracks while driving. Positive music tracks were found to be very strongly associated with willingness to listen while driving. This finding extends previous results showing more positive mood states and enjoyment in trips with the driver’s preferred music compared to trips with another music background (Brodsky & Slor, 2013).
Pearson Correlation Matrix Crossing the Real Tempo of All the Music Tracks With Perceived Tempo, Perceived Arousal, Perceived Valence, and Propensity to Listen to Music While Driving
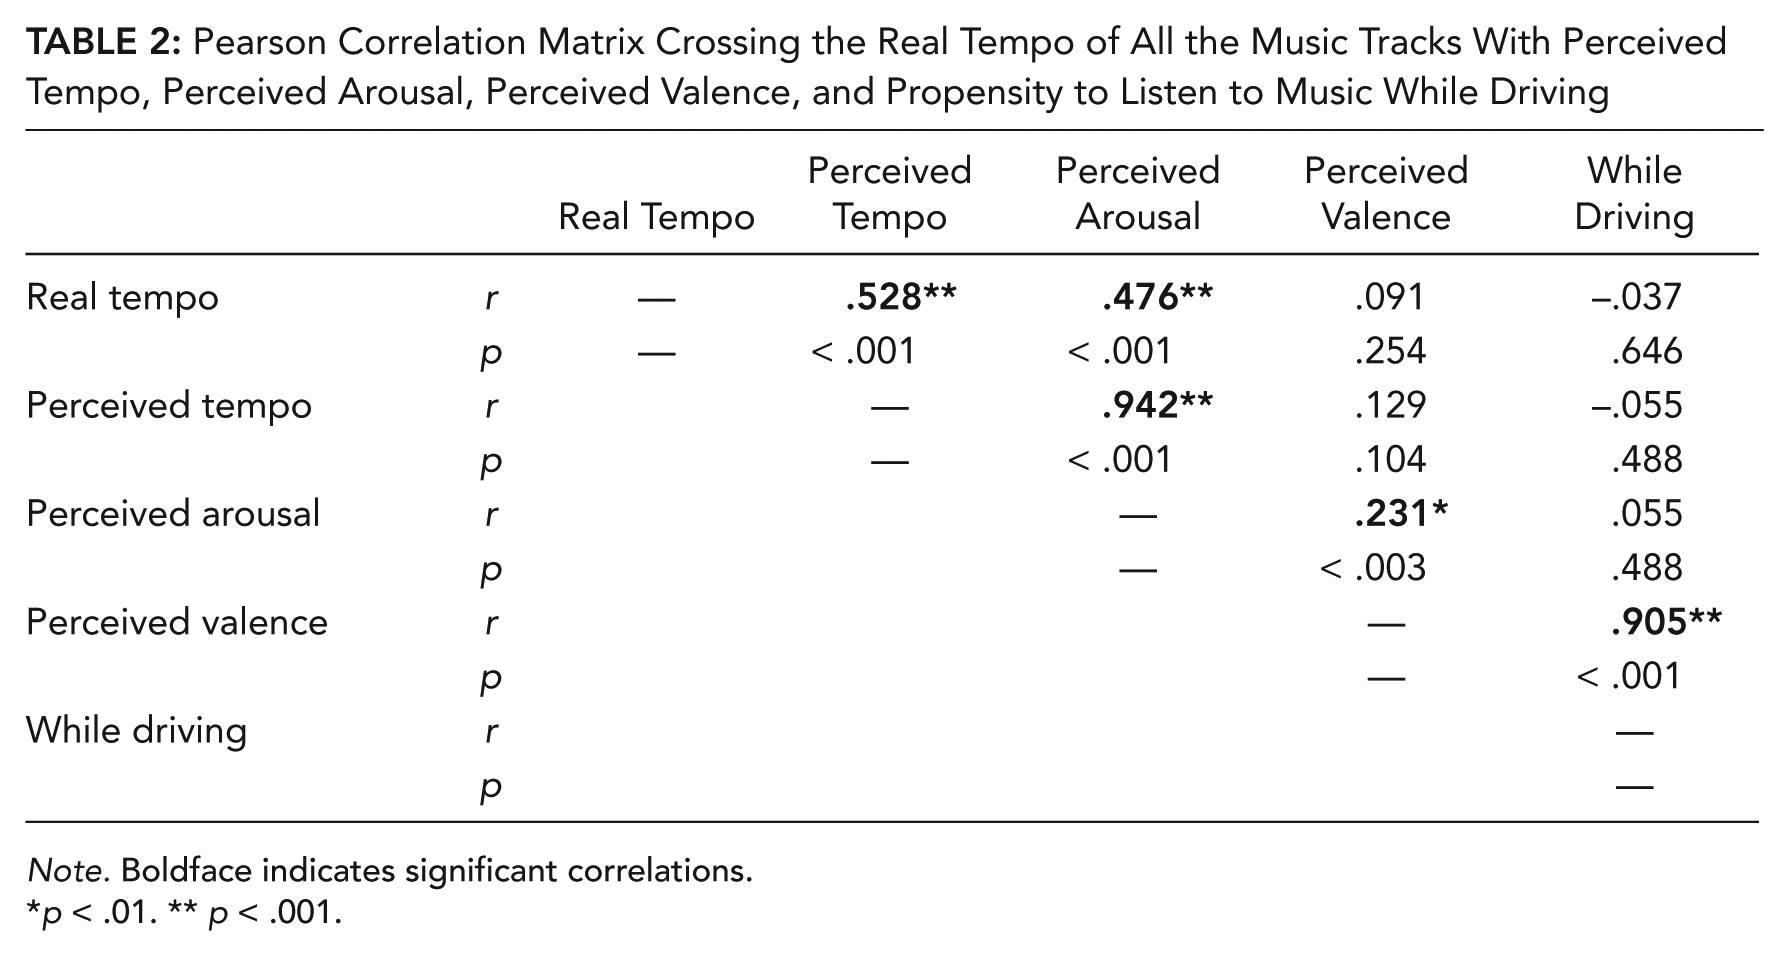
Note. Boldface indicates significant correlations.
p < .01. ** p < .001.
Music track clusters
Four clusters of tracks were defined based on the perceived arousal and perceived valence data. For this we employed a k-means clustering algorithm (Bishop, 2007) forcing the data to be partitioned in four clusters, created with the aim to minimize the similarity of examples within a cluster and to maximize the dissimilarity or distance between clusters. To obtain equal cluster sizes we selected, within each cluster, the 13 tracks that were the closest to the centroid of the cluster. The four obtained clusters corresponded to (a) the music tracks perceived as both the most arousing and positive, (b) the music tracks perceived as both the most relaxing and negative, (c) the music tracks for which the difference between a high level of perceived arousal and a low level of valence was the greatest (i.e., negative), and (d) the music tracks for which the difference between a low level of perceived arousal and a high level of valence was the greatest (i.e., negative).
Method
Participants
Thirty-five participants (18 females and 17 males) from 19 to 29 years of age (mean age = 22.5 years) and with 1 to 9 years of driving experience (mean = 3.7 years) took part in the experiment. All of them had normal or corrected-to-normal vision. Of the participants, 3 experienced motion sickness and could not be included in the analyses.
Simulator, procedure, and data analysis
The same simulator and driving simulation that were used in Experiments 1 and 2 were used in Experiment 3. The procedure and data analysis were also similar except that the heart rate was not recorded and that the participants had to select a music track from each cluster of tracks before driving. The experiment lasted about 55 min per participant: 15 min for the participants to receive their instructions, be familiarized with the simulator, and complete the first BMIS plus approximately 40 min for the experiment itself.
Musical backgrounds
Based on the constructed clusters of tracks, each participant performed the car-following task with five auditory backgrounds:
(1) NM control condition
(2) Perceived relaxing and negative music (RN), arousal rated from 2.0 to 4.4 out of 10 (mean = 3.5) and real tempo from 82 to 122 BPM (mean = 92 BPM)
(3) Perceived relaxing and positive music (RP), arousal rated from 2.4 to 4.3 out of 10 (mean = 3.3) and real tempo from 67 to 144 BPM (mean = 95 BPM)
(4) Perceived arousing and negative music (AN), arousal rated from 5.5 to 6.7 out of 10 (mean = 6.1) and real tempo from 94 to 150 BPM (mean = 118 BPM)
(5) Perceived arousing and positive music (AP), arousal rated from 6.1 to 8.0 out of 10 (mean = 7) and real tempo from 80 to 160 BPM (mean = 115 BPM)
The order of presentation of the auditory background conditions was counterbalanced using a Latin-square design. Audacity® was used to play music for the complete duration of the car-following task. The intensity of the music was fixed at 70 dB for all auditory backgrounds except for the NM condition. In all conditions, the car engine sound effects (± 25 dB) were present.
Results
Arousal
The statistical analyses revealed a significant effect of auditory background on the level of arousal assessed through the BMIS questionnaire, F(4, 124) = 10.8, p < .001, η2 = .22 (see Figure 5, left). Post hoc analyses showed that arousal in the NM condition differed significantly from all conditions other than the RN auditory background (p < .05). RN was found to be significantly different from the AN and AP backgrounds and RP from the NM and AP backgrounds (p < .05). Finally, there was no significant difference between arousal levels in AN and AP. In sum, the level of arousal increased in a linear fashion from NM to AP and on to RN, RP, and AN, in that order (see Figure 5). Auditory background did not affect significantly the level of pleasantness, F(4, 124) = 1.28, p = .29, η2 = .03 (see Figure 5, right).
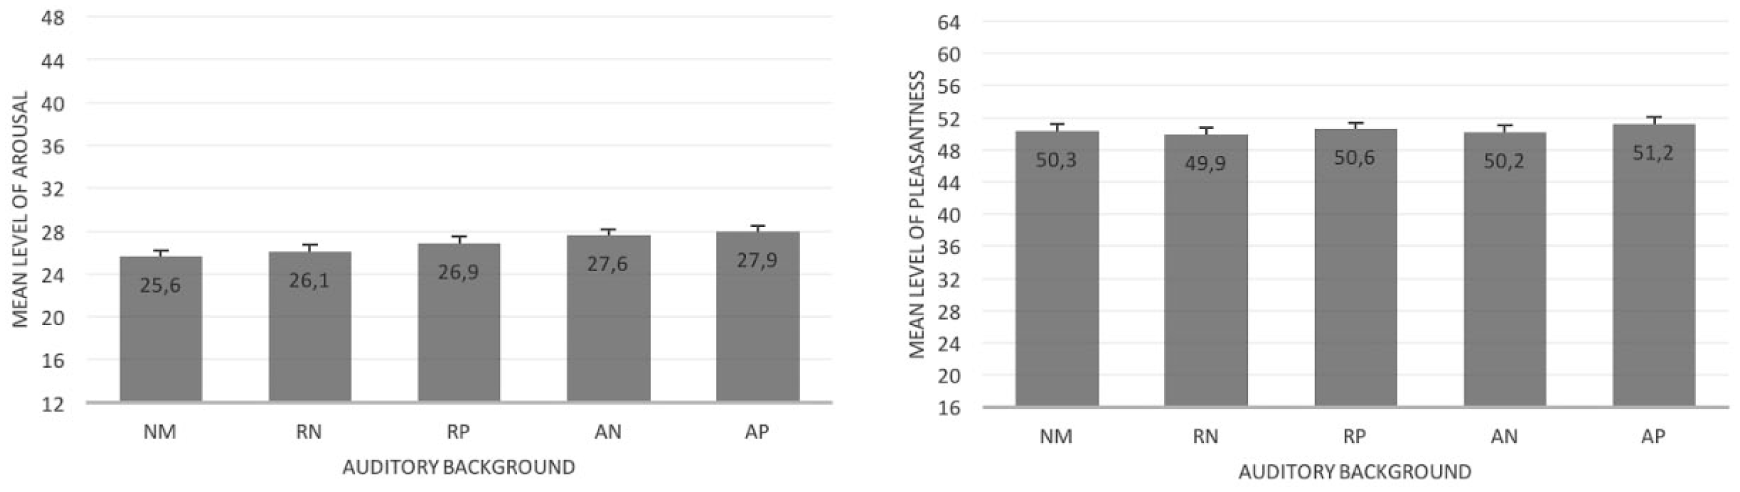
Left: mean level of arousal (score from 12 to 48) for all auditory backgrounds—the higher the score, the higher the arousal level. Right: mean level of pleasantness (score from 16 to 64) for all auditory backgrounds—the higher the score, the more pleasant the situation.
Driving performances
The ANOVAs revealed that the auditory background significantly influenced IVT, F(4, 124) = 3.48, p < .002, η2 = .1 (see Figure 6, top left). Post hoc analysis indicated that IVT differed significantly from its value with the NM background in the AN and AP conditions only (p < .05). The statistical analyses also indicated that the auditory background had a significant influence on coherence, F(4, 124) = 3.66, p < .002, η2 = .09 (see Figure 6, top right), and gain, F(4, 124) = 4.96, p < .001, η2 = .14 (see Figure 6, bottom left). For both coherence and gain, post hoc analyses revealed a significant difference between the NM condition and all the other auditory backgrounds (p < .05). Furthermore, no significant effect of auditory background was observed on delay, F(4, 124) = .88, p = .48, η2 = .01 (see Figure 6, bottom left).
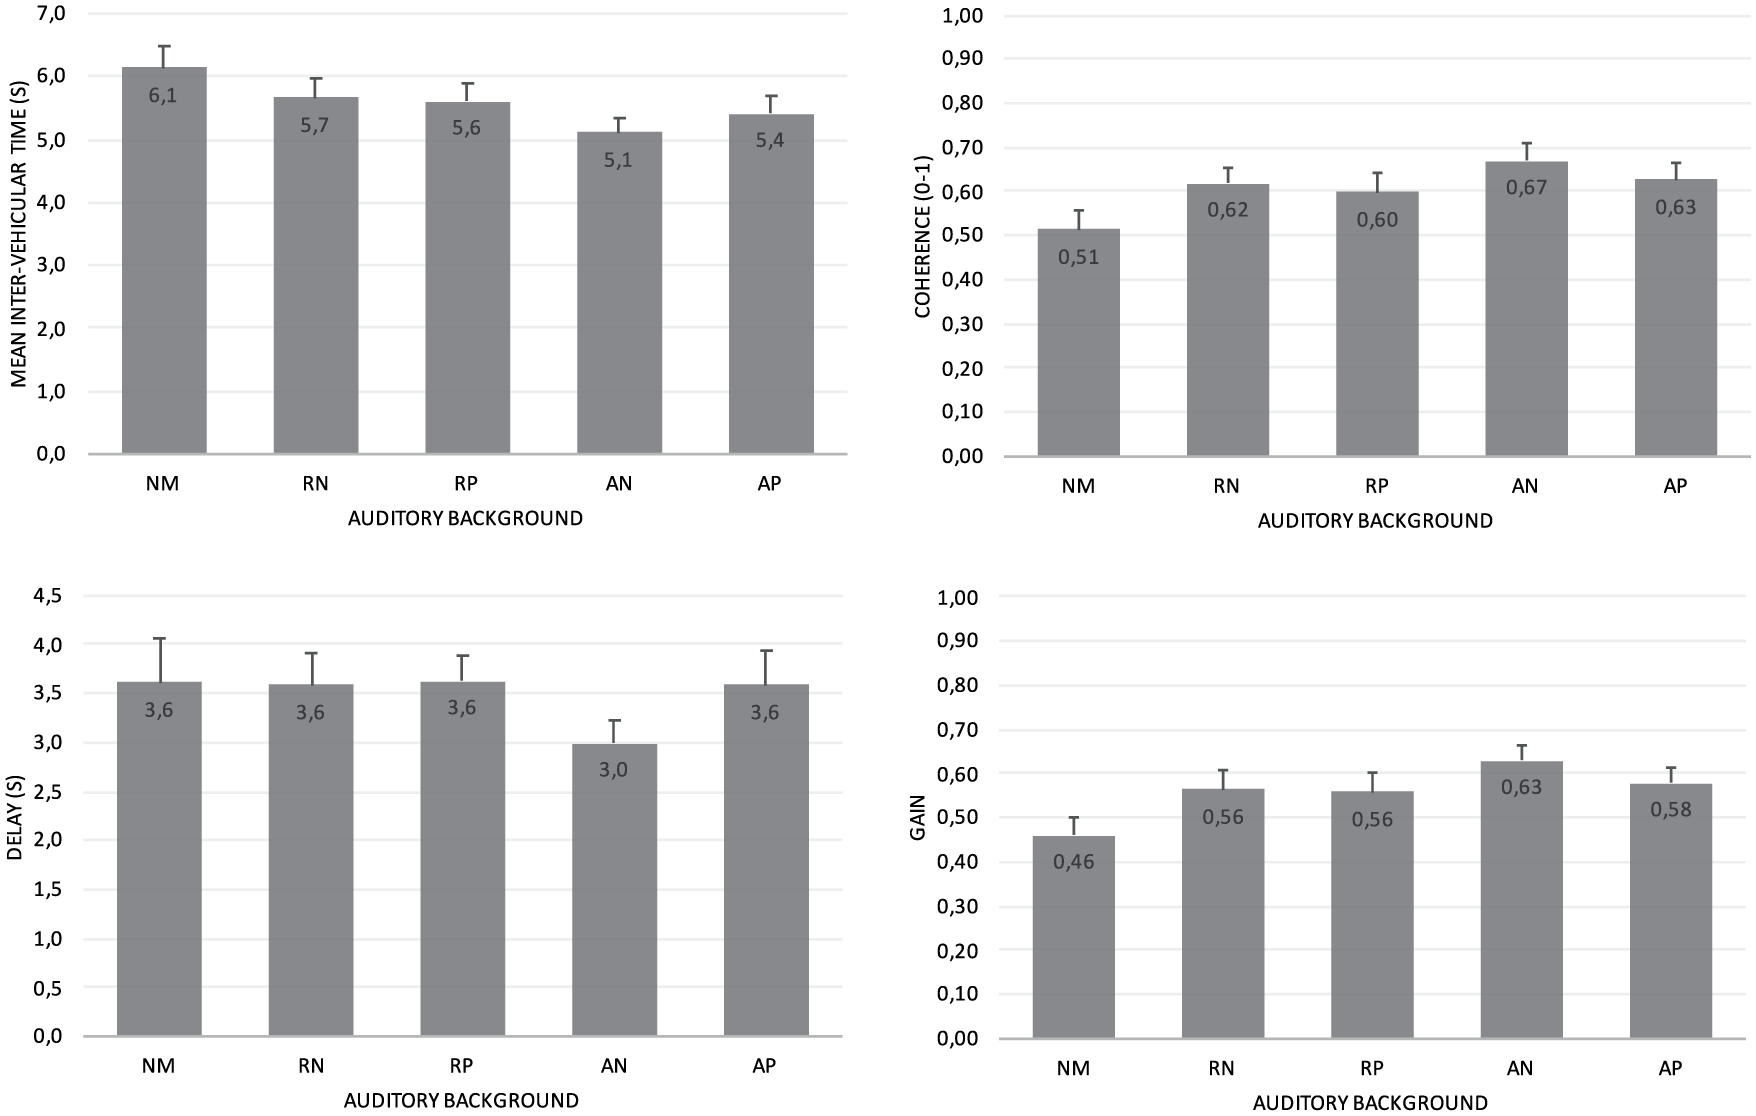
Left: mean intervehicular time (in seconds) at the top and delay (in seconds) at the bottom. Right: mean coherence (from 0 to 1) at the top and gain at the bottom.
Discussion
In Experiment 3, the same driving situation as in the previous experiments was used, but the musical backgrounds were manipulated differently. Instead of the objective tempo, the perceived level of arousal was used to manipulate the musical background. In addition, the perceived valence of music was considered in Experiment 3. Together, four clusters of music tracks combining perceived arousal and perceived valence were created. Perceived arousal was preferred to perceived tempo because it refers to the effects of music tempo on drivers more than the perceived tempo, which is a judgment of the music itself. In addition, such a classification of music tracks in terms of arousal and valence conforms to the classical combination of two dimensions when considering human emotions (Posner, Russell, & Peterson, 2005; Russell, 1980, 2003): valence (from negative affect to positive affect) and arousal (from deactivation to activation). Besides, it must be mentioned that perceived tempo and perceived arousal were found to be very strongly correlated (r = .942), suggesting that those two dimensions are very close to one another. This result is in line with the relationship between the tempo of the music and the level of arousal previously reported (e.g., Dillman Carpentier & Potter, 2007). Perceived arousal was found to be moderately correlated with real music tempo, and the clusters created based on perceived arousal were therefore neither completely independent of nor completely equivalent to the real music tempos used in Experiment 2.
When listened to while driving, the music tracks perceived as the most arousing in the preexperiment (AN and AP conditions) were indeed associated with the highest level of arousal. The subjective level of arousal increased linearly between the different auditory backgrounds in the following order: NM, RN, RP, AN, AP. In other words, listening to music increased the level of arousal compared to the NM condition, and positive tracks were more arousing than negative tracks. In sum, the subjective levels of arousal reported in Experiment 3 were consistent with those of the preexperiment. The level of pleasantness was very similar for all auditory backgrounds. This result was not expected as the participants were asked to pick 1 music track out of a list of 13 tracks in each condition. Thus, the effect of the two positive conditions on the level of pleasantness did not differ from that of the two negative conditions, and backgrounds with music did not differ from the NM background.
In terms of driving behavior, the auditory background had no effect on delay. The results for coherence and gain improved equally in all musical conditions compared to the NM condition. However, the arousal and valence of the tracks did not significantly influence the coherence and gain. Only IVT was affected differently as a function of the perceived arousal of the music, with arousing tracks (both negative and positive) significantly reducing IVT compared to the NM condition. This result indicates that although arousing music can affect driving performance, this effect is nevertheless small (i.e., explains less than 10% of the observed variance) in a well-controlled car-following task.
General Discussion
The question of the influence of music listening on driving performance is not new (Konz & Mcdougal, 1968). However, only a small number of experiments on this topic are reported in the literature. Our aim here was to run a series of experiments to investigate how musical tempo affects driving behavior. It was found that musical tempo per se, when manipulated using a metronome that is ticking in the background while driving, affects neither the driver’s level of arousal nor driving performance (Experiment 1b). When the tempo of a given music track was manipulated (in our case, the driver’s preferred track), no significant effects of this manipulation were observed on driving performance. However, listening to the preferred music track while driving was found to increase the average heart rate and subjective level of arousal compared with the NM condition (Experiment 1a). This observation extends previous results stating that music listening increased arousal during monotonous driving (Ünal et al., 2013). Here, listening to one’s preferred music track was found to be associated with an increased level of arousal, which resulted also in a significant reduction of IVT in the car-following task. This result indicates that the hypothesized relationship between the level of arousal and driving performance exists. It also extends to music-listening previous-arousal effects on driving performance collected after the presentation of high-arousal images (Trick, Brandigampola, & Enns, 2012) or the success of avoidance maneuvers during critical driving situations (Collet, Petit, Priez, & Dittmar, 2005). However, the reported relationship between arousal and driving behavior was not found when the preferred music tempo was accelerated or decelerated. Thus, changing the musical tempo of a given track by plus or minus 30% does not seem to trigger any notable change in arousal and associated behavioral adjustments during driving.
The use of music tracks with different tempo ranges (previously proposed and used by Brodsky, 2001) also failed to reveal any impact of music tempo on driving behavior in the car-following task (Experiment 2). Brodsky reported an increase in driving speed from SM (mean = 132 kph) through moderate-tempo music (mean = 136 kph) to FM (mean = 140 kph). These high driving speeds for a combined urban and rural environment (simulation of the Chicago ring), with speed limits set at 50 kph for municipal road sections and at 105 kph for interstate highways, might be questioned in terms of their ecological validity. It is possible that the tempo-related driving speed variations reported by Brodsky were due to a less careful speed control of the vehicle in the simulated environment, thus magnifying the differences between music tempo conditions. Instead, the results of Experiment 2 tend to reinforce the idea of a general effect of music listening while driving on driving performance. As reported for the preferred music in Experiment 1a, while listening to music (whatever the associated tempo), the drivers tended to reduce IVT between themselves and the followed vehicle. This result is consistent with the general increase in driving speed induced by listening to either fast or slow music behind the wheel (Konz & Mcdougal, 1968). In addition, the time required by drivers to respond to changes in the speed of the leading vehicle (i.e., delay) was found to be significantly shorter while listening to music (whatever the associated tempo) than in the NM condition.
Another approach to manipulating musical tempo was used in Experiment 3. Four clusters of perceived arousing or relaxing and perceived positive or negative music tracks were formed. Again, an effect of all musical conditions was observed compared with the NM condition, combined with an increase in coherence and gain while listening to music. Furthermore, arousing music tracks (positive and negative) were found to reduce IVT compared with the NM condition. IVT associated with relaxing music tracks (positive and negative) were between those observed for the arousing music tracks and the NM condition. The pattern of results for IVT was therefore different in Experiment 3 than in Experiments 1 and 2. Arousing music tracks were indeed associated with the highest level of arousal and led to the greatest shortening of IVT. Listening to relaxing music tracks did not reduce the level of arousal compared to the NM condition, and instead, a slight increase was observed. This small increase in the level of arousal is consistent with the minor reduction in IVT compared with the NM condition. In other words, the same processes seem to be at work for both relaxing and arousing music tracks, and the difference is simply that the size of the effects is smaller for the relaxing tracks than for the arousing ones.
Considered together with the well-known relationship between arousal and performance (Yerkes & Dodson, 1908), this indicates that the drivers were never on the right side of the inverted U-curve. Indeed, the increase in arousal was never detrimental to driving performance. The small size of the effects observed on both arousal and performance tends to indicate that driving performance was almost at the top of the inverted U-curve and that no major performance changes were initiated by the experimental modulations of the level of arousal. This finding is in line with previous ones reporting a systematic improvement of drivers’ responsiveness to the lead vehicle speed changes in a car-following task while listening to music (Ünal et al., 2012; Ünal et al., 2013).
Moreover, when listened to while driving, music tracks previously judged to be arousing improved drivers’ responsiveness to the driving environment (in this case, changes in the followed vehicle speed). However, the driver’s increased responsiveness cannot be considered to represent an improvement in road safety, since the safety margin between the driven and followed car simultaneously decreased (as measured by IVT). This pattern of results corresponds to a spontaneous behavioral adaptation of the driver’s level of arousal. This observation is consistent with risk homeostasis theory in that the benefits of listening to arousing music were counterbalanced by a reduction in the driver’s safety margin to the leading vehicle (Wilde, 1988). In sum, music-listening effects on arousal are counterbalanced by an adjustment of driver’s driving strategies, resulting in a null effect in terms of road safety benefits.
The results of the preexperiment associated with Experiment 3 are also valuable when trying to predict the type of music drivers listen to behind the wheel. A very strong correlation was observed between the valence of music tracks and the willingness to listen to them while driving. It is therefore possible to predict that positive music tracks will be listened to much more while driving, confirming previous observations (Brodsky & Slor, 2013). Furthermore, positive music tracks were found to be positively correlated with arousing music. If positive music tracks (a) are listened to while driving and (b) tend to be associated with arousing music, then drivers would mostly listen to positive and arousing music when driving. This type of music corresponds to the AP music cluster in Experiment 3 that was shown to affect driving performance.
The current contribution’s findings are restricted to the specific experimental conditions set. First, not all driving situations have been explored. Rather only a car-following task was used to assess the influence of music tempo, and associated arousal level, on driving behaviors. This well-established car-following task is highly relevant because it requires constant speed adjustments to the lead vehicle (Brackstone & Mcdonald, 2000). Nevertheless, it restricts driving behavior analyses, as no steering performances, hazard identifications, or navigational driving subtasks could be investigated (Stanton, Young, Walker, Turner, & Randle, 2001). Although previously observed on longitudinal control (Brodsky, 2001; Konz & Mcdougal, 1968), music tempo effects might be stronger on other driving dimensions such as compliance to road signs, reactions to hazardous events, or navigation. Even if our results are consistent with Konz and Mcdougal’s (1968) claim that music tempo has subtle effects on driving performance, car driving involves far more than the car-following task used here. Further studies are needed to investigate these other driving contexts. Second, driving situations are not homogeneous and imply different levels of control (Michon, 1985). The car-following task selected here is targeting mostly the operational level that implies driving skills. Music tempo could also be expected to affect higher levels of control (i.e., tactical or strategic levels), these levels of control being described as requiring more attentional resources. These higher levels of driving control might be influenced more directly by the music tempo as mental effort is required while listening to music behind the wheel (Ünal et al., 2012). Third, the duration of music exposure might be critical to the understanding of the music tempo influence on driving behaviors. In the current experiments, the exposure duration to music was limited to the duration of a short music track. Such a short exposure to each music tempo allowed the experiments to be carried out through within-participant design, reducing variability between experimental groups and resulting in a greater statistical power. Although the arousing effects of music were shown to diminish over time in monotonous conditions (Ünal et al., 2013), further investigations of the music tempo influence over time is required. Fourth, music tempo influence on driving behaviors may be different from one driver to the other. Personality has been shown to influence background music influence on cognitive performances (Furnham & Strbac, 2002). Fifth, numerous other music dimensions (e.g., lyrics, tone, rhythm, and intensity) could interact with the tempo influence on driving behaviors. Those potential interactions were not investigated in the current contribution and should be specifically targeted in future experiments.
In the current experiments, the hypothesis of an increase in drivers’ arousal while listening to music was proposed in light of the general arousal hypothesis (Smith & Curnow, 1966; Thompson, Schellenberg, & Husain, 2001). Taking this hypothesis a step further, listening to fast music should be most useful for drivers suffering from low vigilance or drowsiness. Since the level of arousal is particularly low in such situations, music should stimulate drivers and therefore have a greater impact on driving performance. Even though the tempo of the music itself does not greatly influence driving performance under regular driving conditions with no specific attentional impairments, the issue of attentional impairment should be investigated further in future experiments. Based on the results collected in the current series of experiments, drivers’ arousal level was close to the top and on the left side of the inverted U-curve. Thus, music listening only slightly increased drivers’ level of arousal. If drivers’ arousal is considerably farther to the left of the inverted U-curve prior to music listening, then the level of arousal due to music listening should have a much more dramatic impact on driving performance. Music listening also may be detrimental under certain circumstances, such as difficult driving situations (e.g., driving in a dense urban environment or parking in a small parking place). In such situations, music listening could interfere negatively with the primary driving task. This effect is referred to as the distraction hypothesis (Furnham & Strbac, 2002; Oldham, Cummings, Mischel, Schmidtke, & Zhou, 1995) and should also be investigated in future experiments.
Conclusion
The series of experiments reported here examined the influence of in-vehicle background music tempo on driving behavior during a car-following task. It was hypothesized that the faster the music tempo, the higher the level of arousal and the better the driving behavior would be. The tempo itself did not influence arousal (Experiments 1b and 2). However, real music tempo was found to be positively linked to perceived arousal, and music tracks judged to be arousing affected driving behaviors (Experiment 3). Arousing music improved drivers’ responsiveness to the changes in the speed of the lead vehicle but also reduced the safety margin between the driven and the followed vehicle. Consequently, listening to arousing music cannot not be considered to improve road safety. Future studies are needed to assess the impact of the tempo of the background music listened to when behind the wheel under specific driving situations (e.g., parking or complex situations) and in drivers with very low levels of arousal (e.g., drowsiness).
Key Points
Music listening while following a vehicle has an impact on driving.
Whatever the tempo, the adaptations in coherence and gain when following a vehicle tend to be improved with music, but IVT tends to be reduced.
The tempo of the music per se has no direct impact on driving behavior.
When listened to behind the wheel, music tracks judged as arousing improve drivers’ responses to a followed vehicle.
Improvements in drivers’ responses due to arousing music tracks are counterbalanced by a reduced safety margin.
Footnotes
Acknowledgements
This study was supported by the LABEX CORTEX (ANR-11-LABX-0042) of Université de Lyon, within the program Investissements d’Avenir (ANR-11-IDEX-0007) operated by the French National Research Agency. The authors are grateful to Frédéric Merienne and the developers of the OpenSD2S software for their support.
Jordan Navarro is a lecturer in psychology and cognitive sciences at University of Lyon and has been appointed junior member of the Institut Universitaire de France. He was awarded a PhD in cognitive ergonomics from the University of Nantes in 2008 and spent 1 year as a research fellow at Monash University Accident Research Center.
François Osiurak is a lecturer at University Lyon 2 (Laboratoire d’Etude des Mécanismes Cognitifs) and has been appointed junior member of the Institut Universitaire de France. He was awarded a PhD in psychology from the University of Angers in 2007.
Emanuelle Reynaud is a lecturer in cognitive sciences at University Lyon 2 (Laboratoire d’Etude des Mécanismes Cognitifs). She graduated from the Grenoble Institute of Technology with a PhD in cognitive sciences/computer science in 2002.