
Abstract
Objective:
The current study investigated driver vigilance in partially automated vehicles to determine whether increased task demands reduce a driver’s ability to monitor for automation failures and whether the vigilance decrement associated with hazard detections is due to driver overload.
Background:
Drivers of partially automated vehicles are expected to monitor for signs of automation failure. Previous research has shown that a driver’s ability to perform this duty declines over time. One possible explanation for this vigilance decrement is that the extreme demands of vigilance causes overload and leads to depletion of limited attentional resources required for vigilance.
Method:
Participants completed a 40-min drive in a simulated partially automated vehicle and were tasked with monitoring for hazards that represented potential automation failures. Two factors were manipulated to test the impact of monitoring demands on performance: Spatial uncertainty and event rate.
Results:
As predicted, hazard detection performance was poorer when monitoring demands were increased, and performance declined as a function of time on task. Subjective reports also indicated high workload and task-induced stress.
Conclusion:
Drivers of partially automated vehicles are impaired by the vigilance decrement and elevated task demands, meaning that safe operation becomes less likely when the demands associated with monitoring automation increase and as a drive extends in duration. This study also supports the notion that vigilance performance in partially automated vehicles is likely due to driver overload.
Application:
Developers of automation technologies should consider countermeasures that attenuate a driver’s cognitive load when tasked with monitoring automation.
Introduction
Perhaps the most fundamental and impactful elements of Joel Warm’s scientific legacy are his substantial contributions to the field of vigilance research. He dedicated decades in search of causes and cures for the vigilance decrement, the temporal decline in human performance that results within tasks that require sustained attention or vigilance for the detection of rare and unpredictable critical events (for review, see Warm, Finomore, Vidulich, & Funke, 2015). His work, time and again, demonstrated that vigilance tasks are grueling and stressful assignments, wherein performance is deleteriously influenced by increases in task demands (for review, see Warm, Parasuraman, & Matthews, 2008). Additionally, he argued, as others have (e.g., Sheridan, 2002), that vigilance is a perennial problem that is sustained by continuing shifts toward technological automation (Warm et al., 2008).
Indeed, the vigilance decrement has been observed repeatedly in a variety of tasks that require human-automation interaction, including modern methods of cyber intrusion detection (Sawyer et al., 2014), semiautomated train operation (Rees, Wiggins, Helton, Loveday, & O’Hare, 2017), and industrial process control (Small, Wiggins, & Loveday, 2014). The vigilance decrement is thought to emerge in such tasks because human operators are required to persistently monitor the activities of automated systems to counteract imperfections in automated system performance (Molloy & Parasuraman, 1996). This duty is highly monotonous and requires long periods of sustained attention for the detection of rare and unpredictable instances of automation failure. These characteristics of human-automation interaction match the typical definition of laboratory vigilance tasks, are thought to be key drivers of the vigilance decrement, and should be a major concern for human factors practitioners when considering the limitations of novel forms of automation (e.g., see Warm et al., 2015).
As an example of this problem, consider ongoing efforts to engineer fully autonomous passenger vehicles. Developers aim to improve roadway safety by assigning vehicular control duties to a fully autonomous system, rather than requiring manual driver control, removing the possibility of human error (Smith et al., 2015). Although fully autonomous vehicles do not yet exist, nascent vehicle automation technologies have already resulted in vehicles that are partially automated (SAE level 2). The capabilities of partially automated vehicles include maintenance of safe speed, headway, and lane position without needing manual driver input, but only within specific driving conditions (e.g., highway). While vehicle automation is engaged, the driver is responsible for supervising the automated driving system and monitoring for hazardous situations that indicate immediate or impending automation failure (SAE International, 2016).
In cases of automation failure, no warning is given by the automated driving system. Instead, the driver must detect the danger and respond by retaking manual control to safely avoid the hazard (National Highway Traffic Safety Administration [NHTSA], 2017). Cases of automation failure include sudden, unwarned disengagement of one or more automated systems (e.g., Young & Stanton, 2007), instances in which an automated system fails to maintain a safe following distance to a lead car (SAE International, 2016), and the appearance of roadway hazards that the automated driving system is unable to detect (NHTSA, 2017). In sum, partially automated vehicles transition drivers from their traditional manual operation duties to the role of passive observer who must remain vigilant in order to detect unpredictable automation failures. Recent fatalities involving partially automated vehicles indicate the potentially tragic consequences of vigilance failures (e.g., NHTSA, 2017).
In a recent study, Greenlee, DeLucia, and Newton (2018) raised concerns that the vigilance decrement may occur in partially automated vehicles and increase the potential for collision, because, like many automated systems, partially automated vehicles seem to demand vigilance. They investigated that possibility using a simulated driving task in which participants drove a partially automated vehicle and were responsible for detecting roadway hazards that the simulated vehicle’s automation would fail to detect. Results of that study included a severe vigilance decrement. Drivers were decreasingly able to detect automation failures as the drive progressed, and the speed of successful detections also slowed over the course of the drive. Additionally, drivers reported high workload and task-induced stress, which are both characteristic outcomes of vigilance tasks (for review, see Warm et al., 2008). These results demonstrate that driver vigilance should be a primary concern in the development of safe automated vehicle technology.
Although the study by Greenlee and colleagues (2018) confirmed that sustained monitoring of a partially automated vehicle takes a toll on a driver’s ability to detect hazards that constitute potential automation failures, the underlying cause of this vigilance decrement remains unclear. Two possible explanations for this finding can be drawn from extant vigilance literature: Namely, the underload explanation and the overload explanation. Supporters of the underload explanation posit that drivers are understimulated, feel that they have little to do, and are so bored by the monotony of vigilance tasks that they disengage attention from their duties, leading to a decline in performance (e.g., Manly, Robertson, Galloway, & Hawkins, 1999; McVay & Kane, 2012; Risko, Anderson, Sarwal, Engelhardt, & Kingstone, 2012; Robertson, Manly, Andrade, Baddeley, & Yiend, 1997; Smallwood, et al., 2004). Alternatively, proponents of the overload explanation (i.e., the Resource Theory) argue that vigilance tasks are extremely demanding, so much so that the limited neurocognitive resources required for maintaining vigilance are exhausted more rapidly than they can be replenished, causing the vigilance decrement (Davies & Parasuraman, 1982; Parasuraman & Davies, 1977; Parasuraman, Warm, & Dember, 1987). The debate between underload and overload explanations must be considered, because remedies for an underload-driven vigilance decrement likely differ from ideal solutions for an overload-driven decrement. For example, in cases of underload, problematic performance results from operator underengagement, and performance may be augmented by increasing task demands (e.g., by allocating additional, task-relevant duties). Conversely, if the vigilance decrement in partially automated vehicles is a consequence of overload and associated resource depletion, the best remedy may be to reduce task demands (e.g., by further limiting the conditions under which automation may function). The goal of the current study was to determine whether the vigilance decrement in partially automated vehicles is caused by overload or underload.
Toward that end, we modeled the current study on past examinations of the role that task demands play in vigilance performance. Research has shown that when vigilance task demands are increased, the overall level of performance is reduced, the onset and pace of the vigilance decrement is hastened, and the magnitude of the observed decrement tends to increase (for a review, see Warm et al., 2015). These effects are observed, for example, when the rate of to-be-inspected events is increased (Davies & Parasuraman, 1982; Parasuraman & Davies, 1976; Sawyer et al., 2014), when those stimuli appear in unpredictable spatial locations (Adams & Boulter, 1964; Funke et al., 2017; Helton, Weil, Middlemiss, & Sawers, 2010) or at unpredictable times (Adams & Boulter, 1964; Smith, Warm, & Alluisi, 1966), when the discriminability of stimulus events is reduced (Parasuraman et al., 2009), and when the working-memory demands of the task are increased (Caggiano & Parasuraman, 2004). Such findings support the resource theory of the vigilance decrement by showing that more difficult vigilance tasks, those in which an operator has more work to do, generally lead to poorer performance outcomes.
In contrast, if a vigilance decrement could be ascribed to underload, the opposite effect would be expected for manipulations of task demands. That is, lower task demands would lead to increased boredom, greater task disengagement, and poorer performance, relative to higher-task demands.
In the present study, the demands associated with monitoring a partially automated vehicle were manipulated to evaluate the possibility that driver vigilance is hindered by increased task demands and that the vigilance decrement in partially automated vehicles can be attributed to driver overload. Toward that end, drivers of a simulated partially automated vehicle were tasked with watching for roadway hazards that signified potential automation failures. We manipulated two aspects of task demands: the rate of to-be-inspected events (i.e., event rate) and the spatial predictability of to-be-inspected events. We hypothesized that performance efficiency would decrease as task demands increased, that is, as spatial uncertainty and event rate increased. Additionally, operator state was assessed in terms of subjective workload (NASA-TLX; Hart & Staveland, 1988) and stress (Short Stress State Questionnaire; Helton, 2004).
Method
Participants
Sixty licensed drivers (18 Men, 42 Women; Mage = 19.68 years, SDage = 4.75; Myears licensed = 3.53, SDyears licensed = 4.76) completed this study in exchange for credit toward a course requirement. One participant did not provide information regarding age or years licensed. All participants reported having normal or corrected-to-normal visual acuity, and all participants were asked to abstain from all stimulant and depressant drugs for 12 hr prior to beginning the experiment.
Upon arrival to the lab, informed consent was obtained from each participant for this research study, which was approved by the institutional review board of Texas Tech University. Participants then surrendered all timepieces, phones, and other potentially distracting devices before starting the experiment. To limit the potential for time-related motivational strategies, participants were not informed of the exact length of the drive.
Apparatus and Testing Environment
The study took place in a private, unlit testing room that contained a STISIM DriveTM driving simulator (Version 3.14.04) equipped with a GTR Simulator GTS-F Racing Simulator Seat, a Logitech G27 steering wheel, and floor-mounted pedals. Three 23″ LED monitors (Acer H236HL; 1920 × 1080 resolution) displayed driving scenes with a 135° horizontal field of view. Viewing distance was fixed at approximately 24 inches (61 cm) based on manufacturer recommendations.
Design
A 2 (Event Rate: Fast, Slow) × 2 (Spatial Certainty: Low, High) × 4 (Periods of Watch) mixed design was employed. Event Rate and Spatial Certainty were combined factorially to create four between-subjects demand conditions. Fifteen participants were assigned at random to each condition with the restriction that participant sex was balanced as evenly as possible across conditions.
Procedure
The procedure was based on that of Greenlee and colleagues (2018). We only deviated from that procedure where necessary to test the current hypotheses regarding the influence of task demands. Participants completed all procedures individually.
Once seated in the driving simulator, participants responded to a computerized version of the Short Stress State Questionnaire (SSSQ), which they completed to establish a pretask baseline for use in subsequent assessment of task-induced stress. After completion of the SSSQ, participants were presented with computer-based training, which consisted of instructional training slides that explained the automated driving task. Participants then completed a 4-min practice drive.
During the practice drive, as in the full drive that followed, participants acted as a driver of a simulated vehicle that was partially automated (SAE level 2); it maintained a central lane position and a constant speed of 60 miles per hr (88 ft/s; 96.56 km/h) as it traveled on a straight, single lane, rural road in foggy conditions. Participants were told that, due to the automation, they would not need to operate the steering wheel, brake pedal, or accelerator pedal.
Participants were instructed to monitor the roadway for vehicles that were stopped dangerously at intersections. Dangerous vehicles were those that were stopped too close to the roadway causing the front end of the vehicle to intrude perilously (1.25 ft; 0.38 m) into the participant’s lane of travel. In this study, these dangerously stopped vehicles constituted automation failures, roadway hazards that the simulated vehicle’s automation could not detect. Consequently, the duty of detecting these dangerously stopped vehicles fell to each participant, who was instructed to respond by pressing the uppermost button on the right side of the steering wheel when they detected a dangerously stopped vehicle. Participants also encountered vehicles that were stopped safely at intersections. These vehicles were positioned so that they did not protrude into the participant’s lane of travel and posed no risk. Thus, participants were required to discriminate between safely stopped and dangerously stopped vehicles, which are presented in Figure 1 panel A and panel B, respectively. All stopped vehicles were grey Audi Quattros (dimensions: 14.10 × 6.07 × 4.77 ft; 4.30 × 1.85 × 1.45 m).
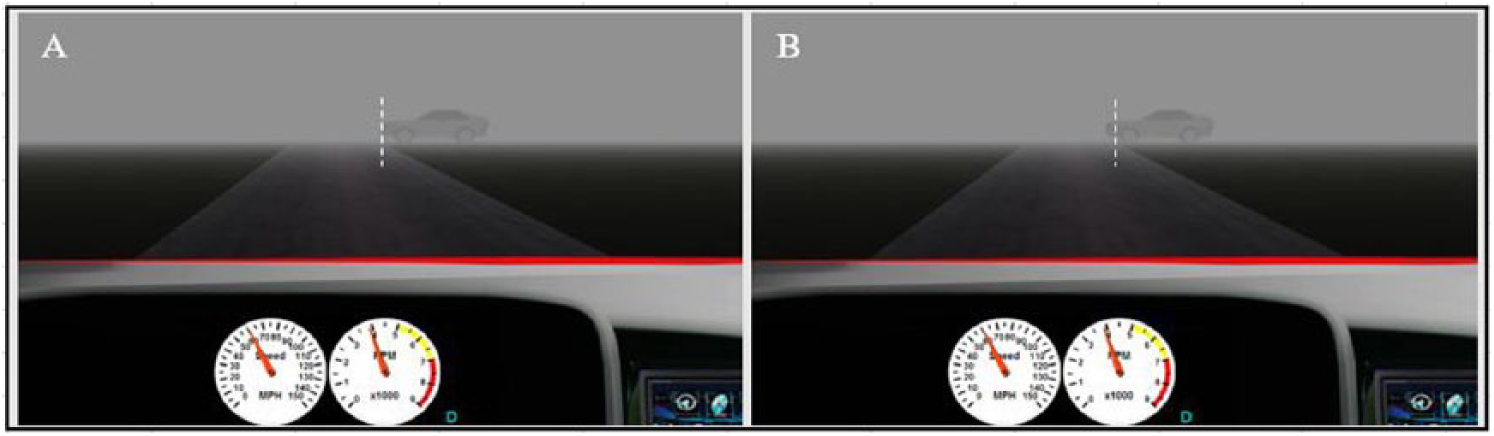
Depiction of “safe” neutral stimuli (A) and “dangerous” critical signals (B) on right side of the roadway. Dotted lines are presented for the reader’s benefit but were not presented to participants. Reprinted with permission from Greenlee et al. (2018).
The foggy conditions resulted in reduced visibility of approximately 175 feet (53.34 m). Consequently, each stopped vehicle appeared when it was approximately 175 feet in front of the participant’s simulated vehicle. Each stopped vehicle remained visible for 325 ms before disappearing at a distance of approximately 146 feet (44.50 m) from the front of the participant’s vehicle. Visual angle of stopped vehicles increased from appearance (lateral: 4.61°, vertical: 1.56°) to disappearance (lateral: 5.42°, vertical: 1.84°).
Participants assigned to the Fast Event Rate condition encountered a vehicle stopped at an intersection once every 2 s, resulting in an event rate of 30 events per min. In contrast, participants in the Slow Event Rate condition encountered a stopped vehicle once every 4 s, resulting in an event rate of 15 events per min.
In the Low Spatial Certainty condition, stopped vehicles could be stopped on either the right or the left side of the roadway, and this location (left or right) was selected at random for each vehicle with the restriction that the probability of each side was exactly 50%. Within the High Spatial Certainty condition, stopped vehicles could also appear on the left side of the roadway or on the right side. However, this location was entirely predictable, because it alternated from left to right repeatedly (each side = 50% of vehicles). Participants in the high spatial certainty condition were informed in the instructional slides that the location would alternate in this manner.
In all conditions, the majority (90%) of the vehicles that a participant encountered within the practice drive were stopped safely. Only 10% of vehicles were stopped unsafely. Safe and dangerous vehicles appeared equally often on the left and right side of the roadway.
All button presses were recorded as either a correct detection (a press in response to a dangerously parked vehicle) or a false alarm (a button press made in response to a safely parked vehicle). During the training drive, complete knowledge of results (KR) was provided to participants using onscreen visual feedback that informed participants of all hits, misses, false alarms, and correct rejections. Full KR has been shown to be better for optimizing vigilance performance than alternate feedback options (Szalma, Hancock, Dember, & Warm, 2006).
After completing the 4-min practice drive, participants began the full drive. The full drive was identical to the practice drive except feedback was removed, the probability of a dangerously parked vehicle was reduced to 5.33%, and the duration of the drive was increased to 40 min. Those 40 min were divided into four continuous, 10-min periods. Even though signal probability was the same in all conditions, the number of events within each period differed between the two event-rate conditions. In the Fast Event Rate condition, 284 vehicles were stopped safely and 16 were stopped dangerously. In the Slow Event Rate condition, these values were halved (142 safe, 8 dangerous). In all periods and all conditions, half of the safe vehicles appeared on the left side of the road and half appeared on the right. After the full drive, participants completed the NASA-TLX and SSSQ.
Results
Hazard Detection Performance
Initial assessment of performance efficiency was based on percentage correct detections and percentage false alarms. Each of these performance outcomes was analyzed with a separate 2 (Event Rate) × 2 (Spatial Uncertainty) × 4 (Periods of Watch) mixed effects analysis of variance (ANOVA). In these and all subsequent analyses, effects and interactions involving repeated measures were adjusted using the Greenhouse-Geisser method to correct for any sphericity violations, and any post hoc pairwise comparisons were Bonferroni corrected (Field, 2009). All significant main effects and interactions are reported.
Correct detections
Mean percentage correct detections was computed for each period of watch for each participant. Means for each condition are presented in Table 1.
Mean Percentage Correct Detections for Each Condition and Period of Watch
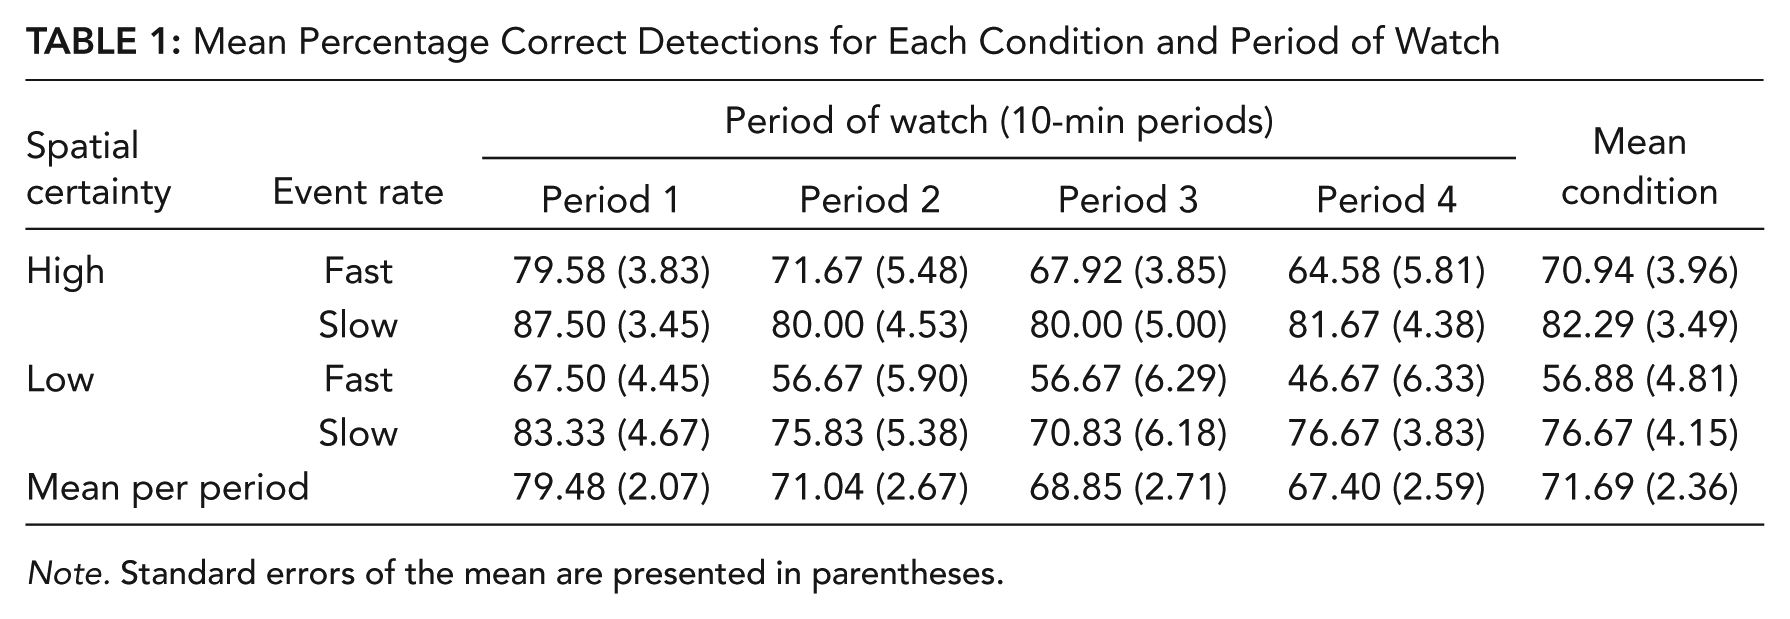
Note. Standard errors of the mean are presented in parentheses.
Prior to analysis, percentages of correct detection were transformed using the arcsine method to address any nonnormality in the data. Arcsine corrected values were then analyzed using the ANOVA procedure described above. The analysis revealed that percentages of correct detections declined significantly over time, F(2.92, 163.43) = 9.64, p < .001, ηp2 = .15. Subsequent pairwise comparisons indicated that the main effect of period of watch on percentage detections was driven by a decline in performance that occurred between the first and second period: percentage correct detections in the first period of watch was significantly greater than the detection rate in all other periods, p < .008, d > 0.45. No other differences between periods were evident.
Additionally, mean percentage correct detections were found to be greater when hazards appeared in a predictable, spatially certain location, F(1, 56) = 5.79, p = .019, ηp2 = .09, compared with the unpredictable condition. Percentage correct detections were also greater when event rate was slow rather than fast, F(1, 56) = 15.52, p < .001, ηp2 = .22.
False alarms
Percentage false alarms were analyzed using the same method as for percentage correct detections. The mean, untransformed percentage false alarm data are displayed in Table 2.
Mean Percentage False Alarms for Each Condition and Period of Watch
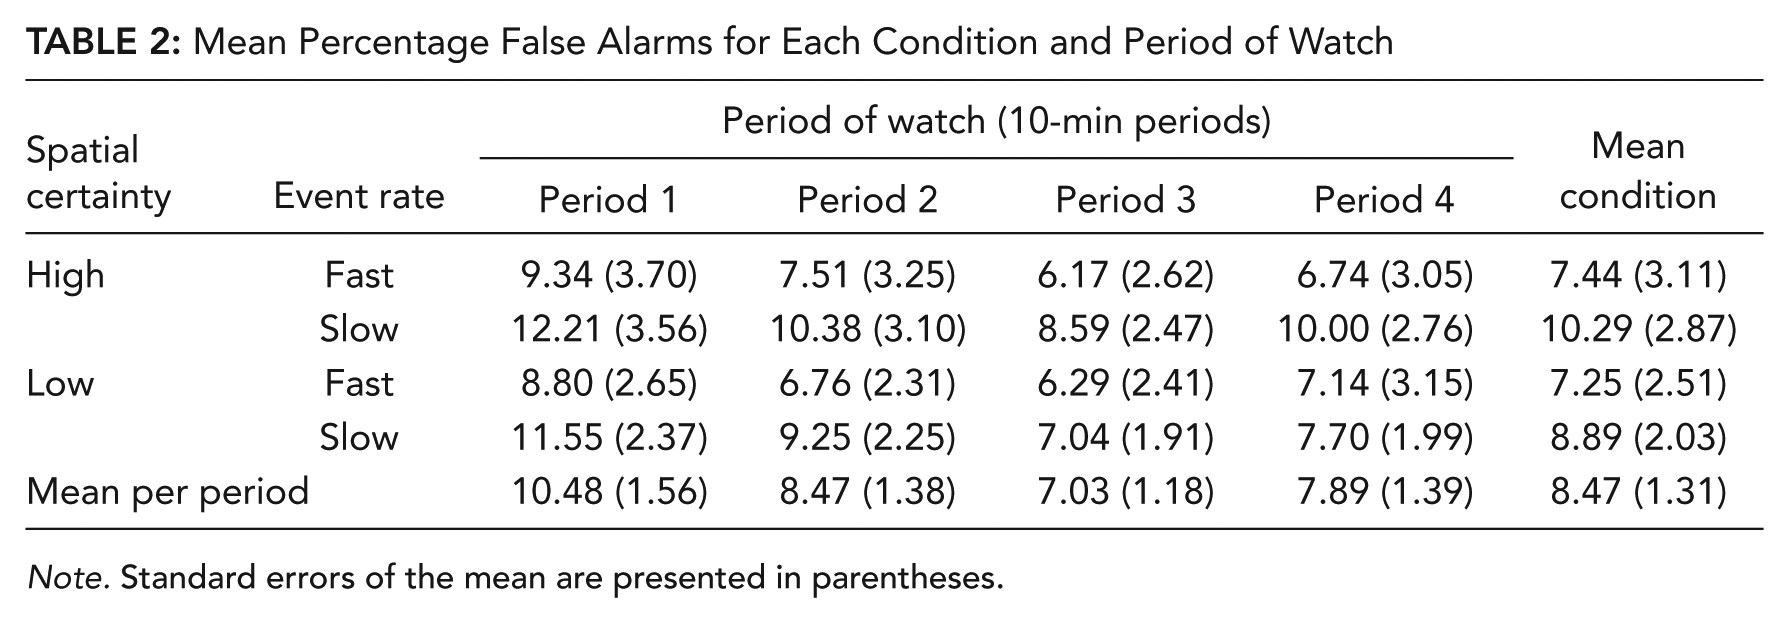
Note. Standard errors of the mean are presented in parentheses.
Analyses of arcsine transformed percentage false alarm values revealed a significant decline in false alarm rate during the drive, F(2.34, 131.57) = 13.65, p < .001, ηp2 = .20. Post hoc paired comparisons revealed that false alarm rates were greater in the first period than all other periods, p < .008, d > 0.46; and the false alarm rate in period 2 was greater than that of period 3, p < .008, d = 0.42. All other pairwise comparisons were not significant.
Sensitivity
To supplement understanding of driver detection performance, we computed measures of sensitivity and bias. Based on the recommendation given by See, Warm, Dember, and Howe (1997), nonparametric A′ was employed to estimate driver sensitivity to hazards, and nonparametric B′′D was used to estimate bias. Prior to inferential analyses, the percentage correct detection and percentage false alarm data were checked for cases in which either the rate of correct detections or the rate of false alarms reached the maximum (100%) or minimum (0%) possible. This initial check indicated that approximately 14% of the percentage correct detection data reached the maximum (100%), and approximately 11% of the false alarm data reached the minimum (0%).
Macmillan and Creelman (2004) suggested that such instances of floor effects (0% occurrence) should be replaced by the value 100%/(2N) and that instances of ceiling effects (100% occurrence) should be replaced by the value 100%-100/(2N). As can be seen in the formulas, the magnitude of the resulting transformation is dependent on N, the number of neutral trials or critical trials used to derive the percentage. Due to the lower quantity of trials in the slow event rate condition, this dependency would result in a smaller correction within the fast event rate condition than in the slow event rate condition—a potential confound. To avoid confounding sensitivity and bias analyses with event rate, we used these formulas to compute the correction values for floor and ceiling effects within the fast event rate condition, then used those same correction values to correct floor and ceiling effects within the slow event rate condition. In both conditions, cases of 100% correct detections were transformed to approximately 96.88%, and cases of 0% false alarms were transformed to approximately 0.2%. Following the transformations, sensitivity and bias were subjected to analyses identical to those used to examine correct detections and false alarms. Mean sensitivity is presented in Table 3 for all periods and conditions.
Sensitivity (A’) for Each Condition and Period of Watch
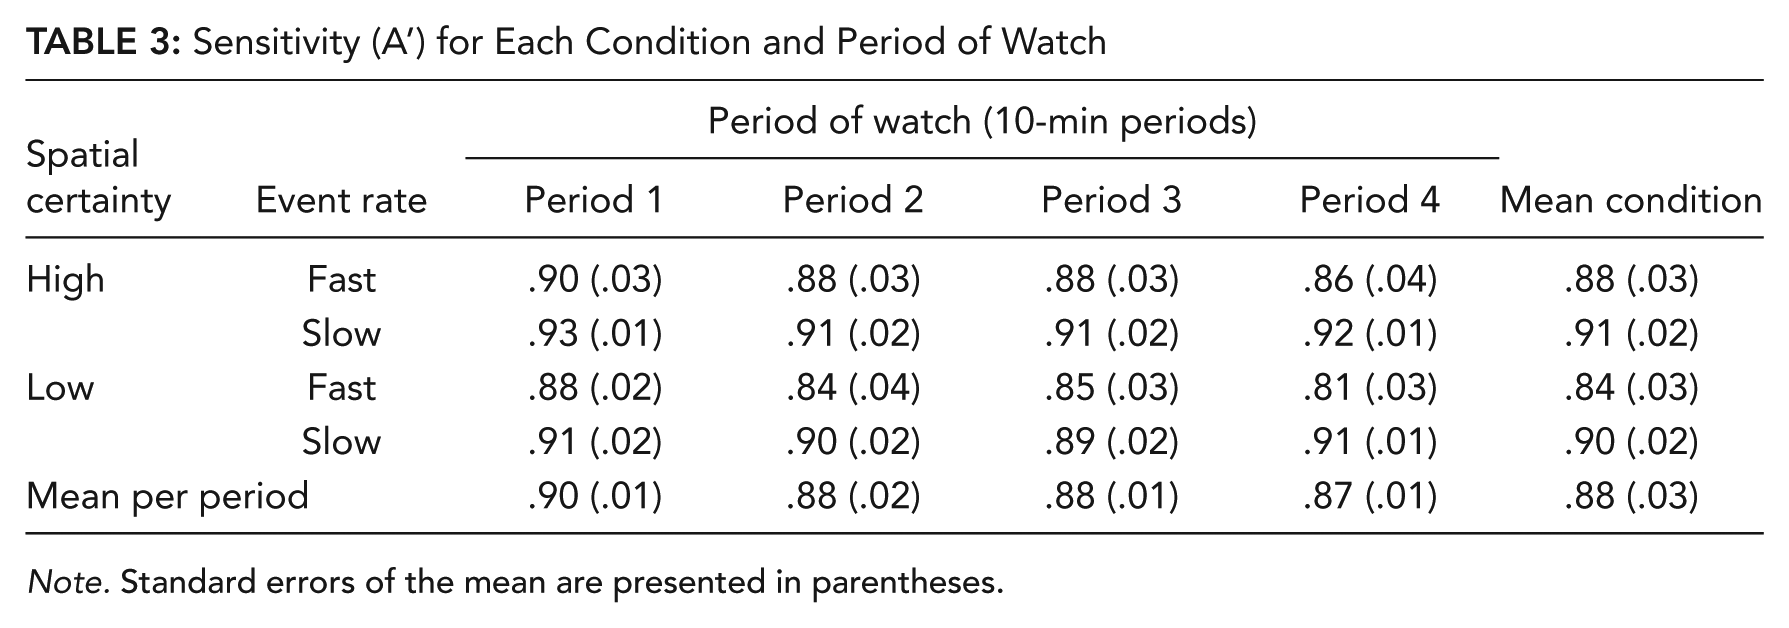
Note. Standard errors of the mean are presented in parentheses.
As Table 3 shows, mean sensitivity declined as the drive progressed, F(2.52, 141.08) = 3.43, p = .025, ηp2 = .06. Post hoc, polynomial trend analysis indicated a significant linear decline in sensitivity during the course of the vigil, F(1, 56) = 5.85, p = .019, ηp2 = .10. Additionally, sensitivity was significantly greater in the slow event rate condition than in the fast event rate condition, F(1, 56) = 4.85, p = .032, ηp2 = .08.
Bias
As shown in Table 4, mean bias became more conservative as the drive progressed, F(2.76, 154.58) = 11.32, p < .001, ηp2 = .17. Post hoc, polynomial trend analysis indicated a significant linear increase in bias during the course of the vigil, F(1, 56) = 25.63, p < .001, ηp2 = .31. Additionally, bias was significantly greater in the fast event rate condition than in the slow event rate condition, F(1, 56) = 10.28, p = .002, ηp2 = .16.
Bias (B”D) for Each Condition and Period of Watch
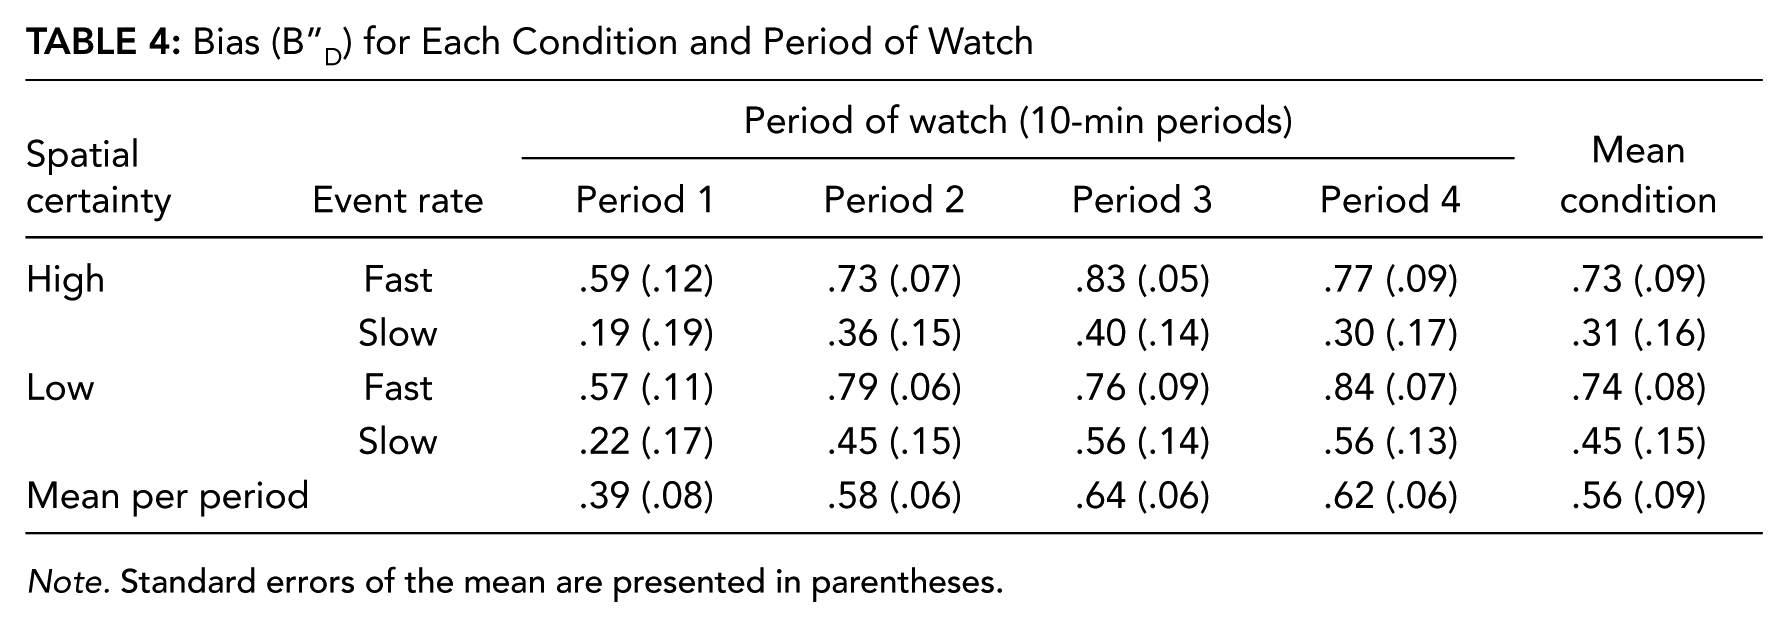
Note. Standard errors of the mean are presented in parentheses.
Workload
Subscale scores from the NASA-TLX were computed using the unweighted rating procedure (e.g., Nygren, 1991), and global workload was calculated as the mean of all six subscales. Subscale and global score means are presented in Table 5 for each condition.
Mean Ratings for NASA-TLX Subscales and Global Demand
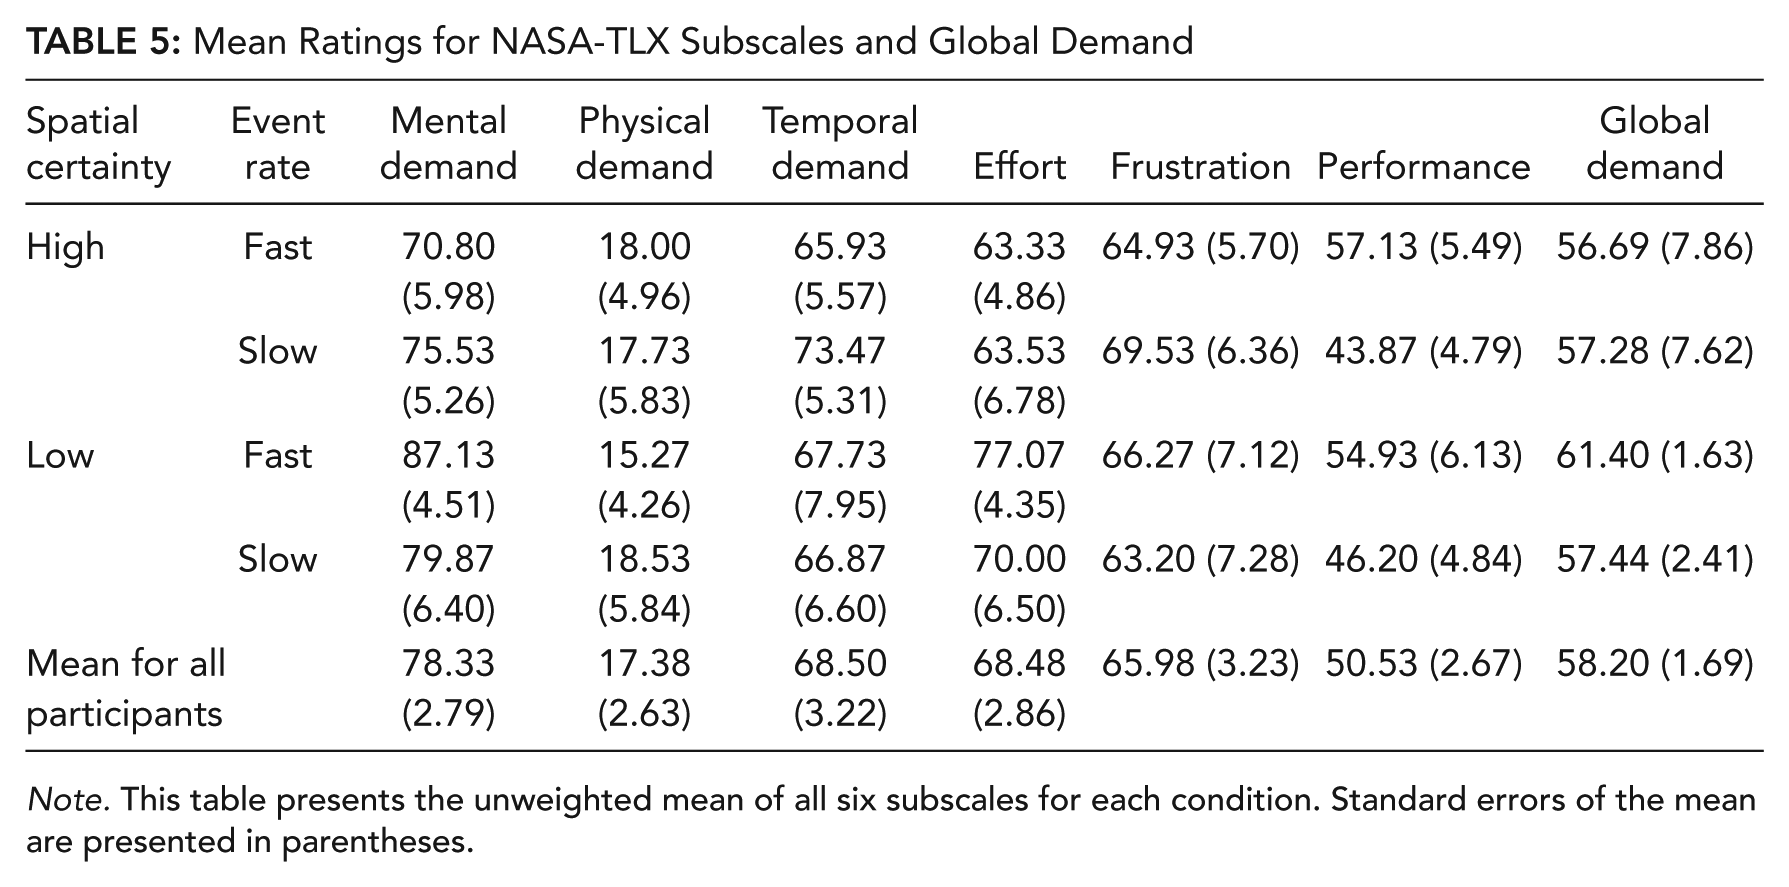
Note. This table presents the unweighted mean of all six subscales for each condition. Standard errors of the mean are presented in parentheses.
NASA-TLX data were analyzed using a 2 (Event Rate) × 2 (Spatial Certainty) × 6 (Subscales) mixed design ANOVA. This analysis showed that there were no significant effects or interactions involving Spatial Certainty and Event Rate conditions. However, the analysis did indicate significant differences in mean workload ratings among subscales of the NASA-TLX, F(4.04, 226.05) = 70.02, p < .001, ηp2 = .56.
Given evidence of differences among subscale ratings, a final set of analyses were conducted to determine which subscales could be classified as drivers of workload. Subscales with ratings above the midline of the NASA-TLX may be considered drivers of task workload (e.g., Greenlee et al., 2016), because a task is typically described as difficult when global demand exceeds the midpoint of the scale (50; e.g., Finomore, Shaw, Warm, Matthews, & Boles, 2013). We collapsed across demand conditions (event rate and spatial predictability) for these analyses, due to the lack of condition-driven effects or interactions. Additionally, physical demand was excluded, because ratings on that scale fell below the midline of the scale. All other subscales and global demand were subjected to Bonferroni-corrected, single-sample t tests against the midline (50) of the scale. These analyses indicated that ratings of Mental Demand (p < .001, d = 1.29), Temporal Demand (p < .001, d = .76), Effort (p < .001, d = .83), and Frustration (p < .001, d = .63) were significantly higher than the midpoint of the scale, as was Global Demand (p < .001, d = .64). Performance, however, was not (p > .05, d = .03).
Stress
Preliminary analyses of the SSSQ data revealed three missing responses. Three different participants each failed to respond once during their respective study sessions. Each missing response represents 2% of the data for each participant and 5% of the data for each survey item. Overall, the SSSQ data were approximately 99.9% intact. Consequently, we replaced each missing value with the mean for the relevant survey item, allowing subsequent score calculations to be based on an equal number of survey items for all participants (e.g., Downey & King, 1998).
Pretask and Posttask scores were computed for each of the three subscales of the SSSQ: Engagement, Worry, and Distress. A 2 (Event Rate) × 2 (Spatial Certainty) independent measures ANOVA was used to determine whether pretask values for each subscale differed as a function of Event Rate and/or Spatial Certainty. A separate ANOVA was conducted for each subscale, and each analysis indicated no significant effects or interactions; in each case, F(1, 56) < 3.89, p > .05, ηp2 ≤ .065. The results of these analyses suggest that there were no significant differences in pretask subscale scores among experimental conditions; thus any differences observed in subsequent analyses must be attributable to differences in task-induced stress. To simplify subsequent analyses, change scores were calculated for each subscale by calculating the difference between each participant’s pretask and posttask rating (posttask minus pretask). Figure 2 depicts mean subscale change scores for each of the four demand conditions created by the current 2 (Event Rate) × 2 (Spatial Certainty) design.
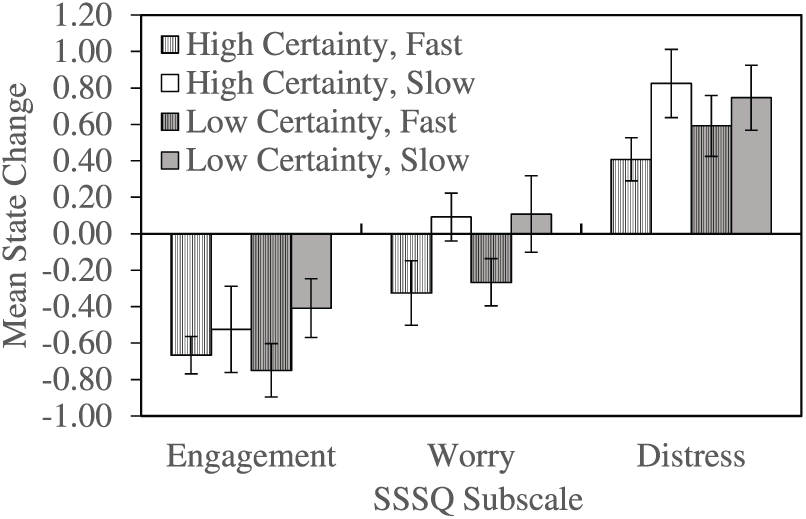
Change scores for each demand condition (low and high spatial certainty, and slow and fast event rate) for three subscales of SSSQ: Engagement, Worry, and Distress. Negative scores indicate a decrease from pretask to posttask, positive scores an increase. Error bars represent ± 1 standard error of the mean.
One-sample t tests were used to determine whether the depicted change scores were significantly different from zero. For these analyses, the four t tests required to fully analyze change scores for each subscale were treated as a family, within which alpha inflation was controlled using the Bonferroni correction. Engagement was found to decrease significantly for participants who completed a drive with a fast event rate and spatial uncertainty or a drive with a fast event rate but no spatial uncertainty, (p < .0125, d > 1.32, in each case). In contrast, in the slow event rate conditions, no significant change in Engagement was detected, regardless of whether the appearance of hazards was spatially uncertain (p > .0125, d ≥ 0.57, in each case). These change score analyses also revealed that Distress increased significantly in all conditions (p < .0125, d > 0.89, in each case). Lastly, analyses of the Worry subscale indicated no significant changes during the course of the drive, for any condition (p > .0125, d < .69, in each case).
To better elucidate any demand-related differences in subscale change scores, separate 2 (Event Rate) × 2 (Spatial Certainty) independent-measures ANOVAs were used to analyze changes in Engagement and Distress. Both of these analyses resulted in a lack of significant main effects and interactions, suggesting that neither Event Rate nor Spatial Certainty had a significant impact on ratings of Engagement or Distress, F(1, 56) < 3.01, p > .05, ηp2 < .51. Worry was not analyzed further, since the previous one-sample t tests indicated no changes.
Discussion
The present study was conducted to determine whether variations in task demands impact a driver’s ability to maintain vigilance for the detection of potential automation failures, which is a key element of a driver’s duties when operating a modern partially automated vehicle (SAE International, 2016). Previous research has indicated that a driver’s ability to perform this duty wanes over time in much the same way that performance declines in traditional laboratory vigilance tasks (Greenlee et al., 2018). However, the cause of the vigilance decrement in partially automated vehicles is unknown, preventing effective countermeasure development. We tested the possibility that driver overload (i.e., resource depletion) is responsible for the observed performance decline by manipulating the demands associated with monitoring for automation failures. We predicted that performance would be negatively impacted by increased spatial uncertainty and event rate, two parameters known to impact vigilance task demands (Warm et al., 2015).
This was indeed the case. Drivers’ abilities to correctly detect signs of automation failure diminished when the signal processing demands of vigilance were increased. Specifically, ability to correctly detect hazards was reduced by increasing the rate of events that necessitated driver inspection and by increasing spatial uncertainty about the location of those events. These results replicate findings from previous research on event rate (Davies & Parasuraman, 1982; Parasuraman & Davies, 1977; Sawyer et al., 2014) and spatial uncertainty (Adams & Boulter, 1964; Funke et al., 2017; Helton, Weil, Middlemiss, & Sawers, 2010) in vigilance tasks, suggesting that monitoring demands should be a concern. Moreover, these results support the overload explanation of the vigilance decrement, as performance became worse as task demands were increased.
Like hazard detection accuracy, drivers’ false alarm rate fell over time. This is also sometimes observed in vigilance tasks (e.g., Shaw et al., 2009), but it was not observed in the previous study of vigilance in partially automated vehicles (Greenlee et al., 2018), wherein false alarms remained stable. One possible explanation for this finding is that in both studies we used a higher signal probability in training than in the full drive. This was done to ensure participants had ample opportunity to observe the hazards before being tasked to watch for them during the full drive. This method has been used in previous vigilance research (e.g., Greenlee et al., 2015). However, a potentially negative side effect of this approach is that the higher signal probability in training may cause participants to be biased toward more frequent responding at the start of a vigilance task, and this bias may decrease over time as participants adjust to the lowered probability. To assuage any doubt that the observed decrements in correct detections and false alarms were due entirely to a shift in response bias, we analyzed sensitivity and bias metrics derived from signal detection theory (See, Howe, Warm, & Dember, 1995; See et al., 1997). The results of these analyses indicated both a decline in sensitivity and a shift toward more conservative responding during the full drive. Although the bias shift could be caused by the higher signal probability in training, the sensitivity decrement could not. Instead, the sensitivity decrement confirms that, as the drive progressed, drivers were decreasingly capable of discriminating hazardous signs of automation failure from benign elements of the roadway environment. Similar sensitivity decrements have historically been considered exemplars for attentional resource depletion (Parasuraman & Davies, 1977; See et al., 1995). Thus, the observed loss of sensitivity is further evidence that overload is the root cause of the vigilance decrement in partially automated vehicles.
The current study replicated the vigilance decrement in hazard detection performance reported by Greenlee and colleagues (2018). This provides additional evidence that a driver’s ability to monitor automation and act as a failsafe for partially automated vehicles is temporally limited. Further, the present findings indicate that the safety costs of a vigilance decrement may be greater when monitoring demands are high within partially automated vehicles, as more challenging monitoring conditions may hinder hazard detection even before the vigilance decrement takes a toll.
Although results support a resource theory explanation of the vigilance decrement, the magnitude of the vigilance decrement was not significantly impacted by task demand manipulations. Resource theory predicts a more severe temporal decline in performance when task demands are elevated. Observation of mean performance values in the present study reveals trends that support this prediction. For example, the largest correct detection decrement (20% decrease from period 1 to 4) occurred within the spatially uncertain, fast event rate condition; the smallest decrement (6% decrease from period 1 to 4) occurred within the spatially certain, slow event rate condition. However, the interactions involving period of watch, event rate, and spatial certainty were not significant, possibly due to insufficient power.
The present findings are also relevant to the discussion of “dynamic vigilance” tasks, in which the observer’s first-person point of view is moved through a realistic, 3-dimensional environment. When Szalma, Schmidt, Teo, and Hancock (2014) employed a dynamic vigilance task, observers’ detection performance remained stable over time; it did not decline. Szalma and colleagues argued, as others have (e.g., Hancock, 2013), that vigilance decrements are often due to the artificiality of displays employed, and that the relatively realistic nature of dynamic vigilance tasks prevents the vigilance decrement. The current results and the recent results of Greenlee and colleagues (2018) provide counterevidence to this argument; the partially automated driving simulations used in these studies are dynamic vigilance tasks, yet observers were not immune to the vigilance decrement. Greenlee and colleagues raised the possibility that the presence or absence of a vigilance decrement in dynamic vigilance tasks may be determined by task factors that impact the vigilance decrement within traditional vigilance tasks (e.g., task length, event rate). The effects of event rate and spatial uncertainty observed within the current study suggest that task factors do indeed impact vigilance performance in dynamic vigilance tasks. The implication is that the realism of dynamic vigilance tasks does not fully insulate observers from the demands of vigilance. More research is needed to fully explore the potential benefit of dynamic vigilance tasks, and partially automated driving provides an effective context for doing so.
Subjective reports of driver workload and stress in the current study provide convergent evidence that monitoring vehicle automation is challenging. Workload ratings from the NASA-TLX were extremely high; global demand pushed into the upper end of the scale, as did the ratings for several subscales: Mental demand, temporal demand, effort, and frustration. Driver stress, as indexed by the Short Stress State Questionnaire, also reflected disturbances in operator state. The task of monitoring for hazards signifying potential automation failures led to increased driver distress and decreased driver engagement. These workload and stress results are typical outcomes of demanding vigilance tasks and have historically been interpreted as supplemental evidence for the overload theory of the vigilance decrement (for review, see Warm et al., 2008).
Surprisingly, measures on the workload and stress scales did not exhibit differences among the demand conditions. This is unexpected because previous research with the NASA-TLX (Finomore et al., 2013) and the SSSQ (Szalma, Thropp, & Hancock, 2008) showed that task difficulty can affect scores on these measures. Given the observed differences in hazard detection performance, it seems most likely that the lack of differences in subjective workload and stress occurred because subjective scales were less sensitive to our demand manipulations. Disturbingly, the insensitivity of these subjective measures may also indicate that drivers themselves are not sensitive to variations in monitoring demands and raises the possibility that drivers are not aware of demand-induced performance impairment.
Nevertheless, the attentional toll of automation monitoring jeopardizes the safety of partially automated vehicles and should be considered a major limitation of driver-automation interaction. This issue is distinct from another major concern: Drivers tend to become complacent and disengaged from their monitoring duties, and this reduces situation awareness and readiness to respond manually (e.g., Banks, Eriksson, O’Donoghue, & Stanton, 2018). Complacency and other forms of automation misuse (e.g., distracted driving) are worrying, but our findings suggest that even with proper automation use (i.e., consistent automation monitoring), drivers’ awareness of potential automation failures and readiness to respond declines due to overload-induced vigilance decrements. Vehicle automation designers should aim to mitigate misuse while ensuring that monitoring demands do not overwhelm a properly engaged driver.
Additional research is needed to further explore the impact that situational variables have on a driver’s ability to remain vigilant in partially automated vehicles. The current study tested a subset of the variety of real-world driving environments. We modeled the present study on traditional vigilance tasks wherein the monitoring task is relatively simple and there is little if any distracting or irrelevant visual stimuli. This represents a limitation of the current study, because our simulated driving environment may not be representative of the diverse driving conditions within which partially automated vehicles may be used. Perhaps more complex driving environments, such as curved roads, high-density highway traffic, or scenic routes would result in different outcomes for driver vigilance. In short, future research should expand upon the current findings by evaluating driver vigilance within settings that better approximate the realistic complexity and diversity of driving environments. Doing so will facilitate a more comprehensive assessment of driver vigilance in partially automated vehicles and the impact of variable sources of task demands, distraction, and fatigue.
We would also suggest that researchers conduct comparisons between drivers of manually operated vehicles and partially automated vehicles. Previous research investigating the effects of vigilance demands within manually controlled vehicles indicates that driver underload may be more of a concern than driver overload (Matthews & Desmond, 2002). Studies involving direct comparisons of manually controlled and partially automated vehicles may serve to identify differential roles of vigilance and the potential impact of task demands in each mode of operation.
In conclusion, the present research demonstrates that drivers of partially automated vehicles are impaired by the vigilance decrement and elevated task demands, meaning that safe operation of such vehicles becomes less likely when the demands associated with monitoring automation increase and as a drive extends in duration. This study also supports the notion that vigilance performance in partially automated vehicles is likely driven by driver overload. Consequently, we encourage researchers and developers of automation technologies to consider countermeasures that may serve to attenuate a driver’s cognitive load when tasked with monitoring automation. Possible solutions include the enforcement of rest breaks (e.g., Helton & Russell, 2017), development of systems capable of detecting and responding adaptively to driver overload (e.g., Scerbo, 2007), and limiting the availability of automation to situations where task demands are manageable. Further research is needed to evaluate these and other possible strategies to counteract or prevent the vigilance decrement in partially automated vehicles.
Key Points
When tasked with monitoring for signs of automation failure, drivers of partially automated vehicles suffer from the vigilance decrement, leading to detection errors that could cause a collision.
Drivers’ detection performance is further reduced by increasing the demands associated with monitoring.
Monitoring partially automated vehicles is difficult and stressful, and safe operation becomes less likely as demands of monitoring automation increase and as a drive extends in duration; overload and its effects on driver vigilance require careful consideration in the development safe vehicle automation.
Footnotes
Acknowledgements
The following corrections have been made from the OnlineFirst version of this article: on p. 480, a typo was fixed in the value 100%-100%/(2N), and the “Bias” subsection on the same page was updated to clarify the indications of the polynomial trend analysis. Additionally, in Table 4, parenthetical standard error values were revised to be actual instead of rounded values.
Eric T. Greenlee is an assistant professor in the Human Factors Psychology Program within the Department of Psychological Sciences at Texas Tech University. He received his PhD in experimental psychology from the University of Alabama in 2015.
Patricia R. DeLucia is a professor in the Department of Psychological Sciences at Rice University. She is a Fellow of the American Psychological Association, Association for Psychological Science, Human Factors and Ergonomics Society, and Psychonomic Society. She completed her PhD in Experimental Psychology at Columbia University in 1989.
David C. Newton is a graduate student in the Human Factors Psychology Program within the Department of Psychological Sciences at Texas Tech University. He obtained an MA in experimental psychology from the University of Central Oklahoma in 2016.