
Abstract
Objective
We investigated passenger’s trust and preferences using subjective, qualitative, and psychophysiological measures while being driven either by human or automation in a field study and a driving simulator experiment.
Background
The passenger’s perspective has largely been neglected in autonomous driving research, although the change of roles from an active driver to a passive passenger is incontrovertible. Investigations of passenger’s appraisals on self-driving vehicles often seem convoluted with active manual driving experiences instead of comparisons with being driven by humans.
Method
We conducted an exploratory field study using an autonomous research vehicle (N = 11) and a follow-up experimental driving simulation (N = 24). Participants were driven on the same course by a human and an autonomous agent sitting on a passenger seat. Skin conductance, trust, and qualitative characteristics of the perceived driving situation were assessed. In addition, the effect of driving style (defensive vs. sporty) was evaluated in the simulator.
Results
Both investigations revealed a close relation between subjective trust ratings and skin conductance, with increased trust and by trend reduced arousal for human compared with automation in control. Even though driving behavior was equivalent in the simulator when being driven by human and automation, passengers most preferred and trusted the human-defensive driver.
Conclusion
Individual preferences for driving style and human or autonomous vehicle control influence trust and subjective driving characterizations.
Application
The findings are applicable in human-automation research, reminding to not neglect subjective attributions and psychophysiological reactions as a result of ascribed control duties in relation to specific execution characteristics.
Keywords
Introduction
Autonomous driving will change the future of mobility, providing solutions to increase traffic safety (Fagnant & Kockelman, 2015) and ensure environmental and social sustainability (Krueger, Rashidi, & Rose, 2016; Nicolaides, Cebon, & Miles, 2017). Furthermore, this technological advance paves the way for more accessible individual and collective motorized mobility to people who are currently hindered from driving, for example, by disabilities, as people do not have to be actively integrated into the mere driving task anymore when driving fully autonomously (Strickfaden & Langdon, 2018). This corresponds to the highest level of automation in driving (Level 5) proposed by SAE (SAE International, 2016). The automated vehicle is capable and in control of all driving tasks, and the driver is not a fallback solution. It is comparable to going by bus or by taxi, except, of course, no other human has to be present—people will just be passengers and can relax, sleep, or pursue other activities. This constitutes a major change of roles from an active driver to a passive passenger when going from manual or assisted to autonomous driving.
Current research largely focuses on assisted or highly automated driving, considering the effects of takeovers and keeping the driver in the loop not only on task performance but also on subjective appraisals like usability, acceptance, or trust (e.g., Walch et al., 2017). Studies focusing on self-driving vehicles that do not require human intervention are predominantly forced by online or qualitative studies trying to investigate expectations and acceptability of this future mobility (e.g., König & Neumayr, 2017; Strickfaden & Langdon, 2018; Ward, Raue, Lee, D’Ambrosio, & Coughlin, 2017). In most cases, autonomous driving is compared with their individual experience as driver—instead of the comparison to be driven by another human—provoking results like, for instance, the impact of driving pleasure that might be missing (König & Neumayr, 2017). However, taking another perspective—the perspective of a passenger—can complement the evaluation and in some cases be more beneficial for gathering new insights into autonomous driving by disturbing experiences from traditional roles of being a driver (Ive, Sirkin, Miller, Li, & Ju, 2015). Moreover, the switch from the driver’s seat to the passenger’s seat does not only change the (visual) perspective but also entails a change in the task for the human. This confound can limit the validity of such existing research for this question. Furthermore, new insights on preferences and appraisals can be gathered in autonomous vehicle research, when comparing being driven by human versus automation.
Investigations of human appraisals and preferences in relation to task fulfillment by a human or autonomous entity were conducted in different human factors contexts, for instance, in air traffic (e.g., Hughes, Rice, Trafimow, & Clayton, 2009), road transport (e.g., Wintersberger, Riener, & Frison, 2016), human–robot interaction (e.g., Sanders, Kaplan, Koch, Schwartz, & Hancock, 2019), or decision aid systems (e.g., Lyons & Stokes, 2012). In consideration of the increasing automation of airplanes, people were asked to rate their feelings toward the confidence and trust in the pilot, which was determined as either human or an autopilot system. Overall, the human pilot was favored over the automation, and feelings or affective processes were shown to guide this relation (Hughes et al., 2009). In contrast, no preferences were observed in a road transport study comparing driven either by man, woman, or autonomous car (Wintersberger et al., 2016). In the context of human–robot interaction, the choice of task performer depended on situational factors. Preferences were observed for robot over human in dangerous, less safe tasks, whereas preferences for human over robot were mainly justified by financial reasons for the human (Sanders et al., 2019). In decision aid systems, no differences in relying on human aid relative to automation aid were reported. However, when faced with high-risk decisions, people tended to reduce reliance on human aid (Lyons & Stokes, 2012) and consequently preferred the automation. Overall, preferences for human or automation in control depend on the context and do not seem generalizable.
Tackling this apparent gap of passenger’s perspectives in existing autonomous vehicle research, the investigations presented here compared the effects of being driven by human and automation perceived from a passenger’s seat by keeping all other factors constant, like the person sitting on the driver’s seat. In a first exploratory study, participants were passengers in a self-driving research vehicle striving for SAE Level 5, albeit with legally required safety staff, in public traffic. A second study was implemented in a high-fidelity driving simulator to gather further insights into participants’ trust and preferences in response to being driven by human and automation from a passenger’s seat perspective. Furthermore, expectations placed in exemplary human drivers from a passenger’s perspective and the effects of differential driving styles were assessed qualitatively in the simulator. Both studies contained objective and subjective responses as approximations for passenger’s trust, acceptance, and relating psychophysiological activity. The data in the field and simulator provide a deeper understanding of passengers’ trust and preferences in autonomous driving. Moreover, qualitative analyses may deliver starting points for designing optimally trusted and accepted automation from the passenger’s perspective.
The Passenger’s Perspective in Autonomous Driving
Future mobility concepts promote that passengers in autonomous vehicles will neither have to observe the automation nor the environment. Non-driving-related activities can be pursued, ranging from working to daydreaming. Despite these advantages for passengers, participants stated in interview studies that they would be worried about breakdowns (Petterson & Karlsson, 2015). Surveys indicated that people hesitate with or are concerned about autonomous vehicle adoption (Haboucha, Ishaq, & Shiftan, 2017; Kyriakidis, Happee, & de Winter, 2015). Several studies showed that the perception of autonomous driving is determined by individual characteristics and attitudes of potential users (Haboucha et al., 2017; Hulse, Xie, & Galea, 2018; Kyriakidis et al., 2015; Payre, Cestac, & Delhomme, 2014). But how seriously should these concerns be taken? Every day, millions of passengers use buses and taxi cabs without worrying about safety but showing high levels of trust (Lacher, Grabowski, & Cook, 2014). Prior results might be a consequence of evaluating autonomous driving from a driver’s instead of a passenger’s perspective. Therefore, it is not clear that a change from manual to autonomous riding will not be accepted and welcomed by vehicle occupants. Research is needed to gain insights into the perceptions, reactions, subjective impressions, and potential reasons for discomfort toward fully autonomous driving. To draw valid conclusions in comparison to current existing manual driving, we need to take the passenger’s perspective. Only this methodological approach allows for addressing and investigating potential differences when being driven manually versus autonomously by standardizing all potential other influencing factors, like workload or task engagement to focus on the mere effect of occupied control by human or by machine. Furthermore, it is much easier for a participant to understand and appreciate the distinct role that he or she received while sitting on a passenger’s seat.
Only a few investigations favored the passenger’s perspective. For instance, Strickfaden and Langdon (2018) made a qualitative study about activities, social interactions, and seating opportunities in driverless vehicles by letting people sit in a traditional car on the passenger’s seat for carrying out a change of perspectives. Schaefer and Straub (2016) addressed the design of driverless passenger vehicles by showing that traditional control interfaces forced people more often to intervene. Consequently, when investigating self-driving vehicles in a traditional driving simulator or research vehicle, it might be useful not providing pedals or steering wheel or choosing another seating position.
Some researchers also focused on the experience and perception of being driven by a human driver and an autonomous agent from a passenger’s perspective. In an online investigation, people saw traffic videos containing different driving errors. They were either informed to be driven by another human or by a fully autonomous system. Results indicated no differences in trustworthiness, performance, and severity ratings between human and automation (Kohn, Quinn, Pak, de Visser, & Shaw, 2018). Similarly, in a passenger simulator study having either a woman, a man, or an autonomous system driving, no effects were observed (Wintersberger et al., 2016). The researchers focused on stress indicators using heart rate variability, emotional states based on facial expression and questionnaires, and interview data. However, all data revealed no differences between the driver characteristics, leading to the conclusion by Wintersberger and colleagues (2016) that people are ready to accept and use autonomous vehicles. Still, central variables that could have shown an effect, such as trust, were not investigated in the simulator. Furthermore, the emotional states investigated in this study were scarcely observed, and traffic situations were not disentangled for analyses. Besides, Wintersberger, Frison, and Riener (2018) compared the usefulness and acceptance of an automated bus shuttle and a manually driven alternative in real traffic. Perceived usefulness was observed to be rather small for the automated shuttle due to the low speed as participants stated to be “faster by foot.” Therefore, the passenger’s perspective was hardly comparable between being driven by automation and by a human in realistic traffic situations. In a comparable setting, Salonen (2018) indicated no trust issues regarding safety from passengers of an autonomous bus going on a separated track, but open to the public. Thus, experimental investigations regarding the effects of autonomous driving on passenger’s appraisal in comparison to a human driver are still on early stage; as a consequence, further research aiming to understand the impact of being driven by human or machine is needed.
Trust of Autonomous Driving
Regularly, when people are passengers, they are being driven by another human either in a private vehicle or a public bus or train. Trust is the essential requirement to get on board. Otherwise, mistrust would prevent the usage and acceptance, which is why it is a focus of current research for automation adoption (Ghazizadeh, Lee, & Boyle, 2012; Ward et al., 2017). In line with this assumption, surveys and driving simulator investigations showed trust to be an important component of technology adoption (Molnar et al., 2018). This relation between trust and acceptance in automation research was established by Ghazizadeh et al. (2012) proposing the Automation Acceptance Model which is based on the Technology Acceptance Model by Davis (1989). The Automation Acceptance Model relates acceptance and system use based on users’ perceptions, beliefs, and attitudes that are influenced by trust (Ghazizadeh et al., 2012).
Trust is defined as an attitude that “an agent will help achieve an individual’s goals in a situation characterized by uncertainty and vulnerability” (J. D. Lee & See, 2004, p. 54). Especially in initial usage situations, people are exposed to an uncertain and potentially vulnerable environment and need to entrust their safety to the automation (Körber, Baseler, & Bengler, 2018). Such initial usage situations may soon be ubiquitous when the first autonomous cars are generally available to the public.
The development of trust can be seen as an affective response (Merritt, 2011) influenced by analytic processes and moderated by a variety of factors (Körber et al., 2018). Among others, individual characteristics and dispositions, like individual propensity to trust in automation (Hoff & Bashir, 2015), play a crucial role (see Hock et al., 2018 for an overview). Especially, high expectations about the automation’s performance are related to the propensity to trust and associated with increased trust ratings (Lyons & Guznov, 2019; Merritt, Unnerstall, Lee, & Huber, 2015). Furthermore, people who showed higher comfort with other drivers behind the wheel were more likely to indicate higher trust in automation (Molnar et al., 2018). Apart from attitudes and dispositional factors, trust and acceptance are also affected by factors of the situation (Hoff & Bashir, 2015), ranging from system performance and errors (J. Lee & Moray, 1992) to driving style (Morris, Erno, & Pilcher, 2017). Furthermore, trust is affected by gathered knowledge from past learning experience (Hoff & Bashir, 2015). Initial experience with autonomous cars was shown to increase trust in these systems (Hartwich, Witzlack, Beggiato, & Krems, 2018) and to reduce concerns that could prevent the usage of such vehicles (Eden, Nanchen, Ramseyer, & Evéquoz, 2017). Consequently, trust can alter over time and is considered as a dynamic multidimensional construct (Hoff & Bashir, 2015; J. D. Lee & See, 2004).
Psychophysiological Measures in Autonomous Driving
To address passenger appraisals in addition to subjective trust and acceptance ratings in autonomous vehicle research, objective psychophysiological measures may prove beneficial, given that they may provide a continuous measure of activation of participants. In the context of vehicle automation research, different psychophysiological indicators have been applied and reported, for instance, in the context of cognitive load assessment (e.g., Park, Jeong, Park, & Lee, 2016; Takeda et al., 2016), stress (e.g., Morris et al., 2017; Wintersberger et al., 2016), or discomfort appraisals (e.g., Beggiato, Hartwich, & Krems, 2018). A review of psychophysiological measures to assess cognitive states in driving is provided by Lohani, Payne, and Strayer (2019). This review contains further insights into the applicability and feasibility of a large variety of psychophysiological measures in lab and real-world settings. As electrodermal activity is easy to collect and applicable in simulation and real-world driving setting, we chose to assess skin conductance data during driving. Skin conductance is a measure of electrical conductivity of the skin, resulting from moisture from sweat glands on the surface of the skin (Boucsein, 2012). The electrodermal activity can be characterized by two central elements, tonic (skin conductance level) and phasic components (skin conductance responses). While tonic skin conductance is varying slowly, phasic activity labels fast varying activation that reflects stimulus specific or nonspecific bursts in sympathetic activation (Benedek & Kaernbach, 2010). This electrodermal activity is influenced by the autonomic nervous system and has been widely used as an objective measure for general activation level, stress, workload, and task demand (e.g., Healey & Picard, 2005; Reimer, Mehler, Coughlin, Godfrey, & Tan, 2009; Solovey, Zec, Garcia Perez, Reimer, & Mehler, 2014; Wilson, 2002) and was related to trust in automation in prior research (Lohani et al., 2019).
Following Morris et al. (2017), being driven by automation can be considered as a stressor, especially when trust is low. In accordance, skin conductance was smaller when participants drove manually compared to when they were driven by automation; when passengers were relaxed, they tended to show increased trust and less skin conductance (Morris et al., 2017). Mediated by stress, skin conductance might therefore also change when trust changes, assuming that lower trust might be connected to higher stress. However, it has to be pointed out that the theoretical and empirical basis for a connection of trust to skin conductance is yet small, which is why skin conductance data and its connection with trust are treated as exploratory in this investigation.
Driving Style of Autonomous Vehicles
Effects of being driven by a human driver in comparison to an autonomous system in the same car can be strongly influenced by different driving styles exhibited by the human driver compared to an autonomous system: Driving style is a pivotal factor for a positive experience, comfort, and acceptance in automated driving (Bellem, Schönenberg, Krems, & Schrauf, 2016; Hartwich et al., 2018). Especially, the perception of safety and familiarity with the own driving style were observed to be relevant (Hartwich et al., 2018). Several researchers distinguished between defensive or safe and risky or aggressive driving style in the context of autonomous driving (Basu, Yang, Hungerman, Singhal, & Dragan, 2017; Morris et al., 2017; Yusof et al., 2016). Morris et al. (2017), for example, showed that a safe and rule-conforming driving style compared to a more risky driving style, operationalized via speeding and drifting within the lanes, led to higher trust and lower skin conductance. Still, personality factors and individual preferences were neglected here. But how do people want to be driven in an autonomous vehicle? Studies showed that people “want the car to drive like they think they drive” (Basu et al., 2017, p. 418). However, participants failed frequently to correctly identify their own driving style (Basu et al., 2017). A preference for defensive driving characteristics is prevalent, in general, more defensive than the own driving behavior (Basu et al., 2017; Yusof et al., 2016). Furthermore, older drivers tended to favor an unfamiliar, faster driving style compared to their manual performance (Hartwich et al., 2018).
Field Study
Research Aims
Within this project, we investigated passengers’ appraisals considering trust and skin conductance in a real world and controlled driving simulator setting. We foremost focused on the effect of being driven either manually by a human or autonomously by a vehicle. In an exploratory real-world investigation, we gathered first insights in real-world passengers’ psychophysiological activation and subjective trust. Based on gained insights, a follow-up standardized driving simulator experiment was conducted to explicitly test and evaluate relevant influencing factors.
Method
In the exploratory, within-subjects field study, the participants went by an autonomous research vehicle, which was operated once manually and once autonomously (striving for SAE Level 5) on a public road. Due to legal restrictions, two engineers were placed in the driver’s and passenger’s seat to monitor the car and would have taken over if it would have been necessary. Therefore, the participants rode in the middle rear-seat, enabling the best possible view (see Figure 1). Manual and autonomous driving mode was distinctive for the passenger as they got clear instructions at the beginning of each ride, and the hands of the driver were not at the wheel in autonomous mode, but he was actively steering in manual mode. In the course of the study, subjective trust and skin conductance were recorded.
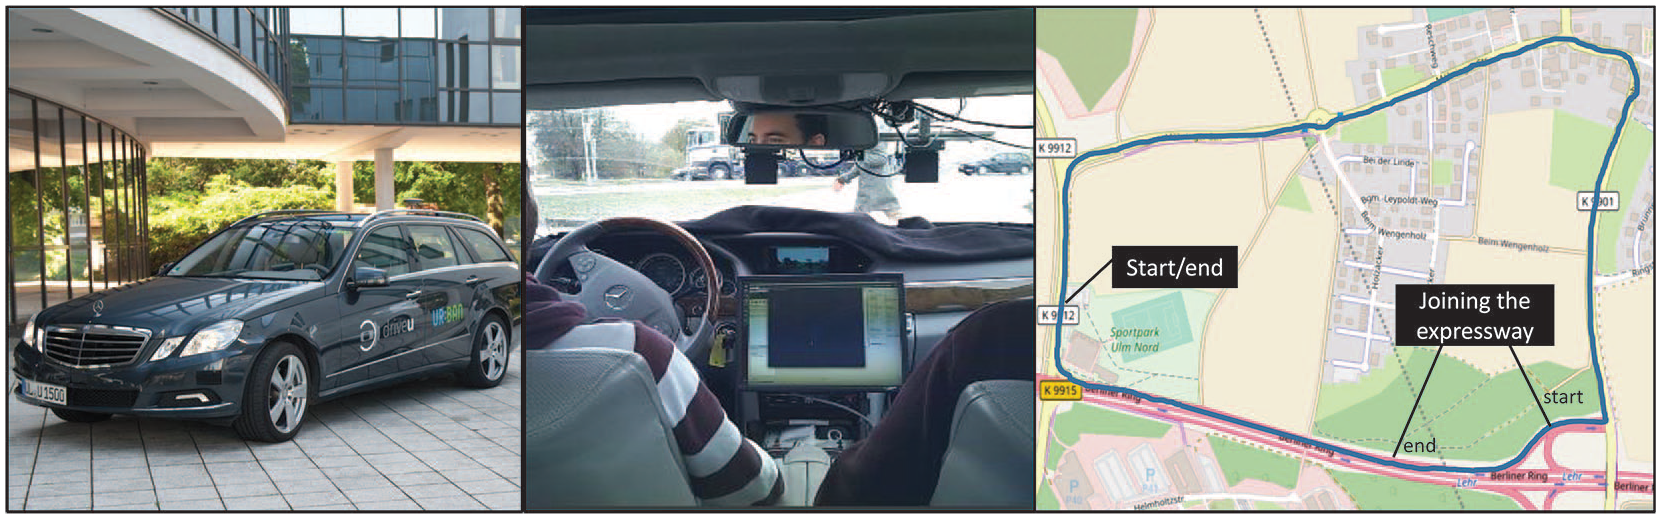
From left to right: Autonomous research vehicle, view from a passenger’s perspective, selected route for each driving mode (©OpenStreetMap contributors, map data available under open database license).
Subjective trust was rated on an 11-item validated German trust scale (Pöhler, Heine, & Deml, 2016) based on Jian, Bisantz, and Drury (2000). It was adapted for the purpose of this experiment to measure trust in automation and trust in a human driver (slight modifications, for example, “from the automated system” to “the driver”). Moreover, skin conductance was assessed with a NeXus-10 Mark II (Mind Media BV) at a sample rate of 32 Hz using Ag/AgCl electrodes, which were attached to the tips of the index and middle fingers. Biotrace+ software was used for data recording and storage.
The field study was conducted in accordance with the tenets of the Declaration of Helsinki. After welcoming and informing participants about the aims of the investigation in the field, each participant gave informed consent and experienced the same route twice in close to balanced order (NAutomationFirst = 5, NHumanDriverFirst = 6), once driven by a human driver and once in automation mode. Trust was assessed before and after the drives while skin conductance was measured during each drive.
Starting from a public parking lot, the first section of the route included a country road and a right-hand turn toward a village. After crossing a roundabout, the route led through a suburban area and exited the village. After a further short country road, a right-hand turn onto the driveway to a motorway was performed. After merging into the motorway, the last section of the route included a two-lane motorway which led to a traffic light. The predetermined course ended again on the public parking lot. The test drives took place outside rush-hour (for more details, see Figure 1; the starting point was at 48.428° latitude and 9.957° longitude). The course was performed faster by the human driver MDuration = 3 min 40 s (SDDuration = 21 s) compared to the automation MDuration = 4 min 16 s (SDDuration = 20 s).
Eleven students from Ulm University with a valid driver’s license and normal or corrected-to-normal vision (MAge = 23.3, SDAge = 4.6, 9 females) participated in this field study and were rewarded with course credits.
Results
Subjective ratings of trust were gathered before and after each course. An increase was observed comparing trust ratings before (manual: M = 4.38, SD = .43; autonomous: M = 4.14, SD = 0.57) and after (manual: M = 4.86, SD = 0.65; autonomous: M = 4.49, SD = 1.02) the ride descriptively, but could not be confirmed by statistical analyses. Furthermore, the numerical increase did not differ between the human and autonomous modes (Wilcoxon-test Z = 1.15, p = .25). Consequently, before and after ratings were merged to compare being driven by a human (M = 4.61, SD = .55) with being driven by an autonomous vehicle (M = 4.30, SD = 0.81), which was associated with significantly higher trust (Z = 2.22, p = .03).
Skin conductance was z-standardized to enable comparability between participants. In Figure 2a, skin conductance is depicted for the whole route of the field study. At the beginning of the drive, skin conductance was descriptively lower for human compared to autonomous driving mode; however, this difference did not emerge significant in a Wilcoxon test (Z = 0.89, p = .37). It is discernible that an initial decline in skin conductance is followed by a positive trend that could be found throughout both driving modes.
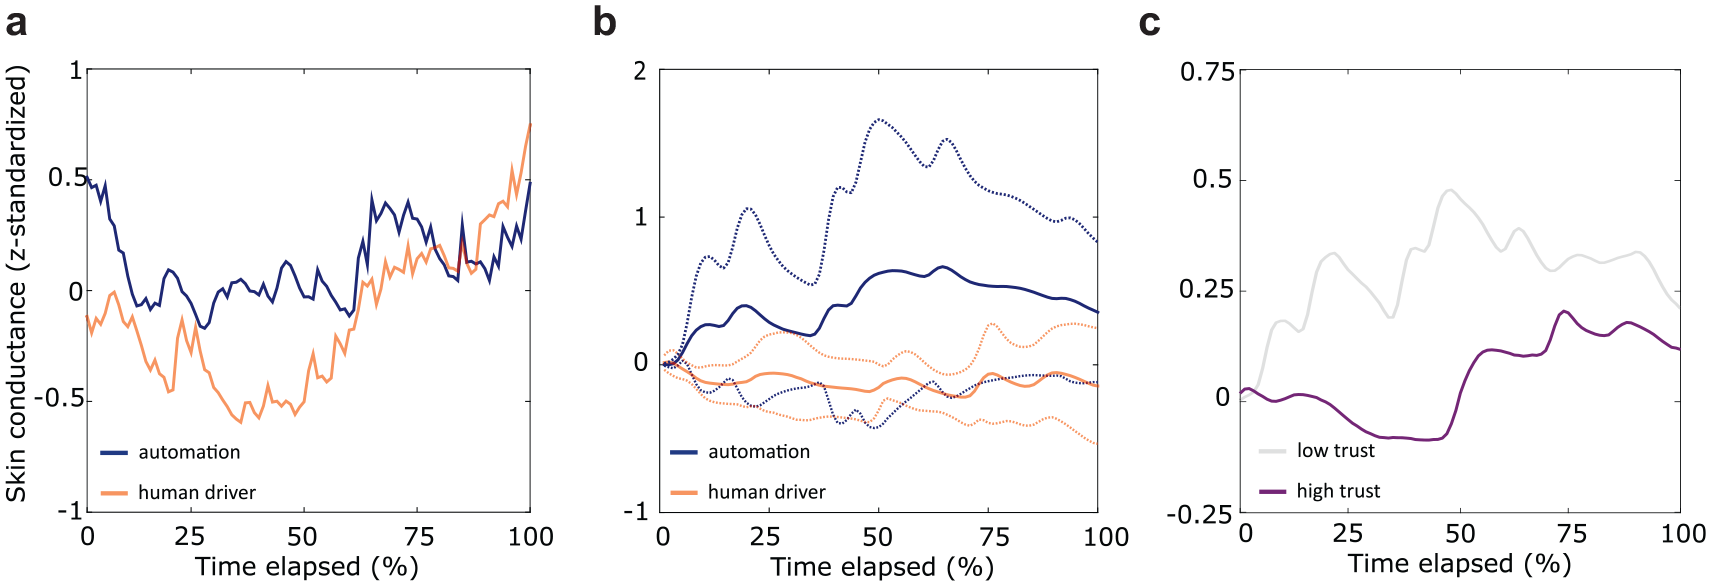
Skin conductance in the field study (automation = dark blue, human driver = light red): (a) z-standardized skin conductance for the whole route. (b) z-standardized and baseline-corrected skin conductance for joining the express road. Beginning and end of this event are depicted in Figure 1 right. Dotted lines represent respective 95% confidence intervals. (c) z-standardized skin conductance for the same event as in b, split along the median of trust ratings (high trust = purple, low trust = light gray).
When inspecting driving events, it became evident that the anticipation and the subsequent joining into an express road might have caused a phasic response. Traffic was comparable for all drives for this event, that is, when going on the motorway ramp to the expressway, there was never a car in front of the research vehicle. This phasic event is visible in Figure 2a; however, as driving durations differed between drives, skin conductance for automation and human driving cannot be compared directly. Therefore, skin conductance was event-locked (see Figure 1 right for the beginning and end of the event). In Figure 2b, this event is depicted in conjunction with functional 95% confidence intervals. Baseline was set to the beginning of the event that was defined by a specific road sign that signaled the start of the ramp to the express road. The analyzed interval lasted from passing this road sign (t0 in Figure 2b) to the point when the car had merged into the express road (t100 in Figure 2b). Skin conductance showed to be significantly lower throughout this critical interval for being driven by human compared to automation, as revealed by a nonparametric Wilcoxon test (Z = 2.31, p = .02). Based on trust ratings, skin conductance was split for joining the expressway into participants with lower and higher trust than the median (Figure 2c). Skin conductance for each drive did not correlate significantly with trust ratings; however, descriptively both correlations were moderately negative (Spearman’s correlations: manual: ρ = −.59, p = .09; autonomous ρ = −.44, p = .23).
Implications
The exploratory field study revealed two major results. First, people sitting in an autonomous vehicle for the first time showed higher trust if a human was driving compared to an autonomous system. Second, increased physiological activity was observed when the automation was in control during specific events. Joining the express road might be considered as safety critical in comparison with the other road events in a way that it might have been perceived as stressful in the autonomous system. This might explain the significantly larger response in skin conductance when the automation was in control in comparison to the human driver.
These results were gathered using a real autonomous car in nonseparated public space, but some generalizations are difficult to make given the variety of uncontrolled influencing factors. As the study was performed on a cold day in late autumn, participants had warm clothing. Being in the autonomous car with its computers and sensors operating, the temperature rose from the beginning of the ride (when the door was open to apply the devices). Therefore, a subsequent investigation should keep the temperature constant to be able to make claims about the effects of habituation based on skin conductance. Furthermore, movements may have affected skin conductance—these have likely occurred in the field experiment to compensate effects of acceleration and deceleration in the mid seat of the rear bench. In general, the unusual position of the mid seat enabled a broad field of view but might have affected individuals’ perception. Besides, single drives can only be compared to some extent, because actions of other, noncontrolled traffic participants influenced human driver’s or automation’s behavior. Moreover, the driving modes deviated with regard to their duration, which is a possible confound. Driving using the automation lasted longer showing reduced speed under autonomous driving, especially when approaching stop lines or curves. This might alone have affected trust ratings, which is why the precise contribution of the driving mode to trust ratings remains speculative. Effects attributed to the driving mode could thus result from a differential driving style. Given the small sample size and restrictions regarding temperature or internal validity in this exploratory study, a more detailed second investigation was necessary to make well-justified claims.
Driving Simulator Study
Research Aims
The field study revealed a substantial difference of subjective estimations of trust and (in part) psychophysiological activation when being driven by human compared to automation. Assuming that driving style might be the underlying factor for these differences, we systematically varied driving style—defensive versus sporty—in the simulator study independently of the driving mode to disentangle effects of driving mode and style.
In addition, we collected data on individual mode preferences and personal driving style to get further insights into the dynamics of passengers’ trust and their underlying physiological, emotional, and cognitive processes in driving situations. Moreover, trust related gaze data of this investigation were gathered and reported in Strauch et al. (2019).
As research investigating the effects of Level 5 autonomous driving is still at the beginning, also qualitative data were collected for a holistic view. This allowed relating the manipulated driving styles to respective individual preferences for their ideal style of being chauffeured.
Summarizing, we addressed the following three research questions in the driver simulator study:
How does driving mode—being driven by a human or automation—affect passenger’s trust ratings, physiological activation, and qualitative driving characteristics?
How does driving style—defensive or sporty—affect passenger’s trust ratings, physiological activation, and qualitative driving characteristics?
How are the preferred driving mode and the personal (self-reported) driving style associated with passenger’s trust ratings?
Method
Design
A driving simulator experiment was conducted to gain further insights into the passengers’ perspective based on the field study. The 2 × 2 within-factor design comprised the factors driving mode (driven by human vs. automation) and driving style (defensive vs. sporty driving style) on a German highway scenario. Driving style was operationalized by either 150 m (defensive) or 80 m (sporty) safety distance to the leading vehicle when initiating the overtaking maneuver. Theses values were determined by calculating the braking distance under consideration of the velocity and the manageable braking intensity. Thus, while driving at maximum 130 km/h, the distance would have enabled a normal deceleration in defensive mode, but maximum deceleration would have been necessary in sporty mode in case of an emergency brake of the leading vehicle (assuming that this vehicle would be a static object).
Materials and apparatus
A high-fidelity fixed-base driving simulator in a room with controlled constant temperature at the Human Factors Department at Ulm University was used in the experiment. As the mock-up consisted of a driver’s and a passenger’s seat, the participants were placed in the passenger’s seat to provide a “taxi cab setting” similar to the field experiment (see Figure 3). The simulated automation, developed at the Human Factors Department using SILAB 5.1 (WIVW GmbH) software, displayed a fully automated ride (SAE Level 5 according to SAE International, 2016) on a highway including automated overtaking maneuvers. Two investigators were on site. One person led the investigation and operated the driving simulation, the other was introduced as driver in the manual mode and inactive passenger in the autonomous mode. Each passenger experienced four drives, two defensive and two sporty driven either by human or automation in a balanced sequence.
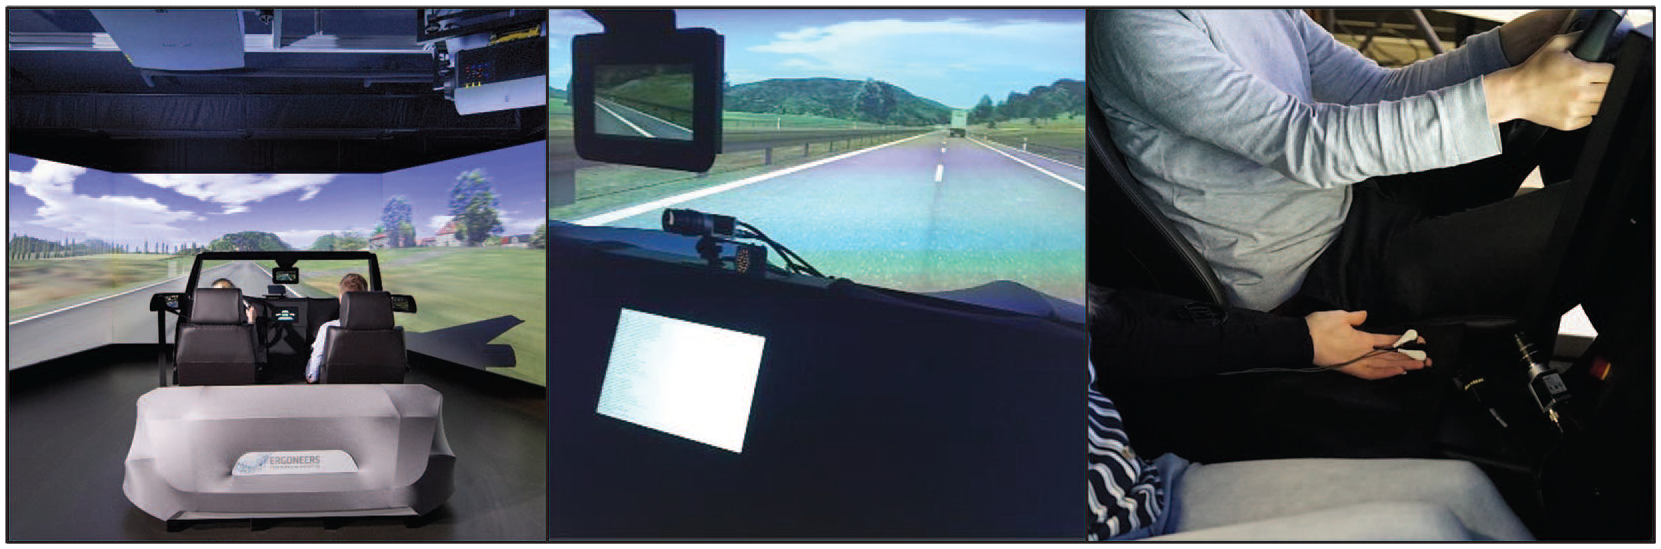
From left to right: high-fidelity driving simulator, view from a passenger’s perspective, setup with skin conductance sensors for psychophysiological measurement in the simulator.
The same measures and apparatuses of skin conductance and subjective trust were employed as described in the field experiment. In addition, acceptance of the autonomous car was measured on six semantic differential items adopted from Van Der Laan, Heino, and De Waard (1997) using a 7-point Likert-type scale. Before being driven the first time, participants had to state five adjectives characterizing a driver showing ideal driving behavior from a passenger’s perspective. After each driving condition, participants were asked again to characterize the preceding drive using five adjectives. By applying this qualitative measure, insights about the positive and negative values of the attitude toward the driver and automation can be gathered and comparisons to an ideal driver can be drawn. In addition, participants provided insights in their manual driving behavior: first, they had to report their personal manual driving style on highways on a 5-point Likert-type-scale ranging from defensive to sporty. Second, they declared whether they are predominantly driver or co-driver by stating percentages. At the end participants should explain their future preferences for being driven by human or automation.
Procedure
After welcoming, participants received information about the aims of the experiment and signed an informed consent. To familiarize with the driving simulator, each participant underwent a brief manual test drive on a highway scenario. Afterwards, each participant acted as a passenger in a total of four highway rides on a geographically identical route. This route was a 8.6-km-long stretch leading through rural and wooded landscape with straights, curves, and gentle ascents and descents. Traffic was the same regardless of driving style, but the driving duration varied slightly due to this factor (sporty driving style = 249s, defensive driving style = 261s). Each ride was announced as either driven by human or automation. However, the car was always controlled by the automation. Therefore, the experimenter either pretended to operate the car himself by keeping his hands on the wheel or just sat in the driver’s seat (hands off the wheel) while the car was driving by itself. As the drives were preprogrammed and the experimenter knew the drive, the driver was able to foresee changes in the car’s behavior and could thus act realistically. Consequently, the observable actions in manual and autonomous mode were the same in the field and simulator study. In the alleged human driving condition, the investigator in the driver’s seat was instructed via loudspeaker to keep a target speed of 130 km/h, stay in the right lane, and only overtake when necessary. Six overtaking maneuvers were implemented in each drive in total. The last two maneuvers differed slightly in a random pattern to keep up the illusion that human and automation course were not identical. The sequence of conditions was balanced across participants.
After being driven by human and automation, participants could state their preferences of driving mode and were asked to state any kind of aspects they noticed related to the study. Six passengers reported similarities between the human and autonomous ride at some point at the end of the study (earliest in the third ride). As the descriptive relations among the conditions did not vary from the rest of the data set, the whole sample was included for analyses.
Participants
In total, 24 students (MAge = 23.5 years, SDAge = 2.9 years, 16 females) from Ulm University with a valid driver’s license and normal or corrected-to-normal vision participated in the driving simulator experiment. We asked for their general experience and preference of being driver or passenger. Thirteen participants stated to be predominantly drivers, three described themselves as drivers and co-drivers in equal parts, and the rest were predominantly co-drivers. Participants were rewarded with course credits or a monetary allowance.
Results
Skin conductance
Skin conductance could be analyzed for 22 participants, two data sets had to be excluded due to technical errors. Overall skin conductance showed a clear negative trend over the experiment: while skin conductance increased in the first 20 s, it decreased afterwards in all conditions (see Figure 4). However, this initial increase and the subsequent decline were of differential magnitude between human driving mode in the defensive driving style condition and all other conditions. A 2 × 2 within analysis of variance (ANOVA) showed a significant effect for the averaged skin conductance due to the factor driving style, that is, a larger averaged skin conductance in the sporty compared to the defensive driving style condition, F(1,21) = 4.89, p < .05,
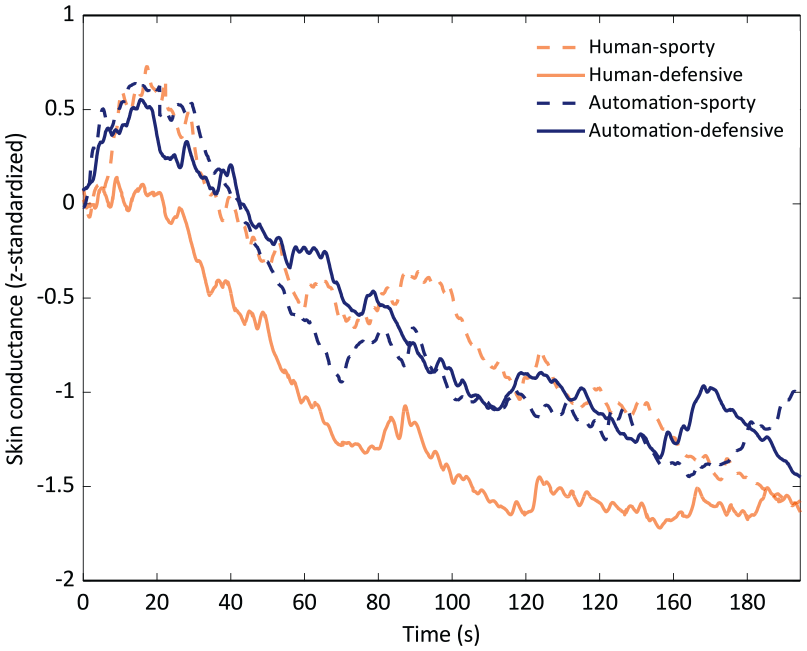
z-standardized skin conductance, baseline corrected with the first 2 s of the drive, split along the factors driving mode and driving style.
Trust and acceptance
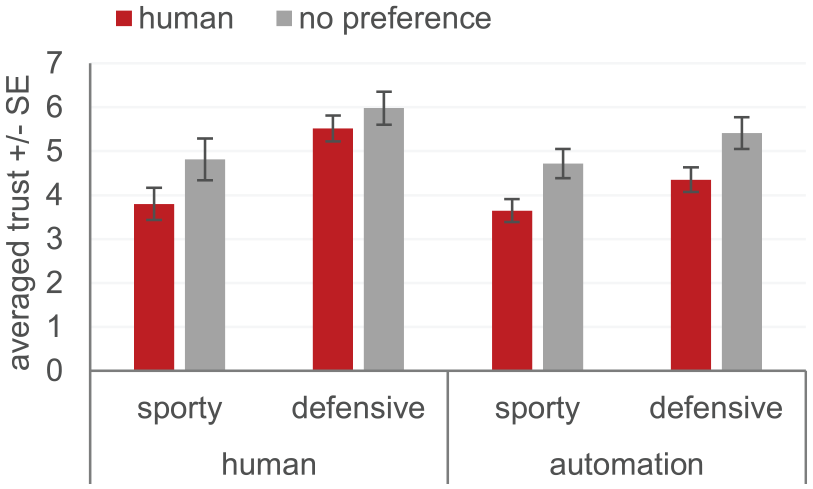
In accordance with prior results, the lowest physiological activation was associated with the highest trust ratings. Subjective trust measures indicated the highest ratings for human-defensive driving (M = 5.69, SD = 1.13), which differed significantly from other ratings (Bonferroni-corrected pair-wise comparisons p < .001). Other than for skin conductance, higher trust ratings were observed in the automation-defensive (M = 4.75, SD = 1.18) compared to human-sporty (M = 4.18, SD = 1.48) or automation-sporty (M = 4.05, SD = 1.11) mode. For inferential analyses, an ANOVA with repeated measures was fitted, which supported descriptive results. Being driven by human compared to automation affected trust significantly, F(1,23) = 6.51, p < .05,
We extended the model by adding the posteriori preferred driving mode (see Figure 5). Fifteen participants preferred to be driven manually, no passenger chose the automation, and nine participants had no preference for human or automation. Passengers who had no preference indicated higher trust (M = 5.23, SD = 1.17) in general compared to those who preferred a human driver, M = 4.33, SD = 1.15; F(1,22) = 7.28, p < .05,
Influence of passenger’s preference for further rides to be controlled either by human, automation, or no preference regarding driving mode and style mode to trust.
We also asked for an estimation of the personal manual driving style. Thirteen participants classified their driving behavior as rather defensive, six as rather sporty, and five participants were neutral, showing situation-specific defensive and sporty driving behavior. These groups did not differ significantly in trust ratings overall, but a significant interaction between trust and personal manual driving style was observed, F(2,21) = 4.61, p < .05,
Furthermore, we tested whether gained experience as mostly being driver or co-driver affected trust ratings. We extended the 2 × 2 ANOVA by this between-subjects factor. Results indicated neither a main effect of driver or co-driver experience nor interactions with driving mode and style on trust.
Acceptance was only gathered in autonomous conditions. In line with trust results, passengers indicated higher acceptance in the defensive (M = 5.10, SD = 1.08) compared to the sporty driving style, M = 4.49, SD = 1.08; t(23) = 2.80, p < .01.
Driving characteristics
Each passenger stated five characteristics describing the driving behavior of an ideal driver. Furthermore, after each of the four experienced driving conditions, passengers declared five characteristics describing the preceding drive. There were no specifications about how to state these characteristics. Example (translated) predicates were “no observance of the safety distance,” “comfortable,” and “prudent ride.” These data were qualitatively analyzed by inductively generating categories as a basis for frequency analysis (see Mayring, 2014 for further information). First, two raters developed categories based on the characteristics of an ideal driver individually, merged them, and agreed on the following eight characteristics, given in Figure 6. According to the participants, an ideal driver should behave first and foremost anticipatory (39%), but also precautious (20%), safe (15%), and smooth/ relaxed (13%; see Figure 6). Consequently, for co-drivers, traffic safety seems to be most relevant. Also, comfort (smooth and relaxed) is considered, but almost no emotional relation or estimation (pleasant) was observable.
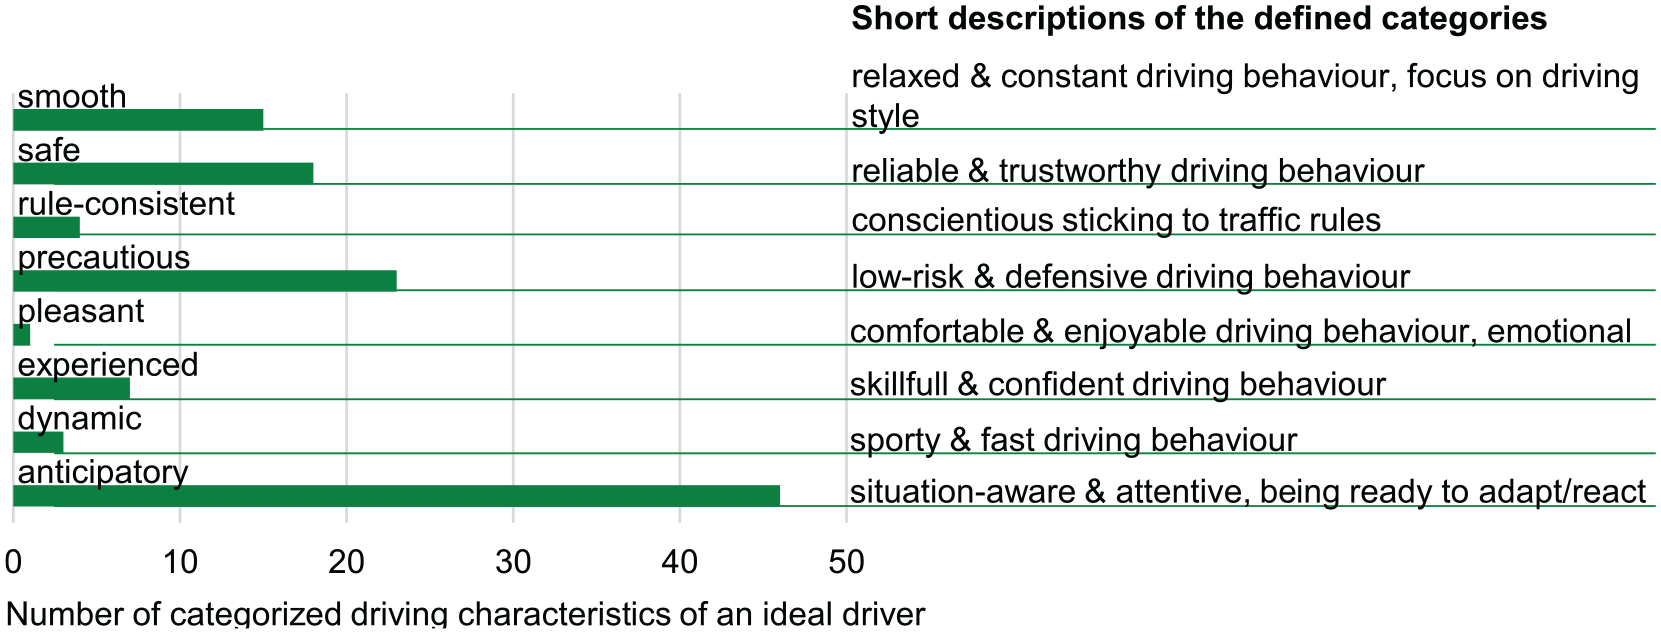
Number of characteristics among the eight categories of an ideal driver and descriptions of these categories.
Second, these characteristics were used to classify the 480 predicates of the passengers regarding the experienced rides under consideration of the valence of each characteristic (positive or negative appraisal) independently by two raters. Interrater reliability using Cohen’s Kappa was calculated, revealing a substantial (close to perfect) conformance with .77 based on Landis and Koch (1977). A third rater edited the inconsistencies in cooperation with the other two raters. The frequency and valence of the characteristics are visualized in Figure 7. In general, the most positive (n = 90) and the least negative (n = 19) attributions were stated in the human-defensive driving condition. The number of positive characteristics decreased for human-sporty (n = 55), automation-defensive (n = 73), and automation-sporty (n = 63) and increased for negative attributions (human-sporty n = 59, automation-defensive n = 41, and automation-sporty n = 52). Consequently, these qualitative data fit subjective trust data and physiological reactions showing a larger decrease of trust between driving styles when another human controls the car.
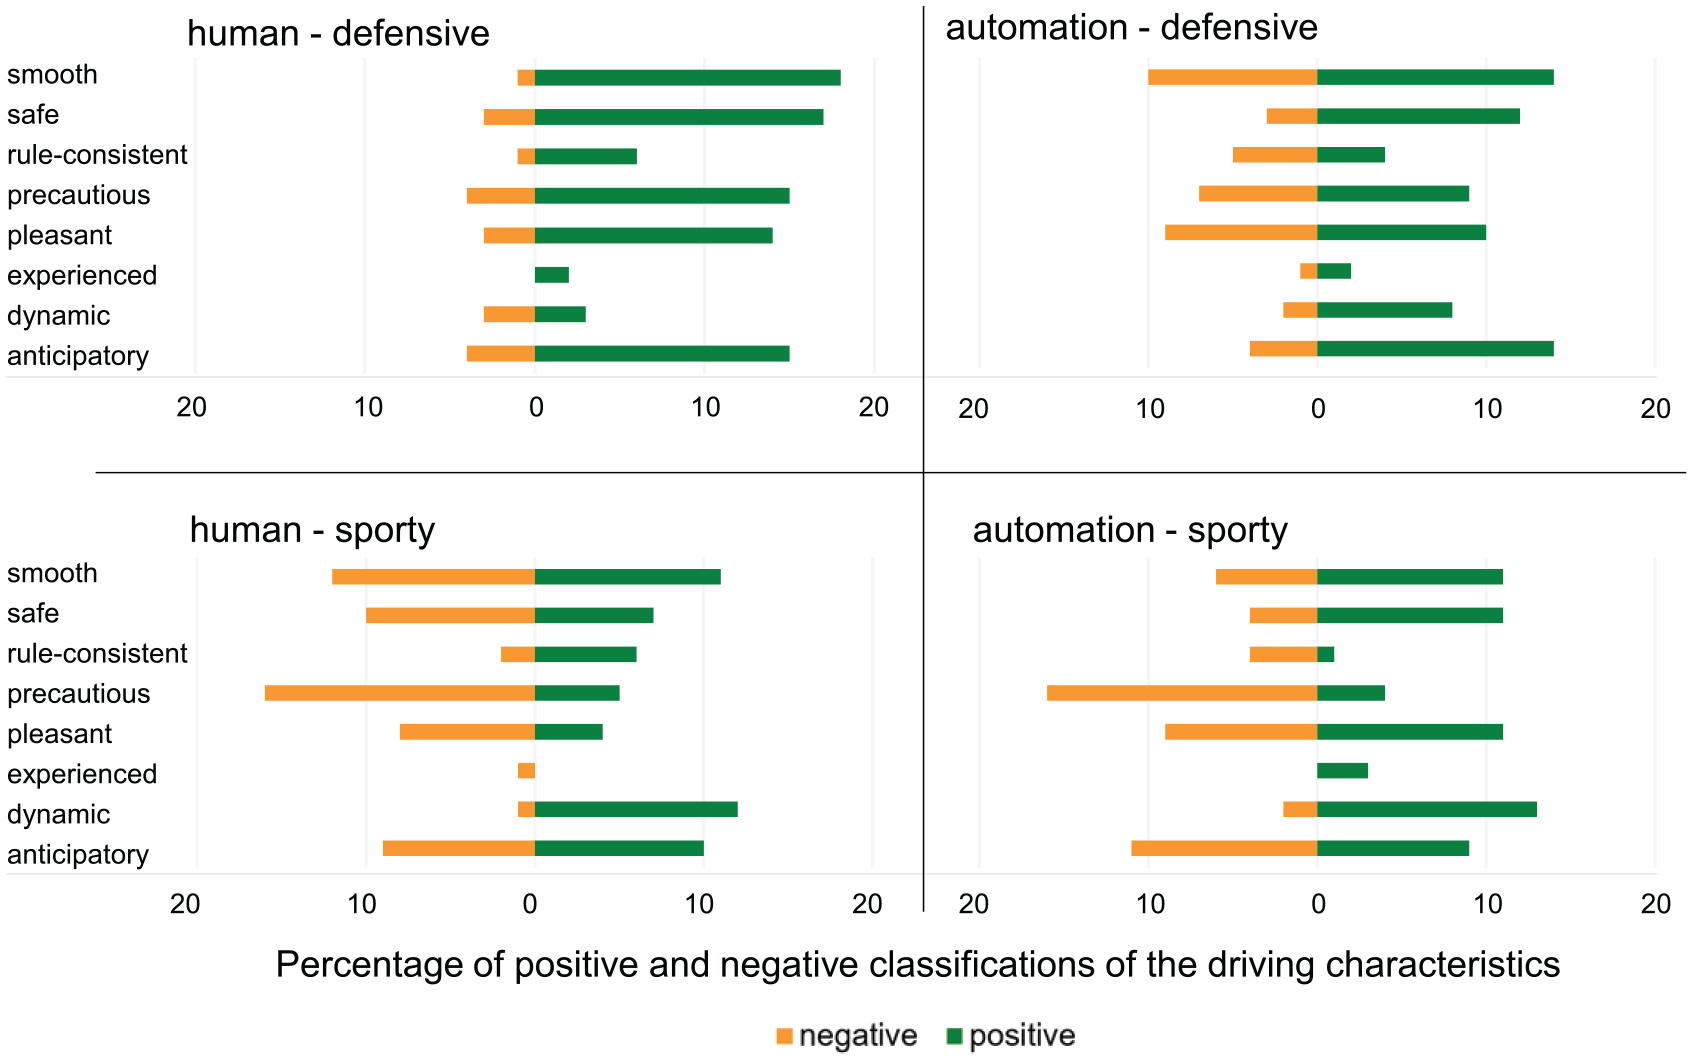
Percentage of positive and negative classifications of the driving characteristics for defensive versus sporty in human or automation driving mode.
Overall Discussion
The combination of objective (skin conductance), subjective, and qualitative measures provided indications of passengers’ appraisals and preferences in the field and simulator. Although the field study was of exploratory nature with just a small amount of participants and less standardized conditions, ideas for more detailed investigations in a reliable simulator experiment were gathered. Even if the comparability of both studies was limited, findings showed the tendency to be more relaxed and trusting while being driven by human compared to being driven by the automation, but this was strongly depending on driving style (in the simulator).
The driving simulator study showed the impact of presumed driving mode (human driver vs. automation) and driving style (defensive vs. sporty) on physiological activation, subjective trust ratings, acceptance, and attribution of driving characteristics. We found evidence that passengers trust human drivers more than autonomous vehicles, especially when the driver behaved defensively and kept enough safety distance to leading vehicles. The same pattern was observed for qualitative analyses of driving characteristics, having most positive appraisals for human-defensive mode. The study showed that the same driving behavior triggered different physiological reactions when alleged to be driven by human or automation in defensive mode. Consequently, passengers experienced these conditions differently and were also able to verbalize these differences. Indeed, we observed a lower skin conductance for the human-defensive condition compared to all other driving conditions, indicating low arousal or stress for this condition, which might signal a comfortable and relaxed ride (Morris et al., 2017). While skin conductance was not significantly different for human compared to automation driving mode, the driving style was found to have an impact. As observed in prior studies (e.g., Basu et al., 2017; Morris et al., 2017; Yusof et al., 2016), defensive driving style led to decreased skin conductance and higher trust and acceptance ratings in comparison to sporty driving behavior. The small distance to leading vehicles might have been perceived as less safe. Due to the consensus with prior results, we expect the slightly longer duration of the defensive driving style (12 s or 4.8%) due to the constant route for both driving styles, not as confounding variable.
In addition to these external factors, internal appraisals influenced trust as well. People who preferred to be chauffeured by humans indicated less trust in general than those who did not care. Participants describing themselves as rather defensive or neutral drivers trusted more in a human driver compared to an autonomous system, but sporty drivers did not prefer the human driver. Consequently, participants differed in their propensity to trust based on individual characteristics, expectations, and preferences. These findings might be considered when designing acceptable and trustworthy automated vehicles by aligning the automation’s behavior to preferences and expectations of passengers.
Analyses of skin conductance and trust showed some correspondence in the field and simulator; however, correlations between skin conductance and trust ratings were nonsignificant except for the human-defensive condition in the simulator experiment. Still, the overall direction of descriptive correlations between trust and skin conductance might be interpreted in support of a link between activation and trust, potentially mediated by stress. This association should be investigated more closely, ideally by disentangling the effects of trust from other potential factors on skin conductance (such as stress, workload, and emotional activation). By contrast with monitoring frequency, which is also described as an objective measure (Hergeth, Lorenz, Vilimek, & Krems, 2016), skin conductance allows for measurement without non-driving-related task and might be a useful supplement in trust and passenger research.
Eight relevant characteristics describing driving behavior were generated. Some of these might explain differences in trust and can be seen as a starting point for optimizing trust adjustment in the design of an ideal automation behavior from the passengers’ perspective. For instance, the characteristic “dynamic” was announced positively more often and the characteristic “smooth” negatively more often for human-sporty, automation-sporty, and automation-defensive compared to human-defensive mode. Based on these qualitative analyses, we can conclude that a subjectively perceived relaxed, constant, and not sporty driving behavior might increase trust in the means of transportation. Furthermore, personal preferences and characteristics could provide information about the individually optimal driving style of autonomous vehicles, a feature that could be customizable in upcoming autonomous cars. These assessments could then be used to adjust driving style within the legal boundaries to increase and achieve the optimal level of trust and acceptance by an individually tailored driving style.
A next step will be to further investigate the underlying factors to the effects of being driven by human or automation. It might be that people are more familiar with human drivers and therefore prefer them, compared to the observed human pilot preference (Hughes et al., 2009). However, the presented studies do not allow for such conclusions. As autonomous agents are in some cases also preferred over humans (like decision aid systems in high risk situations; Lyons & Stokes, 2012), it could be beneficial to face general human factors findings as a basis for deeper understanding of human preferences and expectations regarding automation. Furthermore, gaining insights from more experienced participants, who are used to driving assistance or partial automation, aiming to provide another passenger’s perspective, could be relevant for autonomous vehicle adoption.
Conclusion
Taking the passenger’s perspective in the field and simulator for gaining insights into appraisals and preferences of autonomous car usage was shown to be a valuable and promising approach. By extending gained knowledge from an exploratory real-world setting in a simulator experiment, we got insights in the impact of driving style in combination with the assumption of control responsibility—either by human or by automation. In both investigations, in field and simulator, we observed more trust and by trend decreased physiological activity for the human compared to the autonomous chauffeur. While not fundamentally huge, a gap between both driving modes could be observed in subjective and objective data, indicating that autonomous systems will be met with caution by passengers. As the age of autonomous driving approaches, research into possibilities increasing the passengers’ trust and preferences described in this study will be crucial to ease the roll out of fully autonomous individual mobility and hereby fulfill the promises, from increased traffic safety to higher environmental and social sustainability (Fagnant & Kockelman, 2015; Krueger et al., 2016; Nicolaides et al., 2017).
Key Points
Driving style (defensive vs. sporty), as well as driving mode (human driver vs. automation), affect passengers’ trust, psychophysiological activation, and qualitative ratings.
Highest trust ratings and lowest physiological activation are observable when passengers were driven by a (pretended) human driver in a defensive driving style.
Individual expectations and preferences affect the propensity to trust.
The qualitative analysis of driving characteristics might serve as a starting point for trust-optimized driving styles in automated driving.
Footnotes
Acknowledgements
Kristin Mühl and Christoph Strauch contributed equally to this paper. This research originated in F3, the center for driver-vehicle research at Ulm University with support by the Zeiss Foundation. Christoph Strauch was supported by a stipend by the Friedrich-Ebert-Stiftung. Furthermore, we would like to thank the Institute of Measurement, Control and Microtechnology at Ulm University for providing and operating the autonomous research vehicle in general and Klaus Dietmayer, Martin Bach, and Manuel Stübler in particular for their kind support. Furthermore, we would like to thank Katarzyna Patro-Nürk and Margaretha Bollenbach for their assistance.
Kristin Mühl is affiliated with Ulm University’s Human Factors group. She obtained her Master of Science degree in Human Factors from TU Berlin in 2014.
Christoph Strauch is affiliated with Ulm University’s General Psychology group. He obtained his Master of Science degree in Psychology from Ulm University in 2016.
Christoph Grabmaier is a student assistant at the General Psychology group at Ulm University and pursues a Master of Science degree in Psychology.
Susanne Reithinger is a student assistant at the General Psychology group at Ulm University and pursues a Master of Science degree in Psychology.
Anke Huckauf is affiliated with Ulm University. She obtained her doctorate degree in psychology from the RWTH Aachen in 1996. She is a full professor of General Psychology at Ulm University.
Martin Baumann is affiliated with Ulm University. He obtained his doctorate degree in Psychology from the TU Chemnitz in 2001. He is a full professor of Human Factors at Ulm University.