
Abstract
Objective
We collected naturalistic heart rate data from veterans diagnosed with post-traumatic stress disorder (PTSD) to investigate the effects of various factors on heart rate.
Background
PTSD is prevalent among combat veterans in the United States. While a positive correlation between PTSD and heart rate has been documented, specific heart rate profiles during the onset of PTSD symptoms remain unknown.
Method
Veterans were recruited during five cycling events in 2017 and 2018 to record resting and activity-related heart rate data using a wrist-worn device. The device also logged self-reported PTSD hyperarousal events. Regression analyses were performed on demographic and behavioral covariates including gender, exercise, antidepressants, smoking habits, sleep habits, average heart rate during reported hyperarousal events, age, glucocorticoids consumption, and alcohol consumption. Heart rate patterns during self-reported PTSD hyperarousal events were analyzed using Auto Regressive Integrated Moving Average (ARIMA). Heart rate data were also compared to an open-access non-PTSD representative case.
Results
Of 99 veterans with PTSD, 91 participants reported at least one hyperarousal event, with a total of 1023 events; demographic information was complete for 38 participants who formed the subset for regression analyses. The results show that factors including smoking, sleeping, gender, and medication significantly affect resting heart rate. Moreover, unique heart rate patterns associated with PTSD symptoms in terms of stationarity, autocorrelation, and fluctuation characteristics were identified.
Conclusion
Our findings show distinguishable heart rate patterns and characteristics during PTSD hyperarousal events.
Application
These findings show promise for future work to detect the onset of PTSD symptoms.
Introduction
Post-traumatic stress disorder (PTSD) is a psychiatric disorder affecting approximately 11% of the U.S. population and 24.5% of combat veterans (Spottswood et al., 2017). PTSD is characterized by at least 1 month of re-experiencing a traumatic event followed by avoidance symptoms and hyperarousal events (American Psychiatric Association, 2013). Avoidance symptoms include decreased interest in daily life and an overall feeling of detachment from one’s surroundings. Hyperarousal symptoms include hypervigilance, feelings of irritability, and an exaggerated startle response following a traumatic event. Other symptoms include anxiety, insomnia, fatigue, anger, and aggression (Gravely et al., 2011). The secondary and tertiary comorbidities of PTSD are depression, substance abuse, smoking, heart disease, obesity, diabetes, chronic fatigue, and increased dementia (Geiling et al., 2012).
PTSD is typically diagnosed and monitored using subjective self-report tools, such as the Davidson Trauma Scale (DTS; Davidson, 1996), PTSD-Checklist 5 (PCL-5; Weathers et al., 2013), or questionnaire-based interviews, such as the Clinician-Administered PTSD Scale (CAPS; Weathers et al., 2013). However, objective means for assessment of PTSD symptoms are largely absent. Given the known limitations of subjective and self-reported measures, there is a timely need to investigate objective methods for monitoring PTSD symptoms. The rapid growth of physiological monitoring methods and mobile health (mHealth) applications provide an opportunity for the application of human factors and ergonomics to the design of user-centered PTSD monitoring technologies. However, the foundational knowledge of psychophysiological characteristics of PTSD reactions required for continuous monitoring and detection of PTSD symptoms is limited (Rodriguez-Paras et al., 2017).
PTSD is correlated with several physiological measures including heart rate variability, blood pressure, respiratory rate, skin conductance, and, of particular interest in this study, heart rate (Pitman et al., 1987; Zoladz & Diamond, 2013). It is known that individuals who develop PTSD after a traumatic incident, such as a motor vehicle crash, have higher resting heart rate than those without PTSD (Buckley et al., 2004). Shalev et al. (1998) found that compared with healthy adults, individuals with PTSD had elevated heart rate immediately after a traumatic incident and 1 week after, though the effects dissipated after 1 month. More recent studies have found that elevated heart rate post-trauma and heart rate at the time of hospital admission are predictors of PTSD even 4 months after the incident (Morris et al., 2016). Among veterans, those with PTSD have consistently higher heart rate than veterans with comparable combat experience who do not suffer from PTSD (Blanchard, 1990). The findings on heart rate have been replicated in laboratory studies. Blanchard et al. (1986) induced hyperarousal among combat veterans using triggers such as combat noises, and measured physiological reactions including heart rate reactivity to such stimuli. Rizzo et al. (2017) used virtual reality to simulate combat scenarios to assess the relationship between PTSD symptoms and physiological variables. Both studies found strong positive correlation between heart rate and hyperarousal among veterans diagnosed with PTSD. However, these studies were mostly correlational and did not describe or model the heart rate patterns associated with PTSD.
A major limitation of the aforementioned work is the gap in naturalistic investigation of physiological reactions to PTSD symptoms. Given the sporadic nature of hyperarousal incidents and ethical issues related to inducing trauma in the lab setting, investigating PTSD in patients’ natural work-life environment seems necessary. However, there are only a few documented naturalistic attempts (Buckley et al., 2004; Green et al., 2016; McDonald et al., 2019). Buckley et al. (2004) used heart rate monitors placed on occlusion cuffs worn by participants on their nondominant hand at the level of the heart. Heart rate was measured every 20 min during waking hours and every 120 min during sleeping hours. Their findings suggest that participants diagnosed with PTSD have a higher resting heart rate than those without PTSD. Green et al. (2016) used ECG sensors to measure heart rate changes in participants over a 24-hr period. They found elevated heart rate for PTSD patients at higher distress levels compared with baseline. McDonald et al. (2019) used a smartwatch-based application to record heart rate and activity as well as self-reported PTSD hyperarousal events. The data were used to develop a machine learning algorithm for detection of the onset of PTSD symptoms. Post-hoc analysis of that algorithm showed that the algorithm associated increases in heart rate with PTSD symptom onset.
Despite the considerable evidence suggesting a positive correlation between heart rate and PTSD hyperarousal events, objective clinical assessment of PTSD and detection of its onset require a deeper understanding of the nature of the change in heart rate. While the relationship between heart rate rhythms (patterns) and various cardiovascular diseases have been studied (Lechat et al., 2001), to our knowledge such a relationship is an important research gap for PTSD. Addressing this gap will advance the knowledge of psychophysiological properties of PTSD. The aim of the current research is to address the gap in knowledge about descriptive and mathematical modeling of heart rate patterns during PTSD hyperarousal events. In this paper, we document our findings from a naturalistic study that investigated heart rate profiles associated with PTSD hyperarousal events, as well as the relationship between heart rate and demographic and behavioral factors among a large sample of veterans with PTSD. We first present our evaluation of the general characteristics of heart rate among participating veterans diagnosed with PTSD. We then discuss the relationship between factors such as age and gender; lifestyle factors such as sleeping habits, exercise routines, alcohol consumption; and medications such as antidepressants with resting heart rate. Finally, we document our descriptive and statistical evaluation of heart rate time-dependent data during PTSD hyperarousal events. A sample of heart rate data of healthy subjects as a representative composite is used to illustrate differences. The results presented in this paper provide critical insight into heart rate covariates and patterns in individuals with PTSD which can be used to improve and personalize the design of mHealth applications, and improve the treatment of PTSD.
Method
Naturalistic data collection was conducted during Project Hero’s United Healthcare Ride 2 Recovery (R2R) events to evaluate the heart rate patterns associated with PTSD. Project Hero is a nonprofit organization committed to helping veterans and first responders diagnosed with PTSD by coordinating recreational events such as group biking as part of a social therapy effort. During each event, veterans rode bicycles in groups between key destinations for an average duration of 3–7 days. The activity involved an average of 8 hr biking each day with the remaining time for resting, relaxing, and social events. The research team joined a total of five events in 2017 and 2018—in California, Washington DC, Minneapolis, Texas, and Nevada—and recruited participants from each event. The study was approved by the Institutional Review Board (IRB) at Texas A&M University (IRB2017-0210D).
Participants
A voluntary response sample of 99 Project Hero R2R riders (from a population of about 500 eligible participants) was recruited to participate in the study across the five events. All 99 participants consented to complete the study. Cardiac data were collected from all 99 participants and were used for analysis of heart rate patterns. However, due to the voluntary nature of participation, strict anonymity protocols, and the sensitivities involved in studying mental health, completion of demographics information was unsupervised and opportunities to follow up with participants were limited. Consequently, associations between demographics data and cardiac data were only possible for 38 out of 99 participants. Thus, regression analyses accounting for demographics included only those 38 participants. To investigate the representativeness of this subset, their cardiac data (mean and standard deviation of count of reported hyperarousal events; M = 9.78, SD = 10.67) were compared to participants with incomplete demographic data (n = 61; M = 10.48, SD = 11.12), and the results showed no significant differences; t(4) = 0.15, p = .9. The mean age of all participants (n = 99) was 45.5 years (SD = 10, range = 22–75). The mean age of participants with complete demographic data (n = 38) was 46 years old (SD = 11, range = 27–74). Out of 99 participants, 82 were male and 17 were female. In terms of race and ethnicity, 44 people were White, 15 were Black/African American, 26 people were Hispanic/Latino, four were American Indian or Alaska Native, one was Native Hawaiian, one was Asian, and eight reported their ethnicity as Other. Out of the 38 participants used for the regression analysis, 25 were male and 13 were female, 18 were White, nine were Black/African, eight were Hispanic/Latino, and three reported their ethnicity as Other. In addition, participants were asked about current usage of antidepressants (Yes/No) and anxiolytics (drugs used to treat anxiety-based disorder symptoms; Yes/No), smoking habits (Currently Smoking/Non-smoker), current alcohol consumption (Yes/No), and sleep quality (0–6 hr per night/More than 6 hr per night), exercise (Yes/No), alcohol consumption, and glucocorticoids usage (Yes/No).
Procedure
Project Hero provided their events’ attendees with information about the study and invited them to participate during the event registration. Participants who agreed to participate were asked to complete informed consent and were then provided with an Apple Watch Series 2, 3, and 4 (for studies in Texas and California) or an Android smartwatch (MOTO 360 Gen 1 and Gen 2 [Motorola Inc], for the remainder of locations) equipped with a data collection application. The participants were then trained to operate the smartwatch application. Participants were instructed to wear the watch at all times unless they were swimming, bathing, or charging the watch.
The data collection app was developed by the research team and served several purposes including providing a summary of heart rate activity (beats per minute [bpm]) of the user as well as mindfulness features. It also included a function that allowed the user to report PTSD hyperarousal events by tapping their finger anywhere on the watch face twice in quick succession (i.e., a double tap), which created a time-stamped self-reported event. The smartwatches were equipped with accelerometers and gyroscopic sensors, which allow kinematic data, including linear and angular acceleration, to be captured. The app ran continuously in the background and used the smartwatch’s sensors to measure heart rate and accelerometer data. Participants could interact with the application throughout the course of the event. Four sets of data were collected using smartwatches in all five events: (1) real-time heart rate data (1 Hz), (2) reported hyperarousal events based on double taps recorded by the watch, (3) real-time angular accelerator data (1 Hz), and (4) real-time linear accelerator data (1 Hz). Overall, about 25% of heart rate data is considered missing. While many reasons contributed to non-sampling, including issues with the devices, defective sensors, and improper fit, the exit interviews revealed that the majority of the missing data was due to the time required to charge the devices. As shown in Figure 1, most participants confirmed that they charged their devices at night before going to bed.
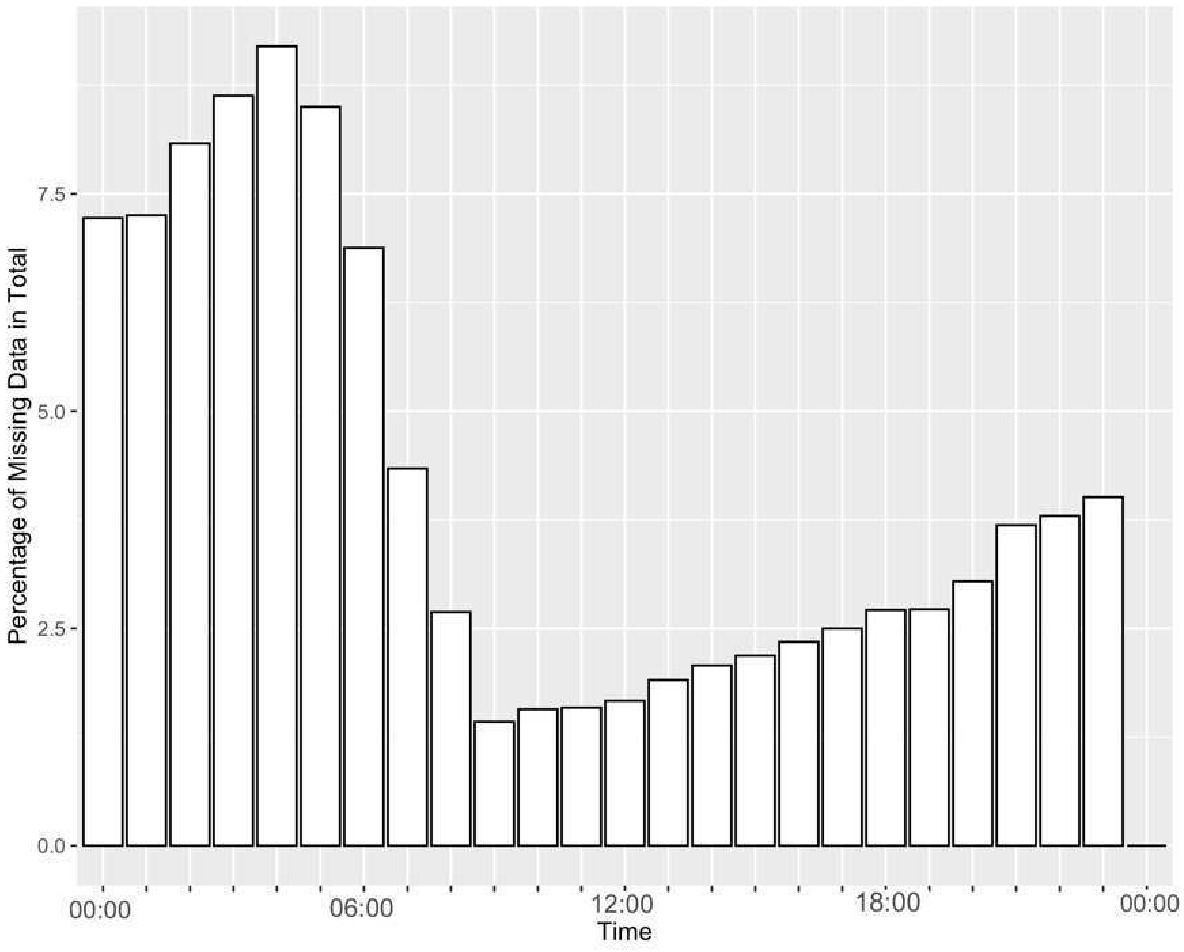
Percentage of missing cardiac data (on average) by hour of the day.
Analysis
Activity classification
Since the data collection occurred during events that included physical activities, the accelerometer data were used to classify periods involving physical activity (e.g., riding bicycle or exercising) compared with resting by processing the linear acceleration data with the validated algorithm developed by Ravi et al. (2005). This algorithm—which is a combination of Decision Trees, Naïve Bayes, and K nearest neighbors—uses the single triaxial accelerometer data to classify resting states (standing) and activities including running and walking with over 84% accuracy. We used this algorithm to differentiate between periods involving activity and those without to calculate the resting heart rate.
Resting heart rate
For both Apple Watch and Android devices, we developed a method similar to Venkatraman and Yuen (2015) to calculate resting heart rate based on activity levels. In this method, resting heart rate is obtained by taking the average heart rate during the moments that individuals are considered to be least active physically based on Ravi et al.’s (2005) algorithm.
Correlation and regression analysis
Data from the 38 participants who provided a complete dataset including demographic data, heart rate data, acceleration data, and reported stress moments was used to conduct a Pearson correlation analysis (Benesty et al., 2009). A linear regression model was built to investigate if resting heart rate was affected by gender, exercise, antidepressants, smoking habits, sleep habits, average heart rate during reported hyperarousal events, age, glucocorticoids consumption or alcohol consumption. Assumptions of normality, multicollinearity and homoscedasticity were checked according to Weisberg’s (2005) guidelines. In addition, given the potential variability in self-reports due to emotional numbness (Kashdan et al., 2007; Tull & Roemer, 2003), leverage analysis was conducted to identify influential observations (Chatterjee & Hadi, 1986).
Time series analysis of heart rate
To investigate heart rate patterns and statistical characteristics of heart rate data during the self-reported hyperarousal events, windows of heart rate data including 600 s of observations (100 s before the first recorded trigger and 500 s after the recorded trigger) were extracted for all 99 participants and a time series analysis was conducted. The heart data were analyzed using Auto Regressive Integrated Moving Average (ARIMA) models, which are widely used for forecasting time series data (Box et al., 2015) with applications in medical domains due to their utility in enabling descriptive and predictive analyses on non-stationary time series (Gelfand & Vounatsou, 2003). An important advantage of using ARIMA relative to non-temporal analysis methods like ANOVA is that it explicitly models time-dependent measures (Sadeghi et al., 2020). The fitted ARIMA models were used to assess the stationarity, fluctuation, and autocorrelation of the data.
Stationarity—an index of the consistency of the mean and variance of a time series—was assessed with the Dickey–Fuller test (Dickey & Fuller, 1981) to investigate irregularities (non-stationarity) in heart rate rhythms. Previous research indicates that healthy subjects’ heart rate data include long stationary stretches under various conditions including resting and activity (Weber et al., 1992). The Dickey–Fuller test was conducted on each window of heart rate, and the average test is reported in the results section. Autocorrelation—a statistical feature representing the correlation of a time series with itself as a function of delay—was used to investigate the repeating heart rate patterns. The autocorrelation test was conducted on each window of heart rate data, and the average autocorrelation values were plotted for comparison. Detrended fluctuation analysis (DFA)—a statistical method that has been used for analyzing changes in heart rate data (Peng et al., 1995; Sadeghi et al., 2019)—has shown promise to understand irregularities in time series data with stochastic features that show long-term correlation (Kantelhardt et al., 2002). DFA assesses self-affinity of time series data, which indicates data variation and changes within a time window. DFA also evaluates the turbulence (i.e., irregular changes) in the data. DFA was applied to each window of heart rate data and DFA values were calculated and averaged over all windows of PTSD hyperarousal events. To make meaningful comparisons with fixed baselines and describe hyperarousal events, ARIMA was used to illustrate the differences between heart rate during a PTSD hyperarousal event and heart rate data for a sample of healthy individuals with neither mental nor pathological disorder. The data were obtained from the MIT-BIH (Beth Israel Hospital) Arrhythmia database (Moody & Mark, 2001) and PhysioNet (Goldberger et al., 2000; Peng et al., 1999) open-access community resources on clinical and physiological data.
All data analyses were conducted using RStudio 3.5.1 and Python 3.7.4. The ggplot2 package in R was used to develop visualizations (Wickham, 2011). The nonlinear T-series package was used for fluctuation analysis (Garcia & Sawitzki, 2015).
Results
In this section, we first describe the overall characteristics of the heart rate data for the sample of veterans with PTSD followed by our findings related to statistical characteristics of heart rate time series during PTSD hyperarousal events. Finally, we illustrate the differences between the identified heart rate profiles and a representative heart rate profile of a healthy subject.
Characteristics of Heart Rate and Hyperarousal Events
PTSD hyperarousal events and heart rate
Ninety-one of the 99 participants reported at least one hyperarousal event, and a total of 1023 events were reported (M = 10.23 per participant, SD = 11, median = 5; Figure 2 [left]). For events that occurred heart rate ranged from 57 to 191 bpm (M = 93.98, SD = 21.32). However, when participants were riding bikes, their heart rate during self-reported hyperarousal was between 71 and 164.5 bpm (M = 105.75, SD = 21.66), and when they were not riding, their heart rate ranged from 57 to 192 (M = 91.2, SD = 20.61). As shown in the density function of heart rate in Figure 2 (right), most reported heart rates during hyperarousal events peaked between 80 and 90 bpm (median = 89 bpm).
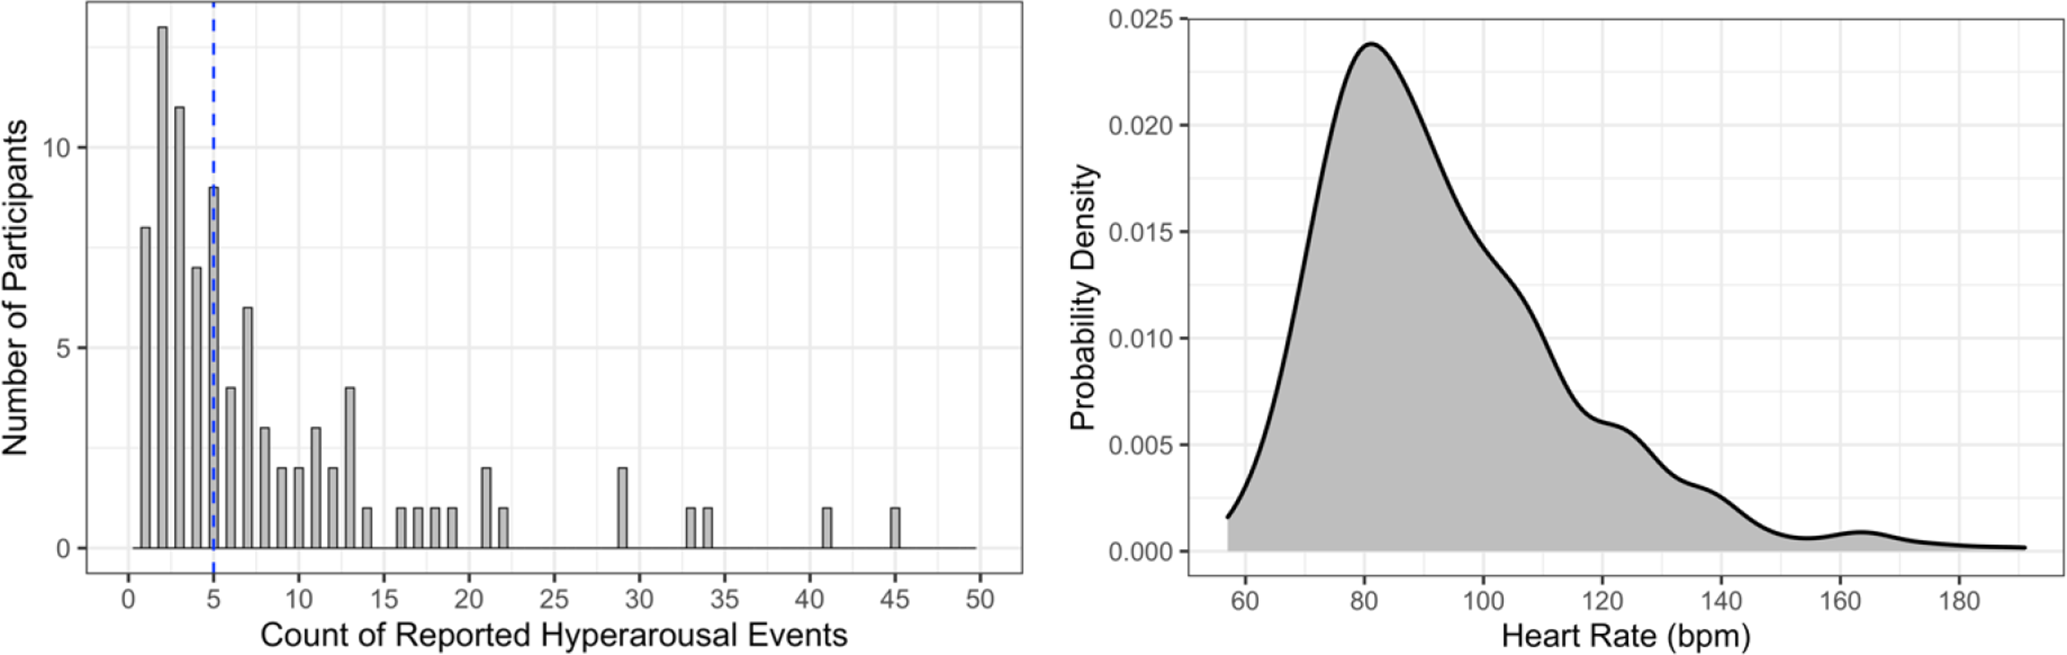
Reported stress moments frequency numbers (left); the dashed vertical line represents the median; estimated distribution function of recorded heart rate during PTSD hyperarousal events (right).
Resting heart rate
Our findings show that resting heart rates for PTSD patients ranged from 61 to 120 bpm (M = 81.99, SD = 10.07) with a median of 80.46 bpm.
Figure 3 (left) shows the frequency of reported hyperarousal events by time of the day. Fewer than 5% of events were reported between midnight and 6 am. However, most participants reported using that period to charge their devices (as illustrated in Figure 1). Figure 3 (right) shows heart rate values at the time of the self-reported event versus time of the day.
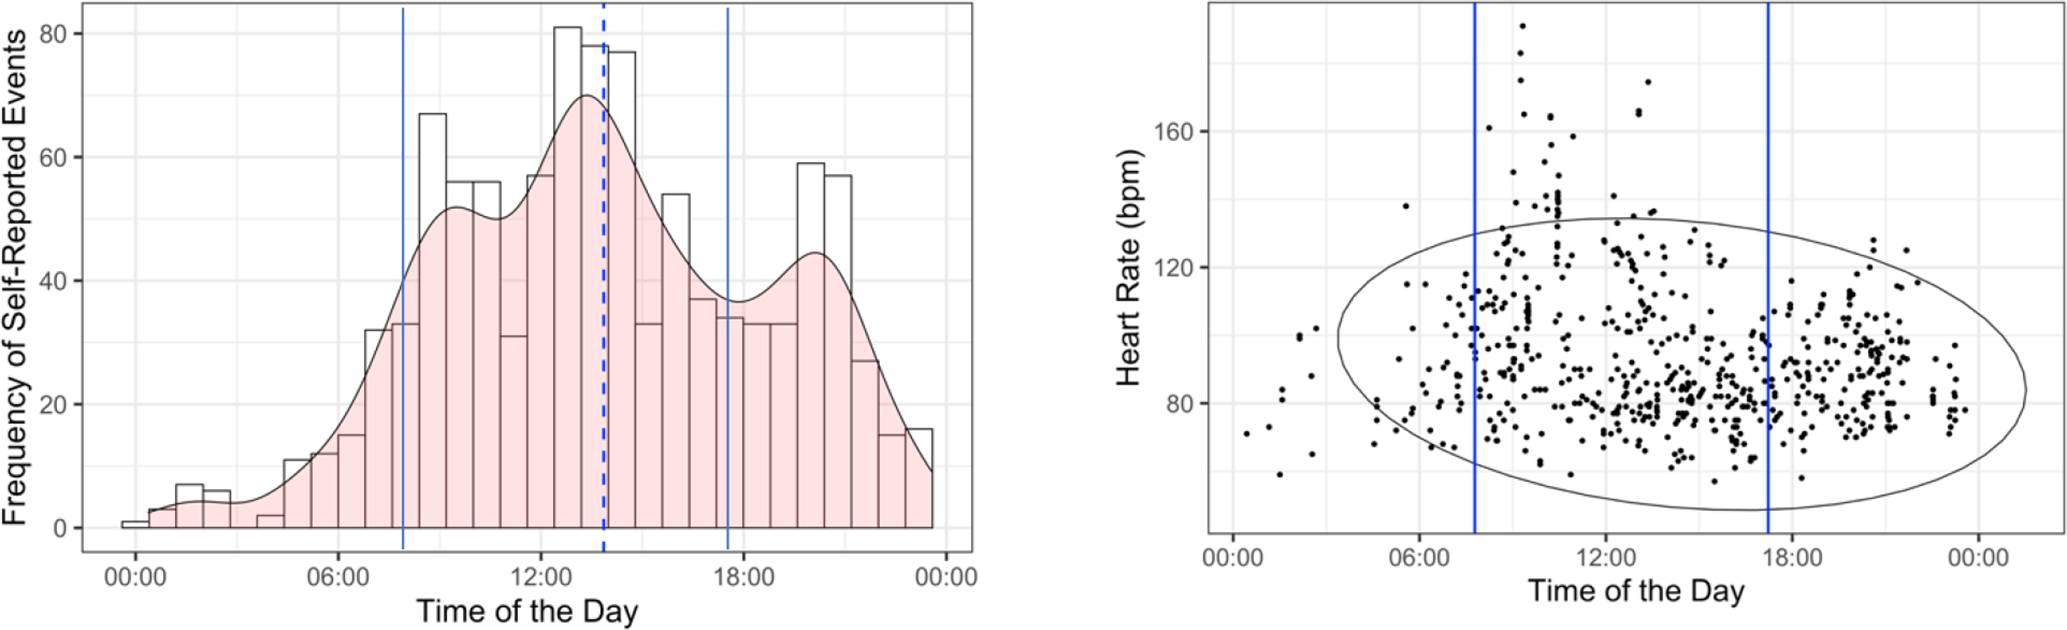
Frequency of stress moments reported by time of the day (left); the dashed vertical line shows the mean value for time of reported events; heart rate scatter plot with confidence ellipse (right); the vertical blue lines show riders’ riding time intervals (9 am–5 pm approximately).
Hyperarousal events and activity
Figure 4 shows the number of reported hyperarousal events by activity classification (based on the Ravi et al., 2005 classification). The figure illustrates that the majority of stress events (87%) occurred when participants were resting.
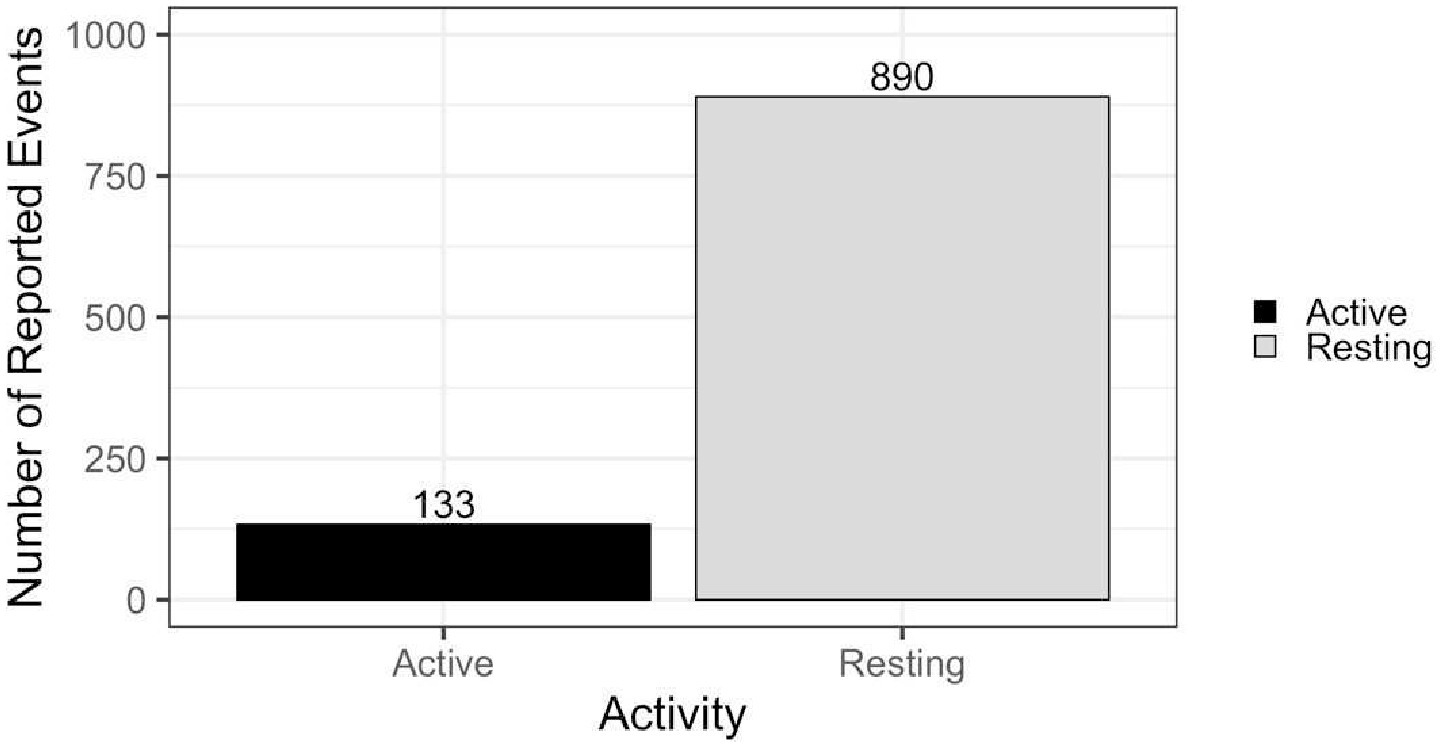
Number of PTSD triggers during active or resting phases (NActive = 133, NResting = 890). PTSD = post-traumatic stress disorder.
Effects of Medications, Sleep, Age, Gender, Smoking, and Alcohol Consumption on Resting Heart Rate
It is well documented that resting heart rate has a strong correlation with cardiovascular risk, and in general elevated resting heart rate is a reliable indicator of clinical events (Arnold et al., 2008). However, the relationships between resting heart rate, demographics, and other lifestyle and health variables such as sleep, medication, smoking, and alcohol consumption in patient populations with PTSD have not been well documented. Understanding these relationships is critical to developing human-centered mHealth applications that are robust to individual differences.
Correlation analysis
Resting heart rate and average heart rate during reported PTSD hyperarousal events were significantly correlated (r (36) = .58, p < .001). Smoking (r (36) = .44, p = .005), antidepressant use (r (36) = .38, p = .019), age (r (36) = −.34, p = .038), and sleep (r (36) = −.37, p = .046) were also significantly correlated with heart rate.
Linear regression
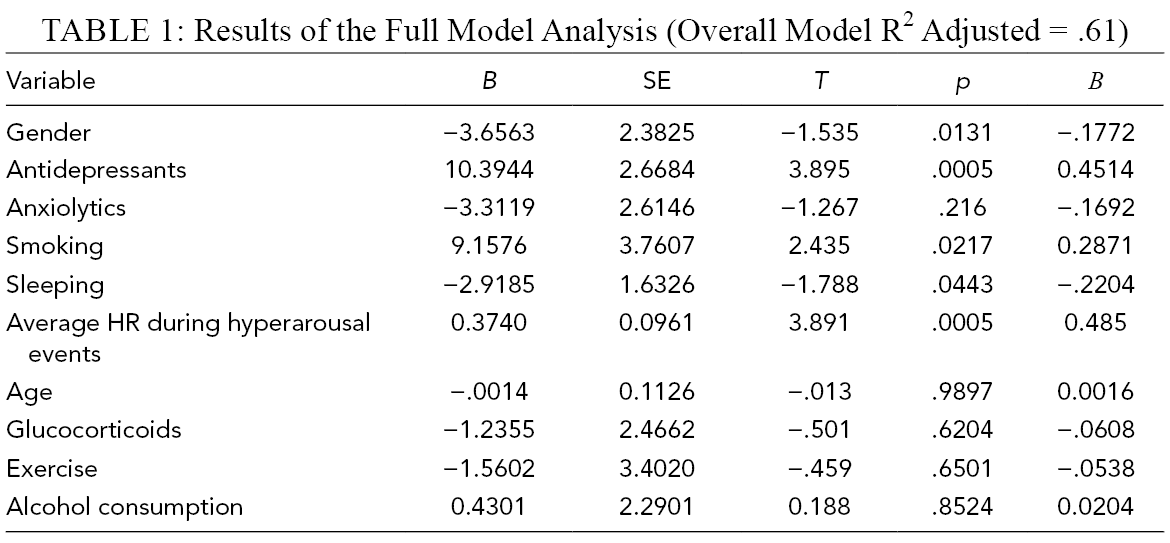
The multiple linear regression was calculated to predict resting heart rate based on gender, antidepressants, anxiolytics, smoking habits, sleeping habits, average heart rate during PTSD hyperarousal events, age, glucocorticoids, exercise, and alcohol consumption (Table 1). A significant regression equation was found (F(10,27) = 6.635 , p < .001), with an adjusted R2 of 0.61. Participants’ predicted resting heart rate is equal to 61.04–3.656 (GENDER) + 10.394 (ANTIDEPRESSANTS) – 3.312 (ANXIOLYTICS) + 9.158 (SMOKING) – 2.919 (SLEEPING) + .374 (AVERAGE HEART RATE) – 0.001 (AGE) – 1.236 (GLUCOCORTICOIDS) – 1.560 (EXCERCISE) + 0.430 (ALCOHOL CONSUMPTION), where gender is coded as 0 = Male, 1 = Female; antidepressants were coded as 0 = not taking antidepressants, 1 = taking antidepressants; smoking was coded as 0 = not smoking, 1 = smoking; sleeping was coded as 0 = less than 6 hr of reported sleep per day, 1 = more than 6 hr of reported sleep per day; average heart rate during PTSD hyperarousal events are measured in beats per minute; age was measured in years; glucocorticoids was coded as 0 = not taking glucocorticoids medicine, 1 = taking glucocorticoids medicine; exercise was coded as 0 = not exercising regularly, 1 = exercising regularly; and alcohol consumption was coded as 0 = not consuming alcohol, 1 = consuming alcohol. Participants’ resting heart rate increased by about 3.7 bpm for females compared with their male counterparts. Resting heart rate also increased by about 10.4 bpm for participants who used antidepressants compared with those who did not use antidepressants. Participants’ resting heart rate who used anxiolytics decreased by 3.3 bpm compared with those who did not use anxiolytics. Smokers’ resting heart rate was 9.1 bpm higher than non-smokers resting heart rate. Participants who had more than 6 hr of sleep per day had about 2.9 bpm lower resting heart rate compared with participants who had fewer sleep hours. The resting heart rate was 0.4 bpm higher for each 1 bpm increase in the average heart rate during hyperarousal events. For each 1-year increase in age, the resting heart rate decreased by 0.001 bpm. Participants who took glucocorticoids medicine had on average 1.2 bpm lower resting heart rate than those who did not take glucocorticoids. The ones who exercised regularly had 1.5 bpm lower resting heart rate on average than the ones who did not exercise on regular basis. Finally, participants who consumed alcohol had roughly 0.4 bpm higher resting heart rate than those who did not consume alcohol. However, from these variables, only gender, antidepressants, smoking, sleeping, and average HR were significant predictors of resting heart rate (Table 1).
Results of the Full Model Analysis (Overall Model R2 Adjusted = .61)
Heart Rate Profiles During PTSD Hyperarousal Events
Heart rate rhythm
A healthy window of heart rate data in resting position is steady with normal sinus rhythms (Sauer & Olchansky, 2008). Such healthy rhythm is characterized using sinusoidal waves with no significant deviations between successive waves (Gertsch, 2004). However, our finding suggests that when individuals experience PTSD hyperarousal, their heart rate rhythm is irregular and sporadic. More specifically, in most cases, heart rate continues to accelerate immediately after the perceived (self-reported) PTSD hyperarousal event for an average of 21 bpm for 107 s on average with clear deceleration after about 81 s on average (up to 200 s for some participants) for an average of 26 bpm, which may suggest the recovery from the event. However, we observed a large variability in such abnormal rhythms with no uniform gradient in heart rate arousal or recovery in PTSD windows. Figure 5 shows a sample 10-min window of heart rate data for a healthy individual compared with heart rate data during a PTSD hyperarousal event in our study.
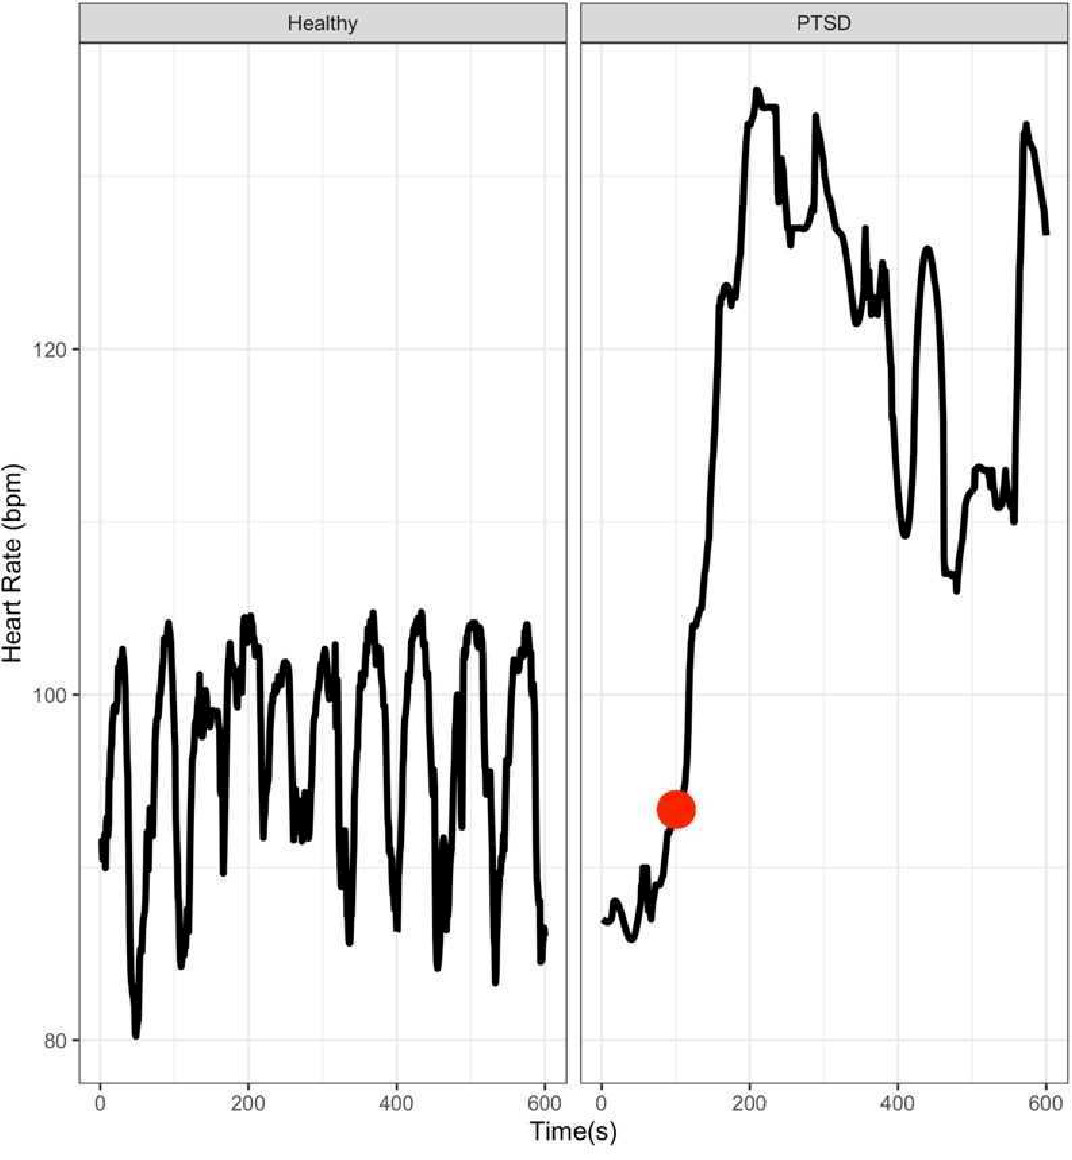
Heart rate patterns in a healthy subject (left) compared with a PTSD trigger (right). The red circle represents the self-reported event. PTSD = post-traumatic stress disorder.
Stationarity
The results from the Dickey–Fuller stationarity test (Dickey & Fuller, 1981) suggest that heart rate during onset of PTSD symptoms is highly non-stationary (Dickey–Fuller = −1.137, p =.92 for PTSD windows, where the null hypothesis was that the time series data are not stationary). Furthermore, a visual inspection of the stationarity graphs suggests that while both healthy windows and PTSD windows of heart rate data are non-stationary, windows of heart rate data with PTSD events have higher fluctuation rates compared with healthy counterparts. This observation was later validated using DFA (see below).
Autocorrelation
Figure 6 shows the autocorrelation function for 11 healthy heart rate windows and aggregated PTSD trigger windows. As shown in the figure, for healthy windows of heart rate, the direction of the correlation changes faster (from positive to negative); however, for PTSD hyperarousal windows of heart rate, the correlation coefficient is positive for a longer period of time. For instance, in Figure 6, the direction of correlation changes multiple times before a lag of 100 s in healthy windows of heart rate data, but this direction does not change for PTSD windows of heart rate data. Also, this correlation is 0 for PTSD windows of time when participants reported an event (lag 100) meaning that heart rate behaves in a more chaotic manner close to the reported event.
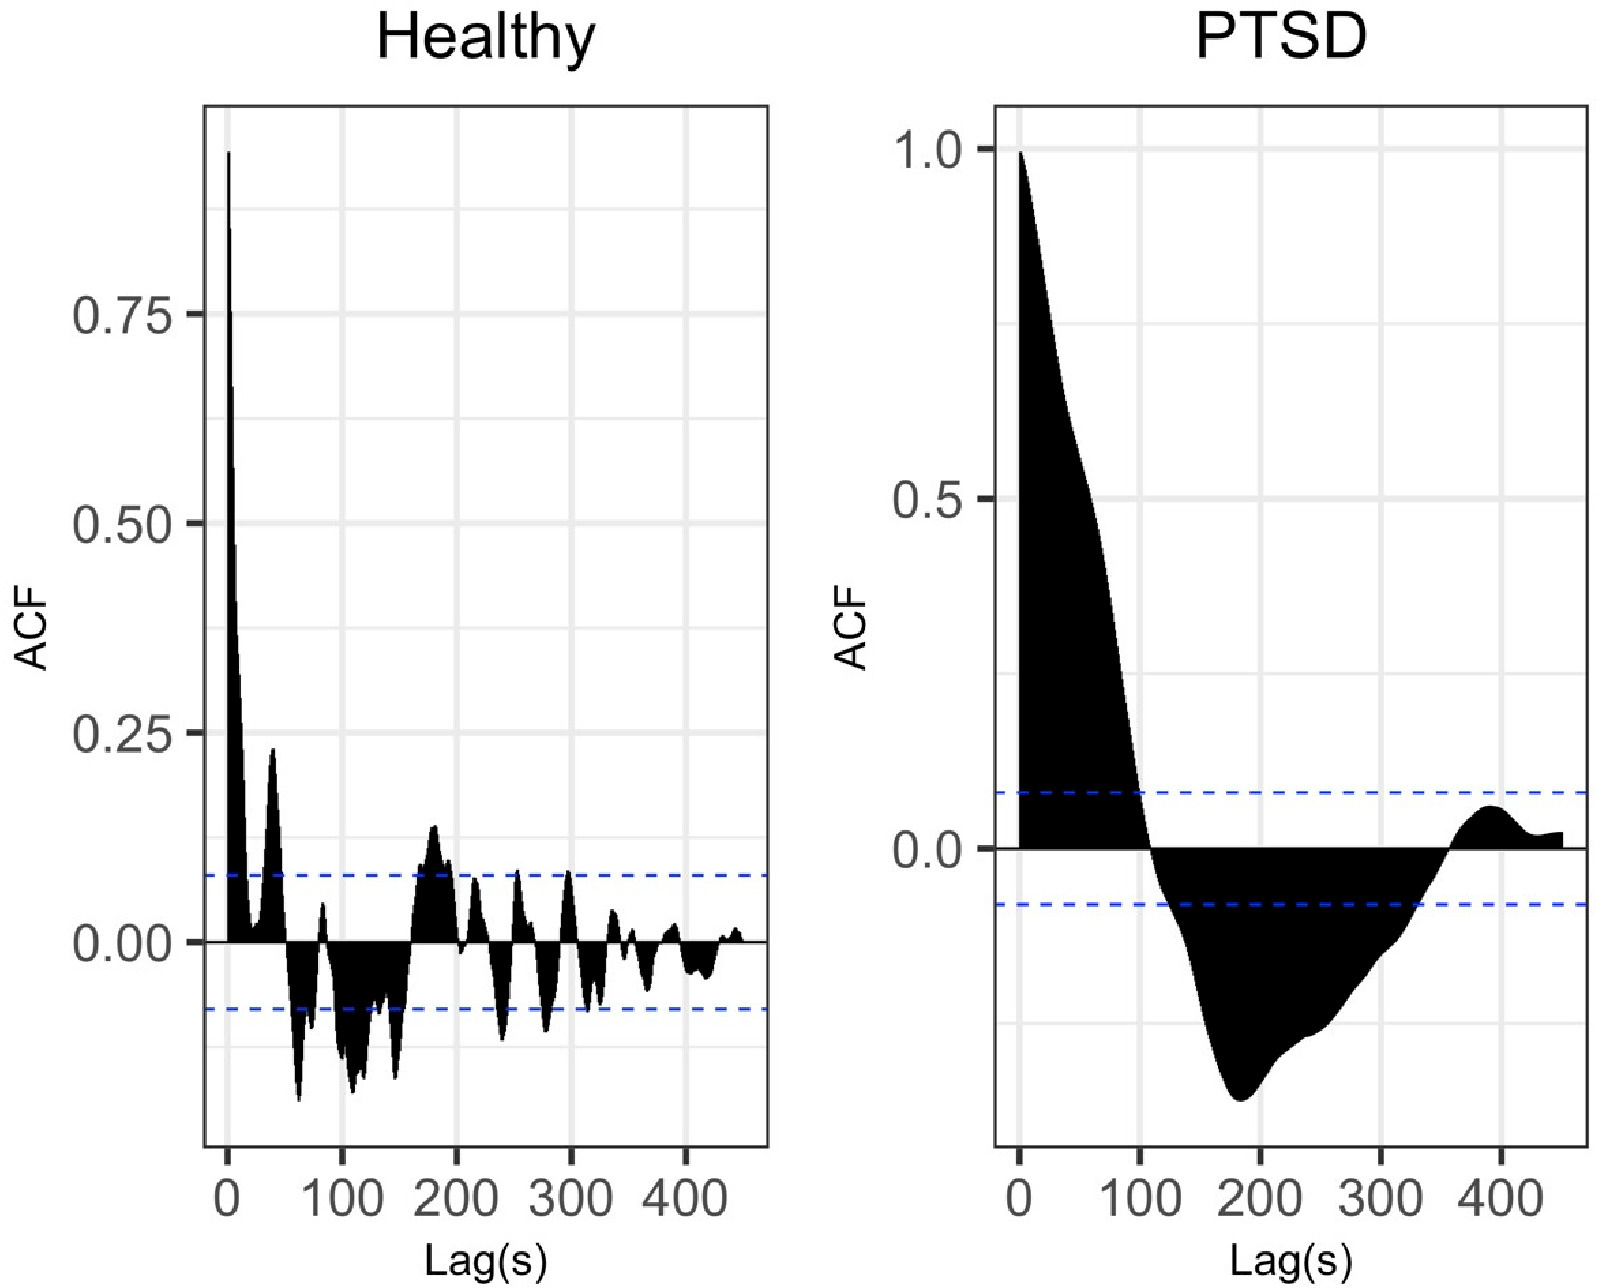
Autocorrelation graphs for healthy windows of heart rate (left) and PTSD windows of heart rate (right). PTSD = post-traumatic stress disorder.
Detrended fluctuation analysis (DFA)
Figure 7 shows DFA profiles plotted in R for samples of 600 s of 11 healthy windows and samples of 600 s of PTSD hyperarousal windows. As shown in Figure 7, the DFA function values measured in the PTSD hyperarousal windows are much higher compared with the corresponding values in the healthy window especially for longer time windows (>200 s).
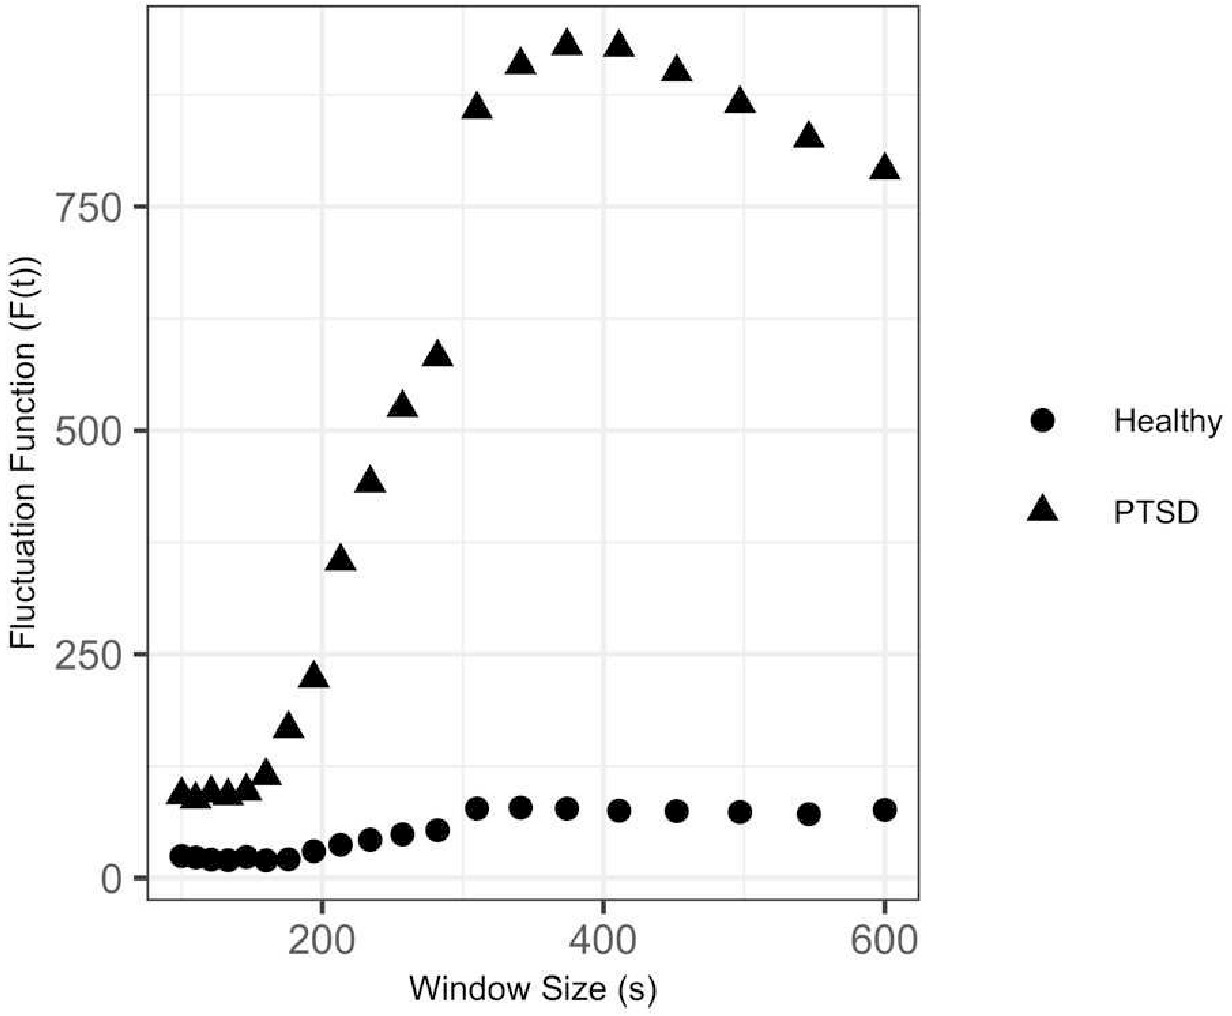
DFA graph for healthy windows of heart rate and PTSD hyperarousal windows of heart rate. DFA = detrended fluctuation analysis; PTSD = post-traumatic stress disorder.
Discussion
The goal of this study was to investigate the effects of various factors on heart rate in veterans who are diagnosed with PTSD, as well as to model and describe heart rate patterns during PTSD hyperarousal events. To our knowledge, this is the first study to report on self-reported hyperarousal events as well as the characteristics of heart rate (other than correlations) during onset of PTSD symptoms in longitudinal and naturalistic settings. Our results showed that all 99 veterans who participated in this study experienced at least one PTSD hyperarousal event every 3 days with some experiencing an alarming rate of such events (up to 45 events over 6 days).
Although most participants reported not wearing the device between midnight and 6 am, about 5% of hyperarousal events were reported during this timeframe, which may suggest a significant underestimation of occurrence during sleep. This may support findings by others (e.g., van Wyk et al., 2016), who found poor sleep quality and reduced sleep duration and efficiency among PTSD patients. Another interesting finding was related to the occurrence of PTSD during the riding activities compared with resting. Our findings suggest that frequency of hyperarousal events is almost seven times higher during resting periods compared with periods involving physical activity. This may support Oppizzi and Umberger’s (2018) review that showed a reduction of PTSD symptoms when engaged in physical activity especially for those who are resistant to therapy. This finding also has significance for the design of PTSD monitoring technologies—our findings suggest the need to optimize designs for detection and interaction during rest periods. However, more work is needed to investigate individual characteristics that result in differences in outcomes related to physical activity as well as different types and duration of activity.
Our results also showed that demographic factors such as smoking and use of medications such as antidepressants may increase resting heart rate in veterans who suffer from PTSD. In addition, females had higher resting heart rate compared with males, and those who reported more hours of sleep per night had significantly lower resting heart rate. While we are not aware of any comparative studies for the veteran population, these findings are partly in line with previous research that shows similar effects of gender (Larsen & Kadish, 1998), smoking (Linneberg et al., 2015) and antidepressants (Kemp et al., 2014) on resting heart rate in the civilian population. Although all these parameters have known effects on the resting heart rate of healthy individuals, to our knowledge this is the first study that documents these effects in PTSD patients. Given the emergence of heart-rate-based PTSD symptom detection technologies (e.g., McDonald et al., 2019), our findings suggest that machine learning algorithms that do not account for changes in heart rate attributable to gender, smoking, medication use, and sleep behavior, may introduce unintended biases. The effect of these biases should be investigated in future work.
While the application of ARIMA to investigate heart rate patterns is not novel, our findings show promise for the development of descriptive models of PTSD hyperarousal based on identification of unique heart rate markers. In particular, our findings suggest that heart rate patterns during PTSD hyperarousal events exhibit unique non-stationary and high fluctuation characteristics compared with healthy heart rate patterns. We believe this novel application of ARIMA with the preliminary evidence of efficacy presented here is an important contribution to the literature on psychophysiology of PTSD and an important first step in describing the heart rate response to PTSD hyperarousal events. While more work is needed to verify the identified heart rate patterns, this preliminary evidence shows potential heart-rate sensor-based tools for detection of PTSD symptoms. Such detection may play a vital role in supporting just-in-time self-management, digital therapeutics, and coaching technologies.
When autocorrelation analysis was used to compare heart rate during PTSD hyperarousal events and within healthy windows of heart rate, significant differences in periodicity was observed. This result and the pattern observed is similar to the findings from Peng et al. (1995), which show dependency in heart rate data of healthy people that does not exist in the heart rate data of people who have cardiovascular disease. Given the evidence suggesting the higher risk of heart attacks and other cardiovascular diseases for PTSD patients (Coughlin, 2011; Edmondson et al., 2013; Spindler & Pedersen, 2005), our findings may support such link between PTSD and higher rates of heart diseases.
The results from the DFA analysis suggest that the heart rate fluctuates widely during a perceived PTSD hyperarousal event. Given known associations between high fluctuation in heart rate and cardiac autonomic dysfunction in individuals (Chiang et al., 2016), our results may suggest a potential link between PTSD and higher rates of cardiovascular diseases. However, further investigation is needed to validate this assumption.
This study had several notable limitations that may affect the generalizability of findings. While naturalistic testing enjoys a high level of external validity, the self-reported data collected are prone to subjectivity and individual differences. In particular, participants might have over- or under-reported events, or some hyperarousal events may have been inadvertently reported (e.g., tapping twice on the interface when a single tap was intended). Another issue related to collecting data in naturalistic settings was the high number of missing values especially during the first three HERO events. In general, Apple Watches proved to be more reliable and provided a more complete dataset compared to Moto 360 devices. This is in line with El-Amrawy and Nounou (2015), who also suggest a near-perfect accuracy of Apple Watch’s heart rate sensor (92.8%) compared with Moto 360s when the two were compared to professional clinical pulse oximeters. Smartwatches provided a discreet and nonintrusive platform for soliciting self-reported events. However, future work may use other wearable sensors with higher sampling rate and accuracy, including chest straps. Another important limitation of this study was that the cardiac data related to PTSD hyperarousal events were collected during group events that involved extended physical activity (which was associated with considerably lower reporting of hyperarousal events) and may not generalize to all contexts. Future work may replicate this study for patients who are not involved in physical activities and/or who are in a home environment. Finally, we did not investigate differences between smartwatch heart rate and accelerometer sensors used in different studies. Therefore, the findings need to be interpreted as a preliminary case study, and future work is needed to evaluate the resulting patterns while comparing different devices.
Conclusion
PTSD is a prevalent condition among returning combat veterans and negatively affects their quality of life. Despite efforts and advances in therapeutics methods and medications used to treat this condition, self-management is challenging and remains largely unsupported. In an effort to investigate objective methods for detection of PTSD symptoms, a naturalistic study was conducted to investigate the impact of hyperarousal events on heart rate patterns. Our findings show distinguishable heart rate patterns and characteristics during PTSD hyperarousal events. While our understanding of psychophysiology of PTSD is still at its infancy, understanding the dynamics of this prevalent condition and its effect on physiology is critical to develop therapeutic tools that fit human needs and may set the stage for advanced real-time detection of onsets and digital therapeutics.
Key Points
Using wrist-worn devices, this study was able to assess naturalistic heart rate data and self-reported hyperarousal events in 99 veterans with PTSD.
Heart rates during PTSD hyperarousal events exhibited more variation and fluctuation rates when compared with healthy individuals’ heart rate series.
Smoking, use of medications such as antidepressants and anxiolytics, and being female were associated with increased resting heart rate in a subset of 38 veterans who suffer from PTSD.
Footnotes
Acknowledgments
We would like to thank “We Are Project Hero” Organization, and all veterans who participated in our studies for their help.
Author Biographies
Mahnoosh Sadeghi is a PhD candidate in the Department of Industrial and Systems Engineering at Texas A&M University. She received her bachelor’s degree in petroleum engineering with a minor in economics from Sharif University of Technology in Tehran, Iran, in 2016.
Farzan Sasangohar is an assistant professor in the Department of Industrial and Systems Engineering at Texas A&M University and an assistant professor in the Center for Outcomes Research (Primary) and Department of Surgery (Secondary) at Houston Methodist Hospital. He received his PhD in industrial engineering from University of Toronto in 2015.
Anthony D. McDonald is an assistant professor and Corrie and Jim Furber Faculty Fellow in the Department of Industrial and Systems Engineering at Texas A&M University and the director of the Human Factors and Machine Learning Laboratory. He received his PhD in industrial engineering from the University of Wisconsin, Madison, in 2014.
Sudeep Hegde is an assistant professor in the Department of Industrial and Systems Engineering at the Clemson University. He earned his PhD at University of Buffalo, Buffalo, New York, in 2015, with a focus on developing learning frameworks and tools based on resilience engineering principles.