
Abstract
Objective
With the rapid improvements in drone technology, there is an increasing interest in distal pointing to diffuse drones. This study investigated the effect of depth on distal pointing when the hand does not traverse the entire distance from start to target so that the most suitable mathematical model can be assessed.
Background
Starting from the Fitts paradigm, researchers have proposed different models to predict movement time when the distance to the target is variable. They do consider distance, but they are based on statistical modeling rather than the underlying control mechanisms.
Methods
Twenty-four participants volunteered for an experiment in a full-factorial Fitts’ paradigm task (3 levels of movement amplitude *7 levels of target width *3 levels of distance from participant to screen). Movement time and the number of errors were the dependent variables.
Results
Depth has a significant effect when the target width is small, but depth has no effect when the target width is large. The angular version of the two-part model is superior to the one-part Fitts’ model at larger distances. Besides, Index of difficulty for distal pointing,
Conclusion
The angular version of the two-part model is a viable and meaningful description for distal pointing. Even though the
Application
A reasonable predictive model for performance assessments and predictions in distal pointing.
Introduction
Distal Pointing Tasks
Technology improvements inevitably bring some downside. Today, anti-UAV (unmanned aerial vehicle) systems and counter-drone technologies have been specifically developed to avoid drone strikes (Golightly et al., 2020; Koksal et al., 2020; Tomislav et al., 2018). When using such equipment, a qualified person, such as a soldier, has to hold a heavy weapon and aim at a drone, a tiny bug-like robot, or a swarm of drones in an open space. A similar, but ubiquitous situation is where an individual makes a presentation with a laser pointer aimed at a large screen (Ackad et al., 2015; Nancel et al., 2013, 2015). Another example of distal pointing is shooting with infrared aids such as remote controls or computer games (Chen & Chen, 2021; Silva et al., 2009). Such types of interaction referred to as mid-air or distal pointing seem different from a direct touch or cursor control using a mouse (Janzen et al., 2016; Kopper et al., 2010; Nancel et al., 2015; Pfeiffer et al., 2008). The main reason is that the hand or arm does not traverse the entire distance from the initial starting point to the target. Instead, a virtual ray from the hand/arm moves through some fixed angle. Hence, one method for addressing distal pointing is ray-casting (Roth, 1982). Previous studies have investigated up to 3.3 m, but as shown later, this distance may be too short for investigating distal pointing task.
Modeling Aimed Movements
Aimed movement, that is, moving from one position to a target, is a common type of motion that people carry out daily. Fitts (1954) proposed a linear relationship (equation (1)) between the movement time (T) and index of difficulty, that consists of movement amplitude (A) from the starting point to the center of the target, and the target width (W).
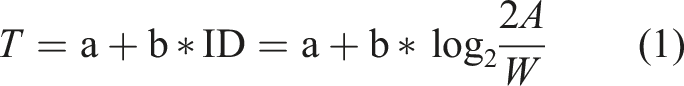
Fitts’ law has been proven to be valid for a range of conditions and it is quite useful for user-experience design and human–computer interaction (Brown et al., 2007; Deng et al., 2019; Keir et al., 1999; Lin & Tsai, 2015; MacKenzie, 1992; McGuffin & Balakrishnan, 2005). To account for the low ID misfits, Soukoreff and MacKenzie (2004) proposed the following Shannon formulation, which Drewes (2010) has questioned:
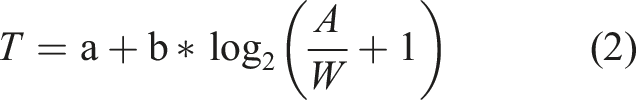
Even though equation (2) generally results in a better fit, the formulation does not explain the underlying mechanism. At low ID values, the movement is ballistic and T is proportional to

Similarly, the expanded version of the Shannon formulation (Shoemaker et al., 2012) given in equation (2) is

Depth Effect on Distal Pointing
The depth, which is the distance between the participant and the target surface, is not accounted for in the aforementioned models (equations (1)–(4)). For most screen-based studies, depth is a fixed factor and the gain will affect both the movement amplitude and the visual cone. However, when the visual cone remains the same, movement magnifications at different depths can be accounted with gain. For best performance, there is an optimum value for gain as high gain will lower distance covering time but increase target acquisition (homing phase) time while low gain will increase distance covering time and reduce the target acquisition time. The optimum value of gain has varied from around 2 to 15 depending on the experimental conditions (Bohan et al., 2003; Casiez et al., 2008). In a more recent study, Pang et al. (2019) found that for a screen-based task, the optimum gain was 2.4 for an amplitude of 40 mm and at all other amplitudes, the optimum gain was 14.5. We did find that equation (1) was not a good fit at this optimum gain suggesting that the formulation will differ depending on the gain.
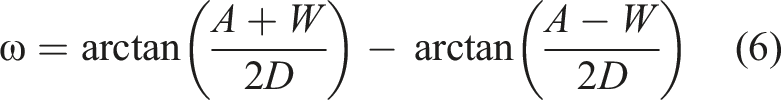
If angular A (or α) and angular W (or ω) are considered instead of their linear counterparts, depth is automatically accounted for during relevant evaluations. Angular A (α) and W (ω), as shown in Figure 1 are calculated using equations (5) and (6) (Janzen et al., 2016; Kopper et al., 2010). The angular measures result in an angular index of difficulty, Relationship of angular A (α) and angular W (ω) to A, W, and D.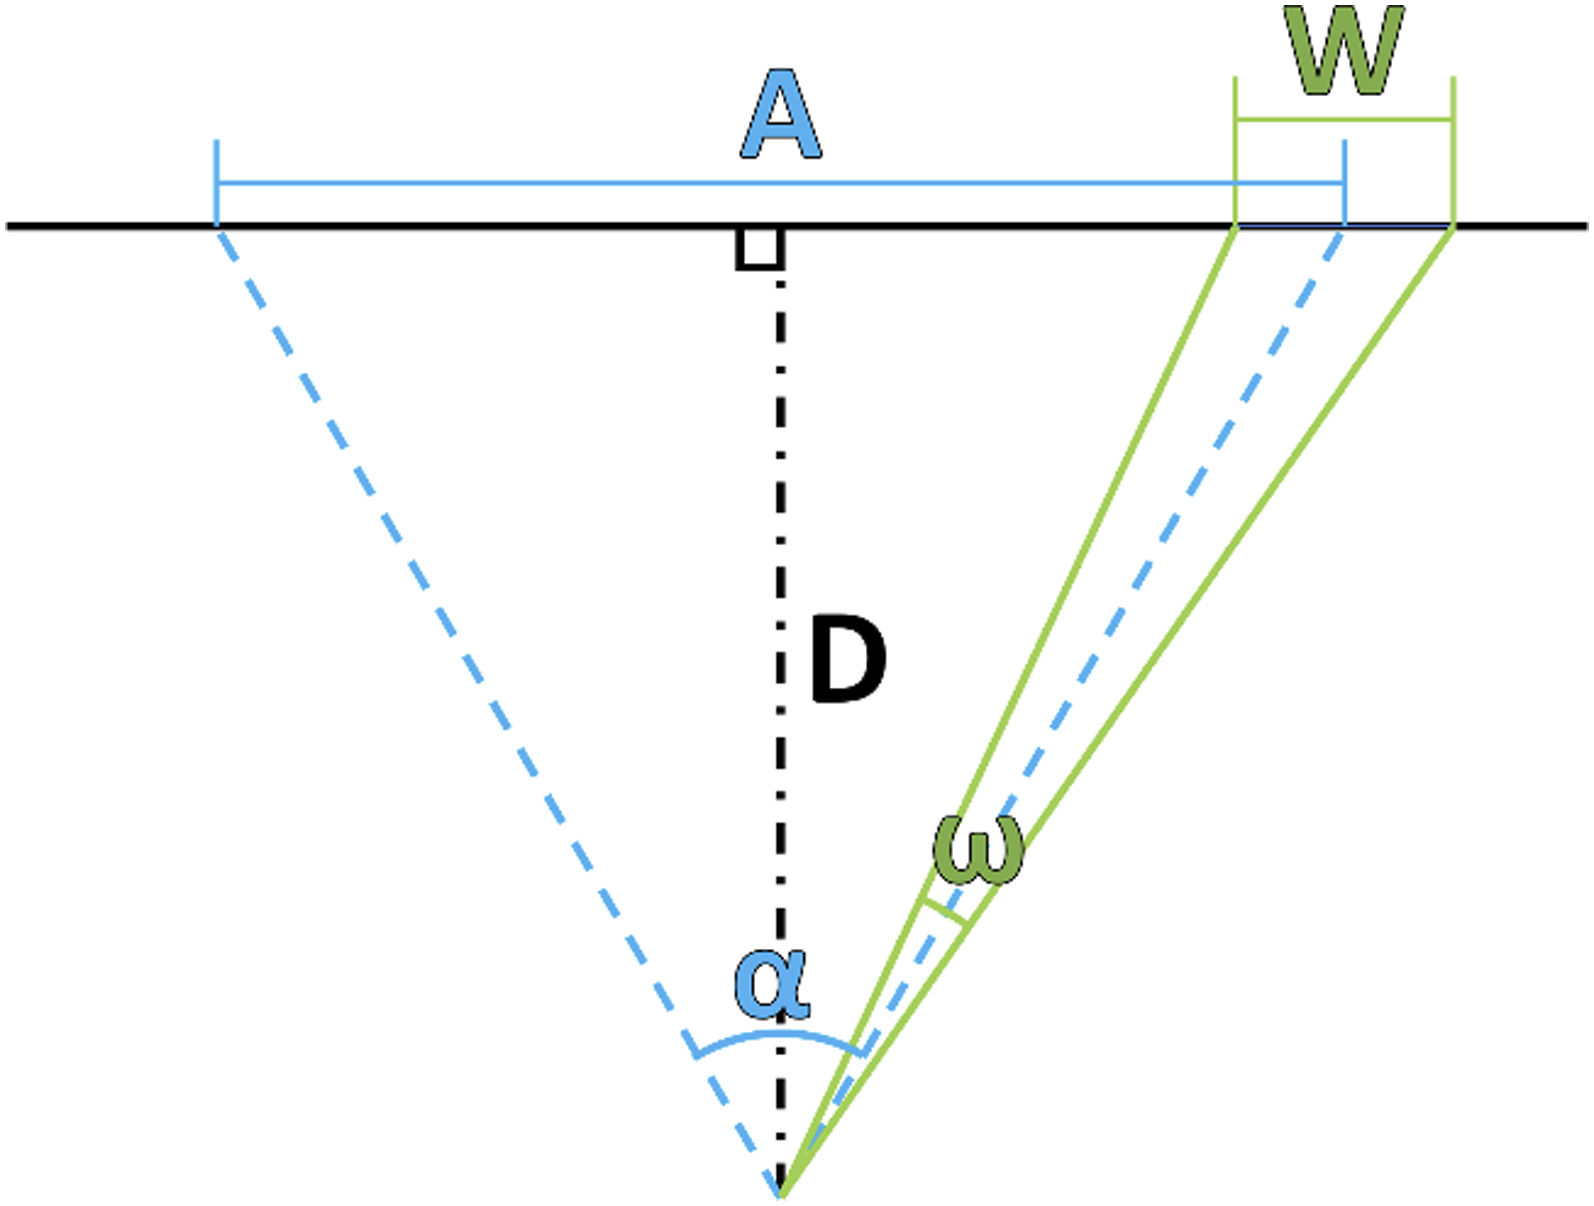

In Fitts’ paradigm (equation (1)), proportional increases in A and W would not affect movement time. If such an assumption is true, then a longer range of targets should have no effect, providing evidence for using small-scale simulations to replace larger-scale scenarios, such as in anti-UAVs. However, Janzen et al. (2016) found a significant impact of depth on movement time, and the effect of depth was similar to the control/display gain, which seems reasonable. They validated the advantage of the two-part models when using the angular version of equations (3) and (4). All R2 values were above 0.9 and the angular version of equation (4) resulted in the highest R2 (0.96).
Kopper et al. (2010) tested to a maximum depth of 3 m while Janzen et al. (2016) used a maximum depth of 3.3 m. For Hong Kong Chinese, the shoulder grip length is 560 mm (Pheasant, 1986), and for an optimum gain of 14.5 (Pang et al., 2019), the corresponding depth is 8.1 m. The reason for using shoulder grip length will be mentioned later in the methods section. Thus, in this investigation, a depth of 8 m, which is beyond that of any existing study, was tested. On a screen-based task, Pang et al. (2019) did find the MT formulation differed at the optimum gain. This leads us to think that at a depth of approximately 8 m, the fit may vary and equation (1) may not be the best. Due to the balance between traversing to target and thereafter acquiring the target, a two-part model may give rise to a better fit as opposed to a one-part model because the 2-part model could account for both the ballistic movement and the target acquisition independent of each other and is also quite stable over different gains unlike the one-part model (Shoemaker et al., 2012).
Research Hypothesis
In this study, we would like to explore and extend previous studies related to depth, angular measures, and the commonly used Fitts’ translational measure formulations in a real-world setting. The two hypotheses investigated are:
Two-part models are more effective than one-part models.
The angular version of the model has higher prediction accuracy than the translational measures model.
Methods
Participants
Twenty-four paid volunteers (12 male and 12 female; mean age of 26.3, SD = 3.0) participated in this experiment. All were healthy and right-handed with 20-20 normal or corrected vision. The research complied with the American Psychological Association Code of Ethics and was approved by the Institutional Review Board at the Hong Kong University of Science and Technology. Informed consent was obtained from each participant.
Tasks and Apparatus
A C++ program together with a commercial desktop computer (2.81 GHz CPU clock rate, 16.0 GB RAM, 64-bit Windows 10 operating system), a projector (resolution 1200 × 1600 pixel, Model No. NP-M311XG 4240678EB, fixed on the ceiling), a 3-m-width screen (Figure 2(a)), a free-driver USB camera (fixed on the ceiling), a full range speaker (Model TEAC POWERMAX 80/2), a wireless mouse (Figure 2(b)), and a gun-like laser pen (Figure 2(c)) were used for this experiment. Visio Studio 2017 was used as the Software Development Kit (SDK). To eliminate rotation and sliding, a chair without wheels was used. The relative position of the projector, camera, and screen is shown in Figure 2(d). The camera view covered the projected area to track the laser point (Figure 2(d)). (a) The 3-m-width screen with a projected area (central area, 1774*2365 mm); (b) a wireless mouse on the left hand for clicking; (c) a laser pen and a mouse connected with a 3D printed part for pointing (the wireless mouse on the right hand is disabled); (d) the side view of the experimental setting.
All participants sat in a position that they found comfortable. All instructions related to the experiment were given through voice prompts from a computer. Each participant used their right hand to hold and move a laser pen (Figure 2(c)) with their elbow locked at approximately 180° and the wrist in a fixed position (Figure 2(d)) to reduce variability (Bohan et al., 2003). This constraint was put in place to reduce the number of degrees of freedom in the limb and align the overall task objectives with those of a skilled marksperson, who is able to synchronize their wrist and shoulder movements (Arutyunyan et al., 1969). At first, the program directed the participants to position the laser point at the starting point, which was a small white circle on the left side of the screen with a black background. Once the laser point was correctly positioned, there was a warning interval with an announcement, “three, two, one, go.” Participants were required to keep the laser point at the starting point until they heard “go.” Otherwise, the program would repeat “two, one”, before “go.” Participants were asked to move the laser point from the starting position to the rectangular target on the right side of the screen as fast and as accurately as possible once they heard “go.” The trial ended when the mouse on the left hand was clicked (Figure 2(d)). Using a mouse on the left hand to end a trial avoided the Heisenberg effect (Bowman et al., 2002). All participants placed their forearm on their thighs when holding the mouse (Figure 2(d)). Participants had several seconds to rest between each trial. The participants were instructed to report any lapses of focus or mistakes they made during the experiment. For example, starting to move before they heard “go” or any change of their hand/arm posture during the trial, which only they knew. Such issues resulted in the participant re-doing that trial. The system did not record such trials and these were not used in any analyses. If the laser point was inside the target when the mouse was clicked, designating the end of trial, that was a successful trial. If the laser point was outside the target at the end of the trial, that was a trial in error. For each condition, each participant was required to have 8 successful trials. The error trials were counted in the error rate calculations, but not in the movement time analysis.
Experiment Design and Procedure
The center of the starting point and the center of the target were 1.2 m above ground level. The height of all targets was 887 mm.
A full factorial design was used. Three independent factors were investigated: 1. Depth (D), is the distance from each participant’s eyes to the screen at 2m, 4m, and 8m. Movement of the hand is amplified on the screen when depth is involved (Figure 2(d)). The control-display gain could be calculated with depth/shoulder grip length. For Hong Kong Chinese adults, the optimum gain is 14.5 (Pang et al., 2019) resulting in a depth of 8.1m and thus, we set 8m as the largest depth. 2. Amplitude (A), is the distance from the center of the starting point to the center of the target at 443.4, 886.9, and 1773.7 mm. The largest A was based on the projection area of the screen. 3. Width (W), target widths of 28.1, 39.9, 56.2, 112.3, 156.7, 221.7, and 443.4 mm. The target widths were determined to cover a range of difficulty from 1 to 7.
The experiment was conducted over three days. Participants performed ten training trials each day to familiarize themselves with each depth block. Five were with A = 443.4 mm, W = 112.3 mm, and the other five training trials had A = 1773.3 mm, W = 443.4 mm. The order of the depths was balanced among the participants. The sequence of A*W permutations for each participant on each day was randomized. In each A*W condition, one individual was required to perform eight successful trials (de Boer et al., 2013). Participants were given a 2-min break after every 4 or 5 A*W permutations.
Results
Effects on the Error Rate
In the whole experiment, there were 12,096 successful trials (24 participants*3D*3A*7W*8 repetitions). The 402 error trials (error rate of 3.22%) were replaced so that there were no missing data. The trials with reported errors were not included in the analyses of movement time.
A repeated measure analysis of variance with a full factorial design of D*A*W on the number of errors showed that all main factors were significant with the Greenhouse-Geisser (GG) correction: D (F (1.53, 35.11) = 30.6, pGG < .001, ηp2 = .57), W (F (2.05, 47.21) = 43.9, pGG < .001, ηp2 = .66), A (F (1.74, 39.96) = 19.5, pGG < .001, ηp2 = .46). All two-way interaction effects were also significant: D*W (F (4.37, 100.53) = 8.6, pGG < .001, ηp2 = .27); D*A (F (3.33, 76.67) = 5.3, pGG = .002, ηp2 = .19); W*A (F (4.63, 106.52) = 4.8, pGG = .001, ηp2 = .17). The three-way interaction effect, D*W*A, was not significant.
The post-hoc pairwise comparison with Bonferroni’s adjusted alpha level (.05/m, where m is the number of comparisons) indicated that all As and Ds were significantly different from each other. Increasing A and D, increased error. There were 80, 117, and 205 errors when D was 2, 4, and 8 m; and 94, 117, and 183 errors for A values of 443.4, 886.9, and 1773.7 mm. The pairwise comparison results of W are not as straightforward and as a result, they are shown in Figure 3. The number of errors increased exponentially when W is small (Number of errors = 4965.2*W−1.066, R2 = .9639). When W is greater than 100 mm, there is no significant difference in the number of errors (Figure 3). Pairwise comparison with Bonferroni adjustment showed that the number of errors of W = 28.1 and 39.9 mm are not statistically different, and the errors at W = 39.9 and 56.2 mm were not different. The others with W larger than 56.2 mm were all not different. The number of errors plotted against target width.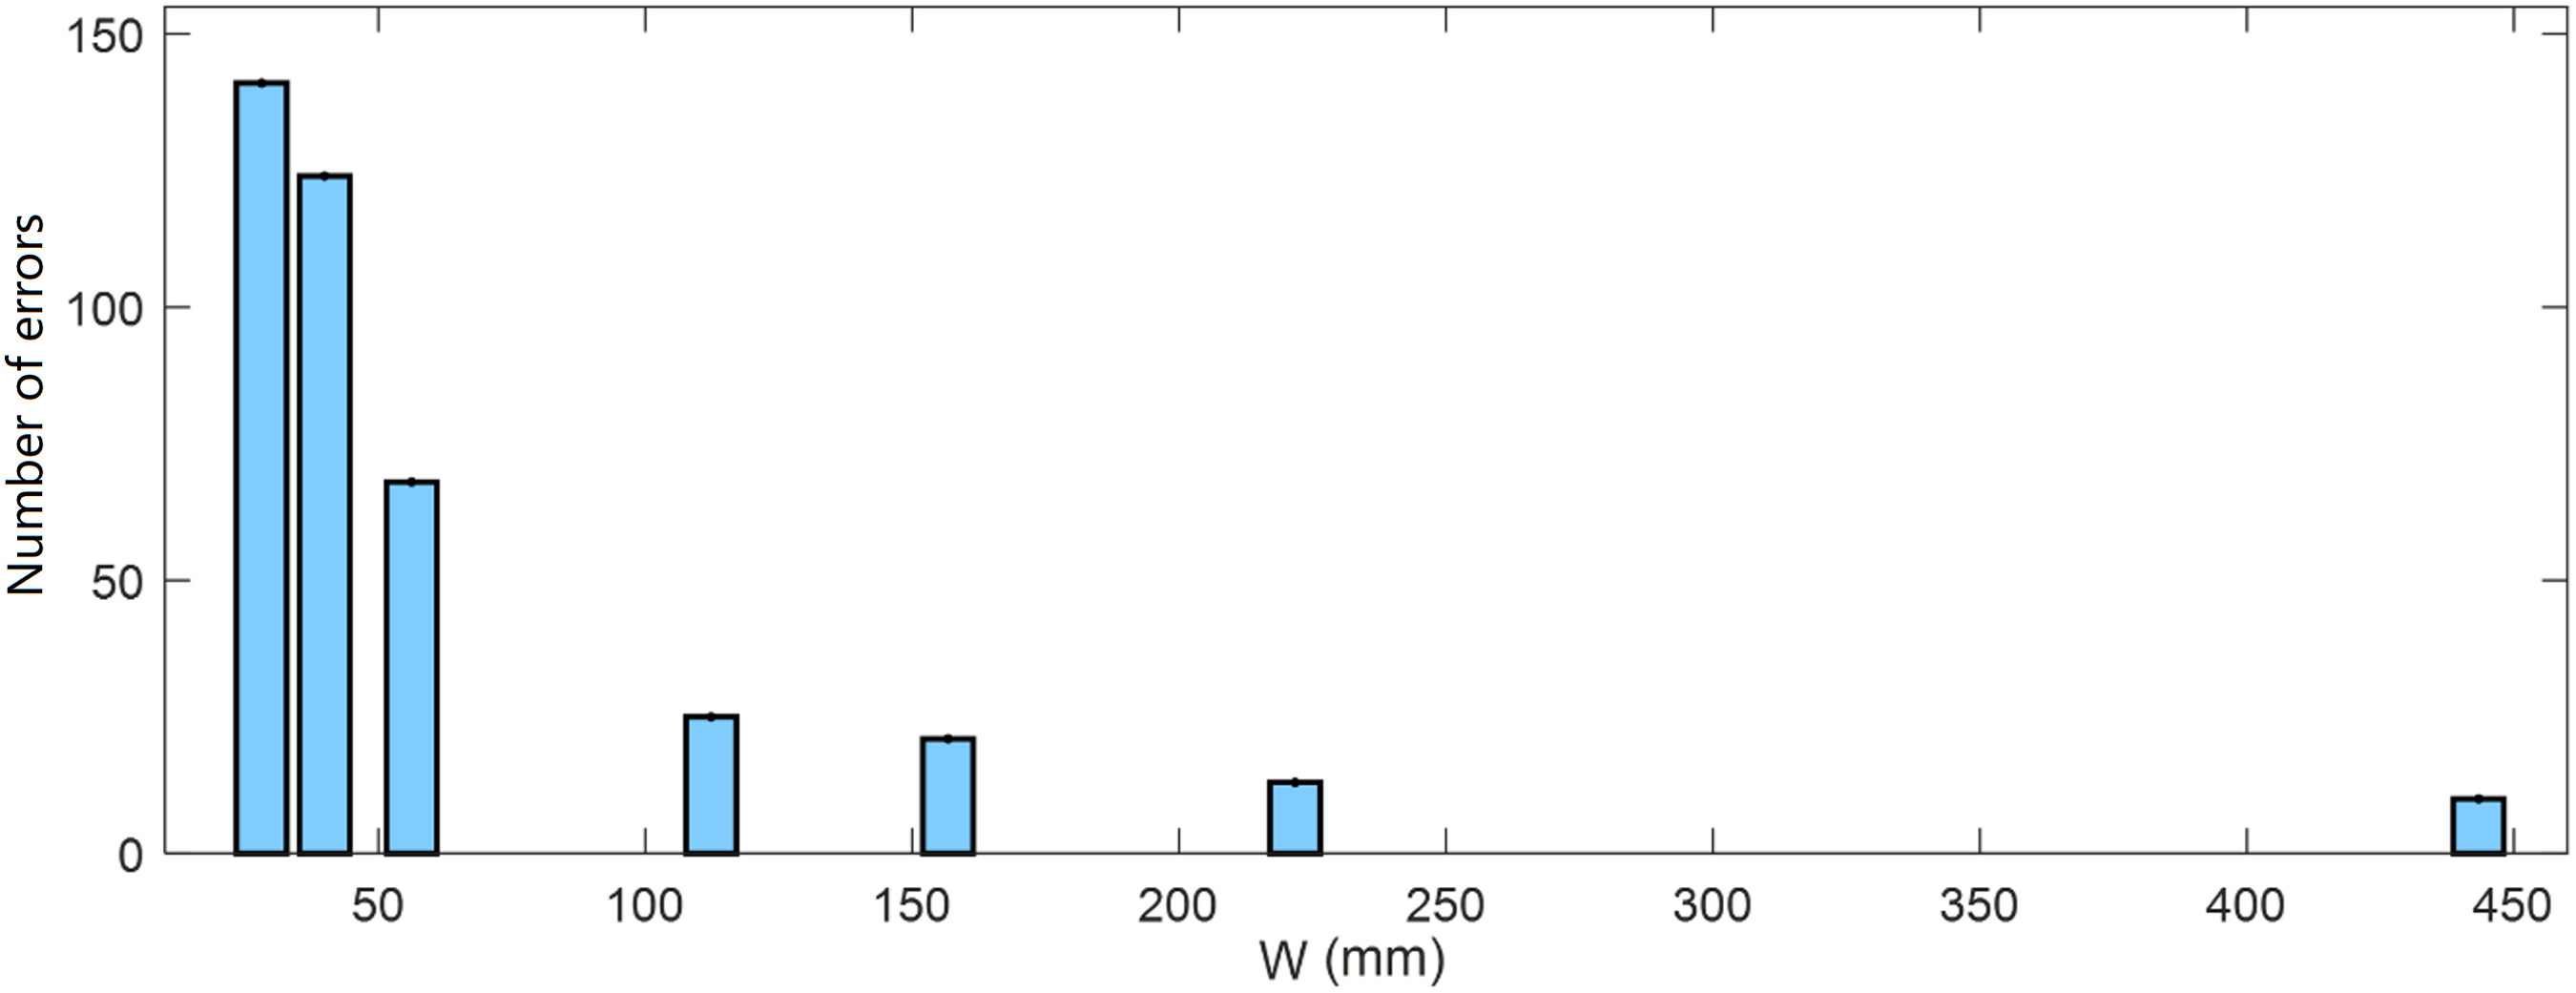
Effects on Movement Time
The movement time (T) included the reaction time of each participant. Because all participants were asked to report any errors during each trial, and then immediately redo another one, it led to a low level of data points outside the mean
A repeated-measures ANOVA with Greenhouse–Geisser correction was done on movement time (T). All main factors were significant: D (F (1.66, 38.23) = 14.9, pGG < 0.001, ηp2 = .39), W (F (1.33, 30.51) = 325.7, pGG < 0.001, ηp2 = 0.93), A (F (1.50, 34.60) = 553.3, and pGG < 0.001, ηp2 = .96). Figure 4 shows the mean and the standard error of each main factor level. The post-hoc pairwise comparison under Bonferroni adjusted alpha level (.05/m, m is the number of comparisons) showed that movement time measured for depths of 2m and 4m were not significantly different (Figure 4(a)). However, all pairwise comparisons of amplitude and target width were significant (Figures 4(b) and 4(c)). The mean time with standard error of the main experimental factors of (a) depth, D (b), amplitude, A, and (c) width, W.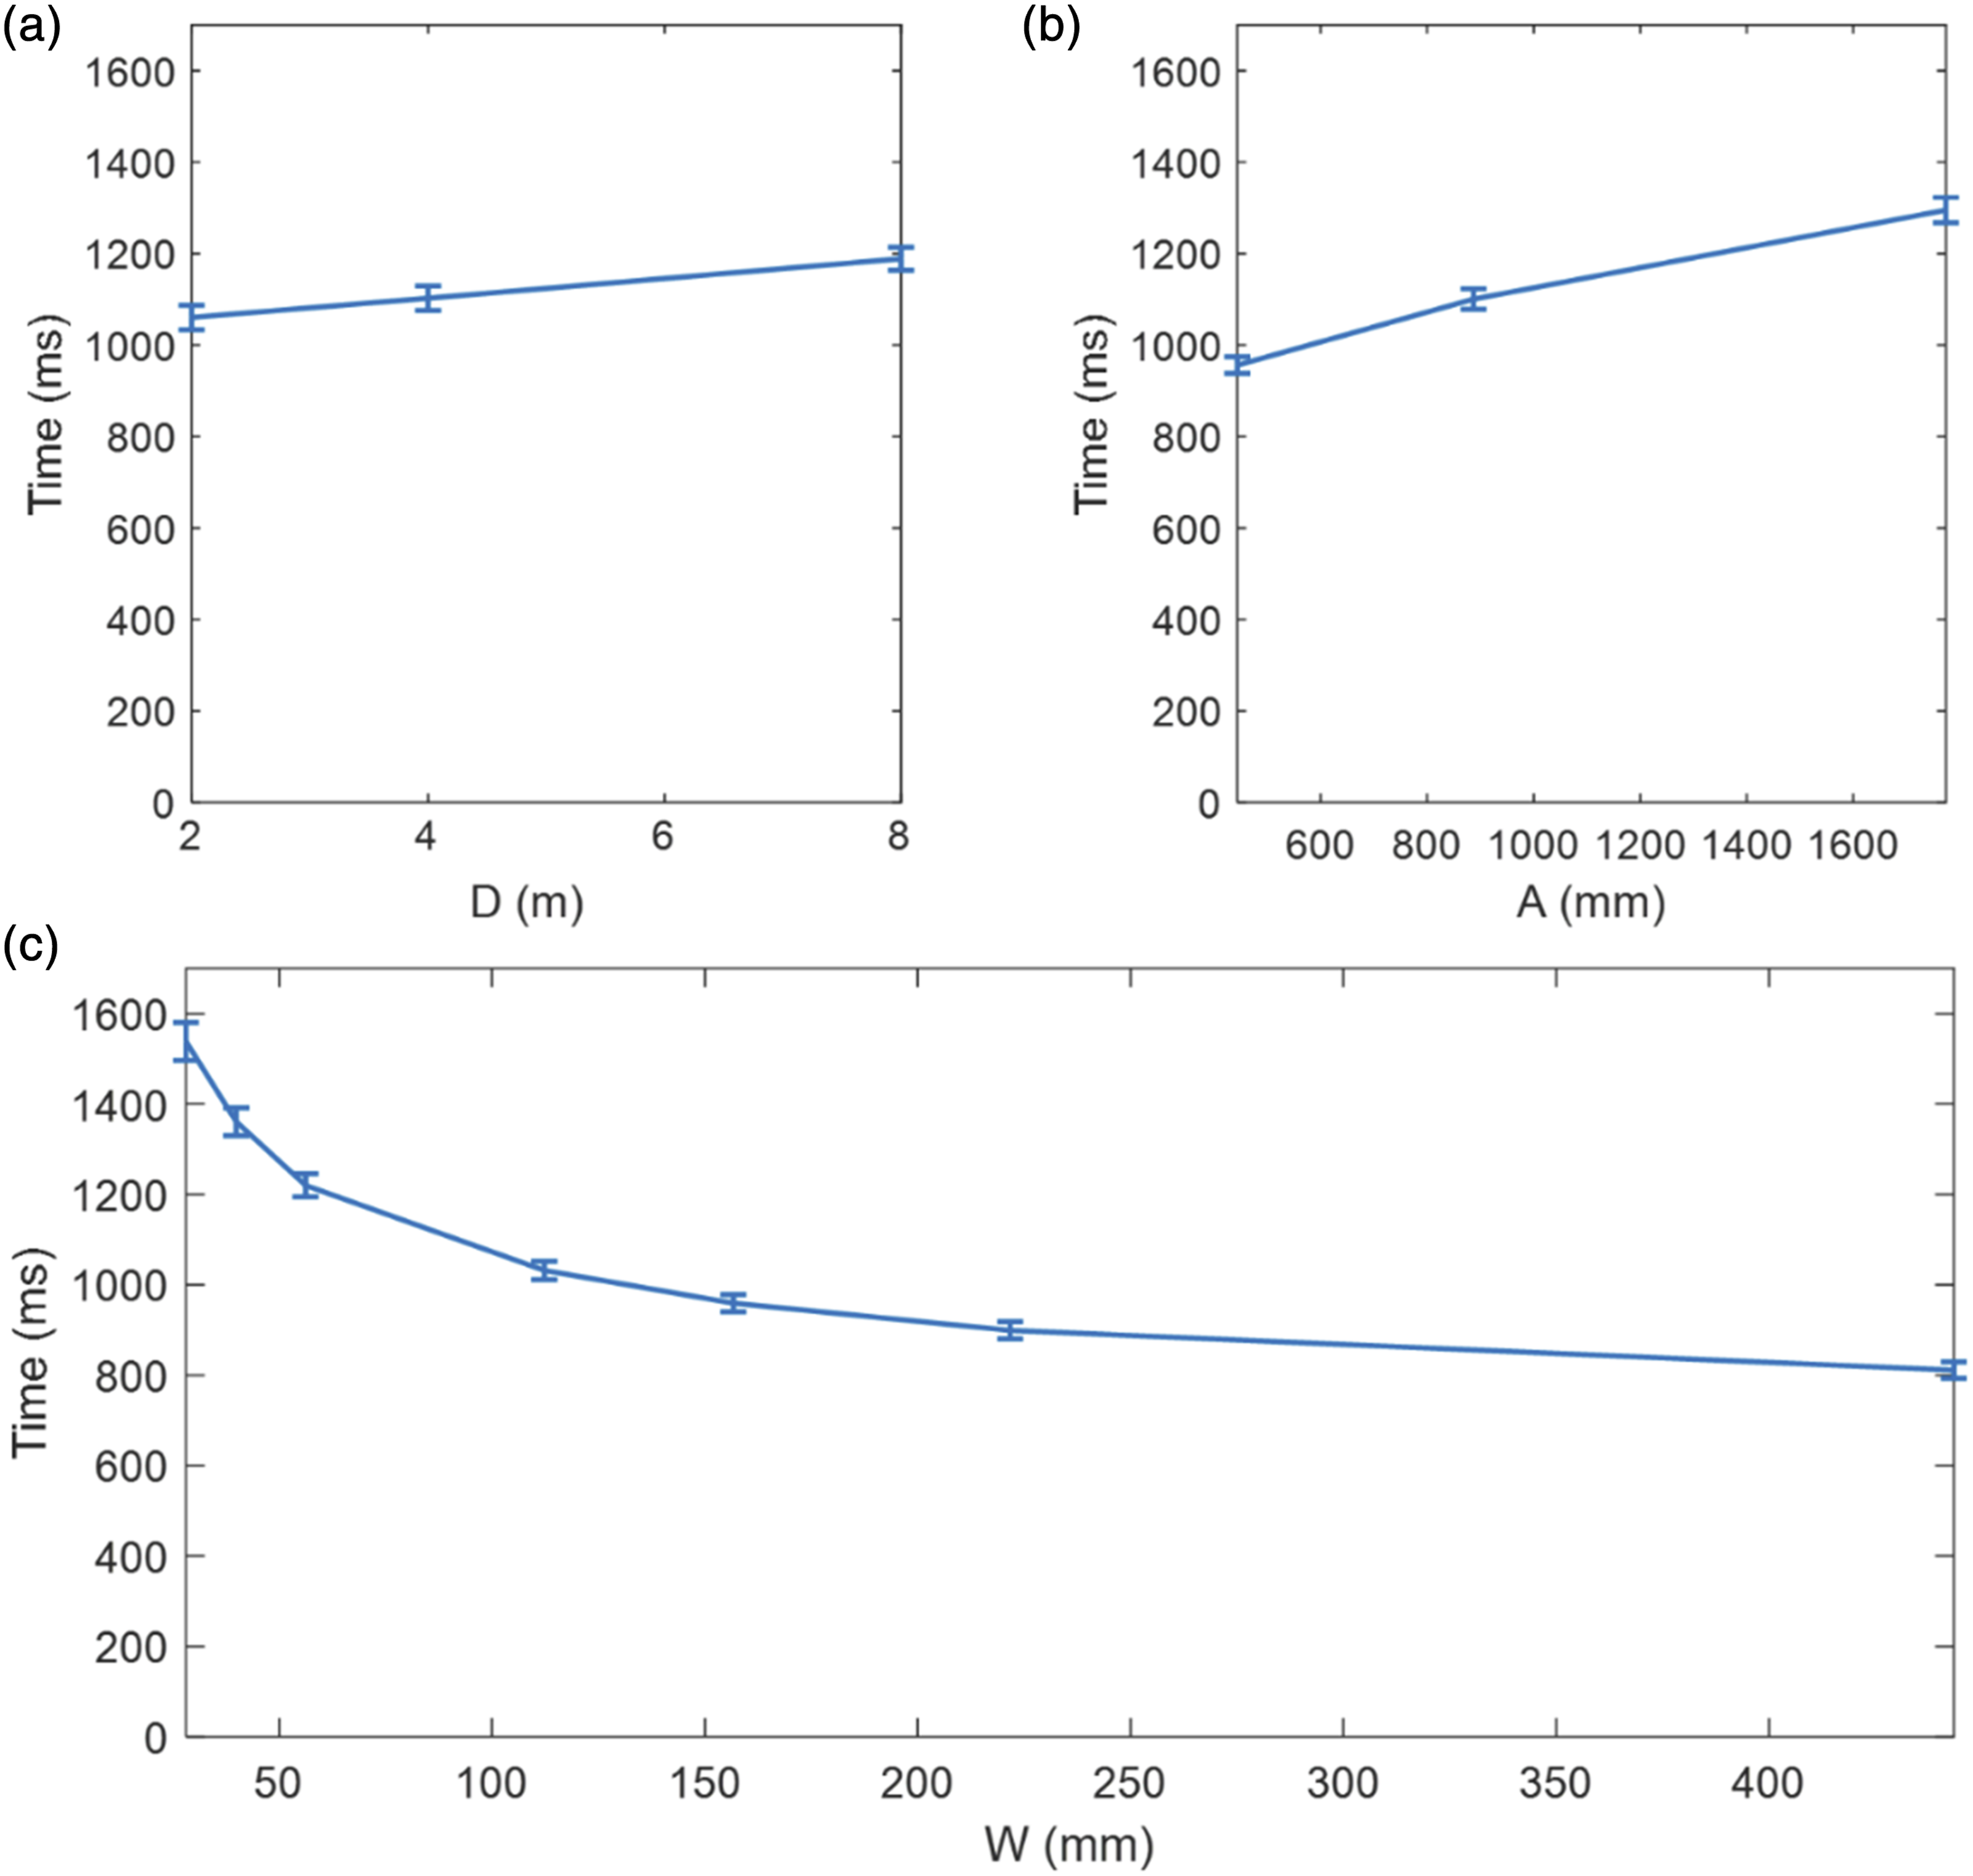
The interaction effects of D*W (F (2.63, 60.37) = 18.7, pGG < 0.001, ηp2 = 0.45) and W*A (F (4.16, 95.56) = 17.6, pGG < 0.001, ηp2 = 0.43) were significant. The pairwise comparisons on the W*A interaction effect showed that for each A value, all Ws were significantly different from each other. The D*W interaction showed that at each D value, all Ws were different. For the smaller W’s of 28.1, 39.9, and 56.2 mm, the three Ds were different from each other; when W = 112.3, D = 2 m was not different from D = 4 m, and when W = 156.7, 221.7, and 443.4 mm, the Ds were not different from each other. These results indicated that for any given movement amplitude, the depth had a significant effect when the target width was small, and its impact was not significant when the target width was large (Figure 5). T versus A plot for target widths of 28.1 mm, 39.9 mm, 56.2 mm, 112.3 mm, 156.7 mm, 221.7 mm, and 443.4 mm.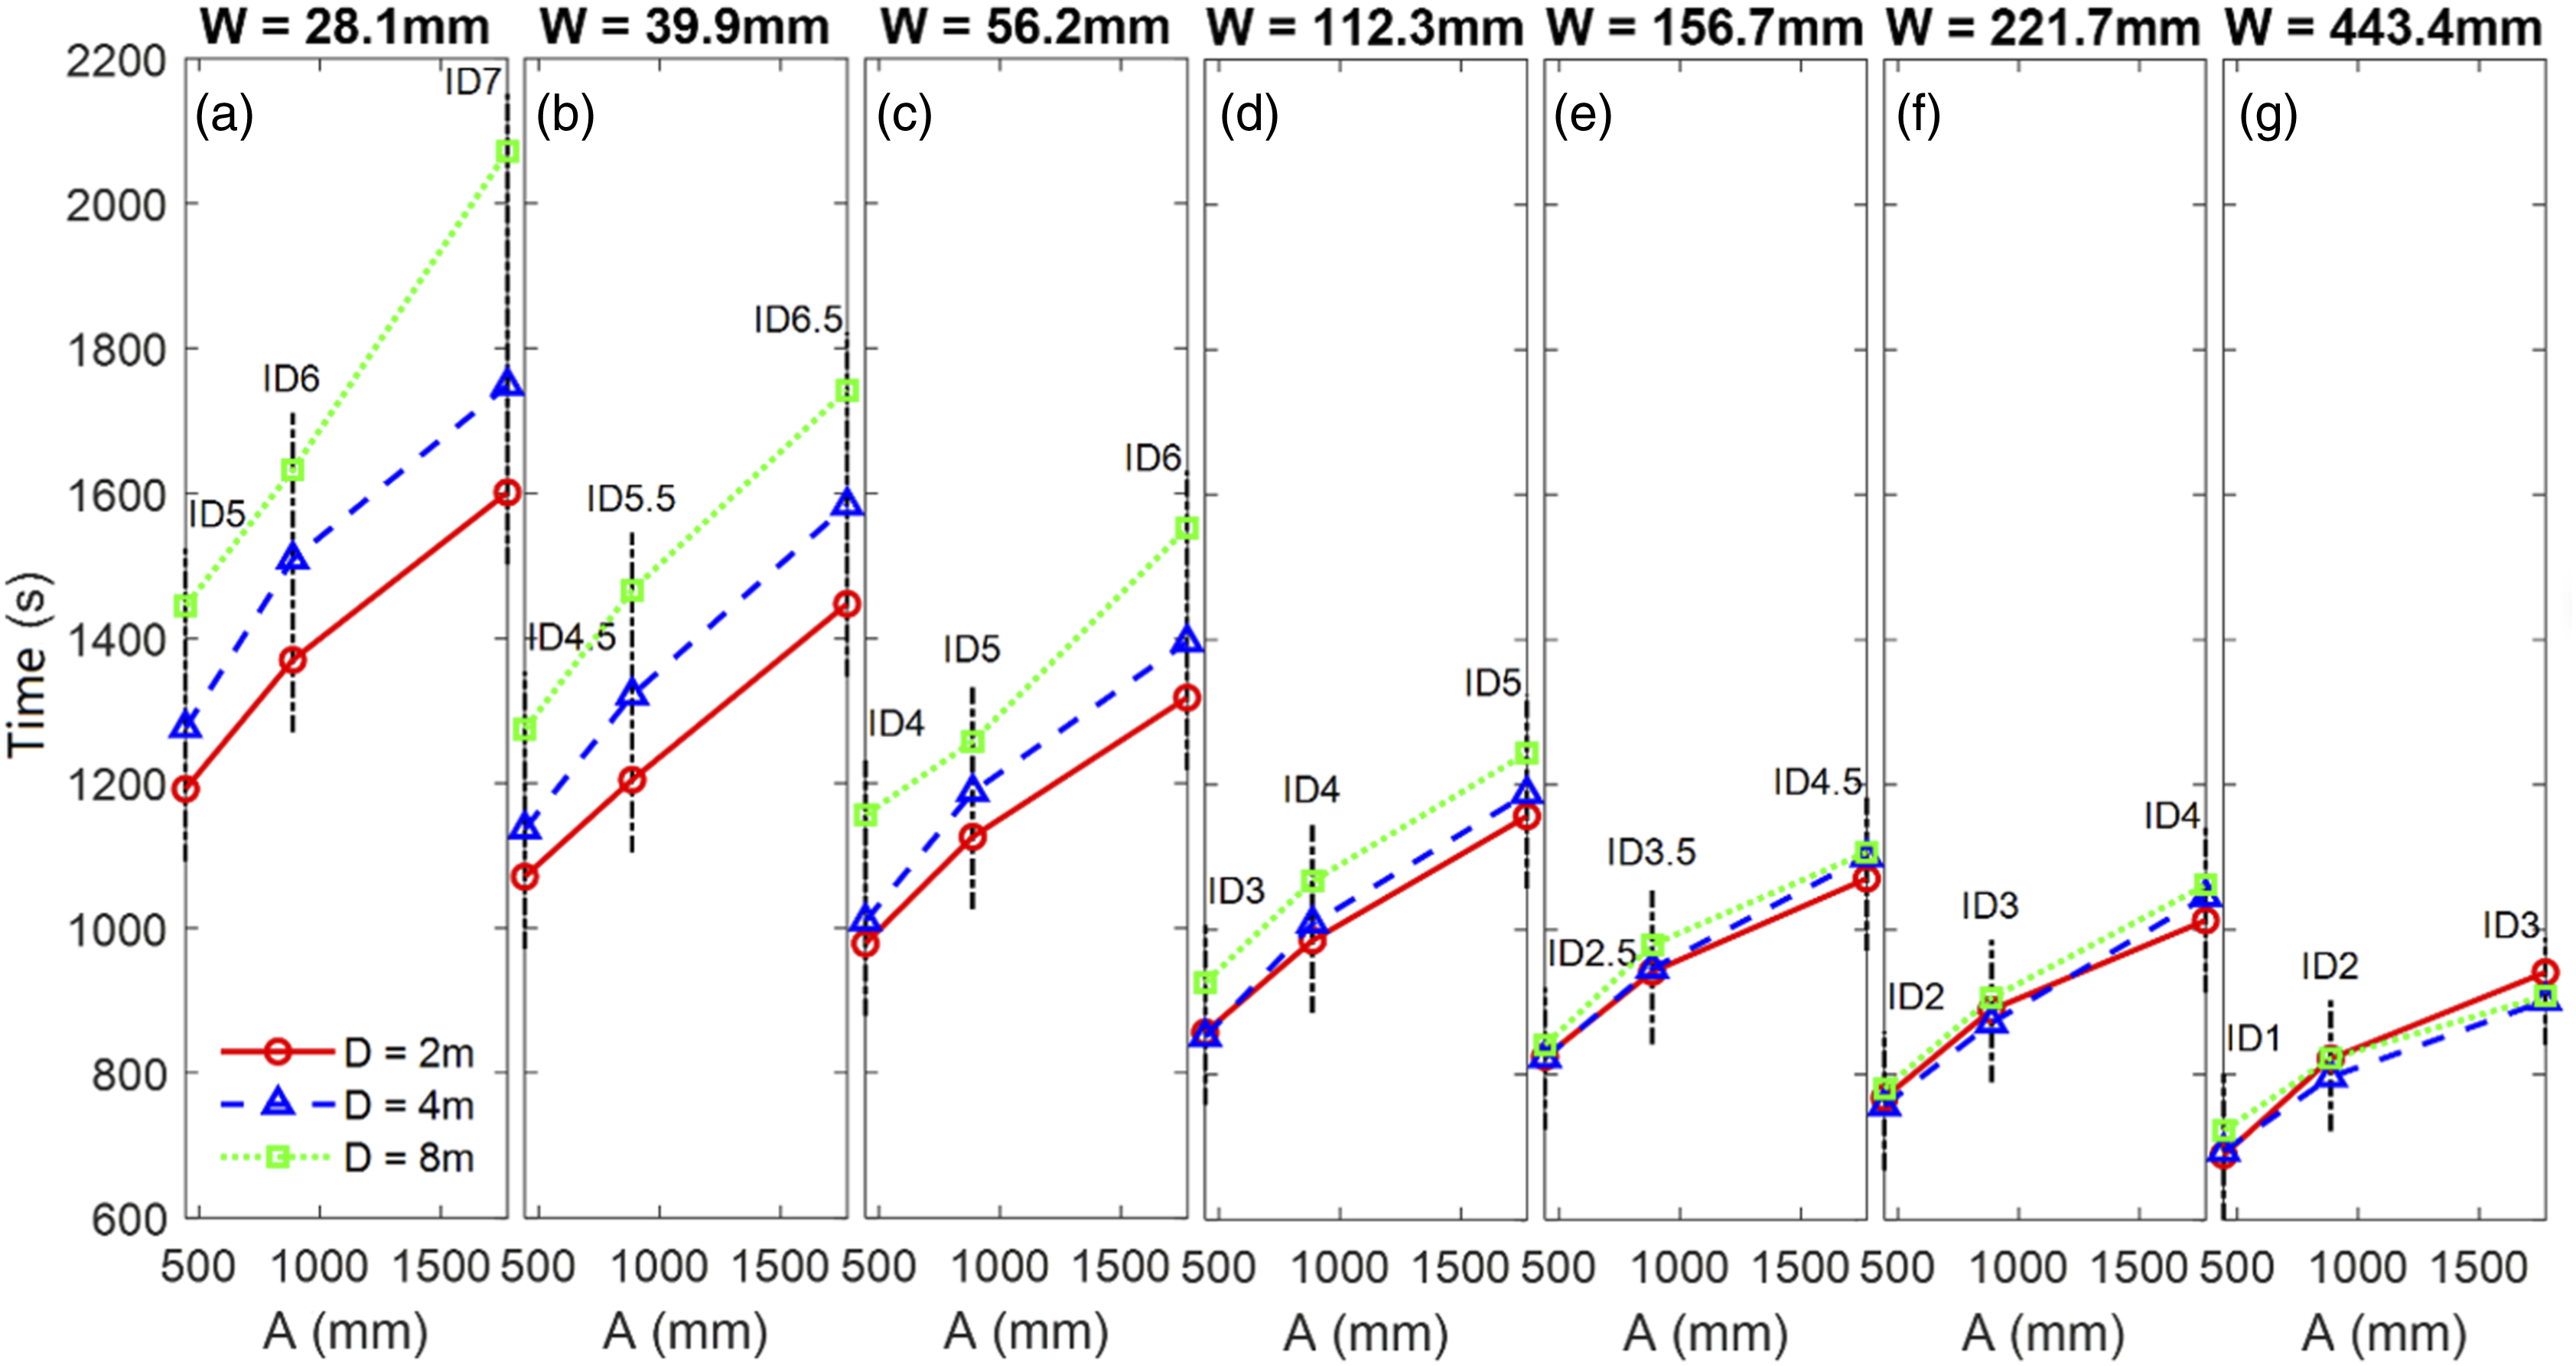
Regression Models
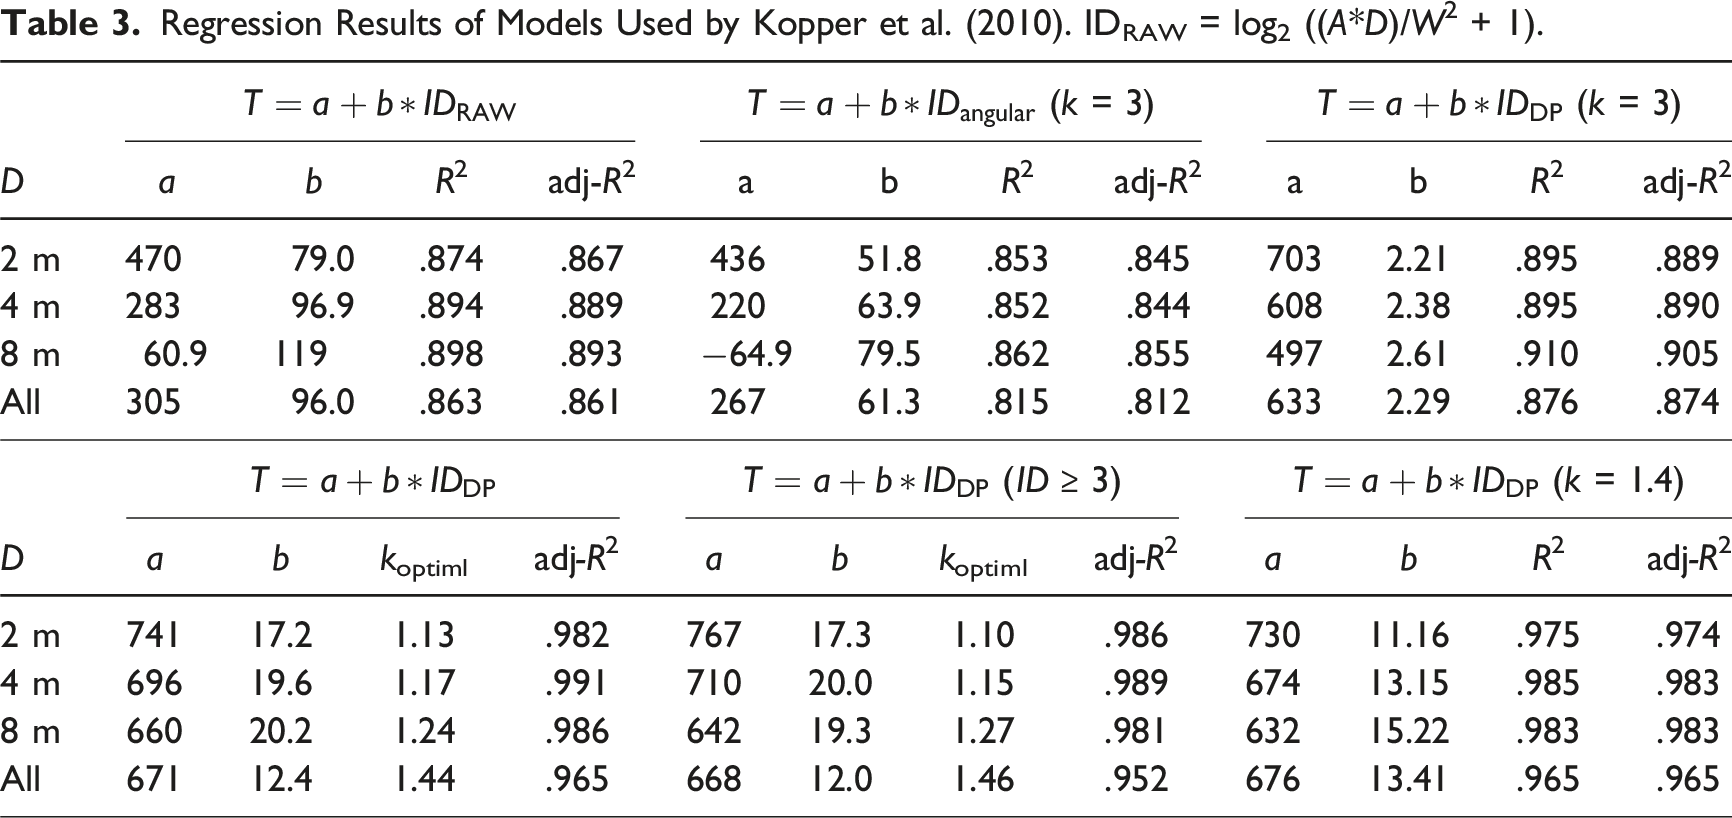
Model parameters and the related regression coefficients for movement time are shown in Figure 6 and Tables 1, 2, and 3. The fitted models using error rates, incorporating the “peg-hole” analogy to account for limb instability are in the Appendix. (Soukoreff & MacKenzie, 2004). The slope of the fitted line of movement time versus ID increases with increasing depth (Figure 6). Table 1 shows the results of one-part models (Fitts’ law, Shannon–Fitts variation), and Table 2 shows the results of the two-part models (Welford and Shannon–Welford models). Table 3 shows the equivalent models proposed by Kopper et al. (2010). Considering Gan and Hoffmann’s (1988) proposal that Fitts’ law is not appropriate for small-ID movements (ID < 3), Tables 1 and 2 provide the results for all IDs and movements with ID ≥ 3. The reason for this split is that continuous visual feedback is not necessary when performing low-ID aiming movements. For a certain depth, Fitts’ law explained a larger percentage of data variance in the visually controlled region (i.e., ID ≥ 3) than over all ID. However, this improvement was not visible when all depths were included. This alludes to the fact that Fitts’ law may not be applicable when combining tasks of different depths. The Welford model results are similar to those of Fitt’s law (Table 2). The Shannon–Fitts and Shannon–Welford model were proposed to account for all IDs and hence it is clear from the results that there is hardly any difference whether all data are used or only ID ≥ 3 are used. Time versus ID plot for three depths and the corresponding fitted lines for ID = Regression Coefficients of One-Part Models and Their Angular Versions. Regression Coefficients of Two-Part Models and their Angular Versions. Regression Results of Models Used by Kopper et al. (2010). IDRAW = log2 ((A*D)/W2 + 1).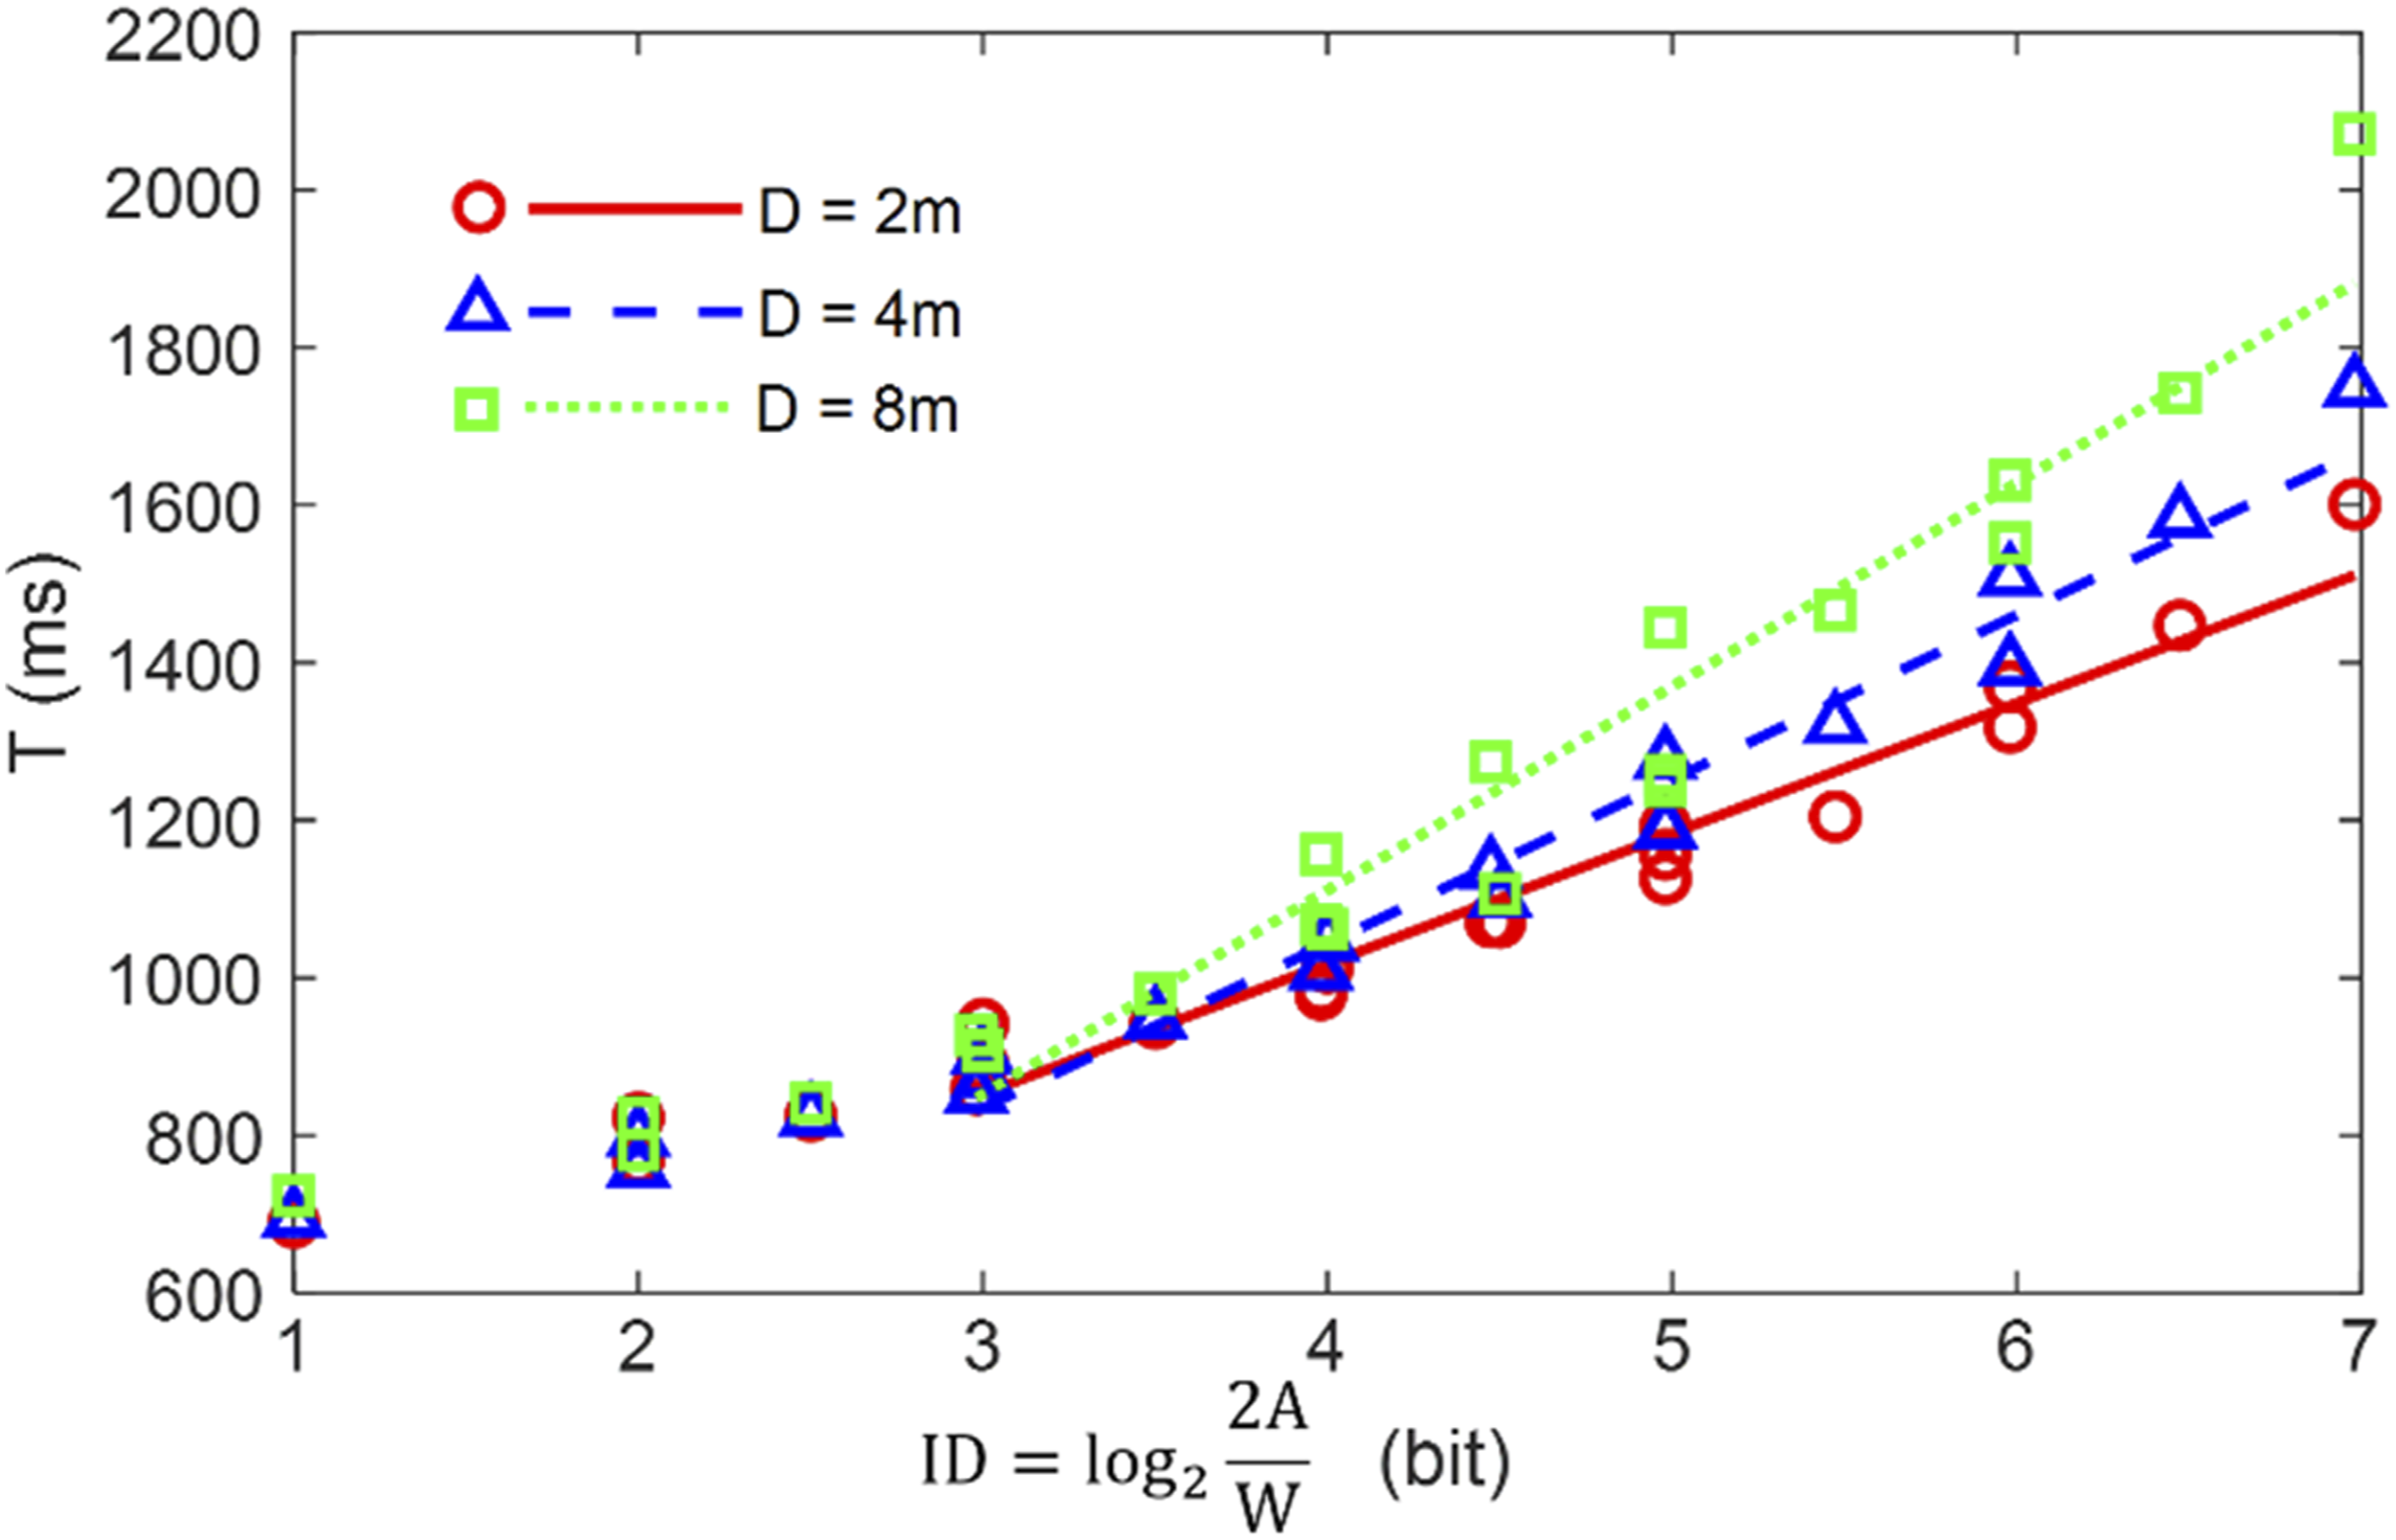
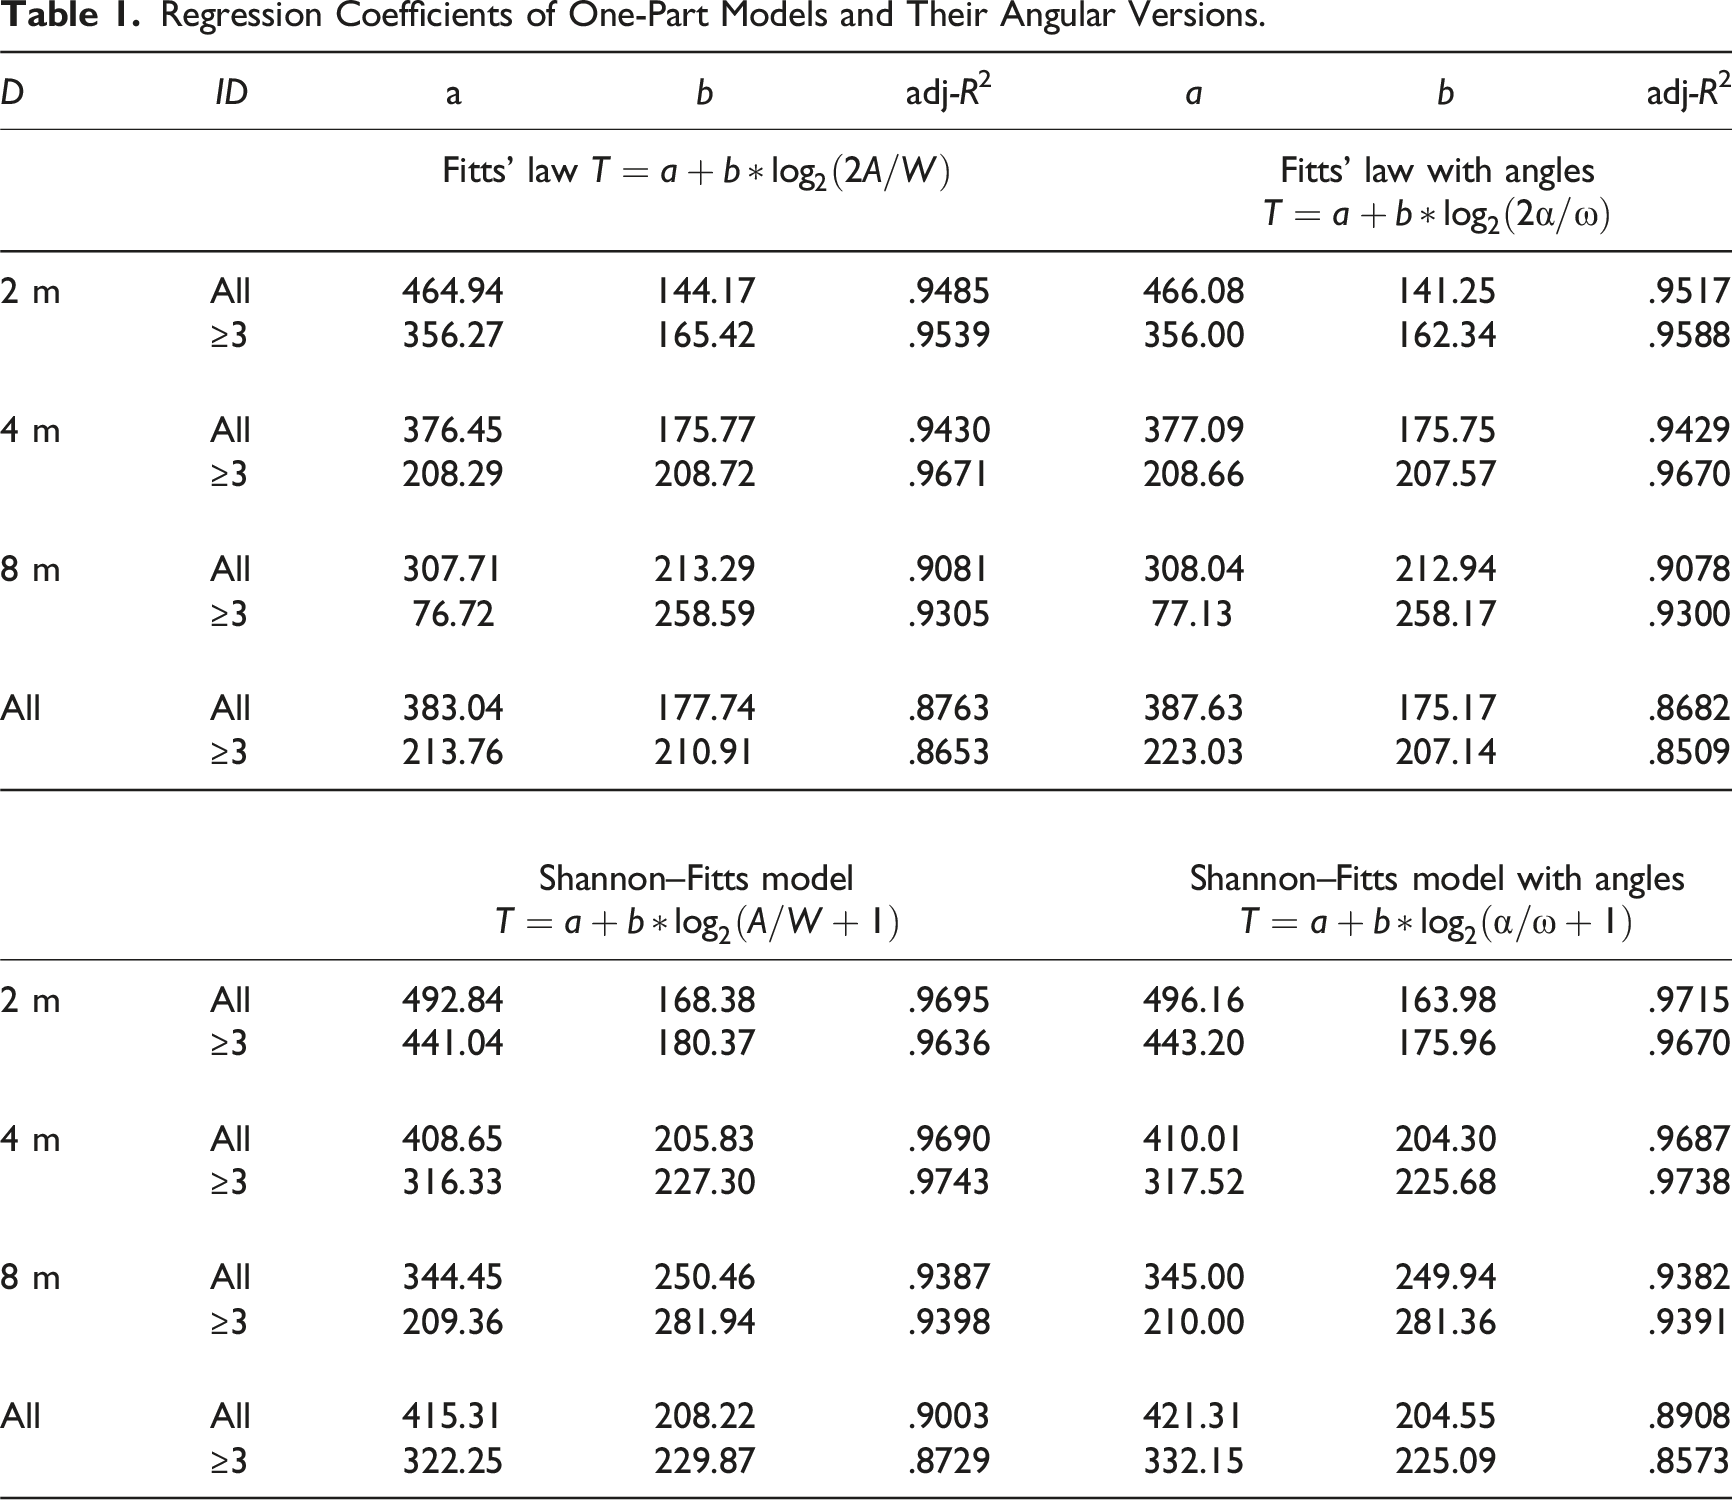
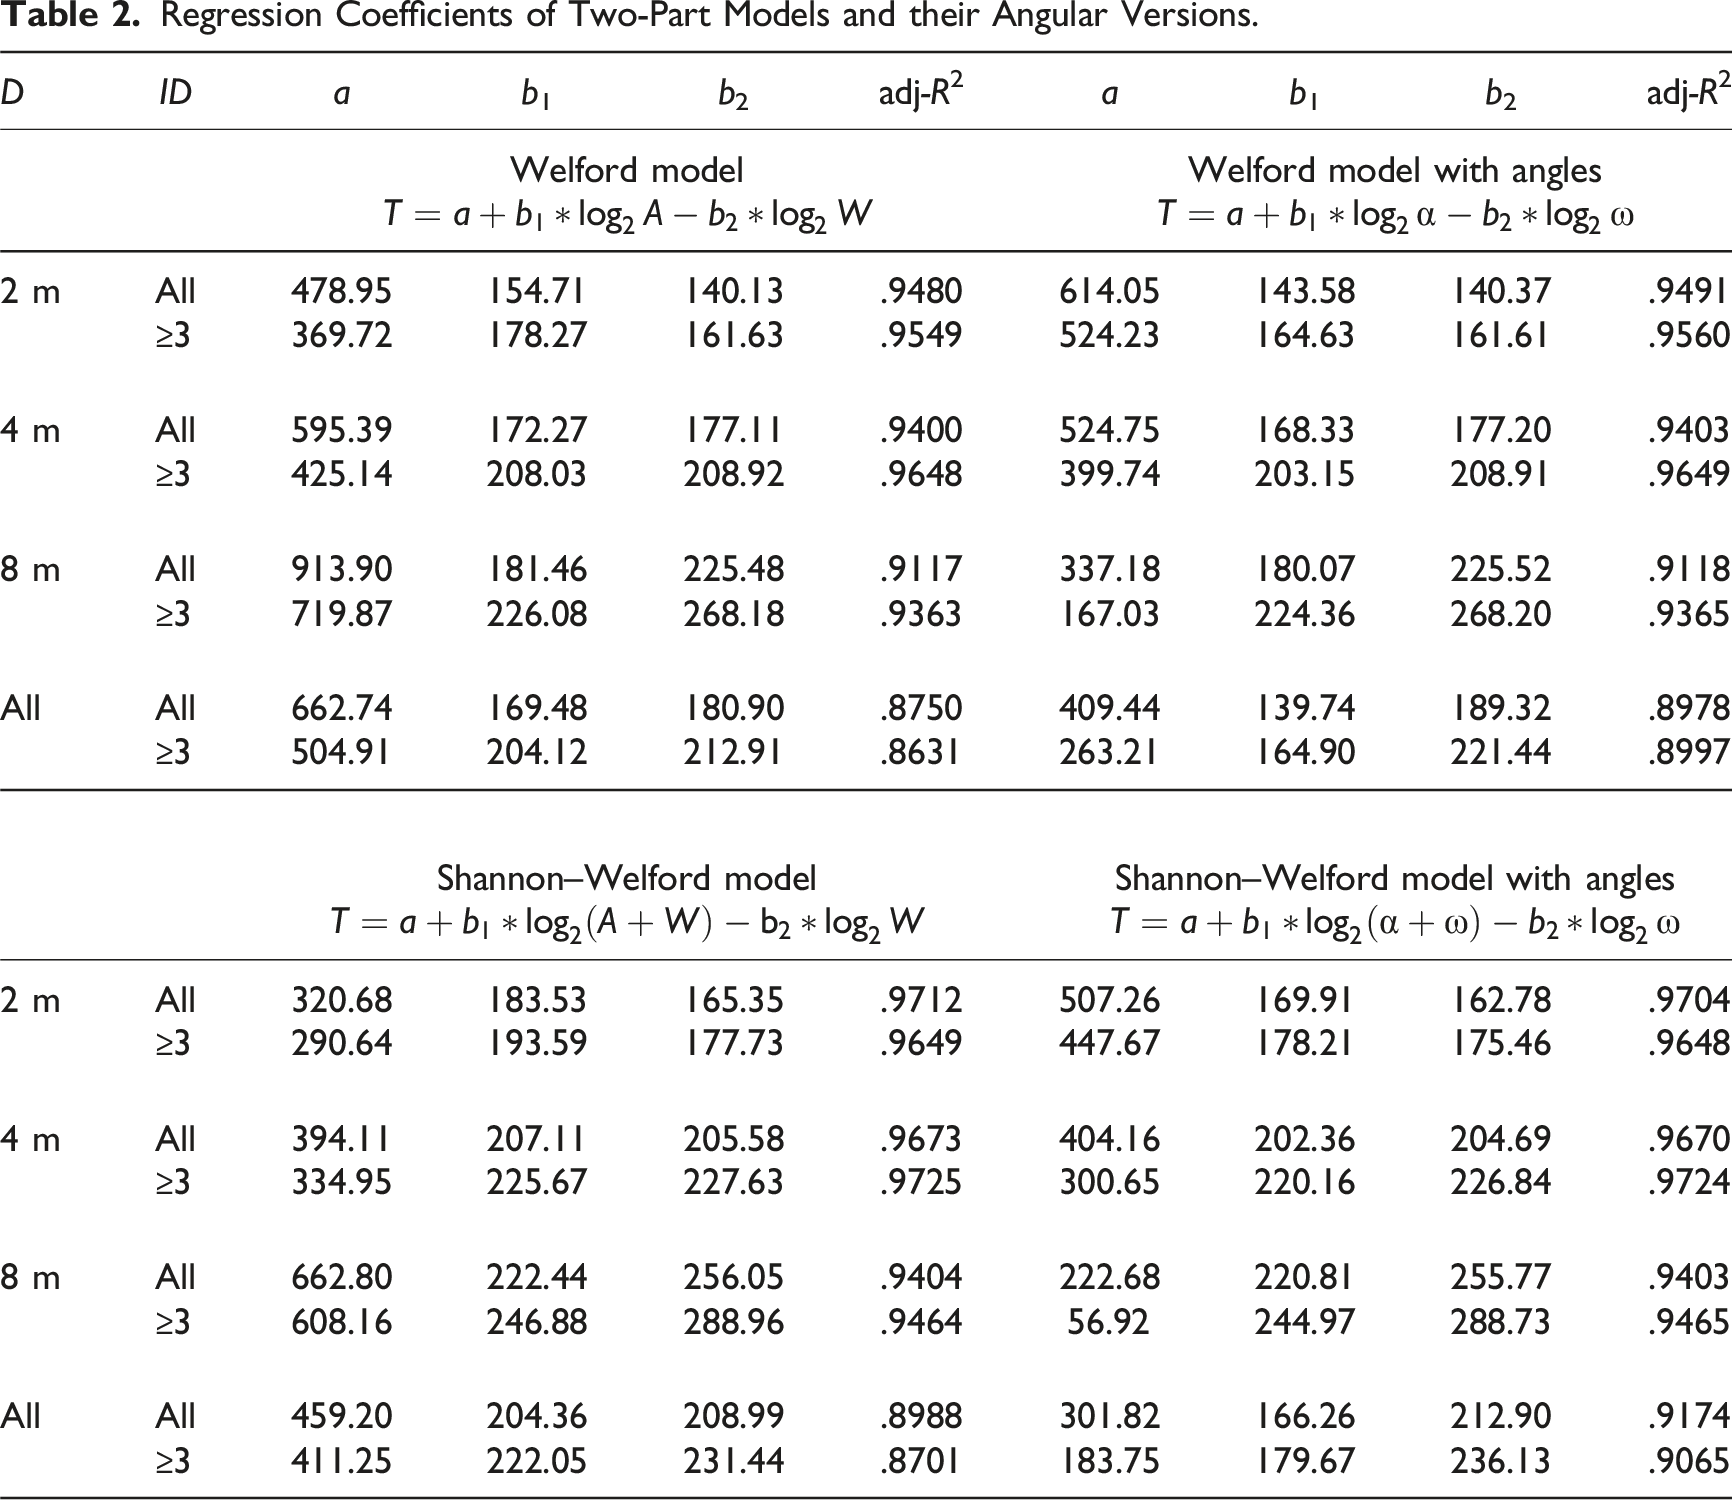
For all IDs, the adj-R2 values reduce with increasing D for all models. This finding is similar to Kopper et al. (2010). In addition, for the one-part models, the angular variables have smaller R2 values for all depths (Table 1), but the replacement with α and ω increases explained variances in two-part models (Table 2).
The suitability of the Kopper et al. (2010) model was evaluated with varying values of k using a number of iterations (Table 3). The results showed that the optimal k is in the range 1.1 to 1.46 for the different depths even in the visually controlled region (ID ≥ 3). In general, k = 1.4 (to one decimal) achieves the best fit for all depth conditions (Table 3).
The F-test Results for One-Part and Two-Part Models for all IDs.
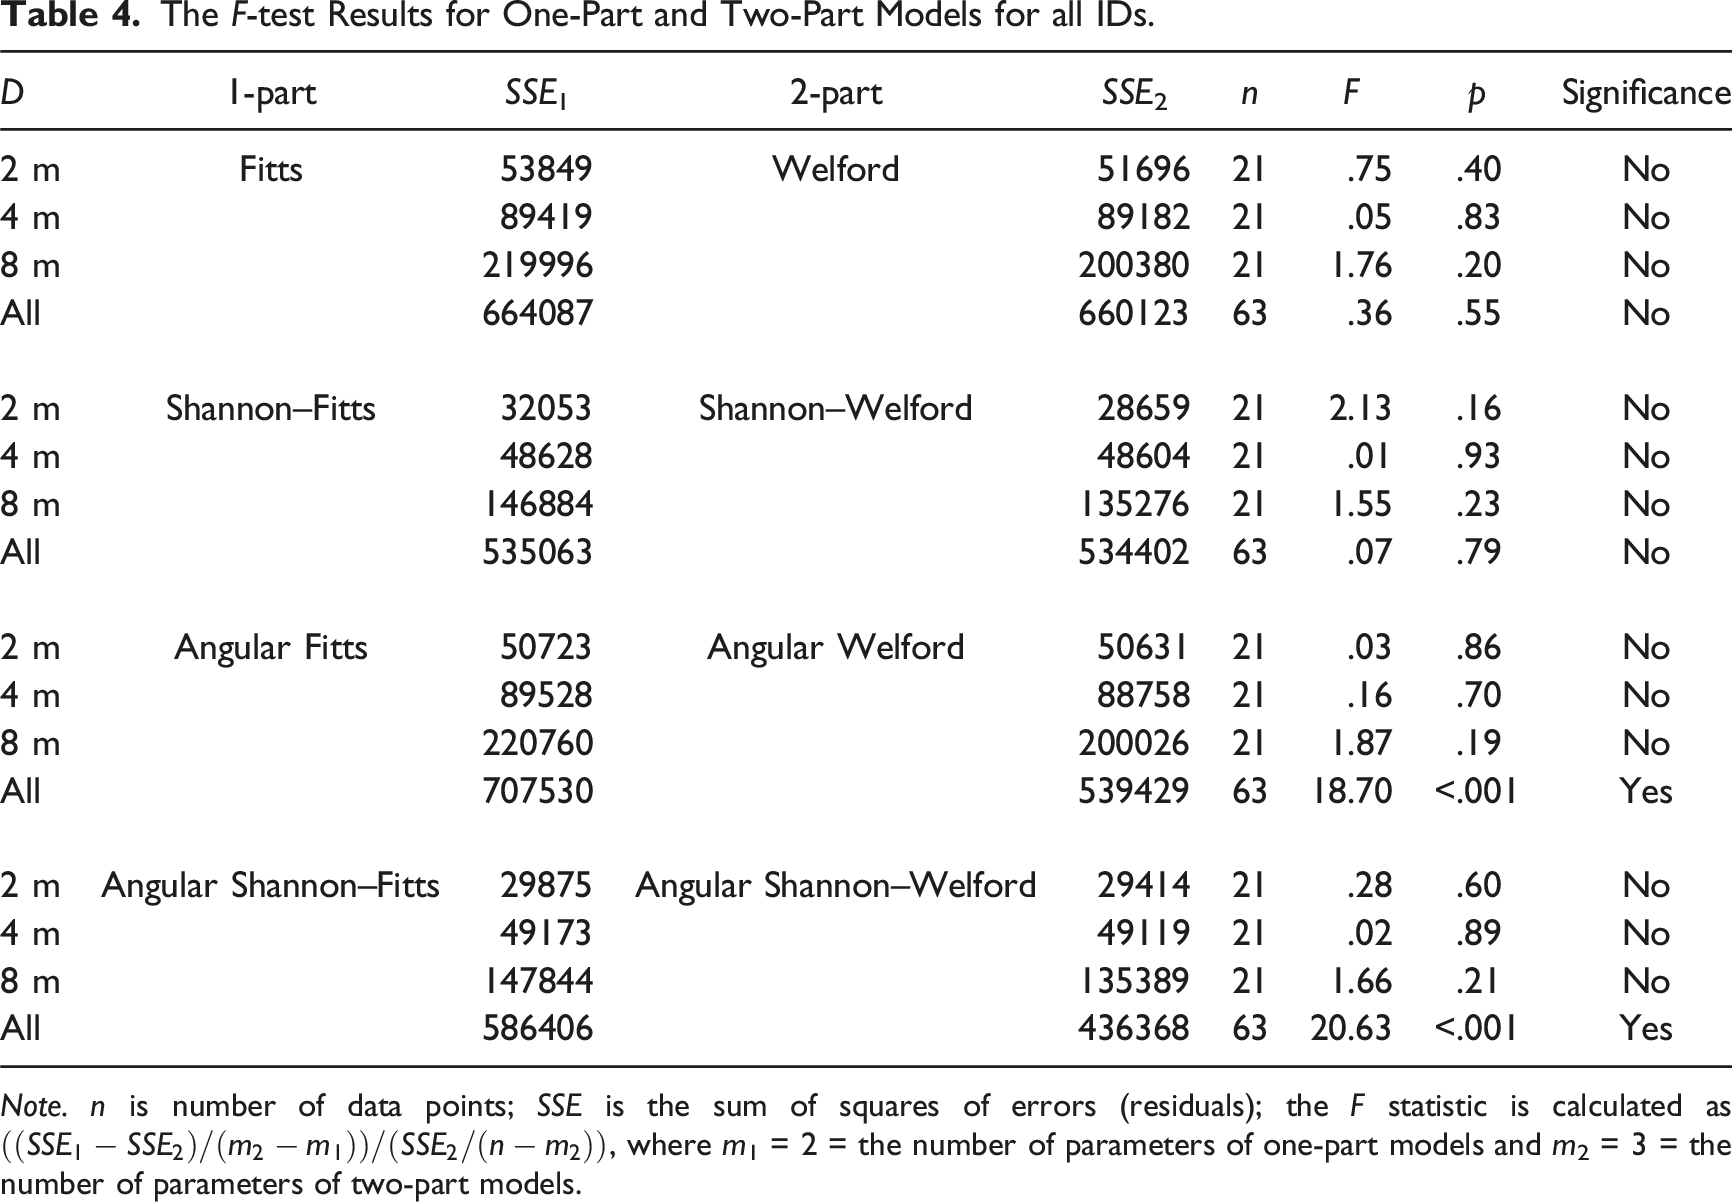
Note. n is number of data points; SSE is the sum of squares of errors (residuals); the F statistic is calculated as
Discussion
Based on the results and analysis, the related models were evaluated.
The Effect of Depth on a Distal Pointing Task
The data from two related studies that studied depth were used as a comparison (Janzen et al., 2016; Kopper et al., 2010). Kopper et al.’s (2010) studies used depths of 1, 2, and 3 m depths and Janzen et al. used similar depths of 1.1, 2.2, and 3.3 m. In our study we went up to 8 m (2, 4, and 8 m). For comparison purposes, only the depth of 2 m (or 2.2 m) was used. The results are plotted in Figure 7 and it turns out that although the depths are all near 2 m, the slopes and intercepts of the three groups of data are different from each other. MT is highest in Kopper et al.’s (2010) study, whereas it is lowest in this study. Kopper et al. used circular targets while the other two studies had rectangular targets. The target shape could be a reason for the difference because rectangular targets have lower movement time when compared to circular targets (Sheikh & Hoffmann, 1994). Movement time versus of three studies when depth = 2m (2.2 m for data from Janzen et al., 2016). ID = 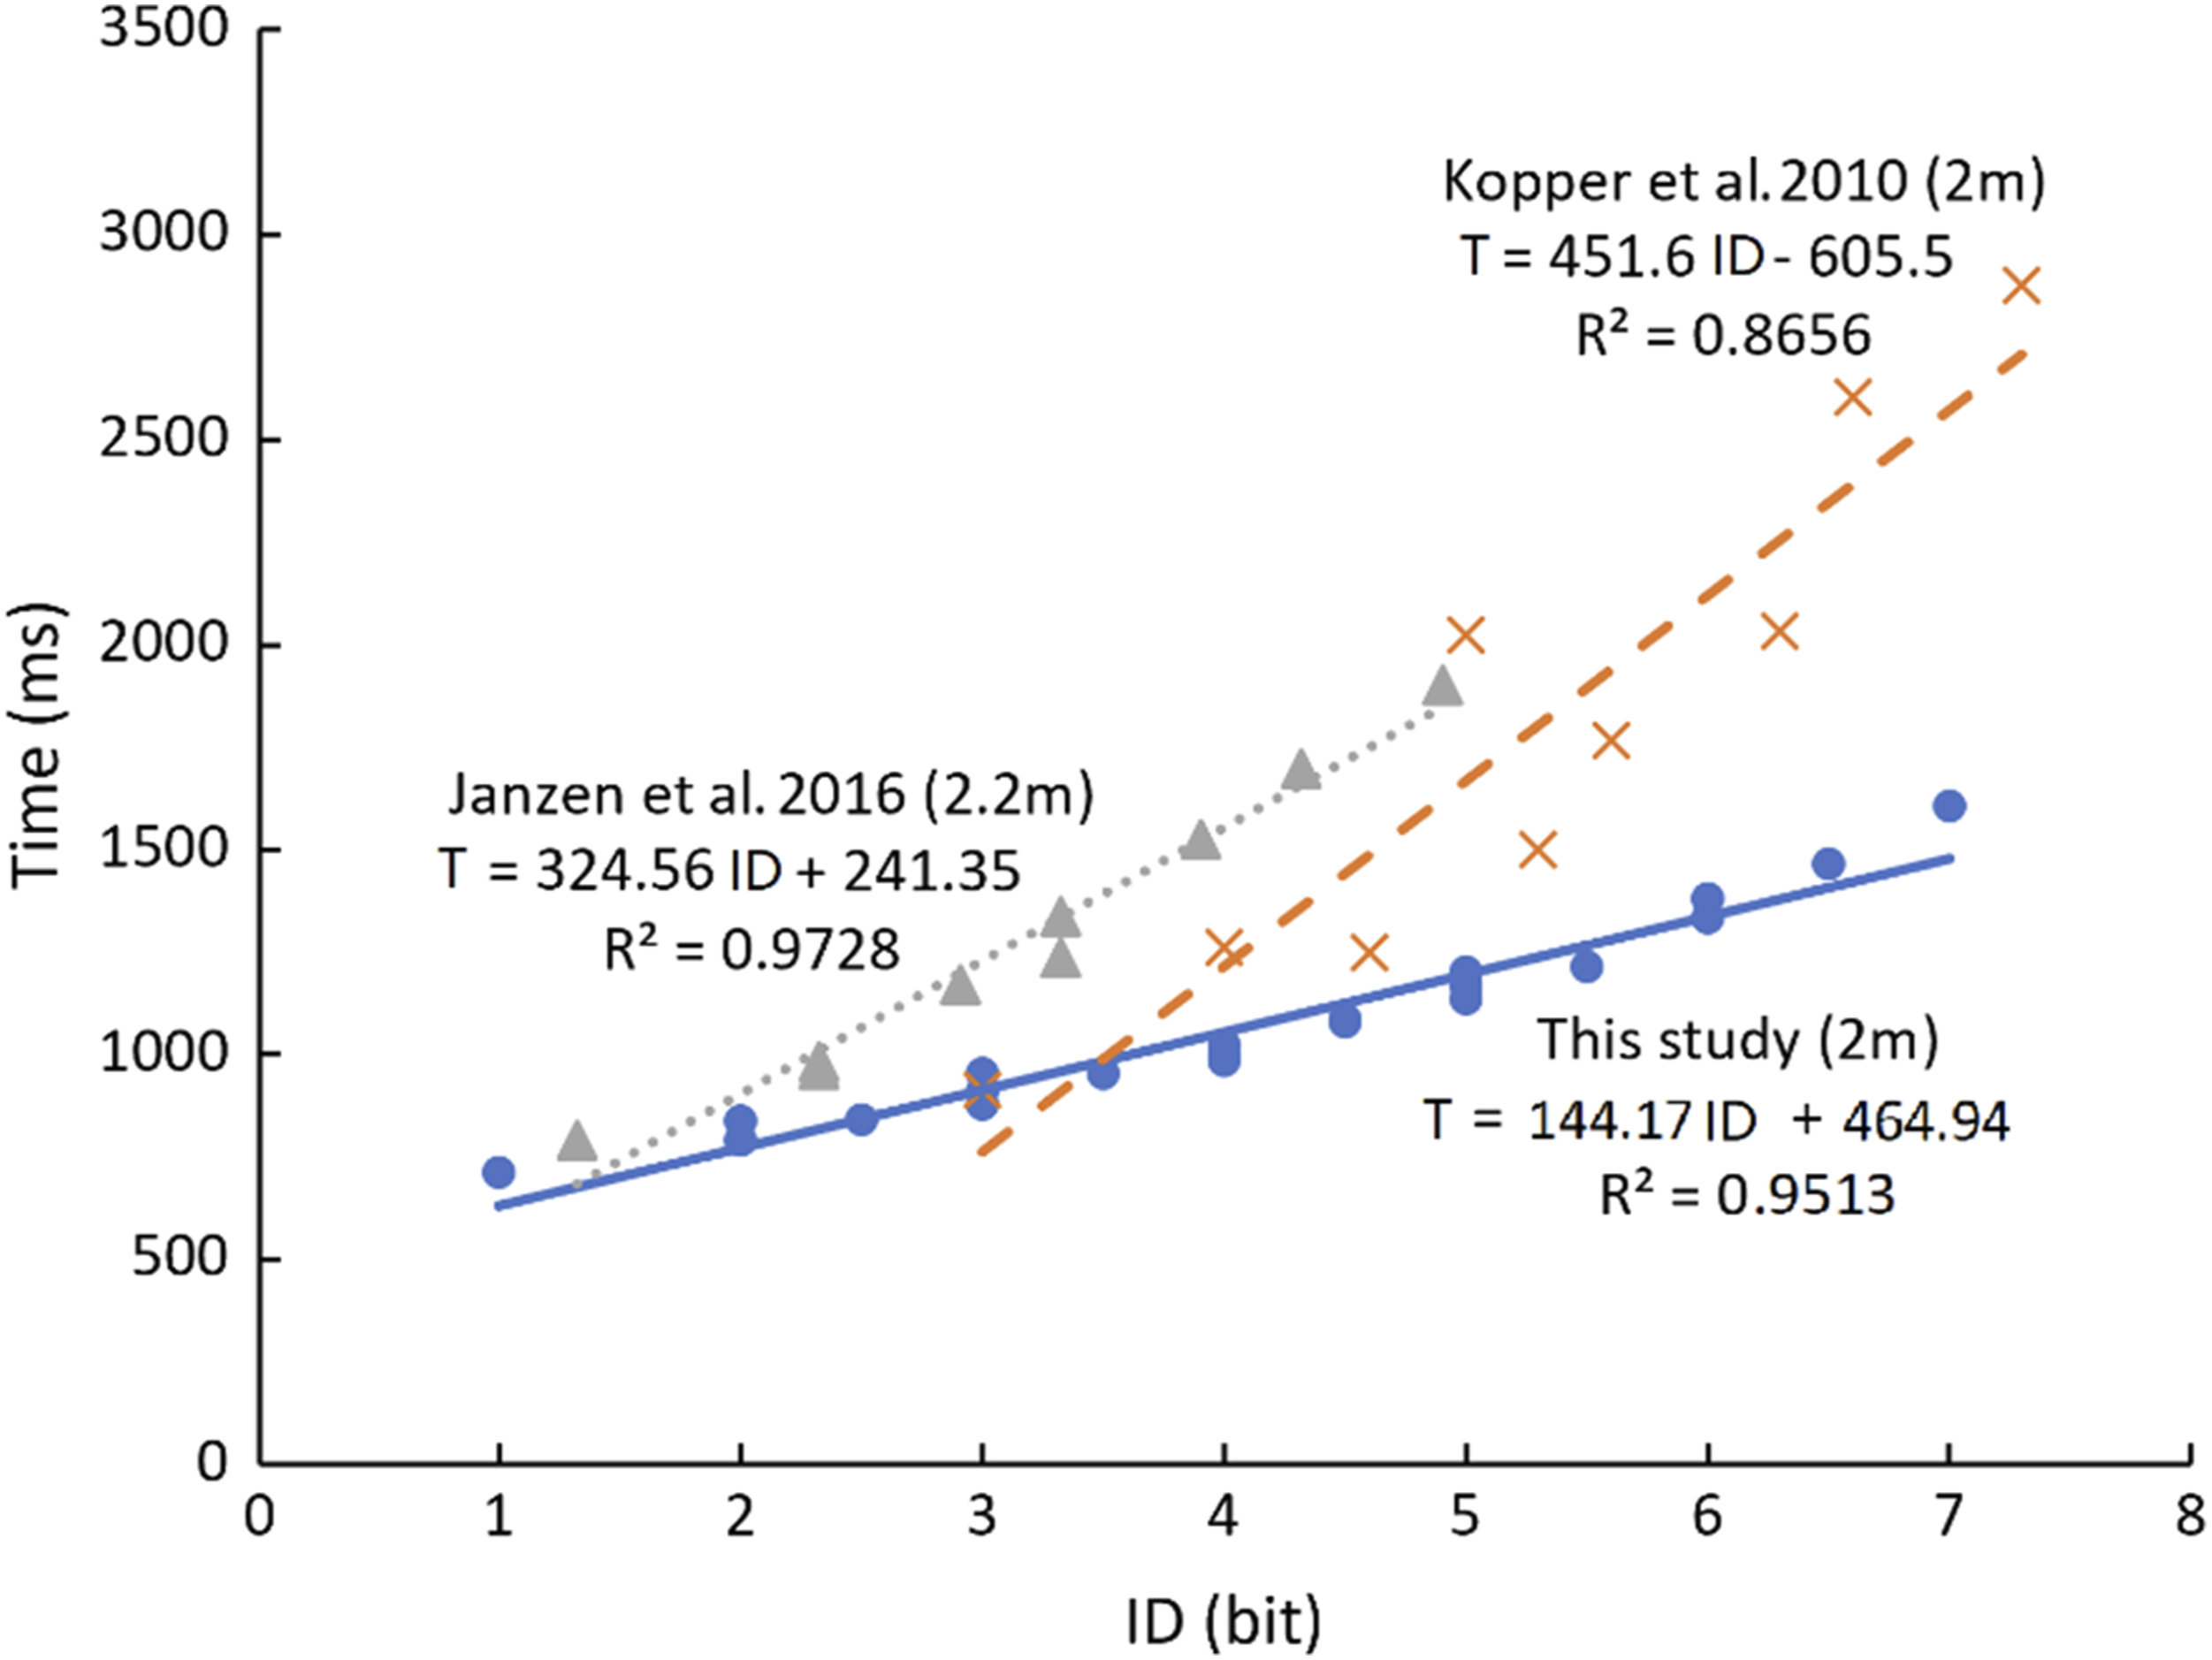
Another reason could be that participants were required to move a laser pen with their elbow locked and the wrist in a fixed position (Figure 2(d)). In this posture, the shoulder joint motion controls the activity, similar to an inexperienced pistol shooter to reduce the hand fluctuations in goal-directed aiming tasks (Ko et al., 2017). Also, previous research has shown that such a posture has high limb stiffness in the direction perpendicular to the movement track resulting in higher movement accuracy (Selen et al., 2006a; 2006b; Wong et al., 2009). In the two prior studies, posture was not controlled, the arm was not straight and thus the arm stiffness was not as high resulting in lower control accuracy, longer aiming time and larger movement time. Even the slope at a depth of 8 m (213.29) is much smaller than the slope of Janzen et al.’s 2 m data (324.56). Hence, it is important to adopt a high-stiffness arm posture to reduce movement time in aimed movement tasks at high depths.
Fitts’ law correction using effective widths (We) was assessed. The fitting was poorer for 2 m, 4 m, and all depths compared to the nominal width (Table 1 and Appendix). The slopes are steeper, but the fit is not as good. Even Shoemaker et al. (2012) and Janzen et al. (2016) have shown that the Fitts’ formulation is less successful with We.
Comparison of One-Part and Two-Part Models
The statistical analysis of the fit of one-part and two-part models showed small differences in the adjusted R2. The regression result of all D of two-part models had a slightly lower (<0.3%) fit than the one-part models in the translational versions. However, the angular versions are about 3% better than the one-part models for all ID and this proved to be significant (Table 4). The improvement is up to around 5% for ID > 3. The significant differences in this study are far lower than those in Janzen et al. (2016) work probably due to the larger depth of 8 m used in our study.
Comparison of Angular and Translational Models
The regression results in Tables 1 and 2 validated that for a known depth, the difference between a translational version and an angular version of Fitts’ law is negligible, as the maximum difference among all pairs in R2 was only 0.3%. For the one-part models, the angular version was worse than the translational version (even though the difference was less than 1%). Interestingly, for the two-part models, the angular version accounts for more variance of approximately 2%.
However, the F-test of residuals of the translational version and the corresponding angular version model indicated no significant difference. This is probably due to the correlation between A and α (0.67), and W and ω (0.80) because no elbow movement was allowed and the only movement was at the shoulder (Kondraske, 1994). Actions with all joint movements may reduce such a correlation and could change the effectiveness of the two types of models.
Kopper et al. Model
With k = 3, the Kopper et al. (2010) models have a poor fit when compared with Fitts’ original equation (1) (Table 3) and somewhat in agreement with Janzen et al. (2016) who found R2 < 0.7 with those models. The results show,
The optimal value of “k” is within a fairly narrow range of 1.13 to 1.44. This stands in contrast to Janzen’s study, where our findings indicate that the optimum “k” value in IDDP leads to the most accurate fit among all models. Remarkably, these “k” values work well within the whole range of “ID” values, encompassing both ballistic and visually controlled regions.
The findings indicate a trend where, as the depth increases, the optimal “k” value also tends to increase. Considering
Modeling Visually Controlled Movements
Visually controlled movements are characterized by ID > 3 (Gan & Hoffmann, 1988; Hoffmann, 2016; Lin & Drury, 2013). The fit of the different formulations is improved for ID > 3 justifying the need for a different formulation for ballistic movement as suggested by Lin and Drury (2013). However, the improvement is not seen when the data comprises all depths. This alludes to the fact that Fitts’ law may have issues at multiple depths. The corresponding two-part models showed similar results. On the contrary, the Shannon–Fitts and Shannon–Welford models are not as sensitive to the ballistic and visually controlled transition and hence there seems to be no such pattern. The similarity of the k value in the Kopper et al. model, for both ballistic and visually controlled regions, can be attributed to the +1 in the IDDP equation as in the Shannon–Fitts model.
Implications of the Study and Future Research
This research provides performance assessments and predictions for distal pointing situations, like anti-UAV training, presentation with laser pointers aimed at a large screen and so on. However, the study is not without its limitations. These are that the distance is fixed in each block, and participants do familiarize themselves with the different depths after several trials. Hence, time-varying depth is a potentially interesting area of investigation.
Conclusion
This research focused on a maximum depth of 8sm to investigate the human performance with changing depth in large-scale distal pointing tasks. It was seen that this depth had a significant effect when the target width was small. With distal aimed movements, the movement amplitude-related angle and the target width angle do account for the depth. Hence, an angular version of two-part models provides a better fit than the translational forms of Fitts’ law, especially at higher depths. The
Footnotes
Key Points
Long-distance pointing movements are quite different from paper or computer-based aimed movement experiments. Depth has a significant effect on aimed movement when the target width is small. The angular version of the two-part model is superior to the one-part Fitts’ model for larger distances. The
Acknowledgments
The corresponding author would like to thank the support of the Healthcare Engineering Innovation Center of Khalifa University.
Appendix
When using effective target widths as a correction to Fitts’ law, the corresponding equations are:
Depth = 2 m,
Depth = 4 m,
Depth = 8 m,
All depths,
Author Biographies
Yuqian Wang is a postdoc fellow in the Laboratory for Artificial Intelligence in Design (AiDLab), a research operation established by The Hong Kong Polytechnic University (PolyU). She received her PhD degree from the Department of Industrial Engineering and Decision Analytics at the Hong Kong University of Science and Technology in 2021. Her interests are in ergonomics and human–computer interaction.
Ravindra S. Goonetilleke is a professor in the Department of Management Science and Engineering at Khalifa University. He received his PhD in industrial engineering from the State University of New York at Buffalo in 1990. His research interests are sports ergonomics and human–computer interaction.
Ray F. Lin is an associate professor in the Department of Industrial Engineering and Management at Yuan Ze University in Taiwan. He received his PhD in industrial and system engineering from the University at Buffalo, the State University of New York. His research interests include hand control movement modeling, intelligent human–computer interaction, and computer-aided diagnosis.