
Abstract
Objective
This work aims to estimate the portion of electric vehicle (EV) users who exhibit procrastination-like behavior, almost equivalent to an “empty” battery, before they decide to charge their vehicles.
Background
There is a human tendency to procrastinate when a deadline approaches. Human behavior in the presence of deadlines has been studied in different fields to evaluate individuals’ performance or organizational efficiency and effectiveness. However, this phenomenon has not been investigated among EV users.
Method
This study explores users’ procrastination-like behavior among 69 Rhode Island public charging stations’ data representing 70,611 charging events. The Deadline Rush Model is incorporated to model frequent users’ charging profiles. To conduct a robust estimation, the Bayesian Mixture Model is implemented.
Results
With the selection of an informative prior, the Bayesian Mixture Model estimated that almost one-third of frequent users procrastinate charging.
Conclusion
The majority of procrastination-like users have small battery sizes. Although procrastination-like users need to charge when they arrive at a location, that might not necessarily be true for a plug-in hybrid; thus, systematically, they can clog the system for other users whose needs are more pressing. Understanding unique and unexplored charging behaviors among EV users is beneficial to EV infrastructure stakeholders in reducing the adoption threshold by providing a reliable and ubiquitous charging network.
Application
The findings identify a different kind of demand on the EV infrastructure than previously modeled and can directly influence future decision-making criteria in terms of planning to optimize to accommodate EV drivers with different charging behaviors.
Introduction
To understand the effect of existing electric vehicle (EV) infrastructure on users’ EV adoption, it is vital to acknowledge the existence of distinct users’ charging behaviors (Hardman et al., 2018; Tal et al., 2014; Wang et al., 2021). The access to charging stations differs between users and leads them to form distinct charging usage and behavioral patterns. Therefore, investigating a particular charging behavior provides insights into how users manage their range mobility and charging needs (Philipsen et al., 2018). This approach is beneficial to many parties associated with EV infrastructure (i.e., the utility providers, network operators, policymakers, and infrastructure developers) as they work to reduce the EV adoption threshold by providing a reliable and ubiquitous charging network and a stable power grid (Hu et al., 2019). Thus far, the prominent known charging behavior is range anxiety—the fear of running empty—due to the insufficient number of charging stations and EV driving ranges (Bonges & Lusk, 2016; Chen et al., 2020; Pevec et al., 2020; Philipsen et al., 2018; Rauh et al., 2014; Xu et al., 2020; Yuan et al., 2018). In the past decade, policies and incentives have been established to provide funding to facilitate transportation e-mobility, which resulted in significant improvements in battery sizes and chargers’ deployment to support greater range mobility and more immediate charging needs of EV drivers (IEA, 2022; Venegas et al., 2021). These improvements have reduced the impact of range anxiety on users, but other unique charging behaviors have emerged (Khaleghikarahrodi & Macht, 2023b; Neubauer & Wood, 2014).
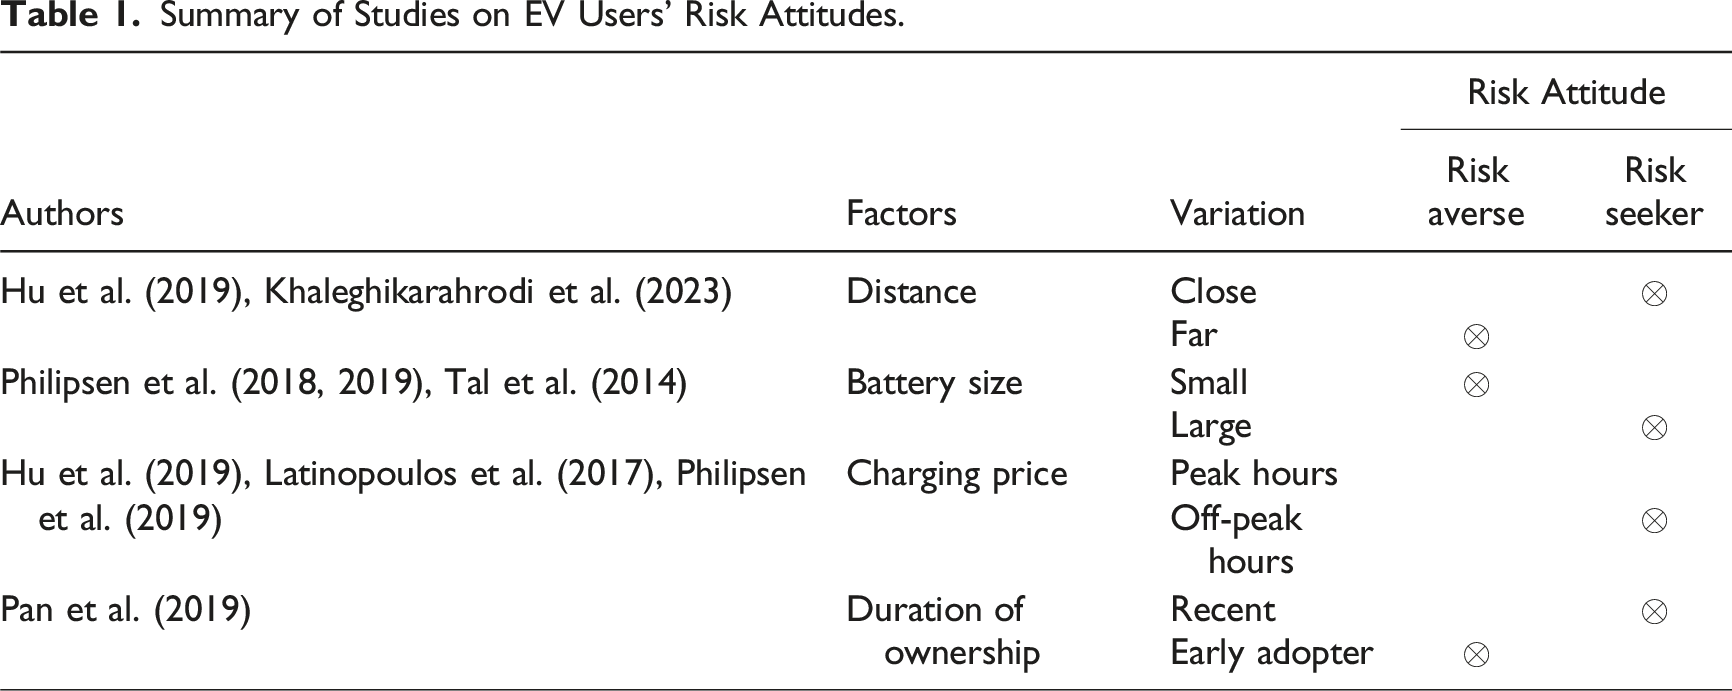
Comprehensive models for users’ charging actions, driven by real data, are needed to explain unique behaviors. Scholars have conducted data-driven and survey studies to explore users’ charging behaviors. The previous studies have addressed users’ charging behaviors as identical and solely being impacted by range anxiety. Survey studies have introduced the risk attitude of range anxious users as risk-averse (Hu et al., 2019; Latinopoulos et al., 2017; Pan et al., 2019; Philipsen et al., 2018, 2019; Wang et al., 2021; Yang et al., 2016). However, when engaging with the research exploring factors affecting risk-averse charging actions, the existence of another risk attitude leading to a unique behavior is insinuated. This unique behavior has emerged from risk-seeking users who delay their charging (Hu et al., 2019; Latinopoulos et al., 2017; Pan et al., 2019; Philipsen et al., 2018, 2019; Wang et al., 2021; Yang et al., 2016). Throughout a data-driven analysis, Khaleghikarahrodi & Macht (2023b) detected that approximately 30% of EV users delay charging until their battery is almost empty. Hence, procrastination is a potential behavior viable for investigation through empirical modeling.
There is a human tendency to procrastinate or perform the majority of progress when a deadline approaches. Human behavior in the presence of deadlines is a common subject of study in different settings such as in the workplace (Cormack et al., 2020; Prem et al., 2018), school (Kim & Nembhard, 2017; Sun & Kim, 2022a, 2022b), and decision making (Kim et al., 2016; Kim & Nembhard, 2017) to evaluate individuals’ performance or organizational efficiency and effectiveness. In 2005, Konig and Kleinmann introduced the Deadline Rush Model (DRM) to quantify individuals’ procrastination computationally. However, this phenomenon has not been explored among EV users. In this study, the authors aim to apply the DRM to charging profiles of EV users to estimate the proportion of users that wait until a critically low state of charge before deciding to charge their vehicle. If a significant number of EV users procrastinate to charge, meaning they wait until their battery is nearly zero, this causes a special kind of demand on the EV charging infrastructure. The results of this study directly influence future decision-making criteria in terms of planning to best accommodate users with this unique charging approach.
Background
Previous scholars have introduced risk attitude as an impactful predictor of users’ charging behaviors (Hu et al., 2019; Latinopoulos et al., 2017; Pan et al., 2019; Philipsen et al., 2018, 2019; Wang et al., 2021; Yang et al., 2016). Their studies have focused heavily on EV users who experience range anxiety and tend to be risk averse. The users in this category are more cautious with their distance traveled and charging needs. Risk-averse EV users prioritize having excess range over chargers’ cost and location, which causes them to perform more charging activities (Pan et al., 2019; Wang et al., 2021). In comparison to cautious users, some users charge only when needed. This class of users initiates their trip if the remaining range is enough for their next trip. For this reason, their charging activities occur when the battery warning lights come on or when their battery level runs closer to or near zero (Hu et al., 2019; Philipsen et al., 2018). Wang et al. (2021) refer to these users as adventurous users who are more receptive to unexpected and riskier situations.
Pan et al. (2019) surveyed 160 EV drivers to capture the underlying factors that explain users’ charging behaviors based on their risk attitude. Their study found that respondents who owned their EVs for a year or less are tend to be risk-seeking. On the contrary, risk-averse respondents owned their EVs for more than a year. It can be assumed that recent EV buyers are interfacing with a well-established charging infrastructure that can serve them in a risky situation, meaning they will get access to an available charging station before their battery is nearly zero. Other literature does not introduce the risk attitude condition upon the duration of vehicle ownership. Latinopoulos et al. (2017), Philipsen et al. (2018, 2019), and Wang et al. (2021) state that risk-seeking users charge at a lower state of charge (SOC) due to higher familiarity with their battery limits, expertise in using their driving range entirely, and awareness with their route selections. Additionally, risk-seeking users may be located in areas that are densely populated with EV charging stations. Their access to a wide range of charging stations has given them the confidence to charge how they do (Hu et al., 2019).
Besides the users’ accessibility and familiarity elements, the battery capacity and driving range allowance are other factors shaping users’ charging behaviors. Through survey studies, EV owners with smaller batteries and limited driving ranges indicated more refill stops arriving at stations with a higher SOC (Philipsen et al., 2018, 2019). On the flip side, it can be assumed that users who own EVs with larger batteries tend to arrive at a charging station with a critically low battery level. Like risk-seeking users, EV owners with larger batteries have shown a greater likelihood of charging closer to their range limits (Philipsen et al., 2019). Hence, the risk-seeking users’ delay in charging can be justified by owning an EV with a larger battery, which gives them the flexibility to fit more trips with more distance traveled than EV owners with smaller batteries (Tal et al., 2014).
Another determining factor in risk-seeking users’ charging behaviors and choices is the financial aspect of charging (Hu et al., 2019; Latinopoulos et al., 2017; Philipsen et al., 2019). As far as it is understood, risk-seeking users might not charge as often as others, but their charging event is longer than others. Therefore, these users are inclined to arrive at a charging station with a cheaper charging cost. The charging prices depend on the time of the use electricity rate, which is typically more expensive close-and-during peak hours and hits its lowest at off-peak hours (Hu et al., 2019). Therefore, risk-seeking users might be more willing to strain the limits of their battery range to receive a decreased charging price (Latinopoulos et al., 2017). To take advantage of off-peak charging prices, risk-seeking users’ charging activities occur from midnight to early morning (Hu et al., 2019). Arriving at a charging station during off-peak hours implies that the users consumed their battery for at least a day. When the plug-in happens, it is expected for the SOC to be at a lower level rather than a higher level. Thus, risk-seeking users postpone charging until off-peak hours for a decreased price to fully and economically charge their EVs.
Summary of Studies on EV Users’ Risk Attitudes.
Deadline Rush Model
Konig and Kleinmann (2005) refer to the time management phenomenon where there is an increased rate of activity, in terms of performance, when an individual nears completing a deadline as a deadline rush. A reliable, objective measurement—the Deadline Rush Model (DRM)—exists that quantifies procrastination among individuals in different settings (Kim et al., 2016; Konig & Kleinmann, 2005; Sun & Kim, 2022a). DRM offers the exponential function as the mathematical expression, Equation (1), which can identify individuals with procrastination-like behavior. Equation (1) calculates the state of an individual’s productivity (V) at a given time (x), with the parameter A as the original value assigned for completing a specific task. The parameter k denotes the deadline reactivity, which indicates the individual’s level of procrastination; thus, the higher value of k exhibits severe procrastination tendencies for an individual.
Therefore, this study explores procrastination-like behavior among the Rhode Island public EV charging infrastructure users through the DRM. Investigating this behavior through data-driven models and advanced methods will assist in achieving extensive knowledge on this unique behavior, which will further facilitate a user-centric design and deployment of charging infrastructure. To fulfill this goal, this research will explore if the application of DRM appropriately quantifies the portion of users who demonstrate procrastinate-like charging behavior.
Method
This work aims to estimate the portion of EV users who exhibit risk-seeking or procrastination-like behavior before they decide to charge their vehicles. For this purpose, the DRM is fitted to the charging profiles of EV users in the State of Rhode Island. A collaboration with the Rhode Island Office of Energy Resources provided access to data from publicly available charging stations. The outcomes from exploring Rhode Island, as the second-most densely populated state (Eissa, 2019), could represent a valuable overview of this unique charging behavior. To conduct a robust estimation, the Bayesian approach is implemented.
Data
The data for this study relies on 82 Level-2 public charging stations, each with two 6.6 kW ports at 208V–240 V AC (U.S. Department of Transportation [US DOT], 2023), with all locations supplied by ChargePoint®. In eight consecutive years, starting from 2013 to 2020, a total of 111,077 charging events occurred at these stations, with 1074 unique users. The data compiled details on the stations (i.e., name, address, postal code, and GPS coordinates) and the events (i.e., locale date and time, plugged-in duration, charging time, energy received, and termination reason) with limited information on the users (i.e., identification number and postal code). There exists a range of reasons for a charging event to end. Since this study focused on the users’ utilization of public charging stations, the analyses solely considered the charging events terminated by the users. Data cleaning removed the unsuccessful charging events with energy consumption of zero kWh (n = 7088) and charging time of less than 1 minute (n = 7473) (Morrissey et al., 2016). Lastly, based on the knowledge that COVID changed charging behaviors (Jonas & Macht, 2022), the charging events following the first Rhode Island’s confirmed COVID-19 case (March 1st, 2020; n = 7775) were removed (Rhode Island Government, 2019; Zhou et al., 2022). The remaining charging events data set was 88,741 events after cleaning.
Frequent Users
Summary Statistics of 520 Frequent Users’ Utilization.
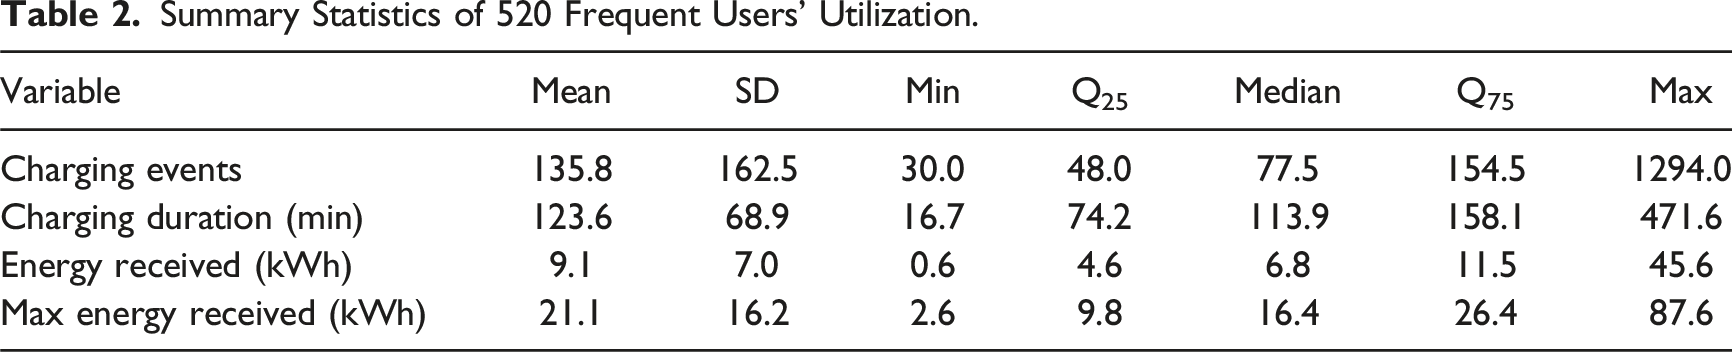
Assuming that each user identification number belongs to a user with a single vehicle throughout this analysis, the charging profiles of frequent users were constructed. It is fair to assume that users spend more time at the charging stations when their battery (i.e., state of charge [SOC]) is low or nearly empty. Conversely, the data showed that users receive maximum energy (kWh) at the station when they stay and charge for an extended period due to a low SOC. This assumption is supported through a conversation with a user in the provided dataset and acquiring their user identification number. The named user owned a 2015 Volkswagen e-Golf with a battery capacity of 24.2 kWh (Electric Vehicle Database, 2023). During data processing, it was found that the maximum energy received by this user among all of their charging activities is 23.43 kWh. Therefore, the analysis was carried out such that the portion of charge received at each charging event was defined by dividing the energy received during that charging session by the individual’s maximum received energy among all charging sessions. As a result, the profile of users based on the portion of charge received, ranging from zero to one, was obtained. A histogram containing the charge frequency in ten and equally binned ranges was created per user (Figure 1). In other words, charging profiles represent the frequency of battery charge deciles at which EV users charge their vehicle(s). Histograms of three random users.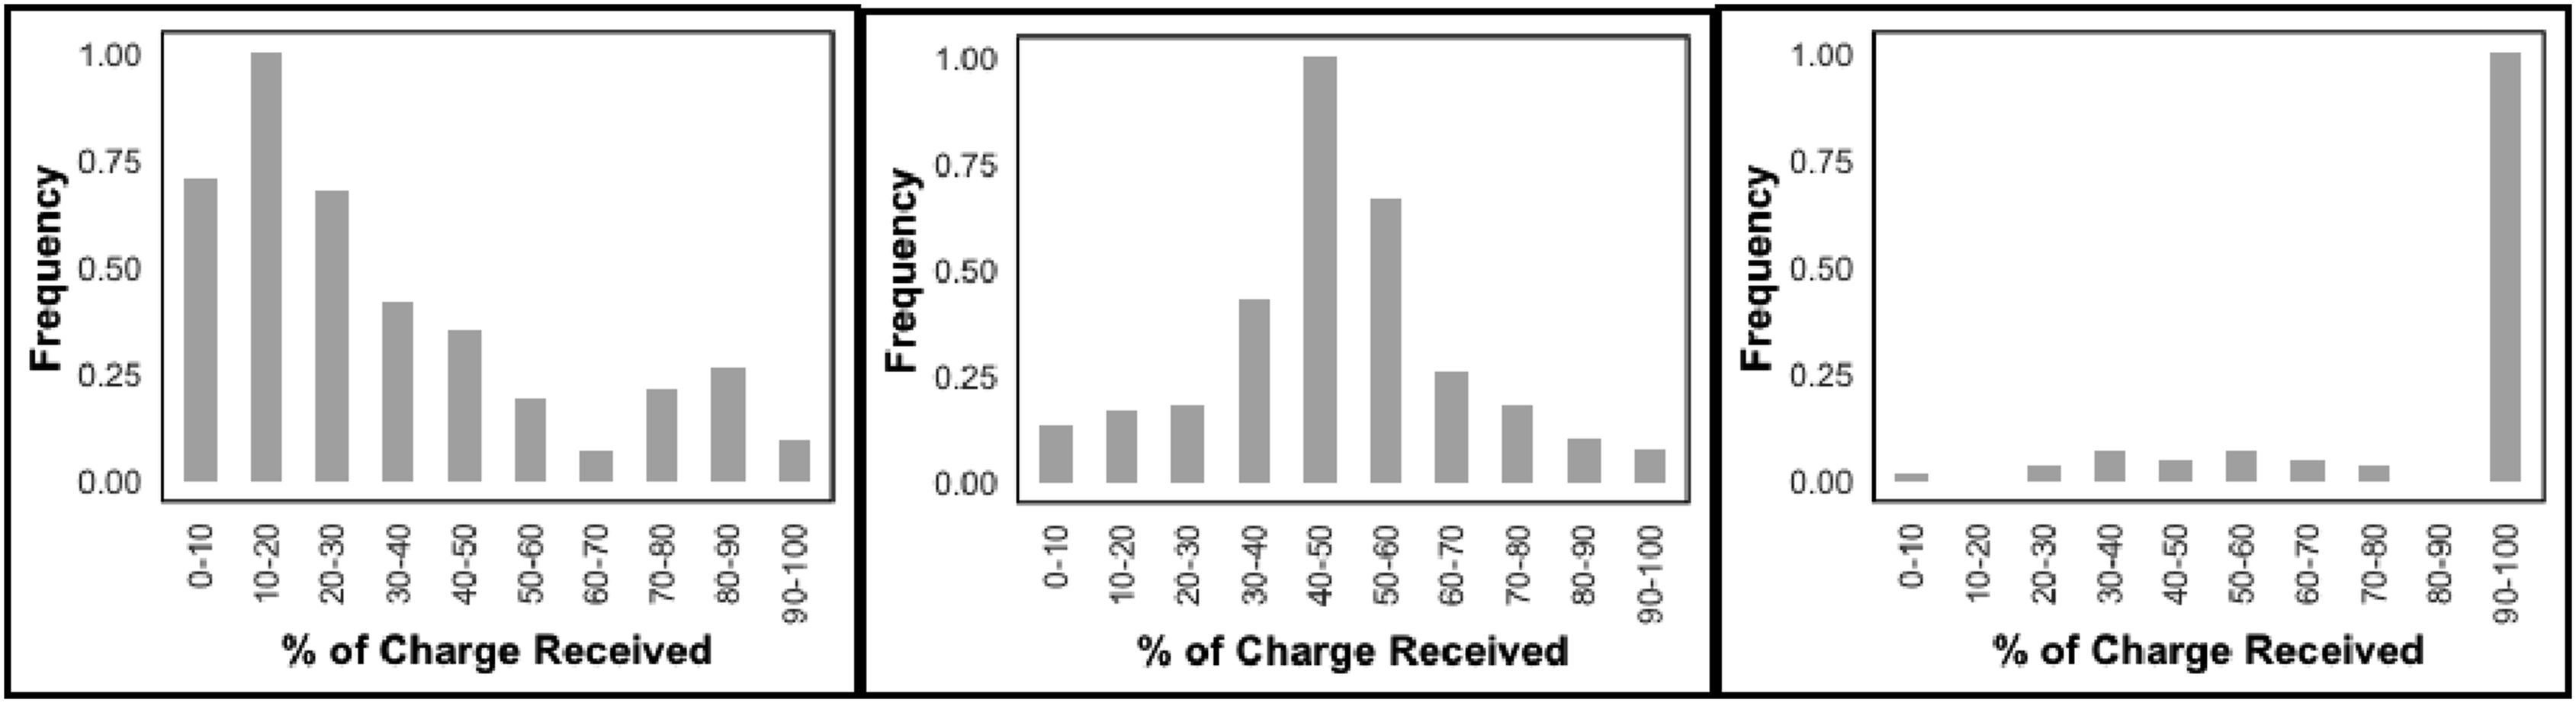
Bayesian Estimation
Through the Bayesian statistical approach, Kim and Nembhard (2017) employed DRM in two datasets to investigate individuals’ delay in performance and action concerning task completion (i.e., a classroom setting) and decision making (i.e., an experimental setting). Their results from the Bayesian statistical approach provided a repeatable methodology that can be applied in various environments that have not previously explored this behavior. This study aims to fit the DRM to users’ charging profiles to estimate the portion of those who delay charging until a nearly empty battery. To do so, the Bayesian statistical approach is applicable (Equation (2)) (Alambeigi & McDonald, 2021; Hackenberger, 2019; Neyens et al., 2015; Pek & Zandt, 2020) due to the availability of data on users’ charging activities (y), prior information on procrastination charging behavior (P(θ)), and a distribution to represent the procrastination pattern (P (θ | y)).
More specifically, to model heterogeneity among procrastinators and nonprocrastinators and conduct a more robust estimation, the Bayesian Mixture Model (BMM) is implemented (Jasra et al., 2005; Ma & Leijon, 2011; Zafari & Soyer, 2021). This study attempts to estimate the percentage of users who established procrastination charging behavior over time versus those who do not. For example, a user who procrastinates would charge when their battery is below 15% of its power remaining (Pevec et al., 2019, 2020). To fulfill the objective of this study, the DRM as the measurement for procrastination is fitted across all users’ charging profiles. If a user’s profile follows an exponential growth pattern (Equation (1)), the named user is identified as a procrastinator. Although DRM is the starting point for conducting this analysis, its application needs to be adjusted for the setting of this study.
The exponential distribution associated with DRM, regardless of the rate parameter, has a skewness of 2 and a kurtosis of 6 (Manly, 1976), which would be able to identify one type of charging behavior. This distribution fits well with values starting from zero to infinity. However, the users’ portion of the charge received is bounded between zero and one, and fitting an exponential distribution might not fully represent procrastination as defined by DRM. To support the nature of charging profiles and yet incorporate DRM to serve the purpose of this study, the Beta distribution is selected for the analysis. The Beta distribution has the flexibility to form a shape representing DRM while supporting the structure of charging profiles. This presents the opportunity to model procrastination and nonprocrastination charging behavior as Beta distributions, leading to forming two Beta distributions BMM to identify the portion of users with described behaviors. Based on Ma and Leijon’s (2011) suggested model, the authors of this study defined the Beta distributions Mixture Model as Equation (3): i is the charging behavior {0: procrastination, 1: nonprocrastination}; θ denotes the portion of users following the procrastination behavior; α is the shape parameter, scale, for Beta distribution; β is the shape parameter, spread, for Beta distribution; and ε
i, i+1
represents the random effects for individuals within each distribution.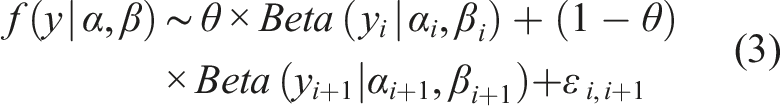
All users’ shape parameters of Beta distribution charging profiles are attained to initiate and execute the mixture modeling through the prior knowledge adapted from Khaleghikarahrodi & Macht (2023b). Given the summary of statistics on users with procrastination-like charging behavior, as outlined in Khaleghikarahrodi & Macht (2023b), the method of moments is utilized to infer the shape parameters for the prior information (Fielitz & Myers, 1975; Figure 2). The prior knowledge for this model is critical information for formulating our presented model (Equation (3)). Prior information Beta distributions’ density plots.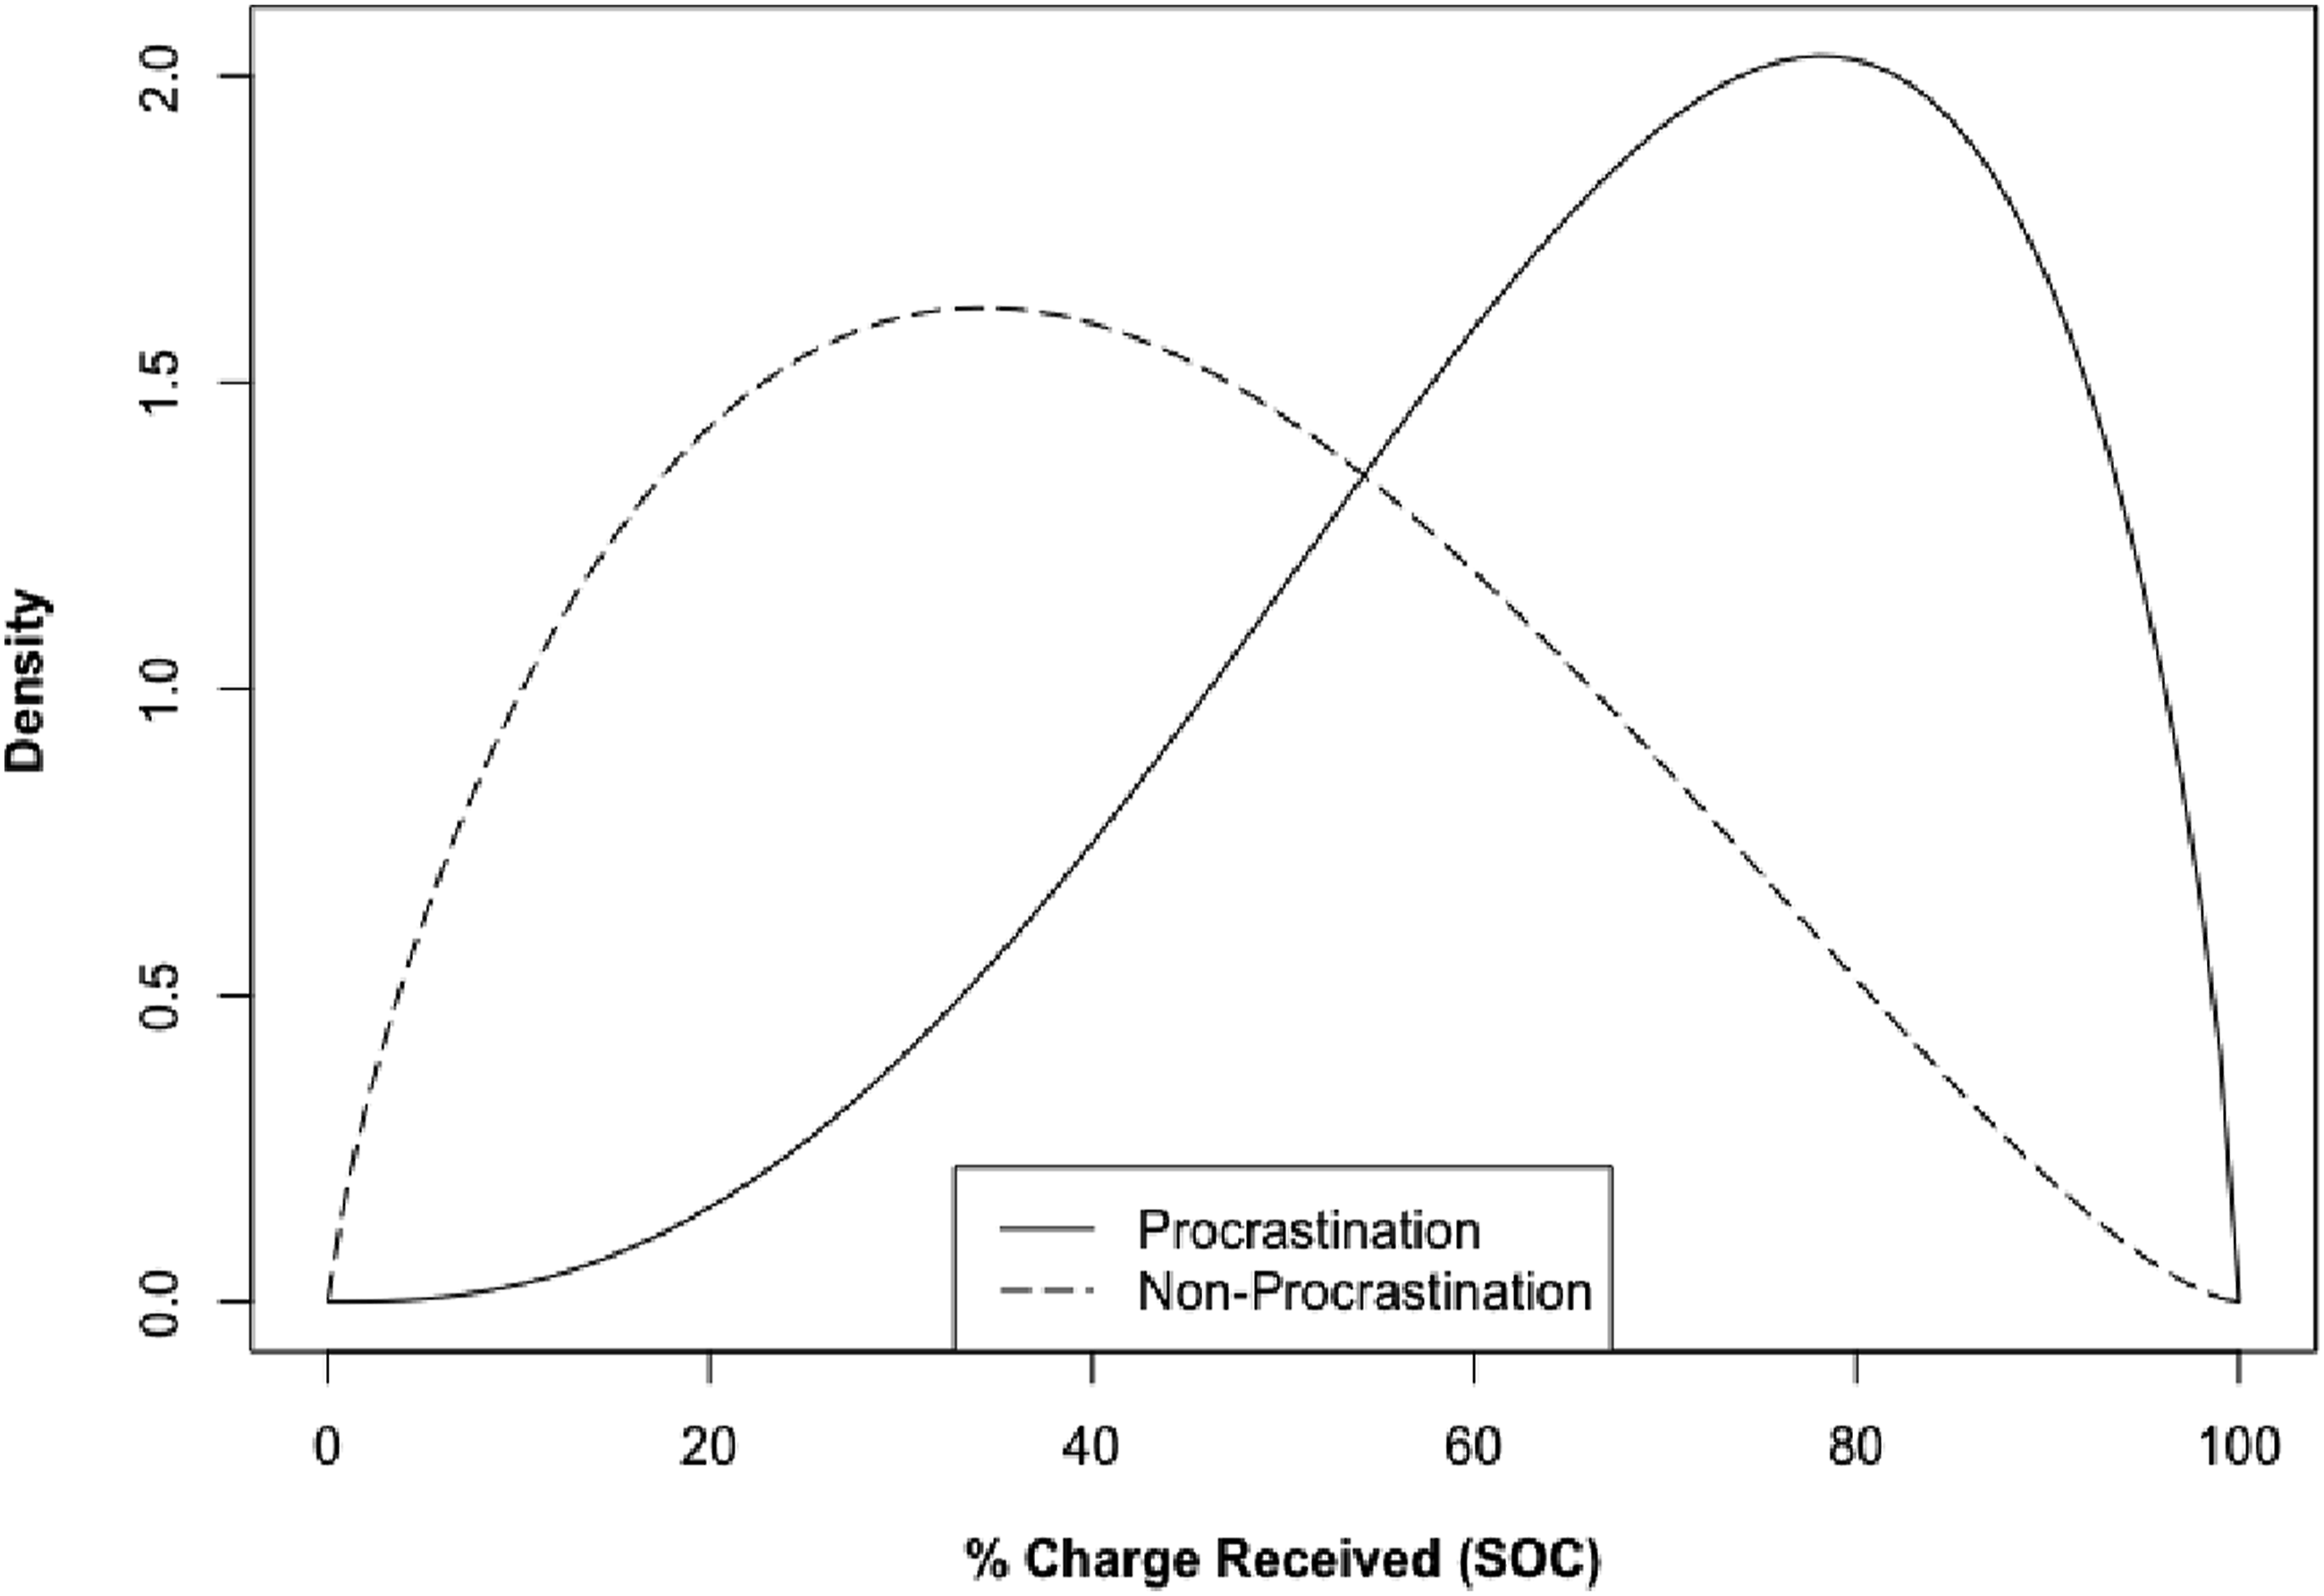
Analysis
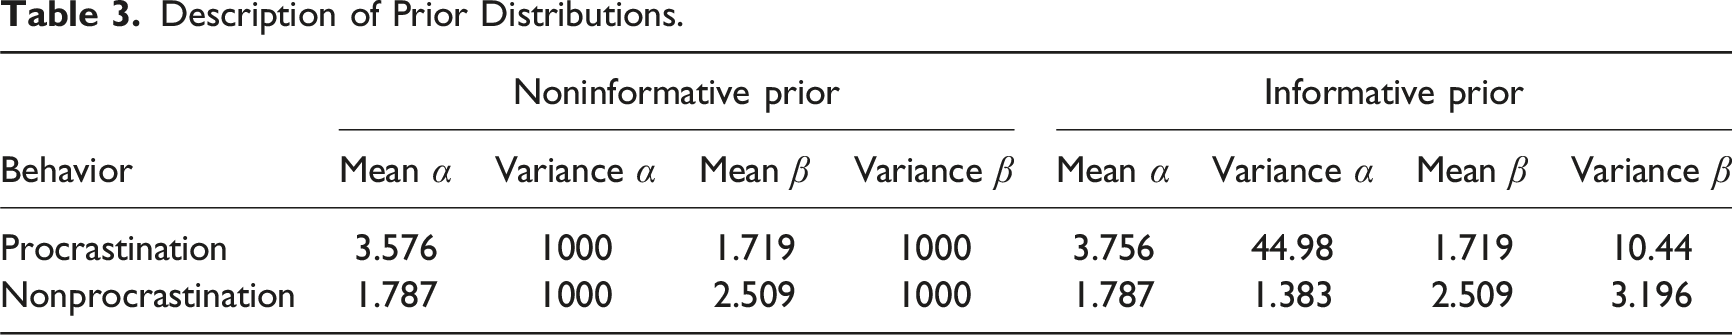
Description of Prior Distributions.
Results
Summary Statistic of θ as the Parameter of Interest (i.e., Portion of Users).
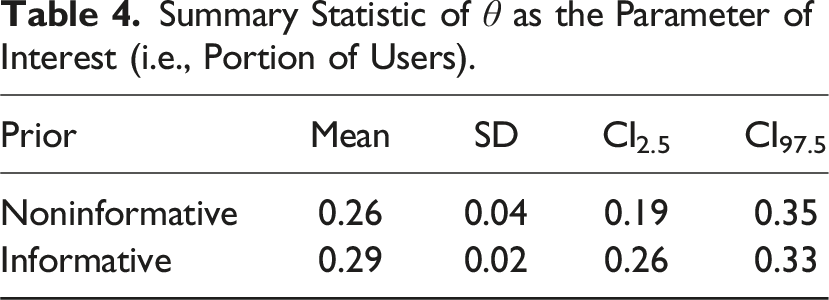
According to Table 4, the percentage of users exhibiting procrastination-like behavior can vary depending on the prior knowledge of procrastination charging behavior. For the informative prior, the percentage can be as low as 26% or as high as 33% with a mean of 29%, while for the noninformation prior, the range spans from 19% to 35% with a mean of 26%. Based on the tightness of the bounds from the estimated mean confidence intervals, it becomes evident that the informative prior provides a more precise estimate (Yu & Abdel-Aty, 2013; Zucker et al., 2010). This indicates that the distribution of posterior parameter values is more densely populated around the posterior mean. This result is further supported and verified by the standard deviation value for each prior, in which the informative prior stresses lesser deviation within the estimation credible interval and reinforces its precision. Moreover, the signs of this conclusion can be observed in the achieved posterior distributions representing procrastination and nonprocrastination behaviors.
Descriptive Results of Posterior Distributions.
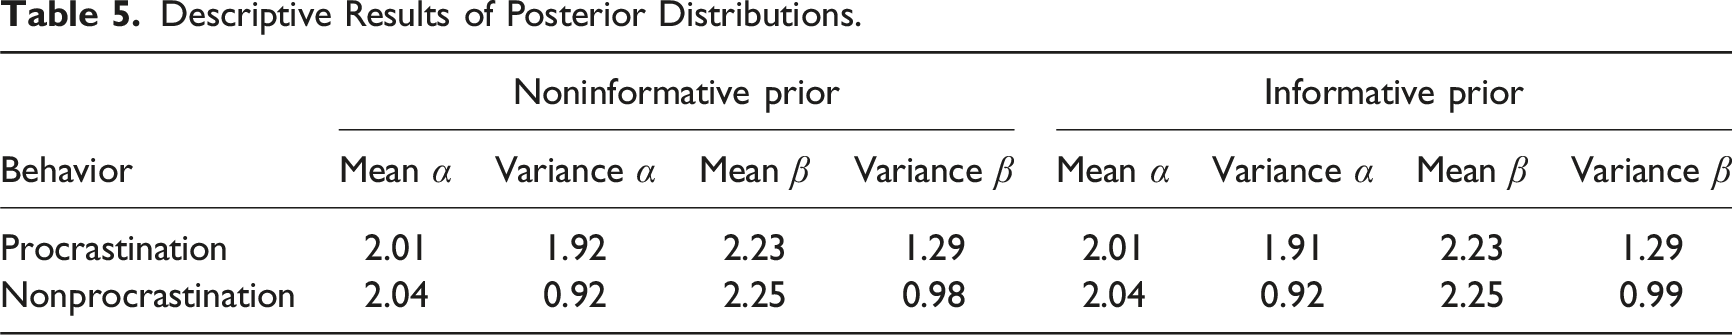
Looking closer at Table 5 reveals that most results within each behavior and between priors (i.e., informative and noninformative) have somewhat similar shape parameters (i.e., scale and spread). This can be supported through Bayesian statistics, where the posterior distribution is the product of observed data and prior knowledge (Alambeigi & McDonald, 2021; Hackenberger, 2019; Neyens et al., 2015; Pek & Zandt, 2020). Therefore, the proximity of the priors’ shape parameters was due to the rich data provided and the priors fed into the model. These sensitivity analysis outcomes, demonstrated in Table 5, provide confidence in the reliability of the estimated portion of users who procrastinate charging.
Additionally, monitoring the trace plots for the BMM in the NUTS Sampler (Figures A1 & A2) indicated a sufficiently converged model, meaning both the noninformative and informative prior distributions are well calibrated, and sufficient parameters are suggested for the generation of the posterior distribution (Suter et al., 2021).
The BMM incorporating the DRM was able to sort frequent users and assign them to either procrastination or nonprocrastination charging behavior. As a result, the BMM found that 151 out of 520 (29%) frequent users are prone to delay charging. To understand the charging performance of both behaviors, their cumulative histogram is prepared (Figure 3). Specifically, Figure 3(b) illustrates that users with procrastination-like behavior charge more frequently as their battery gets closer to empty. This means that as the SOC decreases, the frequency of receiving charges increases for users in this category. All users’ cumulative charging behavior. (a) Nonprocrastination (n = 369). (b) Procrastination (n = 151).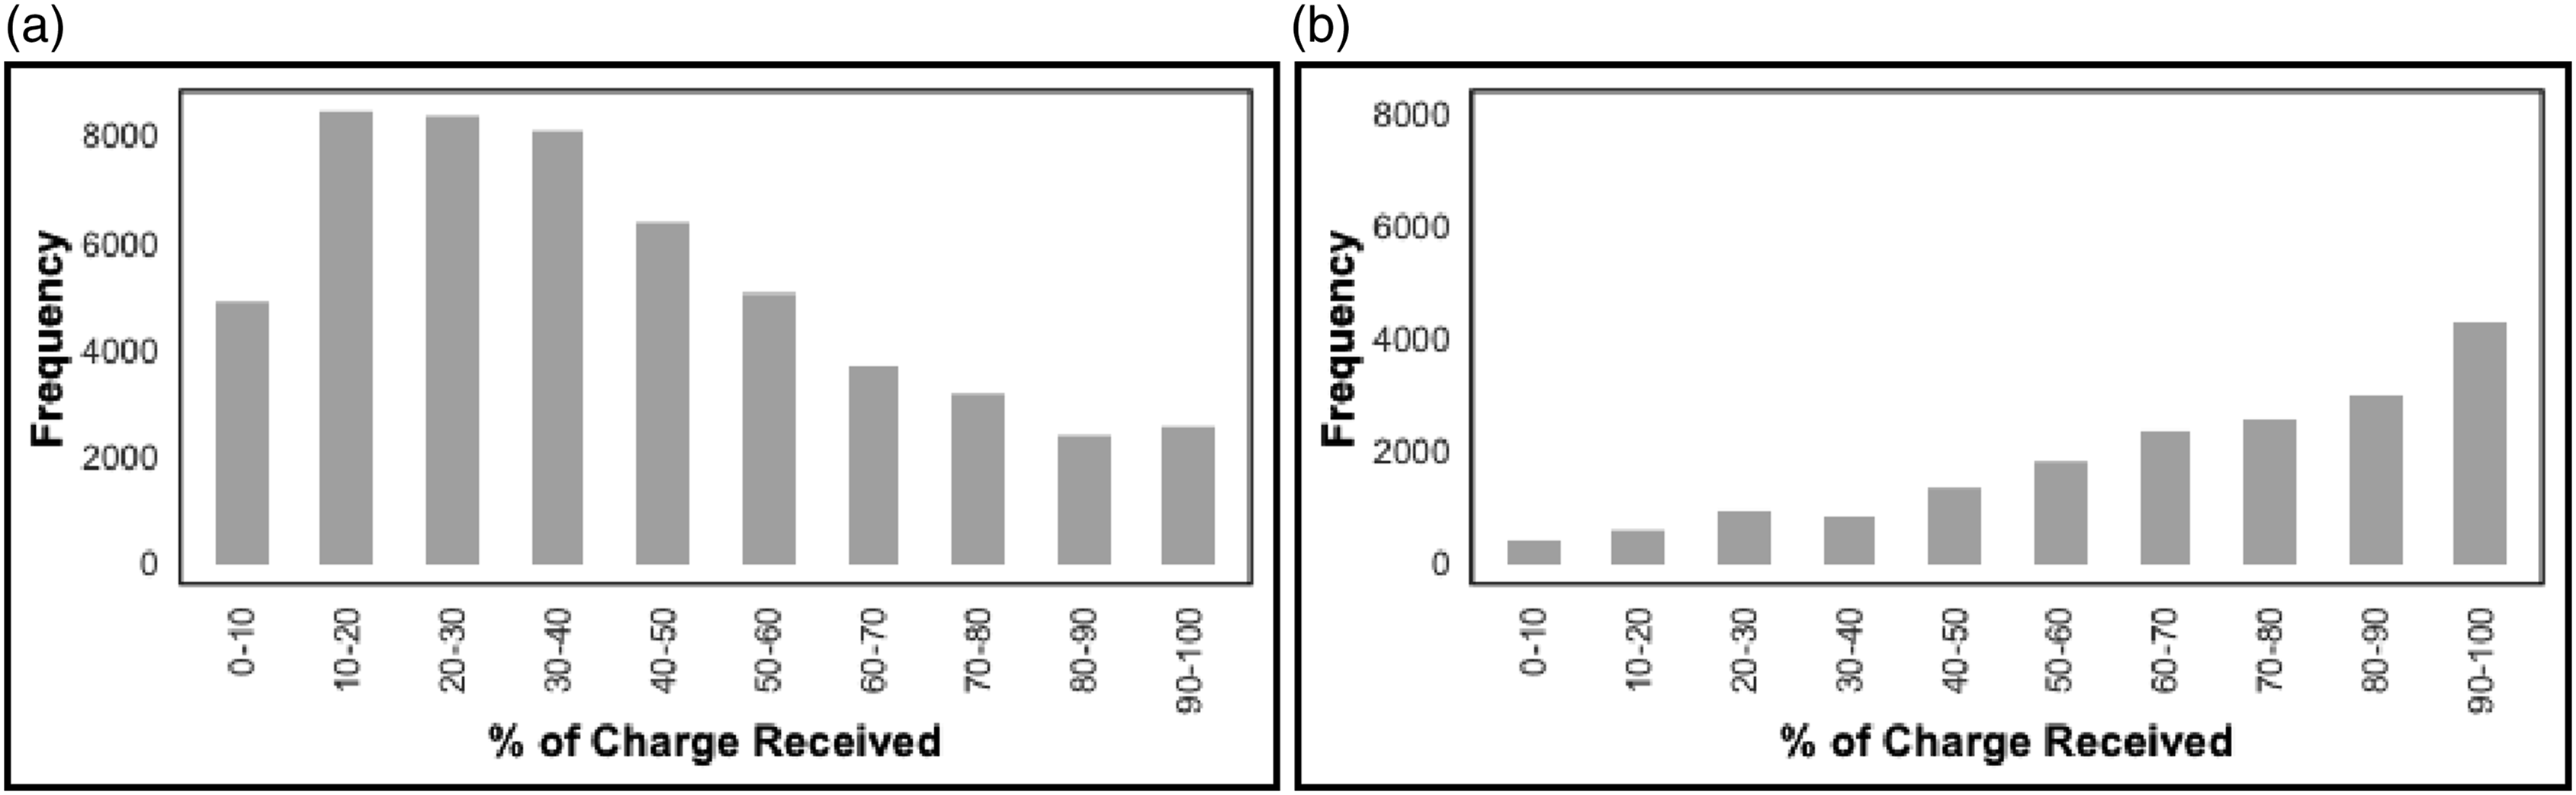
The statistical distribution of maximum charge received, assumed equivalent to battery capacities, for users of both charging behaviors are depicted in Figure 4. Figure 4(b) suggests that users with procrastination-like charging behavior likely drive EVs with smaller battery sizes (i.e., plug-in hybrid) with a couple of outlier users who might own EVs with larger batteries. In this scenario, it might be correct that users with larger batteries have the confidence to delay and procrastinate charging. However, most users with procrastination-like pattterns are likely to own a plug-in hybrid. Distribution of maximum energy received. (a) NonProcrastination (n = 369). (b) Procrastination (n = 151).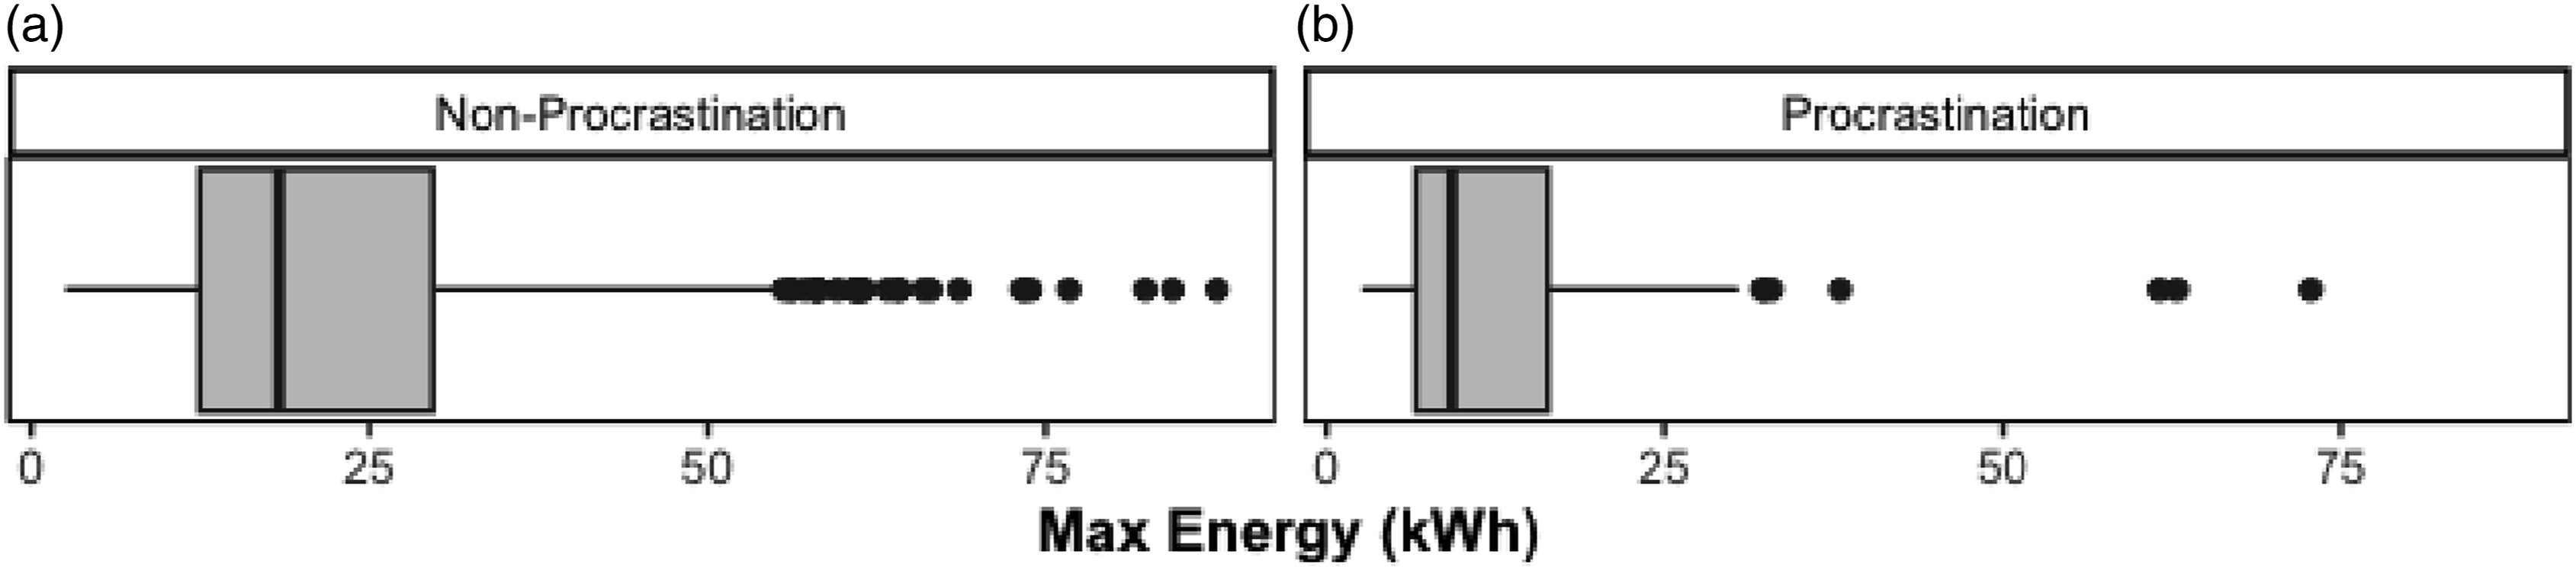
Figure 5 depicts the charging distribution for both charging behaviors. For both behaviors, the peak charging hours are between 8 a.m. and 10 a.m. The procrastination-like users are most likely driving EVs with smaller batteries (i.e., plug-in hybrid) and charging for up to 2-hours around their peak charging time. This can affect other EV (nonhybrid) drivers’ charging decisions and behaviors as they arrive at occupied charging stations. This is where a problem can escalate not only for nonprocrastination users but also for charging networks.
Discussion
To date, range anxiety stands out as the sole, qualitatively and quantitatively, identified charging behavior among EV users (Chen et al., 2020; Pevec et al., 2020; Philipsen et al., 2018; Xu et al., 2020). While some studies have hinted at the existence of some users who procrastinate their charging, and some literature point out users who charge conveniently due to their access to faster charges or/and higher density of charging stations (Davidoc, 2020; Franke & Krems, 2013), no one has directly quantified this phenomenon. This study presents that a proportion of users with procrastination-like behavior exists, through public Level 2 charging station data, and posits that its population mean percentage is 29%, as determined through a Bayesian Mixture Model fit of the Deadline Rush Model.
Procrastinator users must charge when they pull up to a charging station, as they may not have enough SOC to make it to the next station. The result of this type of community-systems behavior is that the procrastinator users, depending on their kWh rate draw allowed by their vehicle and the charging station itself, will take up a slot in the charging station for longer than anxious users who normally have faster-hit rates (i.e., short charge times and use smaller kWh) (Hu et al., 2019; Philipsen et al., 2018, 2019; Wang et al., 2021). This could have a reinforcing effect where the longer they are in the system, the less likely anxious users are able to charge, creating more anxious behavior. From a queueing theory perspective, this changes the probability of individual users rejecting, reneging, or balking on particular charging stations that already have high utilization rates. This includes charging stations that are close to highways with a limited number of ports or in charging station deserts where there is only one station for miles. Therefore, the procrastination-like user pattern could influence the already anxious users in the charging network.
There is a belief that EV users in the procrastination category are aware of their maximum driving ranges (Latinopoulos et al., 2017; Philipsen et al., 2018, 2019; Wang et al., 2021). This might be due to the capacity of larger batteries, which give users the confidence to charge closer to their range limits (Latinopoulos et al., 2017; Wang et al., 2021). The statistical distribution of maximum charge received, assumed equivalent to battery capacities, suggests that users with procrastination-like charging behavior will likely drive EVs with smaller battery sizes (i.e., plug-in hybrid). A couple of outlier users might own EVs with larger batteries (Figure 4(b)). In this scenario, it might be correct that users with larger batteries have the confidence to delay and procrastinate charging. However, if most users with procrastination tendancies are likely to own a plug-in hybrid, which uses two sources of fuel, they are potentially less concerned with their battery range daily, which often leads to empty batteries. So, when it comes to charging their batteries, they most likely charge for a full battery and tend to appear as procrastinators over time.
It can be seen that for both behaviors, the peak charging hours are between 8 a.m. and 10 a.m. (Figure 5(b)). The procrastinators are most likely driving EVs with smaller batteries (i.e., plug-in hybrid) and charging for up to 2-hours around their peak charging time. This can affect other EV (nonhybrid) drivers’ charging decisions and behaviors as they arrive at occupied charging stations. This impacts infrastructure design as there are conflicting styles of user demand on the available supply. For example, one design change might require more Level 2 chargers in the system to handle smaller battery types while also adding and designating multiple stations with various DCFC power-supply modalities at a single, high-demand location. These different modalities of stations will then be designated based on the needs of full battery electric vehicles versus plug-in hybrids. This potential design implication would allow larger battery sizes on full battery-powered electric vehicle options, even if they are procrastination-like users, and the system is not bogged down with plug-in hybrids whose demand is less volatile. This is where a problem can escalate not only for nonprocrastinator chargers but also for charging networks. The main purpose of charging infrastructure growth is to ensure users in the network can access a charger when they need to with a short queue time. Lack of attention to the difference in users’ charging behavior can impact users’ satisfaction with the existing infrastructure and slow down EV adoption in the long run. Distribution of charging duration on session start time. (a) NonProcrastination (n = 369). (b) Procrastination (n = 151).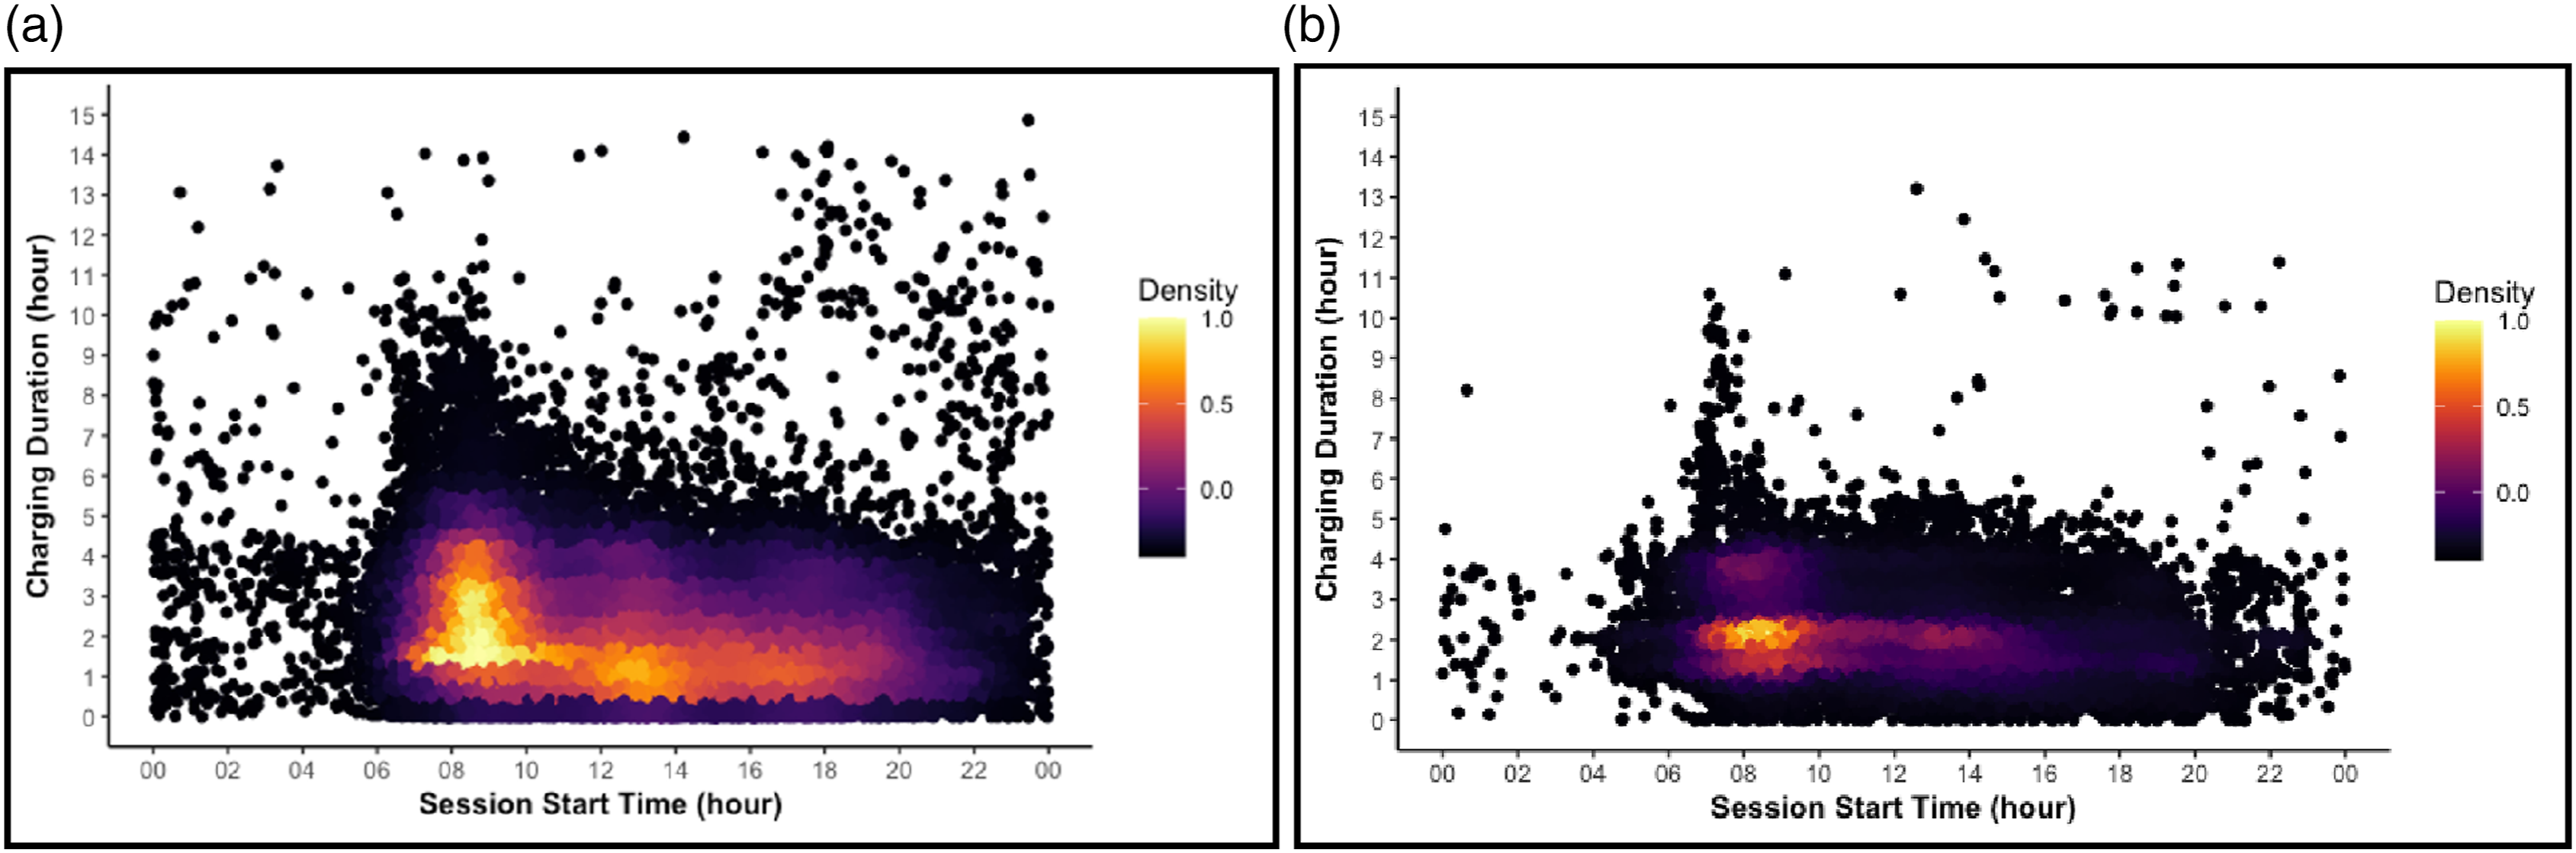
Besides the battery technology, the infrastructure accessibility and availability play a role in the charging behavior of procrastination users (Davidov, 2020; Hu et al., 2019; Khaleghikarahrodi & Macht, 2022; Pan et al., 2019). Pevec et al. (2019, 2020) found that users in close proximity to charging stations with a well-established charging infrastructure tend to postpone charging until necessary. Despite the reasonable justification for such behavior, to our knowledge, there is no data-driven study investigating the effect of various battery sizes and users’ proximity to charging stations on users’ procrastination charging behavior. All the assumptions justifying this behavior were collected from survey studies. Sun & Kim (2022a, 2022b) discussed the gap in self-reported questionaries where users carry biases toward their answers; they tend to report how they intend to behave versus how they actually behave. Additionally, there is a lack of knowledge in investigating shifted procrastination-like behavior when a low charge warning light or indicator goes on, let alone exploring the underlying factors affecting the behavior. Additionally, looking into the battery usage of procrastinators and assessing their battery life cycle assists in future designs of EVs and, thus, the automotive industry (Bai et al., 2022; Patil et al., 2023). Extending the EV’s range mobility or educating users to charge within the optimal SOC range (Franke & Krems, 2013) are potential scenarios that can be considered.
This data included log charging sessions without recorded information on users’ vehicle type, make, model, and year. This led to forming assumptions, such as each user has a single identification number with a single vehicle, and for each user, SOC is nearly zero when maximum energy is received. Moreover, the charging stations in this analysis were free to charge; thus, a dataset including the pay structure of its service provider is beneficial to future studies. Along with infrastructure data, the data collected from software can reveal whether a procrastinator user could make it to a charging station or have to cope with a dead EV. To discover more about procrastination-like behavior, including data from fast chargers and at-home chargers can better reflect users’ behavior both residentially and publicly. Alternatively, the existence of procrastination-like users suggests that network reliability, a broader issue according to the literature, must be a high priority due to users’ immediate need to access an available charger.
Reliable, functional, open, and public EV charging stations are pivotal in achieving EV mass adoption. Despite the growth of the EV service equipment infrastructure, EV users have a rising number of complaints about the charging networks (Choi, 2020). Challenges arising from public charging stations, such as the lack of support for users’ charging needs, have caused some drivers to return to internal combustion engine vehicles, showing that there is still work to be done (Hardman & Tal, 2021a). Assuring users that a reliable and available charging network exists will promote the use of public charging stations and encourage purchasing decisions for potential EV consumers. Yet, significantly increasing charging stations is not proportional, nor does it guarantee user satisfaction of the network’s users, let alone reduce EV adoption barriers (Hardman & Tal, 2021b). The reliability of EV charging stations currently has mixed results, depending on the type of station network. More effective and efficient approaches to this problem should exist than simply adding more chargers. Hence, a more comprehensive approach is needed in which user preferences and the existing utilization of the charging network are analyzed (Rempel et al., 2022).
For example, it has been reported that when attempting to charge as public DCFC sites, upwards of 25% of non-Tesla charging stations are not functioning at their total capacities or capabilities (Rempel et al., 2022). On the internal charging station side, approximately 97% of these stations report functioning. These results are contradictory, with EV service providers seeing something different than EV users’ reports. Studying and diagnosing this challenging discrepancy is pivotal in EV charging infrastructure’s future stability and usability during the shift to e-mobility, especially for procrastination-like users. With 29% of EV users exhibiting procrastination-like behaviors and, subsequently, an immediate need to access a functional charging station, current charging infrastructure may be failing to adequately serve thousands of drivers in the State of Rhode Island (n = 1253 based on United States Department of Energy Alternative Fuels Data Center’s Electric Vehicle Registrations by State) and hundreds of thousands of drivers nationally (n = 708,259) (U.S. Department of Energy [US DOE], 2023).
Conclusion and Future Work
With EV technology and infrastructure improvements, the traditionally known charging behavior affected by range anxiety is no longer alone, and a group of users with procrastination-like behavior has emerged. The Bayesian statistical approach estimates that the population proportion of frequent users who delay charging when their SOC is nearing zero is 29%. This is the first time the EV literature directly identified procrastination-like patterns in the charging station network; and, not as an antithesis to range anxiety, but as a counterpart to it in the scope of range stress. Yet, a majority of users exhibiting procrastination-like charging behavior tend to have smaller battery sizes, possibly owning plug-in hybrid vehicles. Upon arriving at a station, the plug-in hybrids might not need to charge, while users with procrastination-like behavior necessitate charging. This category of users with procrastination-like charging behavior are those with fully battery-powered electric vehicle that plug-in hybrids could systematically clog the system for them. Future work could explore if this type of user exhibits responses such as increased frustration, a perceived lack of station availability and/or functionality, a charging equivalent of road-rage–charging-rage, and/or a lack of trust in the overall charging infrastructure. Any of these responses in a stressful context can create levels of vulnerability for all EV public charging station users. Ultimately, this will impact the adoption levels for the entire EV community, especially as demand significantly increases with various levels of access to infrastructure and service.
Moreover, distinct usage patterns need to be explored and classified into common groups to identify users’ needs from their charging usage. Distinguishing differences between groups of users can inform various parties in EV infrastructure decision-making and planning (e.g., policymakers and leading utility providers) and help develop a sustainable distribution of charging stations. Introducing this additional dimension in the policy approach and implementation will help support more accurate investments by increasing the comprehensive knowledge of the people using it and avoiding suboptimal investments. That said, there are potentially more charging behaviors to capture and model. With this study’s resulting model, resourceful data, and prior knowledge, we can start to dive into how users’ charging behaviors can be modeled and interpreted. Nevertheless, this contribution quantifies a new EV user behavioral pattern, encouraging more holistic models to address the human component concerning EV charging station placement and adoption to facilitate a future, user-centric infrastructure design.
Key Points
A portion of EV users who delay charging was identified through the application of the Deadline Rush Model. This study provides insights that 29% of a public EV charging infrastructure users exhibit procrastination-like patterns. User data should be incorporated to promote and inform stakeholders’ decision-making process of a user-centric EV charging infrastructure design.
Footnotes
Acknowledgments
The authors would like to thank the Rhode Island Office of Energy Resources for their collaboration and Joshua Ray Tanzer, PhD and the URI SIS Lab for their continued support.
Declaration of Conflicting Interests
The author(s) declared no potential conflicts of interest with respect to the research, authorship, and/or publication of this article.
Funding
The author(s) received no financial support for the research, authorship, and/or publication of this article.
Appendix
Bayesian mixture model convergence (noninformative prior)*.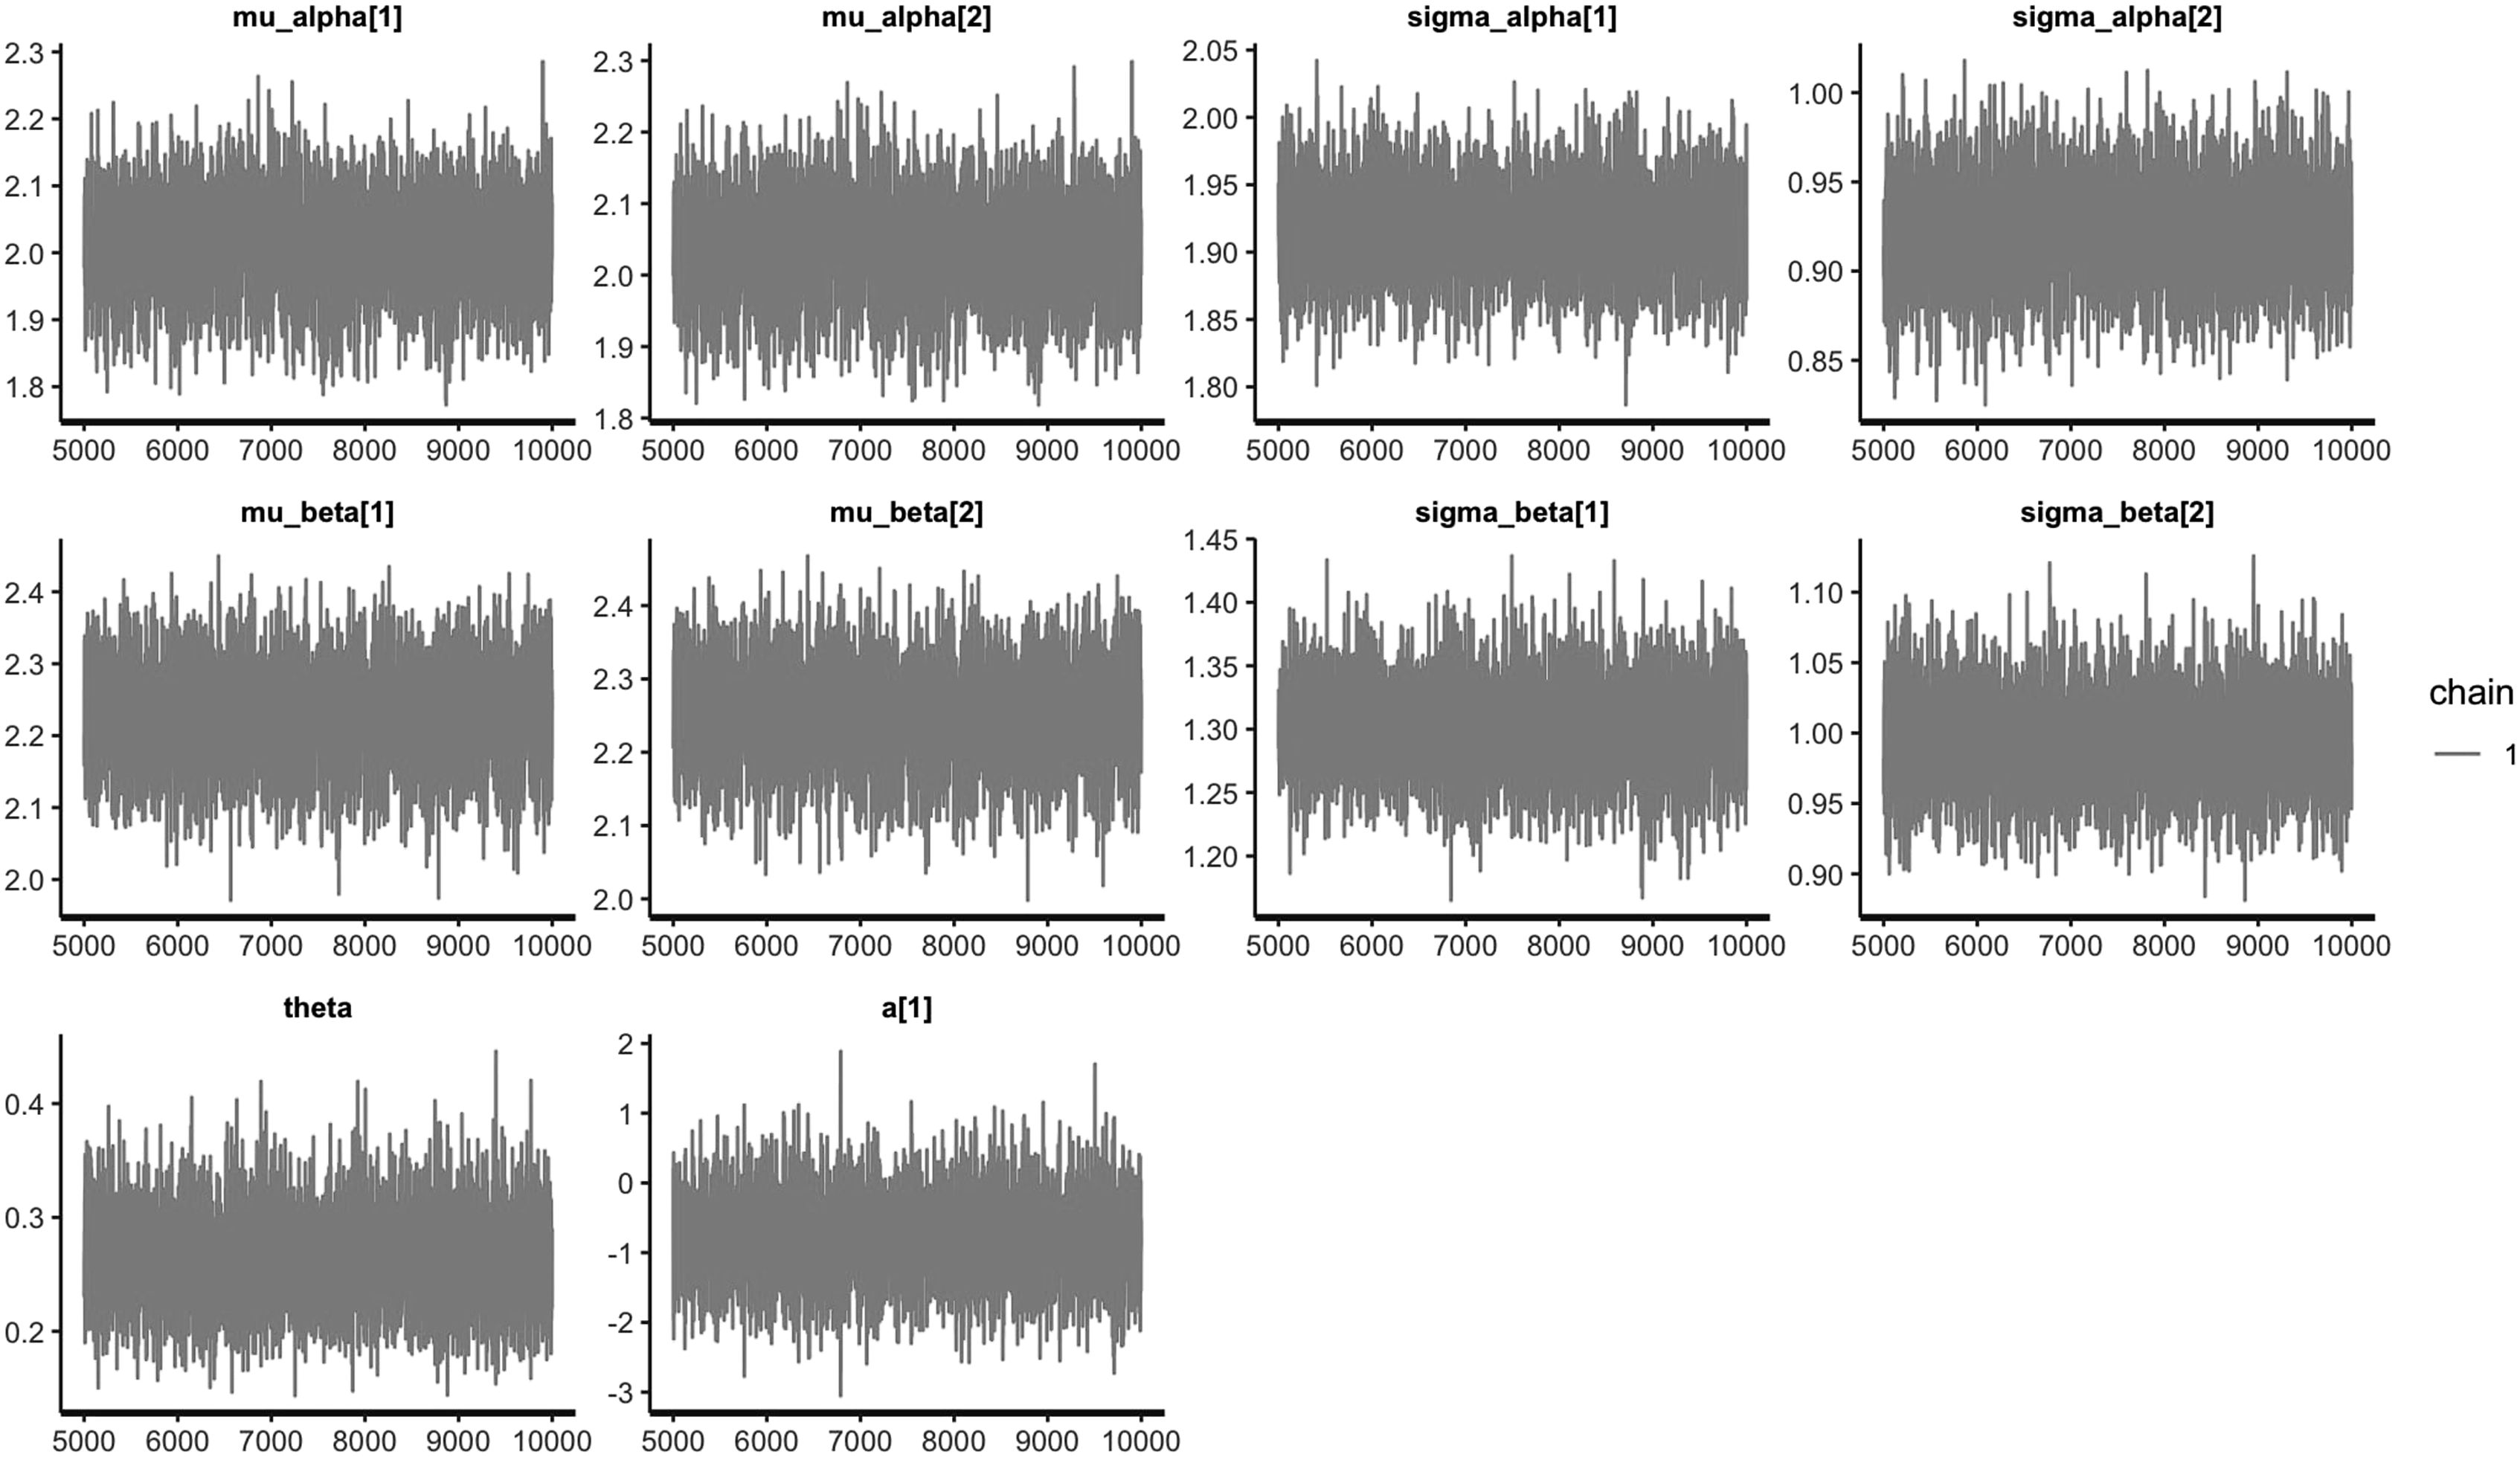
Bayesian mixture model convergence (informative prior)*. *Note: The trace plots for both models produce uniform white noise. This means there is no autocorrection between the parameters of the model, and no pattern (i.e., increase or decrease over iterations) is observed for Figures A1 & A2. Hence, observing a gray rectangle indicates that the models are converged well.
Author Biographies
Mehrsa Khaleghikarahrodi: E-Mobility Consultant, AECOM. BS (2018), Industrial & Manufacturing Engineering, Kansas State University. MS (2020), Systems Engineering, University of Rhode Island. PhD (2023), Industrial & Systems Engineering, University of Rhode Island.
Gretchen A. Macht: Associate Professor of Industrial & Systems Engineering, University of Rhode Island. BS (2007), MS (2009), and PhD (2014) in industrial engineering, and postdoctoral scholar in architectural engineering (2015) from Pennsylvania State University.