
Abstract
Objective
This work examined the relationship of the constructs measured by the trust scales developed by Chancey et al. (2017) and Jian et al. (2000) using a multilevel confirmatory factor analysis (CFA).
Background
Modern theories of automation trust have been proposed based on data collected using trust scales. Chancey et al. (2017) adapted Madsen and Gregor’s (2000) trust scale to align with Lee and See’s (2004) human–automation trust framework. In contrast, Jian et al. (2000) developed a scale empirically with trust and distrust as factors. However, it remains unclear whether these two scales measure the same construct.
Method
We analyzed data collected from previous experiments to investigate the relationship between the two trust scales using a multilevel CFA.
Results
Data provided evidence that Jian et al. (2000) and Chancey et al. (2017) automation trust scales are only weakly related. Trust and distrust are found to be distinct factors in Jian et al.’s (2000) scale, whereas performance, process, and purpose are distinct factors in Chancey et al.’s (2017) trust scale.
Conclusion
The analysis suggested that the two scales purporting to measure human–automation trust are only weakly related.
Application
Trust researchers and automation designers may consider using Chancey et al. (2017) and Jian et al. (2000) scales to capture different characteristics of human–automation trust.
Introduction
Automation is a pervasive and integral part of many professional and everyday activities in a modern society. Automation is defined as any mechanized and/or computational agent that partially or fully performs a variety of physical and/or cognitive tasks that humans used to perform or that humans are not able to perform (Bainbridge, 1983). Human operators ideally use automation as intended, improving human or joint human–automation performance. However, operators may also adopt suboptimal automation usage strategies (Sorkin & Woods, 1985; Yamani & McCarley, 2016, 2018) which disuse reliable or misuse unreliable automation (Parasuraman & Riley, 1997), degrading joint human–automation performance (Yamani & Horrey, 2018; Yamani et al., in press).
The rich literature on human–automation interaction in human factors suggests that an operator’s trust toward an automated system, or human-automation trust, is a critical factor for forming, growing, and maintaining successful human-automation interactions (Chen & Barnes, 2014; Lee et al., 2021; Lee & Moray, 1992, 1994; Long et al., 2020, 2022; Lyons & Stokes, 2012; Moray et al., 2000; Muir, 1994; Muir & Moray, 1996; Parasuraman & Riley, 1997; Riley, 1994; Yamani et al., 2020). The goal of the current study is to examine the relationship of the constructs measured by two trust scales, a theory-driven scale by Chancey et al. (2017) and an empirically developed scale by Jian et al. (2000), using a multilevel confirmatory factor analysis (CFA).
Providing one of the more popular theoretical perspectives on human-automation trust, Lee and See (2004) define trust as “an attitude that an agent will help achieve an individual’s goals in a situation characterized by uncertainty and vulnerability” (p. 51). Moreover, Lee and See (2004) offer an integrative perspective of human–automation trust comprised of three informational bases, performance, process, and purpose. Performance refers to the current and historical behaviors of automation that are observable to operators (e.g., automation reliability) and describes what the automation does. Process refers to the appropriateness of the automation’s algorithm that controls the automation’s behavior in a given situation and describes how the automation operates. Finally, purpose refers to the extent to which the automation is used as intended by the designers and describes why it was developed. These information bases indicate levels of attributional abstraction that are theorized to influence the development of trust (Lee & See, 2004). That is, trustees collect information pertaining to each of the three bases to develop their trust toward automation.
One method for measuring human–automation trust is via questionnaires which can be categorized to two different types: empirically or theoretically driven scales (see Kohn et al., 2021 for extensive review of human–automation trust measures). The empirically-determined scale of trust in automated systems developed by Jian and colleagues (2000) is widely used in human factors. Although their questionnaire does not directly rest on any pervasive theory, in Jian and colleagues (2000), researchers asked participants to generate descriptions of trust and evaluate words related to trust and distrust, examining relationships between the elicited words and the word “trust,” and quantified similarity of paired words. This empirical process resulted in a 12-item scale with trust and distrust dimensions. A later study showed that the Jian et al. (2000) scale measures trust and distrust as distinct factors (Spain et al., 2008).
Alternatively, Madsen and Gregor (2000) designed and tested a psychometric instrument to measure human-computer trust from existing trust theories (e.g., Mayer et al., 1995; Rempel et al., 1985). Using the nominal group technique (Delbecq et al., 1975), experienced computer users generated factors that they associated with human–computer trust. Madsen and Gregor (2000) refined these user-generated factors using several techniques, including comparison to previous theories, interrater reliability judgments (Thurstone scaling technique; Moore & Benbasat, 1991; Neuman, 1994), and a principal components analysis. The resulting scale included five dimensions (perceived reliability, perceived technical competence, perceived understandability, faith, and personal attachment) and consisted of 25 items rated on a 12-point Likert scale from “Not at All” to “Very Much” (Madsen & Gregor, 2000).
Recognizing the psychometric qualities of Madsen and Gregor’s (2000) scale and a plausible connection between identified factors and the theoretical perspective outlined by Lee and See (2004), Chancey and colleagues (2017) re-classified “perceived reliability” as “performance-based trust” (predictability or ability; what the automation does; trust in the actions of the agent), “perceived understandability” as “process-based trust” (dependability or integrity; how the automation works; trust in the agent, not the actions), and “faith” as “purpose-based trust” (faith or benevolence; why the automation was developed; trust in the agent, irrespective of past behaviors), a scale referred as Chancey et al. (2017) scale. Using a sensor-based signaling system task, Chancey and colleagues (2017) examined the effects of factors of miss/false alarm rate and risk on trust (i.e., performance, process, and purpose), compliance (i.e., operator response when a signal is issued), and reliance (i.e., operator refraining from a response when the system is silent or indicating normal operations) using mediation and moderated-mediation analyses. Indirect effects indicated that the factors of trust mediated the relationships between false alarms and compliance, but not reliance (as hypothesized). This suggests the Chancey et al. (2017) scale is reliably impacted by miss/false alarms (e.g., mistakes impact trust), and in turn the scale predicted compliance (e.g., trust produces changes in behavior). Additionally, serial mediation analyses (Hayes, 2017) indicated the indirect effect of performance, process, and then purpose, demonstrating that compliance rate was influenced through each of the three bases of trust significantly and sequentially (Chancey, 2016). This suggests distinct factors exist within the Chancey et al. (2017) scale, and the factors uniquely account for performance differences, such as compliance rate. Moreover, Chancey et al. (2017) found the scale showed adequate internal consistency for trust (α = .97) as well as for the modified scale’s factors: performance (α = .96), process (α = .91), and purpose (α = .93).
The Chancey et al. (2017) scale has been used in several additional experimental works (e.g., Chancey & Politowicz, 2020; Karpinsky et al., 2018; Politowicz et al., 2021; Sato et al., 2020). For instance, Karpinsky and colleagues (2018) examined the impact of task load on perceived trust towards imperfect automation in a flight simulation task. In their experiment, participants performed a continuous tracking task using a joystick while monitoring four gauges representing the state of two engines of the aircraft. An imperfect automated system alerted the operator at a reliability level of 70%. The results showed that the operators rated trust levels lower when visual demand of the tracking task was greater, demonstrating the measure is sensitive to detecting impacts on trust. Most critically, the high task load lowered trust ratings only on the performance and process dimensions but not on the purpose dimension, suggesting some independence between the dimensions.
Current Study
Although human–automation trust is considered a critical factor in successful human–automation interactions, research on psychometric qualities and relationship among human–automation trust scales currently available in the literature is still lacking (Bolton, 2022). Human–automation trust scales (e.g., Chancey et al., 2017; Jian et al., 2000) are widely used to measure the same construct, human–automation trust, in human factors studies. However, when employed together, researchers have found that discrepancies arise (e.g., Sato et al., under review). Each of these scales was developed, either empirically or theoretically, to include distinct dimensions. To date, though, no research has used a data-driven approach such as confirmatory factor analysis (CFA) to examine the dimensions that exist within the scales. Additionally, there is still a gap in understanding how theoretical dimensions of trust (i.e., performance, process, and purpose) might relate to empirically derived dimensions of trust (i.e., trust and distrust).
The current study compares the two scales using existing data from previous experiments conducted in our laboratory. Specifically, using multilevel CFA, this study examined how Jian et al. (2000) and Chancey et al. (2017) scales of human-automation trust conform to the hypothesized models using a new sample of participants. Specifically, the multilevel CFAs allowed us to examine how well the items correspond to each other within each scale, and the correlation between the two scales to examine whether they operationalize trust in the same way.
Experiment Summaries
Summaries of the Four Experiments Included in the Current Analysis.
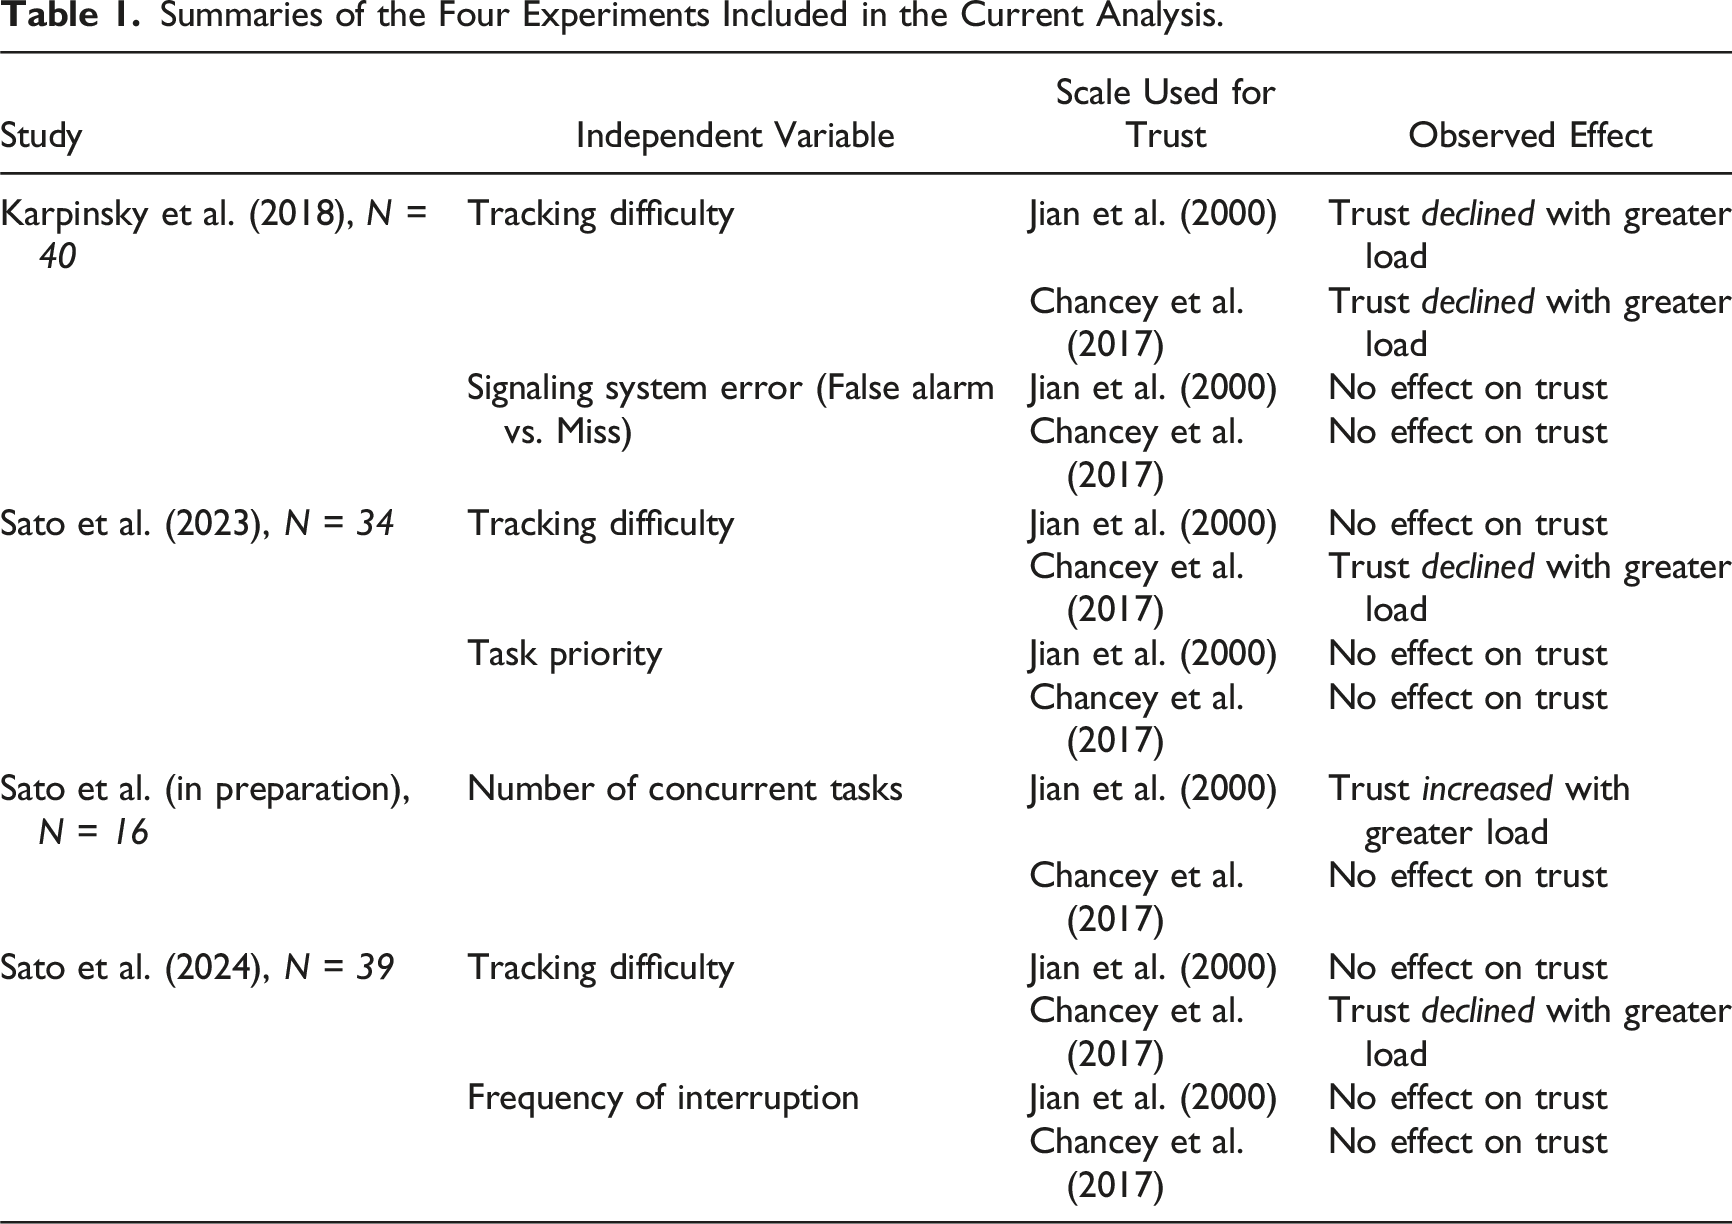
Karpinsky et al. (2018). This experiment studied the relationship between trust in an imperfect signaling system and allocation of visual attention using the Multi-Attribute Task Battery II (MATB-II; Santiago-Espada et al., 2011). Participants performed the compensatory tracking task with varying levels of task difficulty while responding to the system monitoring task assisted by an imperfect signaling system with reliability of 70%. Results showed that automation trust declined for both scales when the tracking task difficulty was high.
Sato et al. (2023). This experiment used the MATB-II to investigate the impact of task priority on automation trust. Participants were asked to perform the tracking task, the system monitoring task aided by an automated signaling system, and the fuel management task in either the equal priority or tracking priority conditions. In the equal priority condition, participants equally prioritized the three tasks. In the tracking priority condition, participants prioritized the tracking task more than the other two tasks. Results showed that, using Chancey et al.’s (2017) trust scale, prioritization of the tracking task eliminated the effect of task load on performance-based trust in automation. However, this effect of task priority was not confirmed using Jian et al.’s (2000) trust scale.
Sato et al. (in preparation). Using the MATB-II, this experiment explored the impact of the number of concurrent tasks on automation trust and attention allocation. Participants performed the tracking task and the system monitoring task with an automated signaling system as in the previous studies above with or without the fuel management task. Results using Jian et al.’s (2000) trust scale showed higher trust ratings among participants when concurrently performing the three tasks compared to performing two tasks. However, ratings measured via Chancey et al.’s (2017) scale showed comparable trust levels between the two experimental conditions across the three bases of trust.
Sato et al. (2024). This experiment using the MATB-II tested whether frequency of interruptions impacts automation trust. Participants performed the tracking task and the system monitoring task assisted by an automated signaling system. During each of the two 20-min trials, participants were interrupted by the communication task either 16 times or four times where they listened to auditory stimuli and tune the radio to a target frequency. Ratings measured by Chancey et al.’s (2017) scale showed the effect of task load on automation trust, replicating Karpinsky et al. (2018) while ratings measured by Jian et al.’s (2000) scale did not. No effect of task interruption was observed in either scale.
Method
Participants
Participants were 129 undergraduate students (94 females, mean age = 20.64 years, SD = 4.11 years) recruited from the community of Old Dominion University (Norfolk, VA) for participation in one of four studies (i.e., participants took part in only one of the four studies): Karpinsky et al. (2018); Sato et al. (2023); Sato et al., under review; Sato et al., 2024. All participants received course credit for their participation. This research complied with the American Psychological Association Code of Ethics and all four studies were approved by the Institutional Review Board at Old Dominion University. Informed consent was obtained from each participant.
Scales
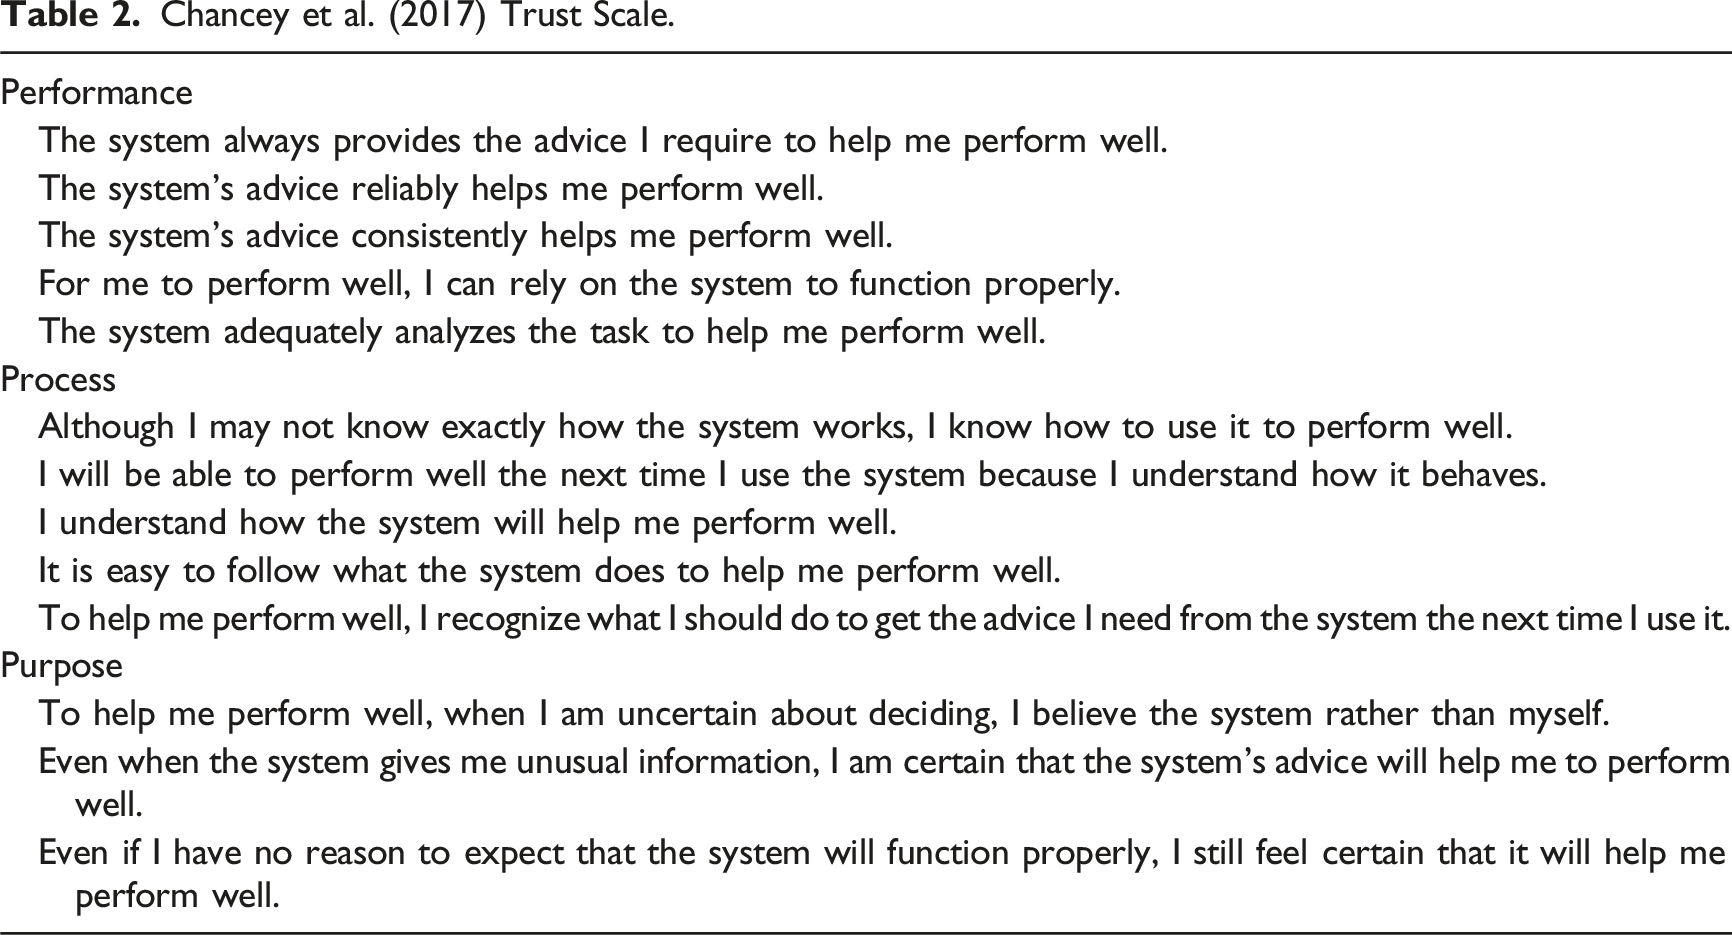
Chancey et al. (2017) Trust Scale.
Jian et al.’s (2000) Trust Scale.
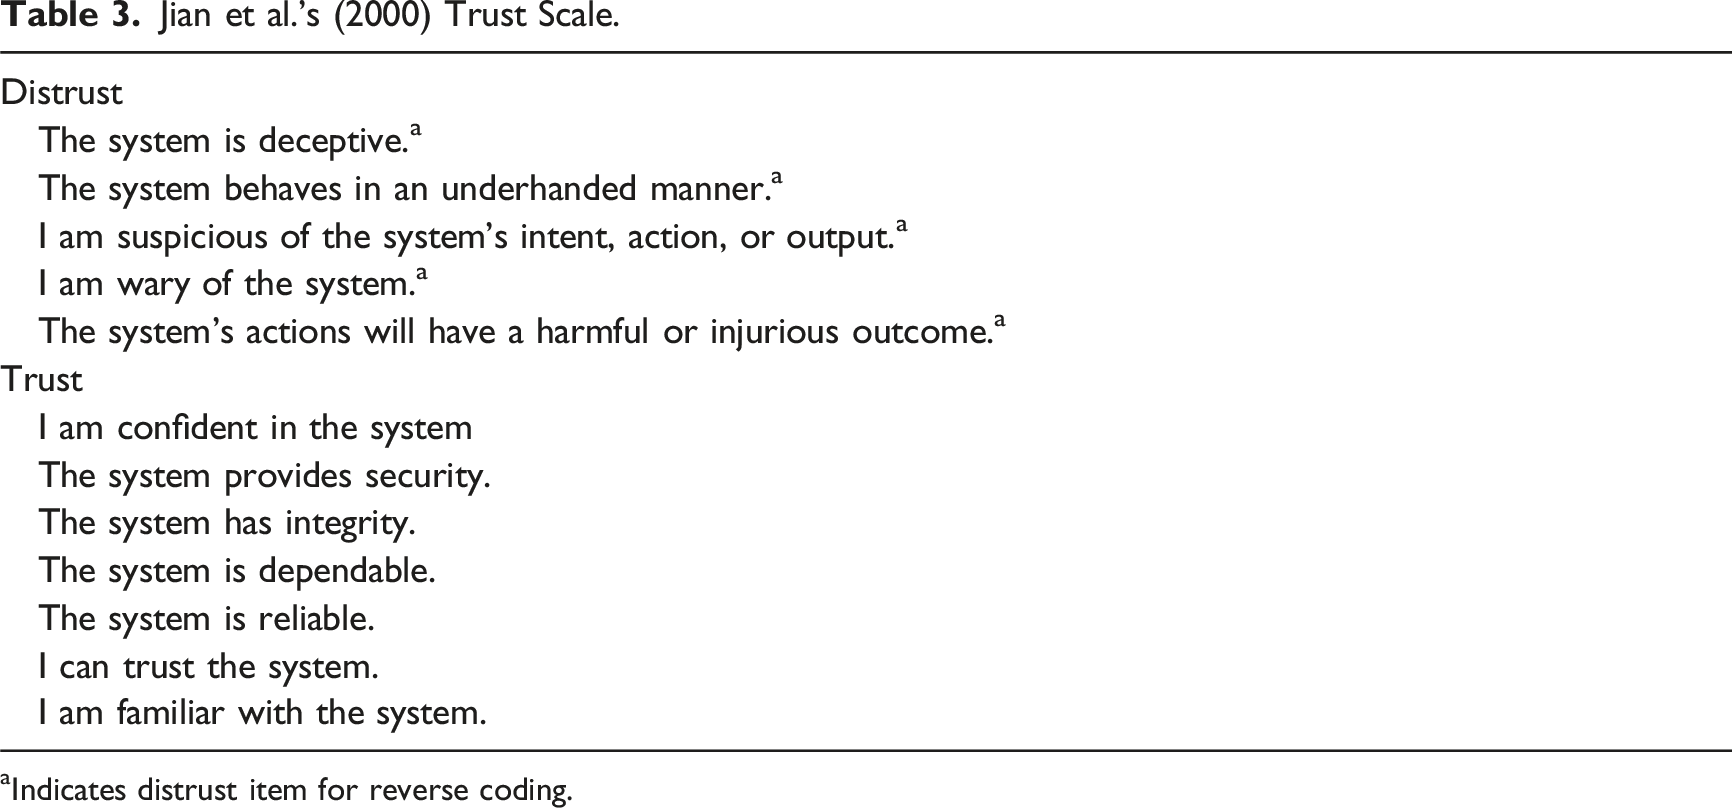
aIndicates distrust item for reverse coding.
Analysis approach
The current study analyzed trust data from the four previously published studies described above. Given that dimensionality of both scales is already known based on prior work (Jian et al., 2000; Madsen & Gregor, 2000), a CFA approach was used to examine if the proposed factor structures fit the current sample. CFAs examine how well each item on a scale corresponds with the latent factor it represents via the factor loading. Low standardized factor loadings (near zero) indicate that the way participants respond to that item is not similar to the way participants respond to other items for that factor. High standardized factor loadings (near one) indicate that the way participants respond to that item is very similar to how they respond to other items for that factor. Consistently high factor loadings across items within a factor indicate the items reflect a cohesive latent construct. CFAs allow for multiple latent factors to reflect that a scale may have multiple dimensions (related but distinct characteristics of the overall construct). Because multiple responses/trials were nested within individuals in the four experiments (i.e., a multilevel design; Raudenbush & Bryke, 2001), a multilevel CFA (Li et al., 1998) was conducted to examine the factor structures of both trust scales. Performance-, process-, and purpose-based trust were modeled as first-order latent variables defined by the corresponding items from the Chancey et al. (2017) scale (see Table 2 for a listing of items that served as indicators for each factor). A second-order factor model was specified, where these latent variables served as indicators of a second-order factor of trust for this scale. Similarly, trust and distrust latent variables were defined by corresponding items from the Jian et al. (2000) scale (see Table 3 for a listing of items that served as indicators for each factor), and these latent variables served as indicators of a second-order factor of trust for the Jian et al. scale. The correlation between the two second-order factors was estimated. This allows for a direct examination of how similarly participants responded to the two measures (i.e., if someone high on trust as defined by performance-, process-, and purpose-based trust is also high on trust as defined by trust versus distrust). See Figure 1 for a depiction of this model. Second-order multilevel confirmatory factor analysis of both trust measures.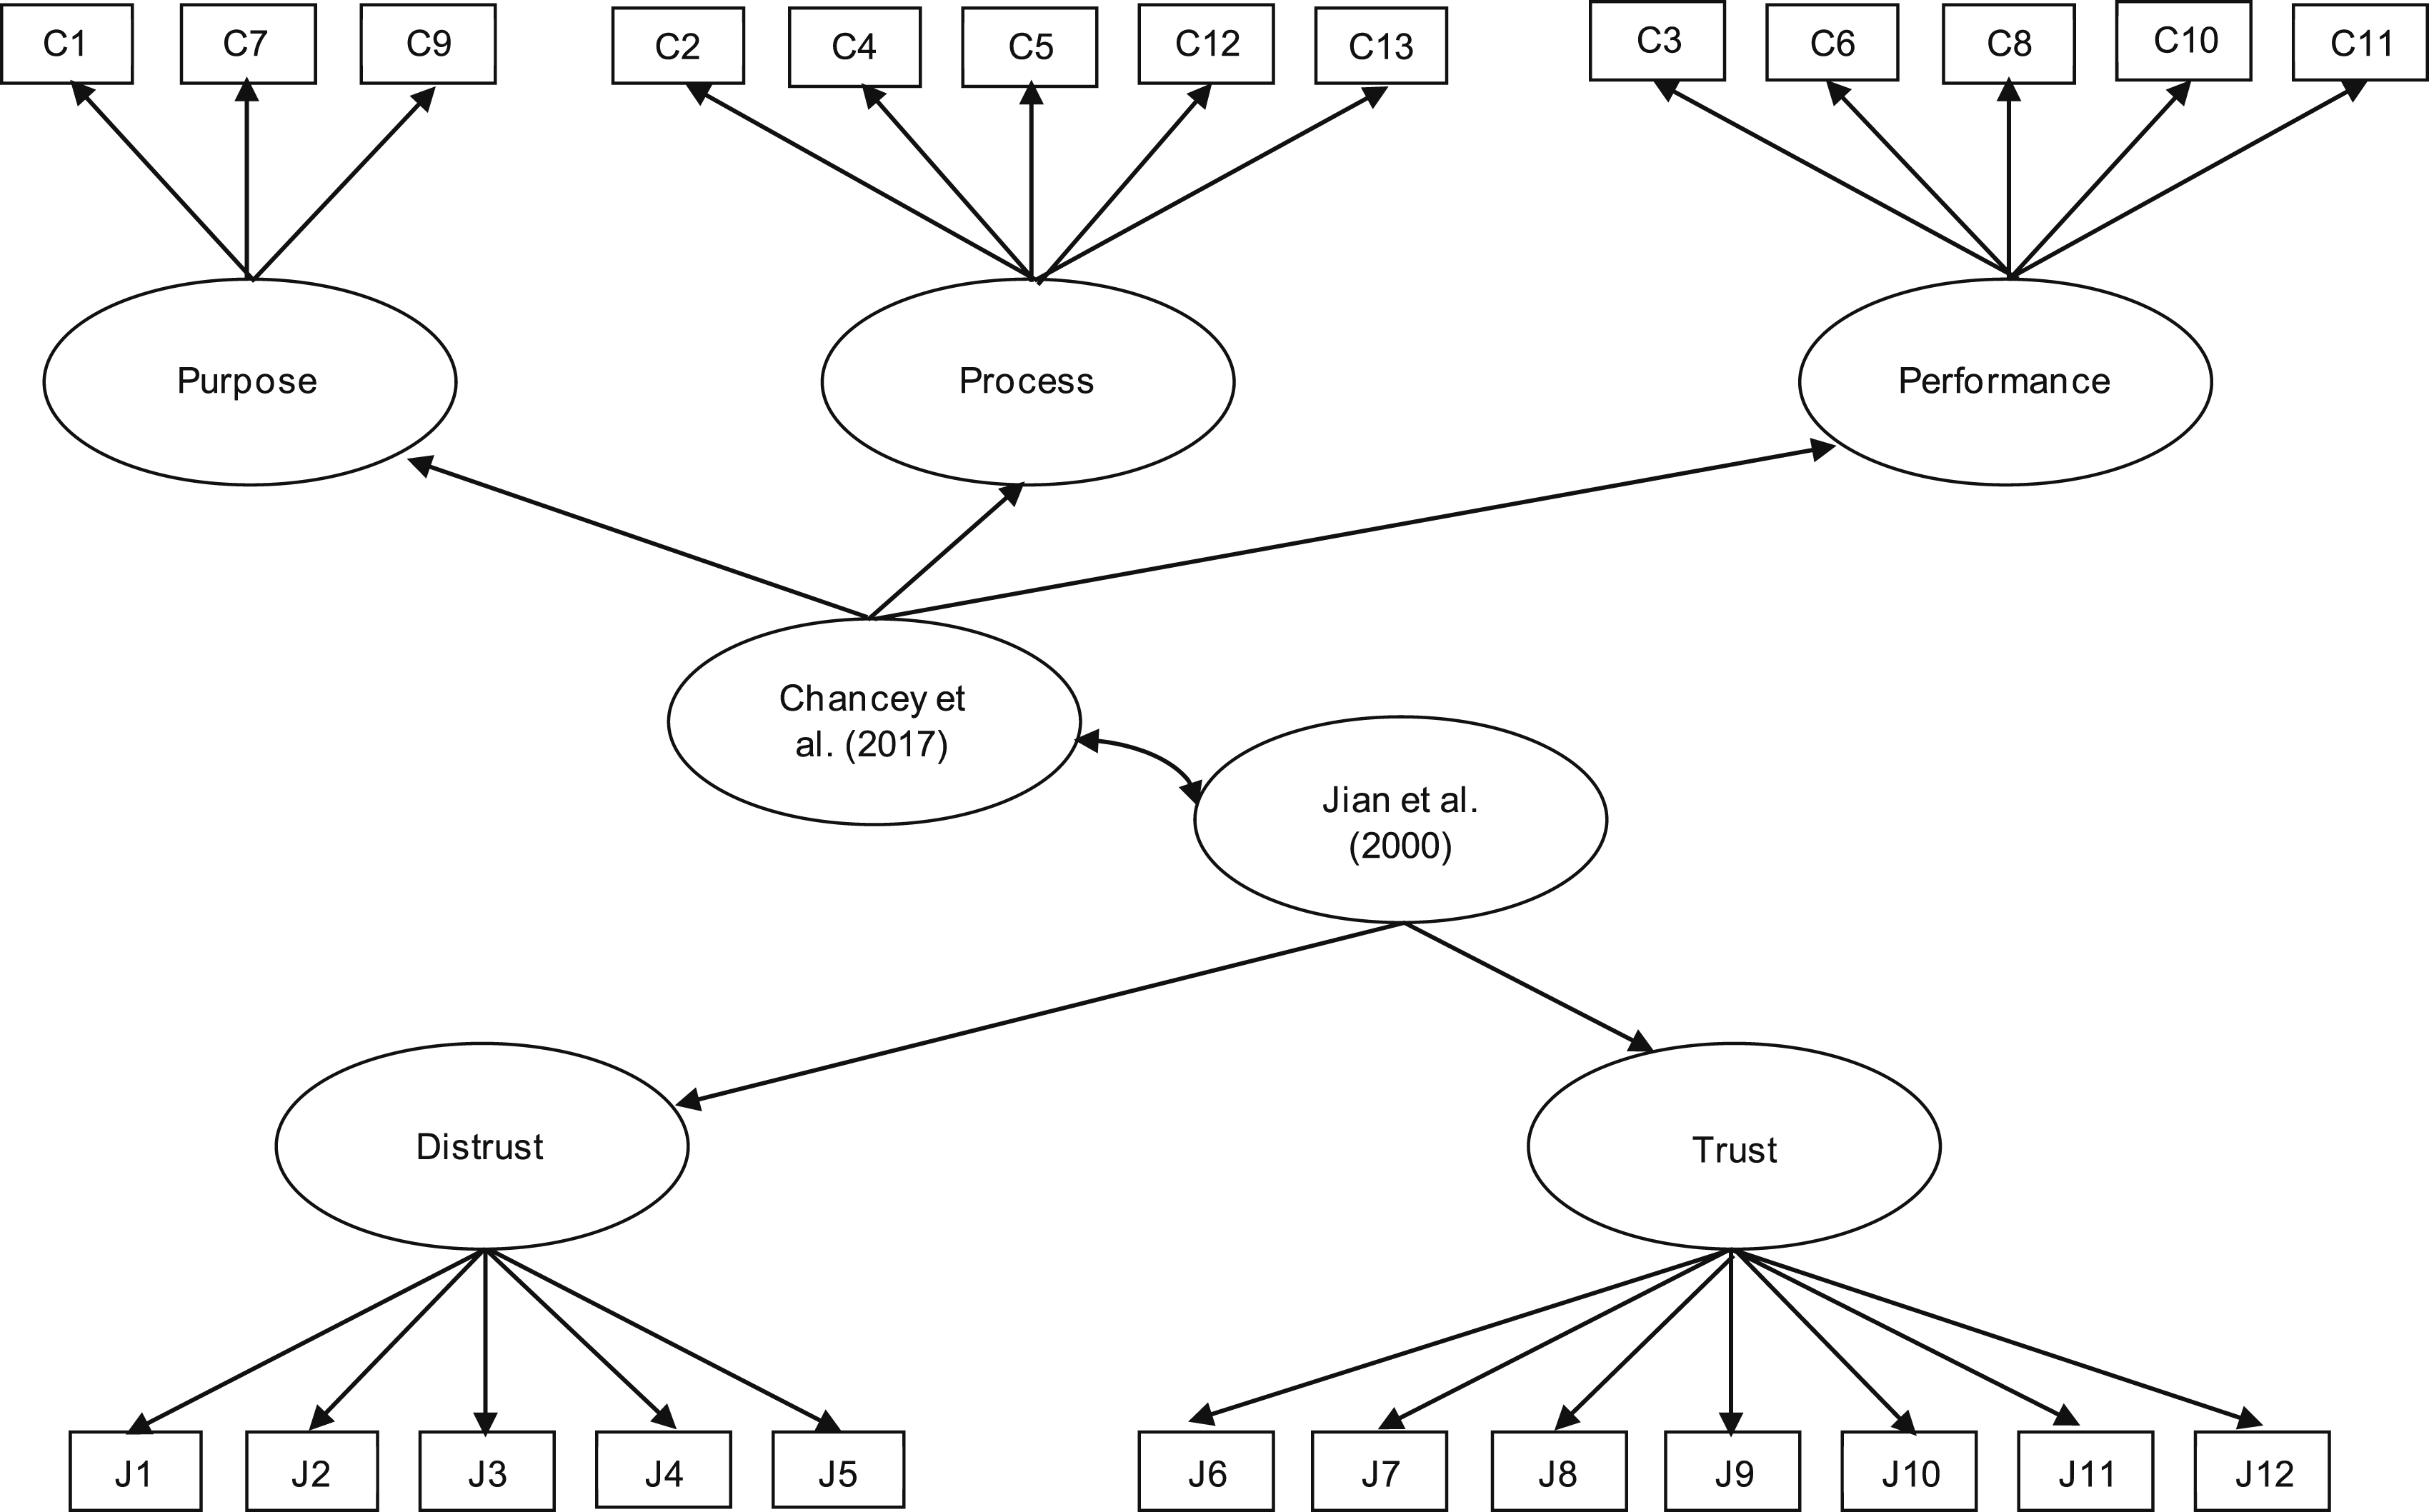
The same model was specified at both levels of analysis (within-person versus between-person). This means the same latent variables are represented within-person (capturing any differences across trials) and between-person (capturing any differences across individuals). For all first-order latent factors, a fixed factor approach was used (fixing the variance of the latent factor to 1 and allowing all item loadings to be freely estimated). For the higher order latent factors, the first loading was fixed at 1 to scale the factor, and the others were freely estimated. After confirming all items were normally distributed, robust maximum likelihood estimation was used. Analyses were conducted in Mplus version 8.4 (Múthen & Múthen, 1998–2019). For each factor loading, a 95% confidence interval (CI) was computed. Model fit was evaluated using the Comparative Fit Index (CFI), Tucker-Lewis Index (TLI), Root Mean Square Error of Approximation (RMSEA), and the standardized root mean square residual (SRMR). A model with adequate fit would have CFI greater than .90, TLI greater than .95, RMSEA less than .06, and SRMR less than .08 (Hu & Bentler, 1999). The overall model fit would indicate if the decisions made regarding which items load onto which factors were generally good, or if the model should be respecified in some way (e.g., if some items should be dropped for not corresponding well with the others, or if a second-order factor of overall trust is not well-defined by the first-order dimensions). Finally, to examine correlations among subscales for both measures, another multilevel CFA was conducted. Rather than include a second-order factor to represent overall trust as assessed by each scale, instead all factors representing subscales were allowed to correlate.
Results
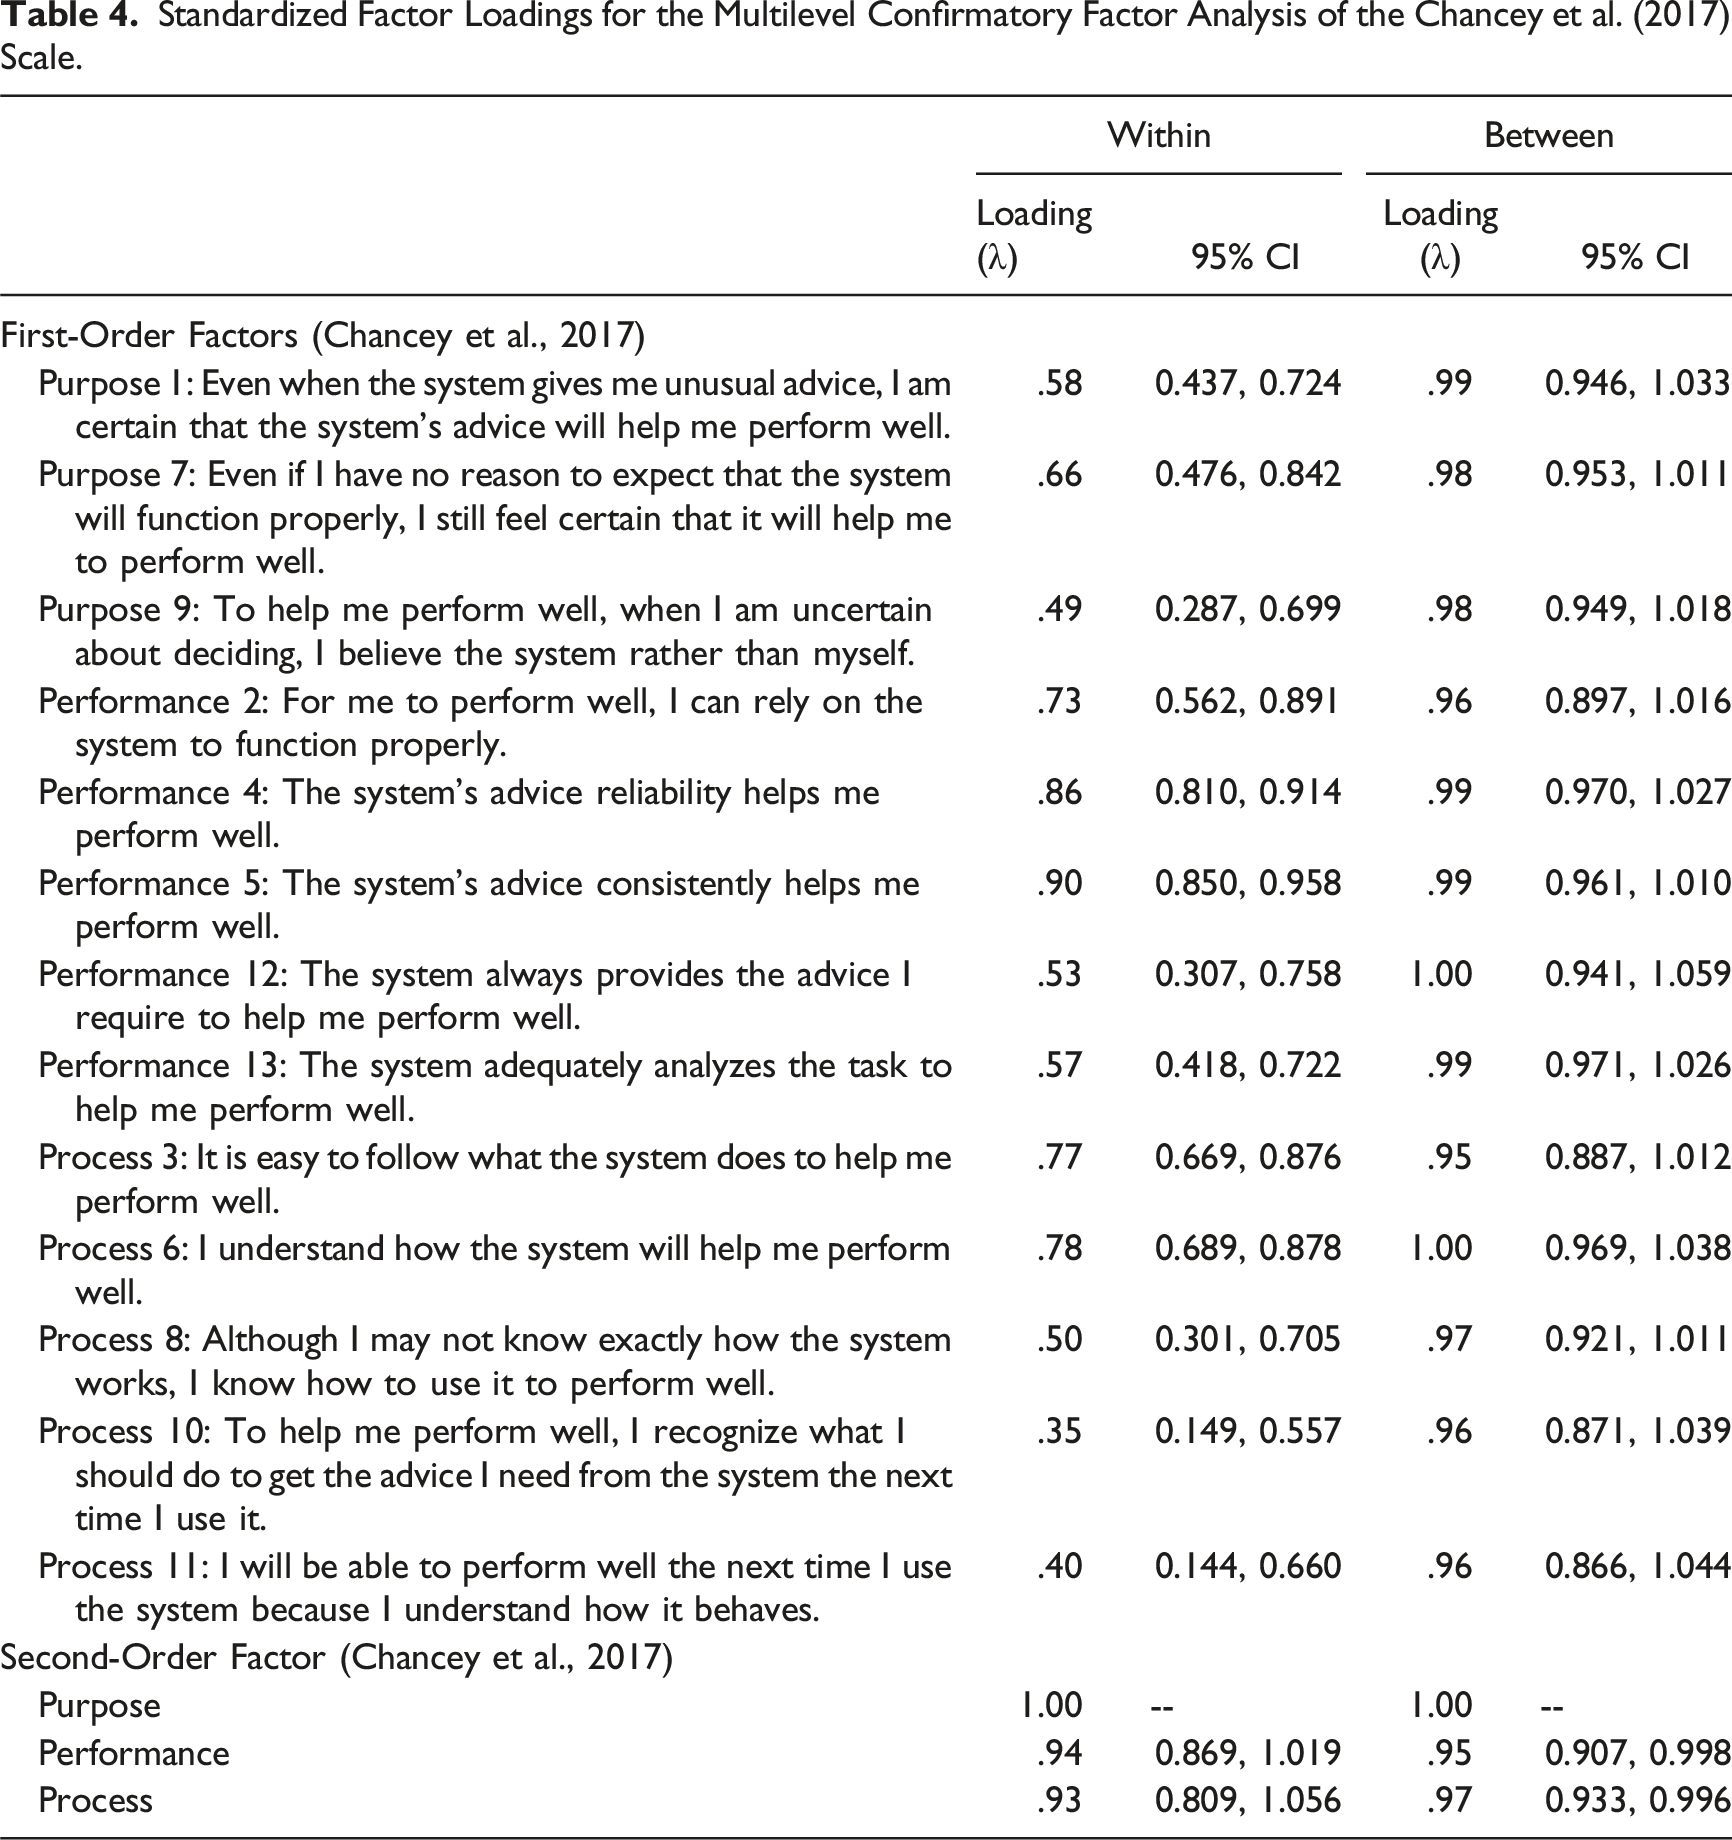
Standardized Factor Loadings for the Multilevel Confirmatory Factor Analysis of the Chancey et al. (2017) Scale.
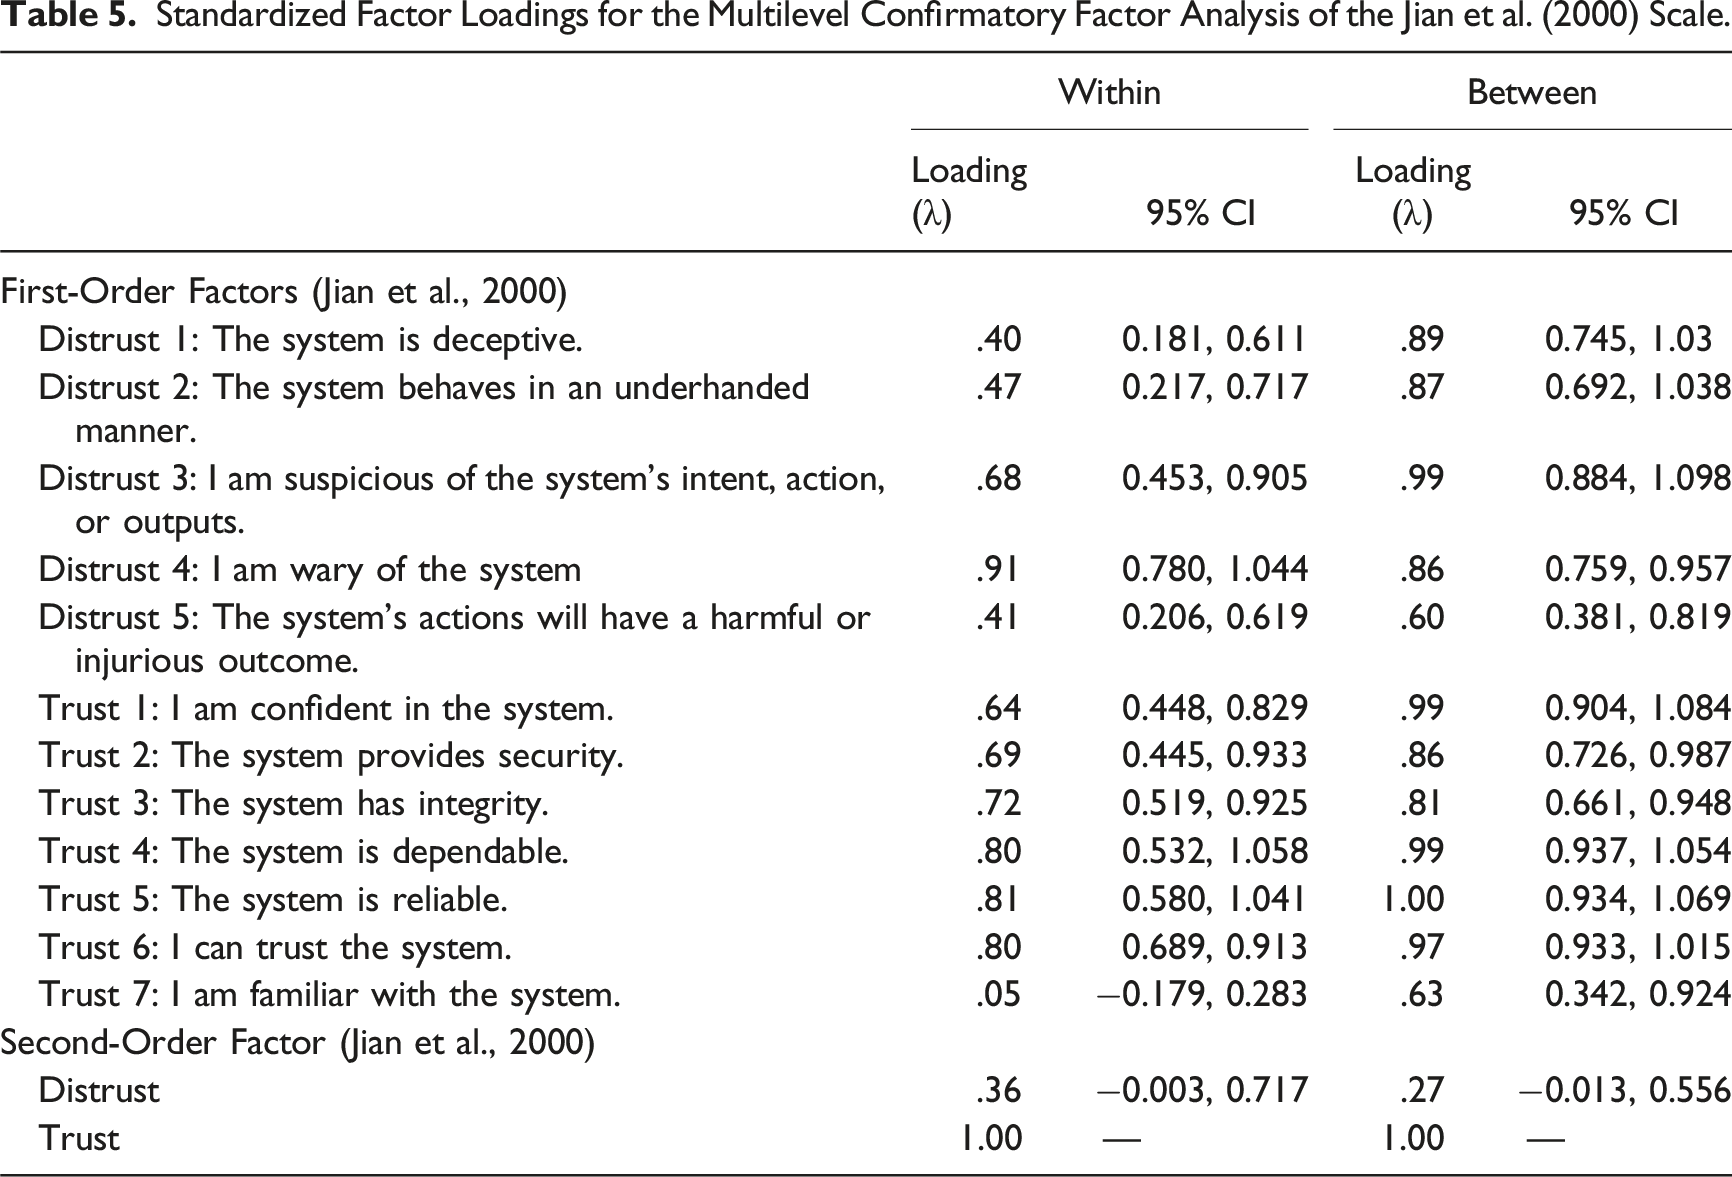
Standardized Factor Loadings for the Multilevel Confirmatory Factor Analysis of the Jian et al. (2000) Scale.
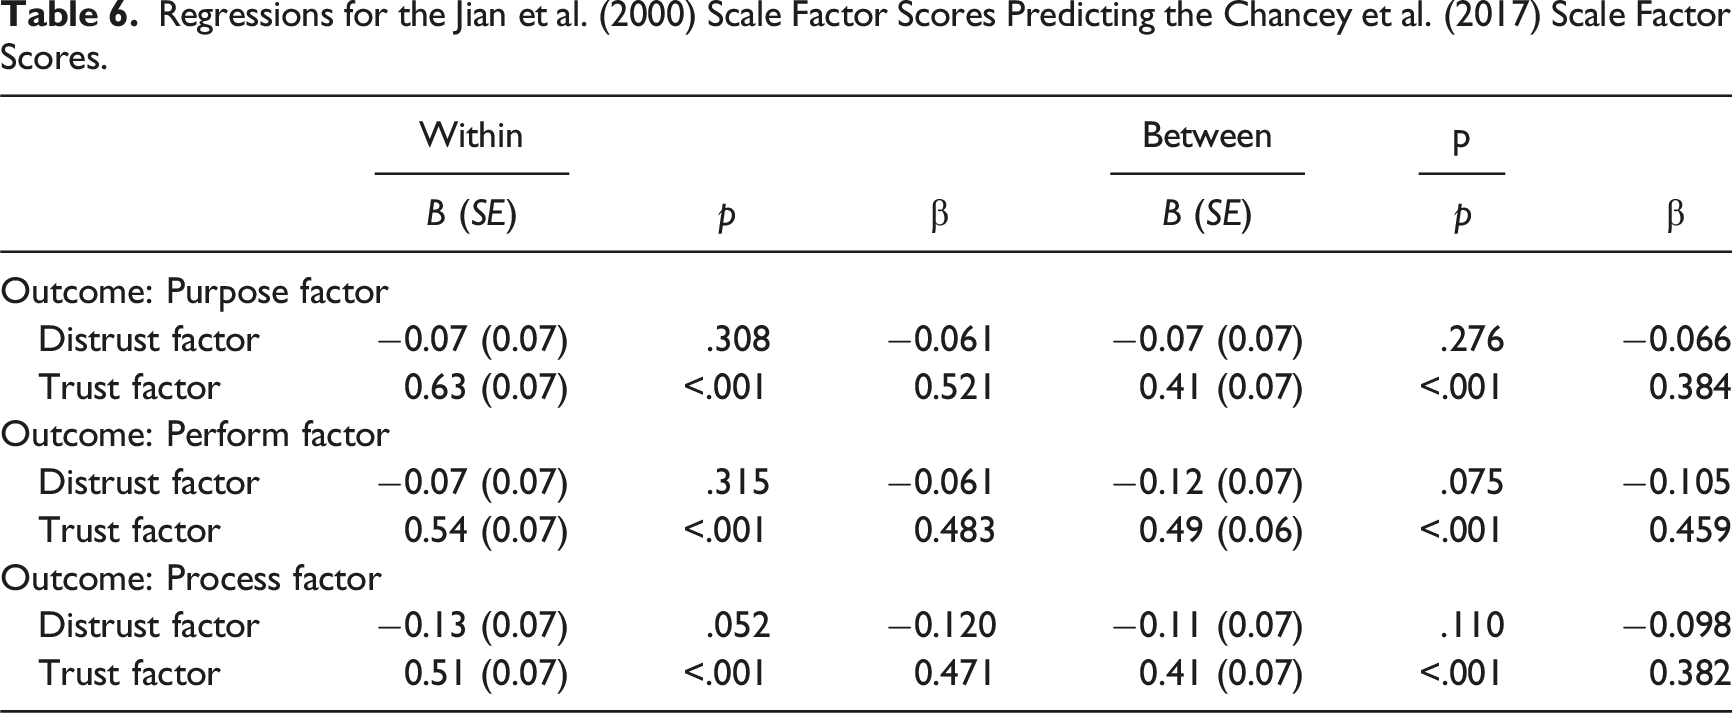
Regressions for the Jian et al. (2000) Scale Factor Scores Predicting the Chancey et al. (2017) Scale Factor Scores.
Correlations Among Factor Scores in a Multilevel Confirmatory Factor Analysis of the Jian et al. (2000) and Chancey et al. (2017) Scales.
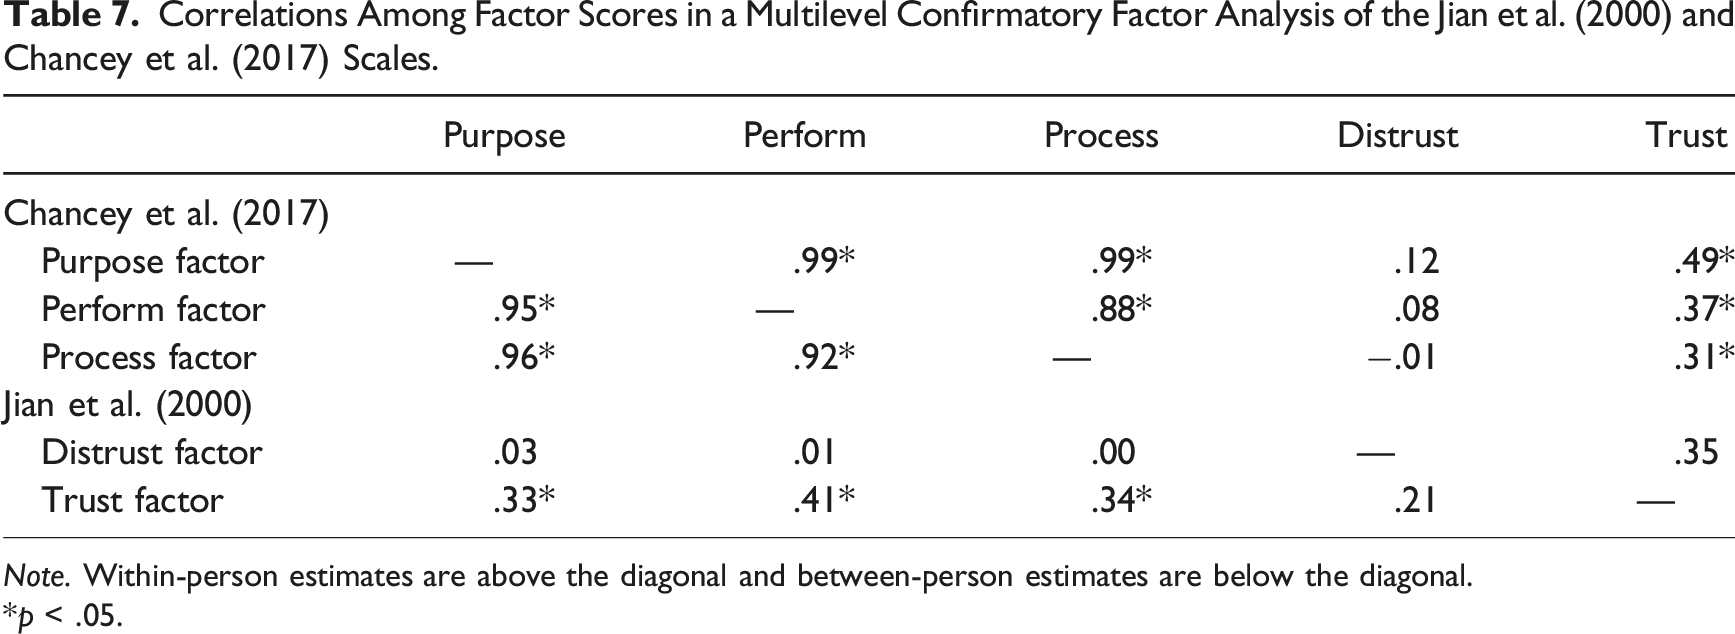
Note. Within-person estimates are above the diagonal and between-person estimates are below the diagonal.
*p < .05.
Discussion
The current study used a multilevel CFA to explore the factor structure of an empirically-driven trust scale, Jian et al.’s (2000) scale, and a theory-driven trust scale, Chancey et al.’s (2017) scale. We reanalyzed data from 129 participants from four low-fidelity flight simulator experiments that involved the identical automated alerted-monitor system with high, but imperfect, reliability. Three points can summarize the results.
First, the results confirm the hypothesized factor structures for both trust scales. For the Jian et al. (2000) scale, corroborating the finding of Spain et al. (2008), the data show support that trust and distrust are distinct factors, and likely two separate constructs. In other words, distrust is not the inverse of trust (which would have been represented with a very strong negative loading) but may actually be a separate construct that is only loosely correlated with trust. Additionally, for the Chancey et al. (2017) scale, the data also demonstrate evidence that there exist three distinct factors, labeled as performance, process, and purpose, as hypothesized based on Lee and See’s (2004) triadic model of automation trust. This finding confirms that the Chancey et al. (2017) trust scale is appropriate use for measuring the three bases of trust.
Second, the multilevel CFA revealed a significant but weak association between the two scales. This result indicates that the two scales likely measure different constructs of human-automation trust with fairly small correlations. This was largely driven by the distrust factor in the Jian et al. (2000) scale, which did not predict any of the factors from the Chancey et al. (2017) scale. Yet, showing some overlap, Jian et al.’s (2000) trust factor did significantly predict all three of the Chancey et al. (2017) factors, with small-to-medium effects. Indeed, the distrust factor may simply not be congruent with the performance, process, and purpose bases of trust outlined in Lee and See (2004), whereas Jian et al.’s trust factor may have some predictive value. Importantly, the results indicate that the triadic factor structure of the Chancey et al. (2017) trust scale, which is theoretically congruent with the foundational work by Lee and See (2004), does not align with the dual factor structure in the Jian et al. (2000) trust scale. The current results thus suggest that distrust items in Jian et al. (2000) measure a construct distinct from that measured by the trust items in Jian et al.’s (2000) scale and Chancey et al.’s (2017) scale. This casts an important question of what trust actually means and when the two questionnaires can be used for different types of interaction with automation.
Third, Jian et al. (2000) developed the trust scale to measure trust and distrust which has been widely implemented in human factors research. Although the scale was empirically developed, results of the scale have informed design recommendations and decisions in many domains, ranging from highly automated driving (Hartwich et al., 2019) to wearable fitness technology (Rupp et al., 2016), highlighting its practical value.
However, the current findings suggest that these recommendations based on data using the Jian et al. (2000) trust scale as a singular measure of trust and distrust as opposites on a continuum may not be accurate (i.e., they are two separate constructs. cf. Spain et al., 2008). If trust and distrust are at the ends of a continuous underlying dimension, then factors that promote or degrade trust will have the opposite effects on the distrust dimension (i.e., higher trust scores should lead to lower distrust scores). Practically, an aggregate measure of trust from the Jian et al. (2000) scale could be derived by reverse coding the distrust measures. Yet, the results from the CFA showed that trust and distrust are separate constructs, indicating that each can vary independently from each other. From a practical perspective, an aggregate trust score from Jian et al.’s (2000) scale may not be appropriate. Indeed, trust and distrust have been considered as two separate constructs in other domains (e.g., Conchie et al., 2011; Sitkin & Roth, 1993), with trust being regarded as positive expectations regarding another’s conduct, and distrust as negative expectations regarding another’s conduct (Lewicki et al., 1998). From this perspective, a trustor may have both high trust and high distrust in a trustee, where a person may be assured of another in certain respects but has reason to be highly warry (e.g., “trust but verify”).
An important takeaway from these results is that research that constructs theoretical arguments based on Lee and See (2004) and then attempts to measure trust using the Jian et al. (2000) scale is not appropriate, because the distrust items in the Jian et al. (2000) scale does not necessarily measure the construct that Lee and See (2004) proposed. More research should examine trust-related scales within existing frameworks of human-automation trust to better guide practical and impactful decisions in safety-critical domains using the scales. In addition, further experimentation is necessary for examining how trust as measured in the two scales mediates the effect of automation characteristics (e.g., reliability) on human behaviors such as compliance and reliance (Chancey et al., 2015, 2017; Meyer et al., 2014).
Overall, the multilevel CFA findings verify that the intended distinct dimensions, process, performance, and purpose in Chancey et al.’s (2017) scale and trust and distrust in Jian et al.’s (2000) scale, exist in their respective scales. However, the findings reveal that Chancey et al.’s (2017) scale and Jian et al.’s (2000) scale likely do not measure the same construct of human-automation trust. This finding brings clarity to the discrepancies in findings when the two scales were used together (e.g., Sato et al., 2024). The two scales do not operationalize trust in the same way.
From this, questions emerge about what construct or aspect of human-automation trust each scale is actually capturing. Chancey et al. (2017) was developed from the triadic structure of human-automation trust, a structure echoed from years of cross-domain trust research (e.g., Lee & See, 2004; Mayer et al., 1995; Muir & Moray, 1996; Rempel et al., 1985), and findings from this study support the Chancey et al. (2017) scale does contain three distinct dimensions. This poses an important question regarding similarities and differences that Jian et al.’s (2000) and Chancey et al.’s (2017) scales measure on human-automation trust. A related question is the extent to which these two scales vary in their sensitivity. Rating variability across the four experiments may represent not only differences in the validity of the two scales but also sensitivity, which should be examined in future research.
Several limitations exist in the current study. First, the results suggest that trust and distrust in Jian et al. (2000) scale are distinct in this sample, but future researchers may want to evaluate this for themselves in their samples for generalizability. Second, although widely used to make design decisions and drive human–automation trust theory, findings from this study suggest the Jian et al. (2000) scale is not measuring human–automation trust along theoretical triadic dimensions (cf. Lee & See, 2004; Mayer et al., 1995; Muir & Moray, 1996; Rempel et al., 1985), and importantly, that the distrust items in Jian et al. (2000) scale did not correlate with any of the three dimensions of Chancey et al. (2017) scale. The current results are, however, constrained to studies that use relatively simplistic automation (i.e., sensor-based signalizing systems). Therefore, more research is necessary for determining whether the current results hold for interactions between humans and more complex technologies such as human–robot interactions (Hancock et al., 2011; Nam & Lyons, 2020) and human-autonomy teaming (Chancey et al., 2021; Sato et al., 2022). Lastly, as with many laboratory studies, the studies used in this current analysis include system failures that are randomly generated. These failures are not fully representative of what an operator would encounter in the real world, where failures would have a root cause that the operator could account for, potentially impacting when and how the operator would trust the system. This limitation should be taken into consideration.
Key Points
• We examined the relationship of the constructs measured by Chancey et al. (2017) and Jian et al. (2000) trust scales using a multilevel confirmatory factor analysis. • Results showed that trust and distrust are distinct factors, loading onto the same construct of trust and that performance, process, and purpose are distinct factors, loading onto another. • The analysis suggested that the two scales likely measure different constructs of human–automation trust.
Footnotes
Declaration of Conflicting Interests
The author(s) declared no potential conflicts of interest with respect to the research, authorship, and/or publication of this article.
Funding
The author(s) disclosed receipt of the following financial support for the research, authorship, and/or publication of this article: This research was partially supported by a Cooperative Agreement, Langley Research Center (NIA.COOP.05.202075-202075) to Old Dominion University from NASA’s Autonomous Systems Enduring Discipline under the Transformational Tools and Technologies Revolutionary Aviation Mobility Sub-project. The views expressed are those of the authors and do not necessarily reflect the official policy or position of NASA or the U.S. Government.