
Abstract
The study analyses the debate around the ambiguous relationship between firm size and performance. We explore how productivity varies across firm sizes in the informal sector, where firm size is sensitive to formal regulations. Additionally, the study also looks into the informal firms’ quantity and quality of employment by observing wage and performance dispersion across firm sizes, thus indicating capital accumulation and exploitation. Considering the data limitations, a pseudo-panel data design was adopted by combining the three, only available, independent cross-sectional surveys by the National Sample Survey Office, spanning from 1999–2000 to 2015–2016. Potential issues such as time-invariant unobserved firm-level heterogeneity were accounted for by using panel random effects regression. Using total firm employment and total factor productivity as the primary measures of firm size and performance, we find a positive relationship between the two across all major industries. Our results stand robust against alternative firm size and performance measures. However, this positive association between size and performance indicated capital accumulation (increasing productivity with increasing size) at the expense of labour exploitation (stagnant wages across firm sizes). The obtained findings convey important policy implications for adopting a carrot-and-stick approach for the gradual formalisation of the economy.
Introduction
In the Lewisian ’dual economy’ framework, as the economy develops, the surplus workforce moves from the traditional labour surplus (subsistence) sector to the capital surplus modern (capitalistic) sector (Lewis, 1954). India has also experienced similar trends in its history. As per the ILO estimates, 1 the total share of the agricultural workforce has declined, and non-farm employment has increased over the years. However, the overall share of informal employment in India has also increased. Informal employment can be understood from two perspectives, extensive and intensive margins (Cisneros-Acevedo, 2022). The extensive margin considers informal employment as the total workforce in the informal firms, whereas the intensive margin considers the casual and subcontracted workforce in the formal firms as informal employment. We study employment in informal firms to understand their quantity and quality. This is an important question as it impacts the overall economic development by pulling surplus labour from agriculture and achieving an optimal capital–labour ratio for an overburdened agrarian rural economy.
Policymakers in low- and middle-income countries (L&MICs) 2 balance between supporting small firms and promoting big firms as there are potential advantages for both strategies. Big firms benefit from economies of scale and scope, whereas small firms are more flexible and adaptable to volatile economic scenarios. Economics literature is ambiguous about the relationship between firm size and firm performance. Size makes a firm subject to legal regulations and hence creates a division between formal and informal firms. Increasing firm size increases a firm’s visibility and thus increases the detection risk if operating informally (Ulyssea, 2018).
The decision to choose between small and big firm sizes is even more complex in L&MICs due to the prevalence of weak institutional systems like underdeveloped credit markets, corrupt bureaucracy and inefficient legal systems. Emerging economies are often characterised by a sizeable informal sector, which is often a result of the lack of jobs in the formal sector. Hence, the informal sector in L&MICs is instrumental in solving the problems of unemployment, poverty and inequality (Papola, 1980).
The low productivity levels among the informal firms are often attributed to their small sizes. The literature is generally restricted to the comparative analyses of formal versus informal enterprises rather than analysing the size and performance heterogeneity among the informal firms. It is generally assumed that formalisation is the natural progression for informal firms as they grow, and becoming formal will lead to higher productivity. However, formalisation is not an easy process to follow (De Andrade et al., 2016).
Another debate in informal firm productivity literature asks whether the informal sector is a means of accumulation or exploitation (Maiti & Sen, 2010). The existence of the informal sector creates a conundrum for policymakers as they need to choose between—reducing the size of the informal sector by relocating the maximum possible workers from the informal to the formal sector or supporting the inherent dynamism of informal firms, thus enhancing its vitality. India liberalised trade and licensing policies during the 1990s, which led to easy entry of firms thus increasing competition. Informal firms operate in the same socio-economic environment as formal firms, forming a symbiotic relationship with them (Maiti & Sen, 2010).
We adopt a pseudo-panel data design to analyse the dynamic relationship between firm-size growth and performance by combining three nationally representative, cross-sectional surveys from India spanning from 1999 to 2016. We use total factor productivity (TFP) as our primary measure of performance, since, unlike single productivity measures, it is not influenced by the usage intensity of other omitted factors. Due to the labour-intensive nature of informal firms, we use total employment size of the firm as our primary measure of firm size. To understand the puzzle of exploitation versus accumulation, we also analyse the association between firm size, firm performance and wages.
We find a positive relationship between firm size and productivity. The results are robust for alternative measures of size and performance across all major industrial sectors. Secondly, we find evidence for both accumulation and exploitation; higher productivity leads to higher production and profits with increasing firm size but at the expense of workers’ well-being.
Through our research findings, we wish to reorient the attention towards the harsh reality of the informal sector, which is marginalised and afflicted with several limitations. Until informal firms are productive enough to adopt formalisation, labour well-being remains a question in the informal sector.
Policymakers recognise these issues and strive towards formulating policies that can induce formalisation among the big productive informal firms, thus enhancing labour welfare through labour regulations of the formal sector. However, the impact of such policies on aggregate productivity can only be deciphered unless we analyse firm-level evidence. Hence, the micro relationship between size and productivity has implications for overall industrial productivity. Unfortunately, due to the data limitations, past research was limited in its coverage of the dynamic phenomena of understanding the trade-off between firm size and productivity in the informal sector.
We contribute to the literature by capturing the dynamic process of firm size and performance in the context of informal firms and by analysing the issue of informal sector employment.
Theoretical Considerations
Despite the remarkable economic growth experienced post-liberalisation, the size of the Indian informal sector has not seen any decline as postulated by growth economists. In contrast, the informal sector has contributed significantly to the economy, not just in gross output terms but also as an absorber of periodic economic shocks by acting as the employer of last resort. Moreover, its products are available at a lower cost, thereby serving people in lower-income groups and facilitating employment growth since small firms integrate vertically, thus raising the employment-to-sales ratio (Williamson, 1975). Such findings signify the job-creating potential of informal firms, especially when the formal system has limited capacity to reap the benefits of demographic dividends.
The literature generally finds that the correlation between size and productivity is positive, mainly due to the higher allocative efficiency of big firms and higher fixed costs that generate economies of scale and scope (Bartelsman et al., 2013). Higher fixed costs come from more significant involvement in research and development (R&D) which may help devise efficient operations methods, find new products, explore new markets and deal with bureaucratic red tape. Higher fixed costs may also increase firms’ visibility, thus attracting better quality of human capital/skilled workforce. However, alternative theories suggest that with larger size comes more market power (Shepherd, 1986) which often generates inefficiencies leading to relatively inferior performance (Leibenstein, 1976).
India is unique among the Asian economies for its strategy of industrial development through micro, small and medium enterprises (MSMEs), adopted with the rationale to create a core capital-intensive infrastructure industry along with small labour-intensive consumer goods manufacturers that could be spread across the country in rural and urban locations leading to industrialisation, and to solve the problem of unemployment. As per the Central Statistics Office, the share of MSME Gross value added (GVA) in GDP was 30.5% and 30%, respectively, for 2018–2019 and 2019–2020 at current prices (2011–2012). The majority of these MSMEs are informal, employing about 110 million workers. 3
Firm Size and Firm Performance
The ambiguous nature of the relationship between firm size and firm performance in the literature can be attributed to different measures used for size and performance and the influence of country-specific institutional factors. Popular firm-size measures are market share, asset size, employment size and gross output. Performance measures include labour productivity, gross revenue, employment growth, survival rate and gross profit.
Dhawan (2001) finds that smaller firms in the United States are more productive but have relatively lower survival rates. Baily et al. (1996) find that downsizing employment size hampers productivity gains. Tybout (2000) refers to the size heterogeneity in L&MICs manufacturing sector as ‘Dualism’ and finds limited evidence of its impact on performance. Small Taiwanese firms have similar productivity levels as their larger counterparts (Aw, 2002), contributing significantly towards aggregate productivity growth within their operated industries (Aw et al., 2001). Van Biesebroeck (2005), in his study of nine African countries, finds larger firms to be more productive with higher growth rates.
In contrast, small Ethiopian firms grew relatively faster (Bigsten & Gebreeyesus, 2007). Mazumdar (2009) finds ‘dualism’ in Indian firms since employment was more concentrated in the smallest and largest firms than the mid-sized firms, with the smallest firms being the least productive. Li and Rama (2015) observe a weak correlation between size and productivity due to vast productivity dispersion among small and micro firms, thereby acknowledging the considerable share of such firms in job creation and destruction.
Conceptualising Informality
A distinct feature of L&MICs is that they contain a higher share of informal firms than formal firms. Theoretically, there are two mutually exclusive contesting views regarding informality. The traditionalist, Marxist and Dualist schools, attributes the low productivity levels in the informal sector to economically inefficient allocation of resources mainly due to the small size of informal or unregistered firms (La Porta & Shleifer, 2014). This view defines the informal sector as a source of exploitation of labour. The emerging view, Structuralist, Legalist and Institutionalist Schools, considers the informal sector as an essential medium of production due to the socio-economic milieu where the coexistence of formal and informal sectors is necessary for economic development. More recent research establishes that many firms and workers voluntarily choose informality (Perry et al., 2007). Due to lower regulatory pressure, many entrepreneurs or business owners see the informal sector as a stepping stone to hone their skills before entering the formal sector. In many cases, workers from the formal sector also use their experience to set up informal enterprises (Hoyman, 1987). Thus, the opportunity-driven informal sector can be a means for capital accumulation.
The literature mainly focuses on the broader differences in productivity between formal and informal sectors. The question of how firm productivity varies with firm-size variation within the informal sector is generally neglected. A follow-up question is whether the size-performance relationship is similar between informal and formal firms. We may argue that there are two main channels through which this size-performance relationship works for informal firms. The first channel is the higher allocative efficiency of big firms (Inderst & Shaffer, 2009), which may be limited for informal firms as there is a lesser probability for informal firms to participate in exports directly, create new markets or invest in R&D. However, overall, economies of scale advantage can be generated for big informal firms as well since they can more efficiently combine inputs and are more likely to associate with small formal firms via subcontracts, thus indirectly contributing towards new markets or exports.
The other channel can be through formal sector transition costs, which are classified as evasion and transformation costs (Amin & Islam, 2015). Informal firms can be seen as symptoms of excessive regulations and weak bureaucracy. However, as an informal firm’s size increases, it becomes difficult for the firm to operate informally and avoid such evasion costs as penalties and fines or to stop production and reappear as a new firm. If a big informal firm transitions towards the formal sector, it will incur some transformation costs, such as registration costs, immediate lump-sum taxes and the managerial effort and time required to deal with heavy paperwork and regulatory compliance.
Amin and Islam (2015), in their study of seven African countries, find that small informal firms have relatively higher labour productivity. In contrast, Benjamin and Mbaye (2012) observe that bigger size leads to more productivity, and among the informal and formal West African firms, big informal firms achieve similar productivity levels as their smaller formal counterparts. Similarly, McKenzie and Sakho (2010) find that big informal firm owners who manage to operate informally despite their big size have higher entrepreneurial ability than formal firm owners. Allen et al. (2018) observe a huge productivity gap within the informal sector such that the most productive informal manufacturing firms achieve similar productivity levels as their formal counterparts. Kathuria et al. (2010) argue that post-liberalisation many Indian informal manufacturing firms became more capital intensive over the years despite decreasing productivity.
Empirical Setting
Data
Data for this study come from three rounds of surveys conducted by India’s National Sample Survey Office (NSSO): (i) NSS 55th Round (Informal Non-agricultural Enterprises Survey): July 1999–June 2000, (ii) NSS 67th Round (Unincorporated Non-agricultural Enterprises—excluding construction): July 2010–June 2011 and (iii) NSS 73rd Round (Unincorporated Non-agricultural Enterprises—excluding construction): July 2015–June 2016. Unlike the other NSSO surveys, which are restricted only to the manufacturing sector, these three surveys cover all the significant sectors of the Indian economy, thus providing a richer data source for the unincorporated non-agricultural enterprises in India. Additionally, they cover a significant period from 1999–2000 to 2015–2016.
Starting with NSSO 55th round, 4 we choose only the variables common in all three rounds (Table 1). All the relevant variables, such as Total receipts, Hired Capital, Owned Capital, investment and TFP, are inflation-adjusted using the wholesale price index (WPI) for manufacturing sector firms and consumer price index (CPI) for services sector firms, with 2010 as the base year. 5
Summary Statistics for the Cohorts of the Pseudo-panel.
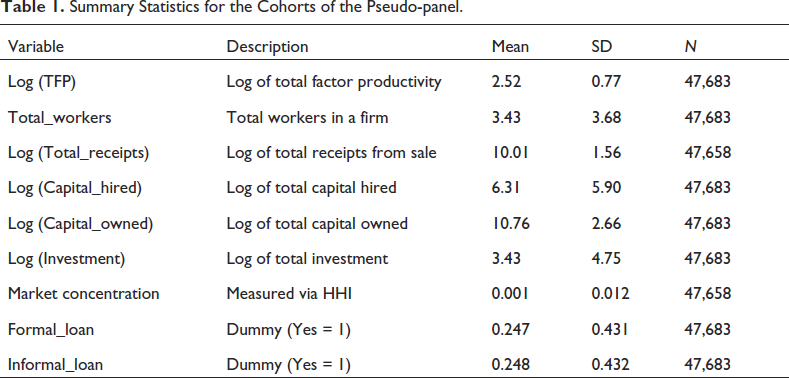
Summary Statistics for the Cohorts of the Pseudo-panel.
Ideally, pure panel data for our analysis would have been more suitable since the relationship between firm size and performance is dynamic in nature. However, panel data on informal firms are seldom available for L&MICs. We, therefore, follow Deaton’s (1985) approach of transforming independent repeated cross-sectional surveys into a synthetic or pseudo-panel by creating a set of cohorts, with each cohort consisting of a group of observations of similar characteristics. However, as we are dealing with independent repeated cross-sectional surveys, the cohort observations (n) are not necessarily the same across all the surveys and the total number of observations (N) also varies across surveys. Hence, we get an unbalanced pseudo-panel dataset. A cohort (c) is the unit of observation in a pseudo-panel. A cohort in our study is a collection of homogenous firms grouped as per some specific selection criteria. Hence, we are analysing cohorts (groups of similar firms) over time instead of studying individual firms over time.
We define our cohorts at a granular level so that selection into a cohort can be as exclusive as possible while keeping enough observations in each cohort (Antman & Mckenzie, 2007). The firms in the dataset are categorised into the following seven criteria: name of the state in which the firm operates (Goa, Assam, Delhi, etc.); industry type (manufacturing, etc.); nature of operations (perennial, casual and seasonal); location of the firm (urban or rural); three quantiles (25th, 50th and 75th) based on employment size; three quantiles (25th, 50th and 75th) based on capital size; and the type of ownership (male proprietor, female proprietor, partnership, etc.).
Based on these seven broad classifications, firms falling under identical categorisations were considered similar and kept in one cohort. In other words, firms operating in the same state and industry, same location, belonging to the same employment and capital size quantile, and having the same ownership type, would fall under one cohort. With the initial count of 820,485 observations among the three independent cross-sectional surveys, 47,683 cohorts we constructed.
It may be argued that pseudo-panels constructed using cohort means are average values for some homogenous firms; hence, an approximation of the population mean with measurement errors. Nevertheless, most authors ignore such errors in empirical applications if the cohort size is sufficiently large (Moffitt, 1993). Furthermore, unlike panel data, the attrition problem in pseudo-panel data is less since individual firms do not need to be the same in each period in the pseudo-panel.
Econometric Methodology
We use TFP as our primary measure for capturing firm performance. TFP, also known as multifactor productivity, defines the existing potential of a firm to produce goods/services without raising the inputs over time. In other words, TFP is simply the measured difference between the output and inputs, for which two key factors are responsible: first, efficient utilisation of available input resources, that is, technical efficiency; second, usage of the latest sophisticated technology. In the case of informal firms, we can safely assume that the primary source of TFP is technical efficiency, as they lack the necessary capital to access expensive and sophisticated technology. We measure TFP using a Cobb–Douglas production function with constant returns to scale:

where Q is the output or revenue; K is capital stock; L is labour force;
TFP is measured by calculating A; TFP = A = Q/Lθ K1–θ (Syverson, 2011). We use the log-transformed production function equation (1.2) to estimate TFP efficiency in transforming. The lowercase letters denote the logarithmic values. A is TFP, representing the firm’s inputs into output.

The following variables were used to estimate the production function: total receipts and total workers for measuring output and labour force, respectively. Capital was divided into hired capital and owned capital. We adopt the semi-parametric method of TFP estimation primarily to address the simultaneity bias concerns that may come under the traditional OLS method if the productivity shock is positively related to the firm’s input use, which the econometrician does not observe but is observed by the firm. This leaves the residual as a biased estimate of productivity. Considering this issue, we adopt the Wooldridge-modified Olley–Pakes method, 6 where proxy variable (investment) is used for controlling the correlation between unobservable productivity shock and inputs usage, implemented through the generalised method of moments approach 7 (Olley & Pakes,1996; Wooldridge, 2009).
Equation (2.1) is estimated using random effects (RE) estimation technique to observe the effect of firm size on productivity. Fixed effects could not be used due to perfect collinearity, as the firm-size categories were one of the criteria used to create the pseudo-panels.


where TFPc t is the TFP of the cth cohort in tth year; TFPc t-1 is the TFP of cth cohort in t−1 year; Firm Size is measured as three categories of firm size; and
As a measure of robustness check, we transformed equation (2.1) as a dynamic panel data model by including the first lag of the dependent variable as an explanatory variable (Udin et al., 2017) and estimated equation (2.2). In addition, a dynamic estimator provides essential checks for potential endogeneity issues that might arise due to the time dependency of TFP (Syverson, 2011).
Market competition in the domestic market is proxied by industry concentration, calculated as Herfindahl–Hirschman Index (HHI)
8
measured at the two-digit industry level
9
with data on total receipts/output/revenue:

where Mkt_conc is the market concentration, ms is the market share, receipts is total revenue receipts or total output, c is the cohort, j is the industry, and s is the state.
Not accounting for the competition from the formal firms is one of the potential concerns regarding using market competition (proxied via market concentration) as a control variable. We provide two primary arguments for this genuine concern. Firstly, our data set does not consist of formal firms. Any other dataset that comes close to the sampling procedure followed by NSSO is the Annual Survey of Industries, which is restricted to manufacturing firms only. Secondly, due to the significant productivity differentials between the formal and informal firms (Kumari, 2022) and the separate category of customers and markets to which the informal sector caters, we can safely assume that informal firms are characteristically different from formal firms.
A similar additional concern may arise due to the non-accounting of agglomeration economies. Ramachandran and Sasidharan (2021), in their study on formal and informal Indian manufacturing firms, find that there are advantages of localisation for both types of firms, with co-location advantages for formal firms only. An insignificant impact of co-location was observed for informal firms.
Next, we explore the mechanisms that may mediate this relationship by analysing the capital accumulation capacity of the informal sector and its exploitative nature. In other words, we analyse the quantity and quality of employment generated by informal firms. We use the NSSO 73rd Round Survey 2015–2016 and study individual firms rather than the cohorts as we did earlier. Informal firms are known for their labour-intensive operations, suggesting an adequate supply of cheap labour. The adequate labour supply further pushes the wages down since minimum wage regulations do not bind informal firms. Therefore, wages earned can serve as a good indicator of workers’ well-being in a firm (Kuroki, 2018). Moreover, the basic microeconomic theory derives marginal productivity of labour to be directly proportional to real wage. Thus, we can use ‘wage’ as a proxy for quality of employment. However, our dataset does not provide information on wages per employee; instead, it provides information on the total emoluments paid by the firm to its workforce, which may be in kind or cash or both. For simplicity, we calculate average wage as total emoluments per labour and estimate the below-mentioned models to get the predicted values of Log(GVA) and Log(Average Wage) to understand the relationship further. We also add, Firm age, as it may impact a firm’s productivity (Badr et al., 2019), and Caste of the owner/major partner, since it may impact economic inclusion (Thorat & Newman, 2007), as control variables.


where i is the ith firm; log(AvgWage) is the log of average wage;
Table 2 shows the RE results with three categories of firms as categorical explanatory variables, with alternative specifications. Regressions (1) and (2) in Table 2 reveal that relative to Small firms,Mid-sized and Big firms are more productive. In other words, we find that both the measures of firm size (based on either employment size or asset size) have a positive impact on firm productivity. We observe that, ceteris paribus, Mid-size firms were 69.3% and Big firms were 150.3% more productive, respectively, than Small firms (regression 1, Table 2). Size based on asset classification, we find that, ceteris paribus, Mid-size firms were 36.2% and Big firms were 64.1% more productive, respectively, than Small firms (regression 2, Table 2).
Summary Statistics for NSSO 73rd Round 2015–2016.
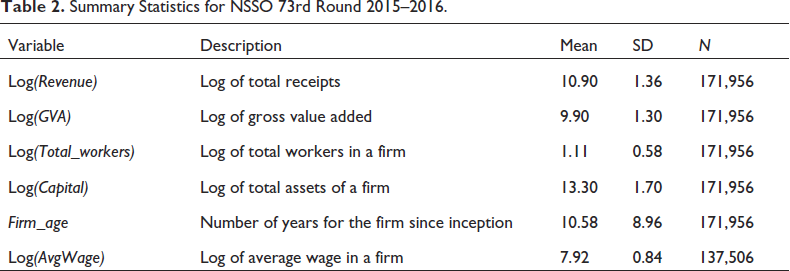
Summary Statistics for NSSO 73rd Round 2015–2016.
Access to loans also shows a positive effect on productivity as timely credit helps in purchasing necessary resources. Exposure to formal credit increases the ability of an informal firm to engage with banks or other financial institutions and makes it easier for the firm to support formal firms with non-core operations or supply them with intermediate inputs. Formal credit often comes with mandatory insurance cover at subsidised rates, which may also hedge the firm’s operational risk in case of credit default (Mund, 2020). Informal loans, especially from moneylenders, are exploitative. However, loans from family and friends or close suppliers may provide timely credit during sudden cash crunch or demand shocks. A similar positive effect of informal financing was also found by Wahab et al. (2022) on small cottage firms in Pakistan. Unfortunately, our dataset does not provide the sources of informal loans for further investigation of this dimension.
As a measure of robustness check, we estimated equation (2.1) as a dynamic panel data model and found similar results. We find that, in terms of employment size, Mid-sized and Big firms were 50% and 110.7% more productive, respectively, than Small firms (regression 3, Table 2). In terms of asset size, Mid-sized and Big firms were 10.6% and 20.9% more productive, respectively, than Small firms (regression 4, Table 2).
Additionally, we also used alternative measures of firm performance like GVA 10 and revenue (total sale receipts or total output revenue) using dynamic panel specification and found similar results. Mid-sized and Big firms were able to generate 68.1% and 131.5% more GVA, respectively, than Small firms (regression 1, Table 3). However, Mid-sized and Big firms were able to generate 74.7% and 136.5% more revenue, respectively, than Small firms (regression 2, Table 3). Similar results are also obtained at various industry-specific levels (Table 4). In Table 4, we also observe the positive coefficient of market concentration for each industry, signifying that as the market concentration of a firm increases, the firm market power increases, thus enhancing its revenue/output/productivity. Market concentration (a proxy for market competition) in the informal sector has specific economic significance. The summary statistics table (Table 1) shows that the variable, market concentration, has a mean value of only 0.001, mirroring a perfectly competitive market. The low mean value indicates the presence of many sellers, each with small market shares; thus, each firm’s activities cannot significantly influence supply, demand and prices in the market (Gwin, 2001).
Main Results with Firm Size as Factor Variable.
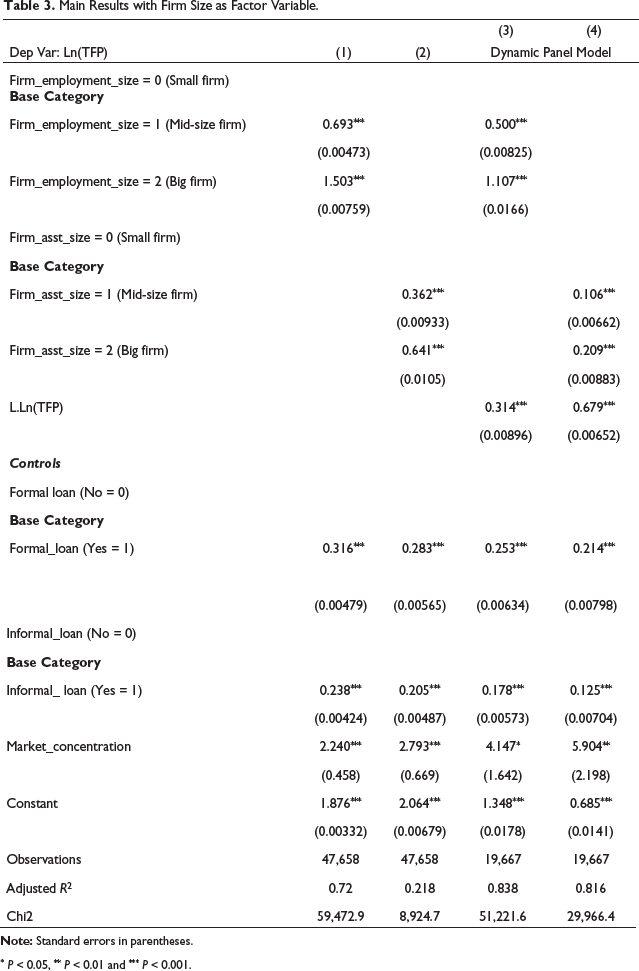
* P < 0.05, ** P < 0.01 and *** P < 0.001.
Dynamic Panel RE Results with Alternative Measures of Performance.
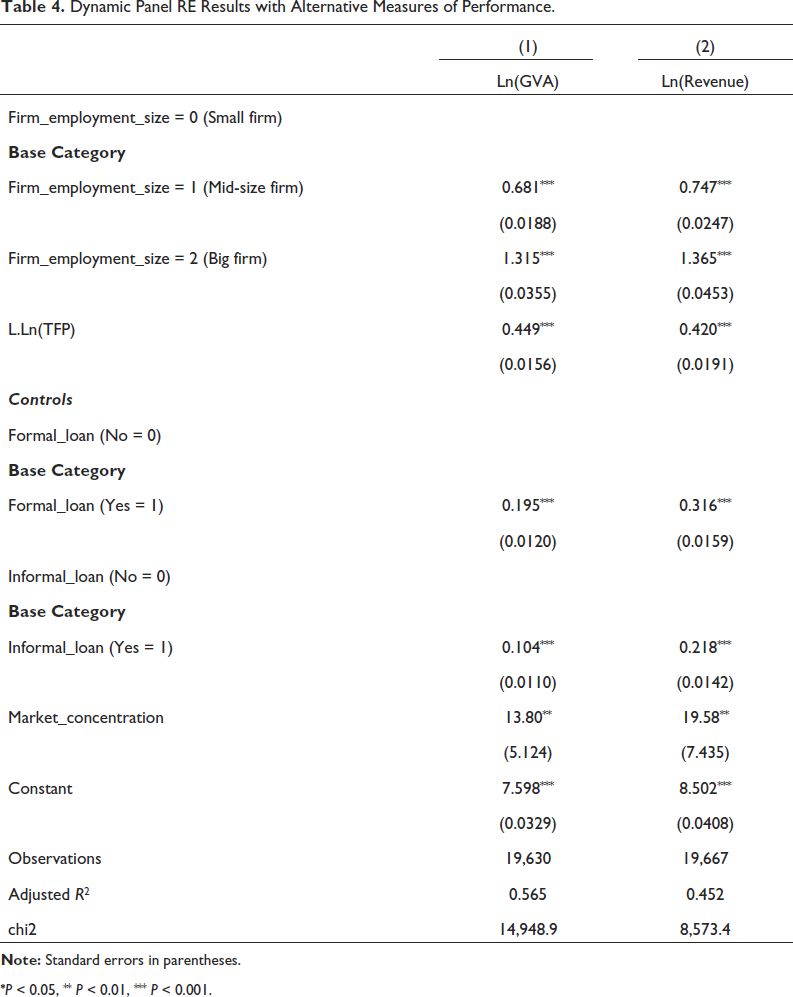
*P < 0.05, ** P < 0.01, *** P < 0.001.
Dynamic Panel RE Industry-specific Results.
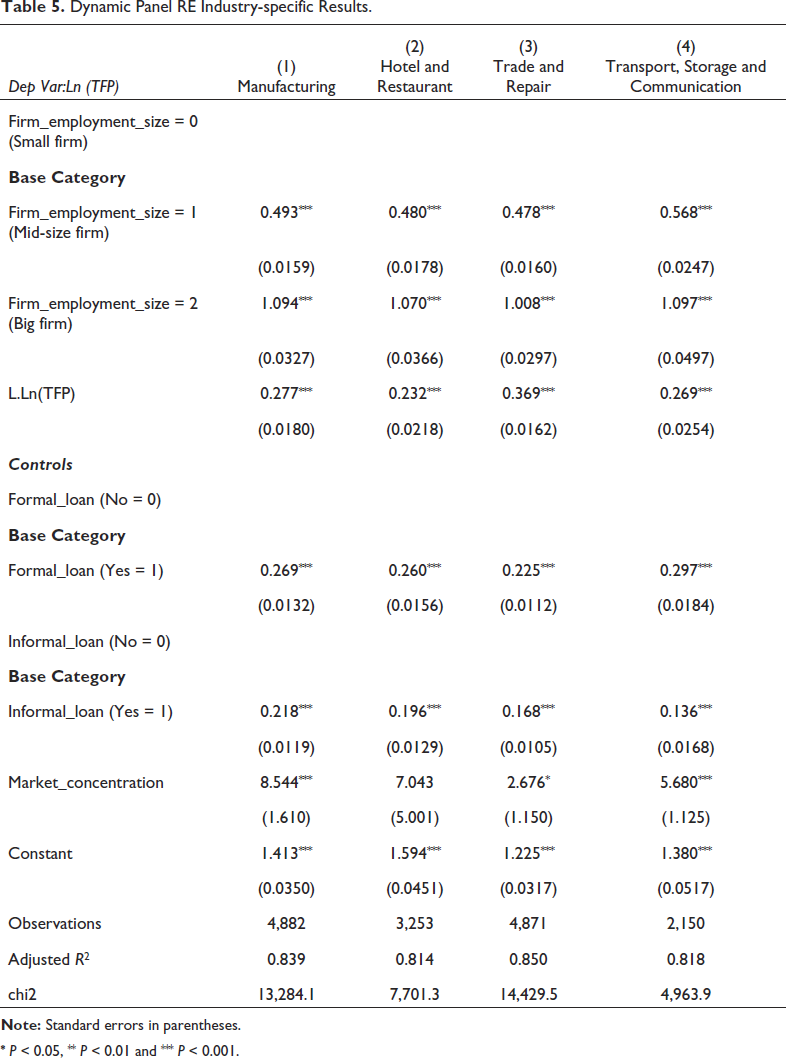
* P < 0.05, ** P < 0.01 and *** P < 0.001.
The low mean value of market concentration also signifies low entry and exit barriers into the market. Firms are price takers having no market power resulting in low prices for the consumers and no economic profits for the producers, thus functioning like an efficient market (Makate et al., 2016). Therefore, informal firms have an important role in the production of goods and services, especially for the consumers belonging to the lower-income strata.
These results show increasing returns to scale among the firm cohorts, that is, there is evidence of capital accumulation with increasing firm size. However, we need to observe the other contesting view of the informal sector being exploitative since the two views are not necessarily mutually exclusive.
From Figure 1, we see that the predicted values of GVA and average wage (from estimating equations 4 and 5) closely follow their observed values (indicating goodness of fit for the models). 11 Further, we observe a significant gap between the GVA and average wage, where GVA increases with firm size, but the average wage is mostly stagnant. A similar pattern was found between revenue and average wage.
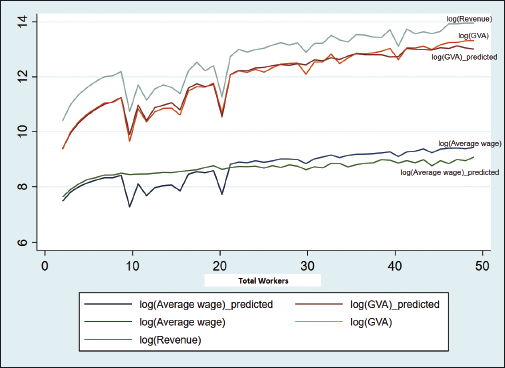
In other words, the average wage in informal firms, across all industries, is mostly stagnant across all firm sizes despite higher returns to firm size, highlighting labour exploitation. We also find an interesting indication of self-sorting by the firms. We observe dips in Revenue and GVA near the firm size of 10 and 20 workers, which happens to be the threshold limit for registration for manufacturing firms, 12 with and without electricity, respectively. A possible explanation for such indications in the literature mentions efficiency losses at the thresholds (Onji, 2009) since it is not cost-effective to be just large enough to attract regulations (Tybout, 2000).
A fundamental issue in development economics is inequality. Following the high growth years, the income distribution in emerging economies has remained skewed. As L&MICs have limited resources, productivity growth at the firm level is one way to increase people’s living standards. Along with various institutional deficiencies, a fast-growing economy like India must also solve the unemployment problem. Unemployment exacerbates inequality in society. With the formal sector’s limited potential to cater to the needs of the ever-increasing workforce, the informal sector can be utilised for this purpose. Hence, understanding informal firm dynamics and their contribution to the economy in terms of employment generation is important.
Firm performance is an essential aspect of overall economic development. Among the various tangible and intangible factors that can impact it, Firm size is an easily observable but debatable factor in the literature due to the ambiguous relationship between size and performance. We find a positive association between size and performance. The results also reveal that apart from formal credit and owned capital, even credit from informal sources positively impacts firm performance, which was otherwise assumed incongruous, indicating the acute deficiency of capital and access to funds that these firms suffer from. By using firm size and average wage as indicators of quantity and quality of employment in the informal firms, we also find evidence for overall capital accumulation with increasing firm size among the informal firms but at the expense of labour exploitation (Sanyal & Bhattacharyya, 2009).
Possible Policy Implications
Formalisation can help implement the minimum wage regulations, at least among the big productive informal firms. Formalisation is observed to be beneficial only to the big productive informal firms (Berkel & Tarp, 2022). However, adopting formalisation as a standard policy might be difficult to implement as formalisation is not an easy goal to achieve.
In the long run, economy-wide structural transformations, such as enhancing human capital through vocational training, increasing bureaucratic efficiency for strict enforcement of regulations, developing institutional infrastructure and making democracy more vibrant, are needed to augment overall productive capacities. In the short run, formalisation returns can be enhanced by favouring formal firms through better institutional support in the form of easy credit, better provision of amenities and robust property rights through a speedy judicial process. In addition, building industrial clusters for small and medium enterprises, like special economic zones, can go a long way in capacity enhancement via knowledge and capital (physical and human) spillover effects.
Smaller informal firms should best be allowed to self-evolve into efficient bigger firms as the stock of human capital (both the owner and workers) also requires time to develop. Moreover, these small informal firms provide an employment source for otherwise marginalised workers. Finally, informal firms can be induced to become formal by a reduction in paperwork and formalisation costs.
The literature remains inconclusive on the impact of formalisation on informal firms. However, our findings observe stagnant wages even in the big productive firms. Wages in the informal sector are already below the formal minimum wage standards, which are decided by estimating the cost of living index. The Indian Constitution, under Articles 41 and 42, puts the onus on the state to provide the right to work under humane conditions.
More research on formalisation is required to compose tailor-made policies for different sections of the informal sector. Many national and international programmes run to formalise the informal sector to gain potential positive consequences for the firms; however, outcomes are seldom desirable. Research is required to go beyond detecting the correlational aspects of formalisation and firm performance and rather look into the causal relationship between the two. Moreover, the focus should be more on the overall development of the socio-economic environment that can indirectly support the growth of firms. Firm growth is more favourable than a one-time push for formalisation as productive firms grow in size and are easier to be induced for formalisation.
Limitations and Future Scope
Despite its advantages, pseudo-panel data analysis is not immune to issues like estimation inaccuracy and information loss. Information is lost due to clubbing firms on some common characteristics into one cohort and using the cohort average as an observation; this also impacts the estimation accuracy as we are dealing with the approximation of cohort means, not the actual values of the observations.
We also had to deal with the issue of analysing only the variables which were common to all the three independent cross-sectional surveys used in the study. This might lead us to the issue of OVB as we had to skip the other variables present in the other two surveys.
Our analysis on capital accumulation and labour exploitation is just indicative as it is done using the NSSO 73rd round only and hence requires further robust analysis. In future research, we plan to use alternative econometric techniques like simultaneous equation estimation to estimate our two equations (4) and (5) or execute a primary survey, which can augment our present analysis. In addition, some other aspects that could not be explored in this study, like the skill and educational level of owners and workers, various evasion and transformation costs that a firm incurs, and various other sociopolitical forces can be studied in future research for understanding the complex nature of informality.
Footnotes
Acknowledgements
This work was not financially supported or funded by any organisation or individual.
Data Availability Statement
The datasets were derived from sources in the public domain (
Declaration of Conflicting Interests
The authors declared no potential conflicts of interest with respect to the research, authorship and/or publication of this article.
Funding
The authors received no financial support for the research, authorship and/or publication of this article.
Notes
Supplementary Material
References
Supplementary Material
Please find the following supplemental material available below.
For Open Access articles published under a Creative Commons License, all supplemental material carries the same license as the article it is associated with.
For non-Open Access articles published, all supplemental material carries a non-exclusive license, and permission requests for re-use of supplemental material or any part of supplemental material shall be sent directly to the copyright owner as specified in the copyright notice associated with the article.