
Abstract
This article explores the socioeconomic factors of wheat growers’ participation intensity in contract farming (CF) under both public and private firms in Haryana. Using the primary survey data of 754 wheat growers collected from two districts of Haryana, the study finds that CF participation intensity is higher under government corporations than in private firms. The Tobit regression results show that similar variables determine the participation intensity under both types of firms. But the perception of agricultural profitability has different significant signs for public and private firms. This difference in profitability perception spawns from the different contracting nature of both types of firms. The government firms directly contact farmers, while private firms hire agents to communicate with farmers. In addition, government firms encourage marginal and small farmers to adopt CF, while private firms prefer medium to large farmers owning a minimum of five acres of cultivable land. Payment security is another reason for the intensity difference between types of firms. Therefore, the study calls for a policy framework to establish better institutional structure to strengthen CF inclusiveness, where both types of firms provide the scope for more extensive participation across the groups of farmers.
Introduction
Contract farming (CF) is gaining significance in developing countries and is considered essential for commercialising the agricultural sector. It is defined as ‘an arrangement for producing and supplying agricultural or horticultural products under an agreement between producers and buyers’ (Mishra et al., 2022). The intent of such an arrangement is to deliver a certain type of agricultural commodity at a pre-defined price and quantity required by a known and committed buyer, usually a large company (Eaton & Shepherd, 2001). Many studies endorse the fact that CF is an institutional remedy to many agrarian issues that farmers in developing nations usually confront, such as market risks, lack of access to market, insufficient technology, lack of quality inputs, a long chain of multiple middlemen, ignorance of buyer demands, etc. (Eaton & Shepherd, 2001; Dev & Rao, 2005; GoI, 2017; Gulati et al., 2008; Swain, 2008, 2018).
Under CF, the contracting firms promote farmers to produce high-value and modern variety seeds (Key & Runsten, 1999; Kumar et al., 2007; Little, 1994; Singh, 2002) that need a considerable amount of investment in terms of better irrigation infrastructure, modern machinery and other input expenses like fertiliser, insecticide and other belongings (Swain, 2018). Furthermore, cultivating high-value crops under contract has a high risk because these crops are generally unfamiliar to growers (Minot, 2011; Swain, 2018). Hence, taking into account all these considerations, the farmers may not distribute all their agricultural resources to produce contract crops.
Like other economic performers, farmers are risk averse in developing countries (Liu, 2013; Mao et al., 2017; Tanaka et al., 2010), and the production-investment decisions of farmers are heavily influenced by their risk perceptions (Ali & Kapoor, 2008). So, a significant portion of their resources, that is, land, labour and financial resources, are devoted to a single crop. Because cereal crops are a staple diet, farmers tend to allocate their resources to this type of farming. When adopting a new crop or seed variety, farmers in those countries usually dedicate a portion of their total land area to conventional varieties (Gersch, 2018; Swain, 2018). However, farmers’ participation in CF is likely to vary due to differences in resource endowments, skill, willingness to take risks and contract terms under various types of contracting firms, but the resource distribution’s intensity for a certain crop depends on the specific characteristics of the farm and farmers and differs among different categories of farmers.
Some Indian studies have explored the welfare implications of CF on farmers in different ways. For example, Birthal et al. (2005) and Ramaswami et al. (2006) observed that contract farmers in North India receive higher payoffs, improved market efficiency and low business risk. Moreover, some studies (Dsouza et al., 2021; Kumar et al., 2007; Narayanan, 2014; Saroj et al., 2023; Sharma, 2016, Singh, 2002) found that CF leaves farmers highly better off in terms of gross margin, yields and efficiency. However, Kalamkar (2012) contradicted the above fact and argued that the net returns are higher under non-contract farming (NCF) than CF in India. But it has been considered an effective risk management strategy (Meti et al., 2016; Mishra et al., 2018).
Additionally, some studies have examined the factors affecting farmers’ willingness to participate in CF (Dev & Rao, 2005; Guo et al., 2005; Swain, 2012, 2018). But, despite plenty of research on CF, researchers have not yet focused on one aspect: the driving forces that affect farmers’ participation in CF under various types of contracting firms. In this regard, this article attempts (a) to comprehend the participation intensity of wheat growers under public and private contracting firms, and (b) to determine the specific factors affecting the probability of CF participation and intensity of participation. The second objective is achieved by decomposing the total elasticity of participation concerning a particular factor into two components, that is, the change in participation probability and the change in participation intensity.
The article is organised into various sections. After giving a brief introduction, the ‘Mode of Operations of CF for Wheat Production’ section explains the mode of operations performed by contracting firms. The section ‘Materials and Methods’ discusses data collection and methodologies. The section ‘Results and Discussion’ talks about the estimated findings. Finally, the study is concluded with some policy implications in the section ‘Conclusion and Policy Implications’.
Mode of Operations of CF for Wheat Production
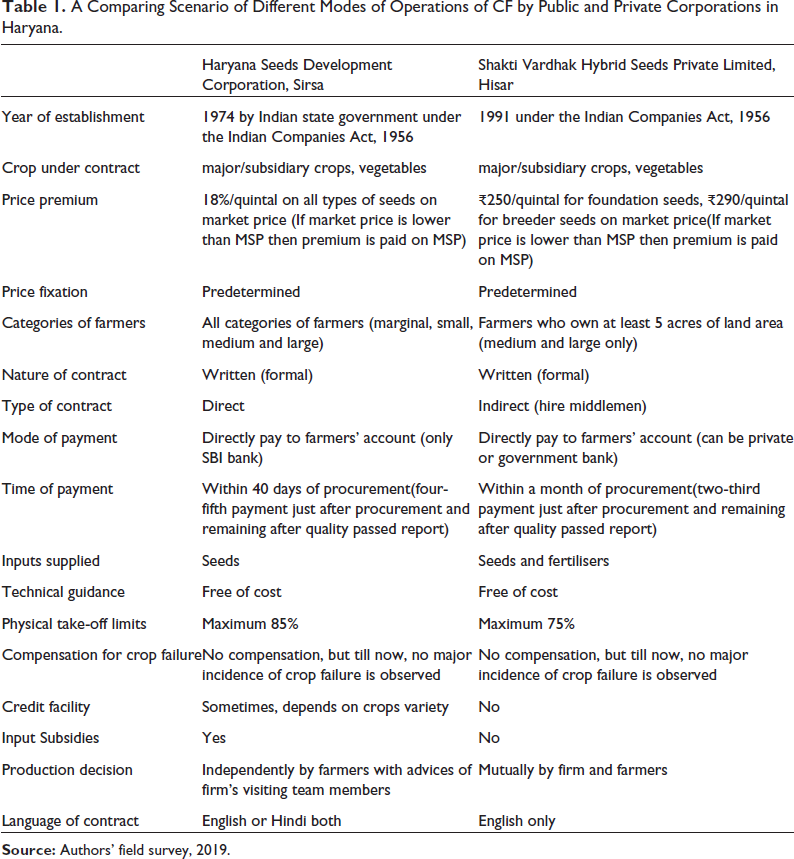
In 1974, Haryana Seeds Development Corporation, Sirsa (HSDC), a public corporation, was founded under the ‘Companies Act 1956’ with the goal of arranging the production and distribution of certified seeds to growers throughout the state at competitive prices. Similarly, Shakti Vardhak Hybrid Seeds Private Limited, Hisar (SVHS), a private corporation, was established in 1991 under the Indian Companies Act, 1956, with the authorisation to provide high-quality seeds and other crucial inputs to the farming industry. A conceptual comparison of the contracting arrangement between both firms is presented in Table 1.
A Comparing Scenario of Different Modes of Operations of CF by Public and Private Corporations in Haryana.
A Comparing Scenario of Different Modes of Operations of CF by Public and Private Corporations in Haryana.
Both corporations interact with farmers through written formal contracts stipulating quality standards and payments to be made after the crops are harvested. During the surveys, HSDC was reported providing high-quality certified seeds to growers at subsidised prices, while SVHS extended the facilities to wheat growers by providing seeds as well as other quality inputs, that is, fertilisers. The contracted farmers receive training and extension advice from both corporations along with these inputs. All technical services provided to farmers are free of cost.
However, the SVHS agency was observed to have the contract with only medium and large farmers (who owned at least 5 acres of land area) based on farm location, field history, farmers’ socio-economic conditions, farm-machinery possession, assured irrigation and commitment level of farmers for ensuring quality wheat supply. On the other hand, the public corporation works with all types of farmers, regardless of their landholding size, and attempts to bring small farmers together to enhance their productivity and strengthen their capacity to tackle market challenges.
The technique of price settlement used by the public corporation is a flat rate, whereas private corporation uses changing rates. HSDC corporation pays ₹18% per quintal more than the prevailing market price on all varieties of seeds. In contrast, SVHS firm pays an incentive on prices ranging from ₹260 to ₹290 per quintal over the prevailing market price for wheat output, depending on the variety of seeds. The criterion of price incentive used by both firms is that if the prevailing market price is lesser than the minimum support price (MSP), then a premium will be paid on that higher MSP side, not on the market price. The payment mode practised in both corporations is the instalment system. Farmers get four-fifths and two-thirds of the whole payment under public and private firms, respectively, just after the harvesting (when they deliver wheat produce at the processing plant of firms). Firms release the remaining part of the payment after receiving the ‘seed quality assessment report’ from the seed-testing laboratory. However, alternative marketing options (open market/local grain mandies) for contracted crops are also available in the state so that farmers do not rely solely on the firms to sell their produce. Still, during the survey, we observed that a majority of farmers (about 68%) do not do this. As a result, the contracted farmers of private corporations lose their independent decision-making ability over crop production, implying that farmers cannot make decisions without the concern of hired intermediaries by the firm. However, under public corporations, team members often visit the farm during production and give suggestions. Still, farmers are not bound to apply that. Therefore, they can make the decisions independently, though the nature of the contract might change depending on the type of crop and the circumstances in which it is grown.
Modelling CF Participation Behaviour
Following Abdulai et al. (2011), Paltasingh et al. (2017), Pandariah et al. (2022), the participation decision in new technology/farming practices depends on the idea of utility maximisation. So, assuming that farmers have two choices: adopting or not adopting CF, let j denote their participation choice where j = 1 for CF adoption and j = 2 for NCF. Thus, Equation (1) shows the ‘unobservable utility function’ that ranks the preference of

where 
Because utilities are unpredictable, the 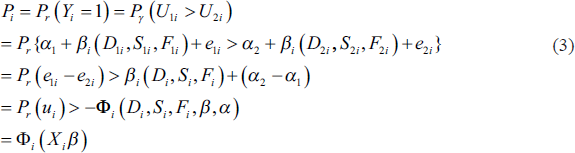
where X is the n × k matrix of independent variables, and β is the parameter vector of the order k × 1 that needs to be evaluated,
So, the unobservable latent variable can be stated as
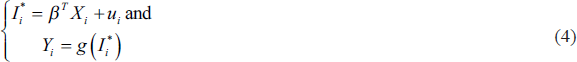
So, the participation behaviour can be stated as

Equation (5) signifies a censored distribution of CF participation intensity where
Decomposition of Elasticity of CF Participation
The coefficients of Tobit regression can be further used to determine the probability of change in participation and expected use intensity due to changes in any explanatory factors (Akinola et al., 2010; Paltasingh, 2018; Saroj & Paltasingh, 2023). The estimated change in CF participation due to a unit change in a significant independent variable can be decomposed into two separate effects, that is, probability of CF participation and intensity of CF participation once participated in CF. So, the former is termed the probability effect, and the latter is the intensity effect of a variable on CF participation.
The regression models can provide information about the decomposition of CF participation behaviour. Following McDonald and Moffitt (1980) and Tobin (1958), the probable intensity of CF participation, that is, E(Y), is specified as

where z = (Xβ)/σ and it is the z score for the area under the normal curve. With σ as standard error of the regression and β as a vector of ML coefficients, z is defined as the average values of all the variables. Then, ϕ(z) is the normal probability density function (PDF) at z, and Ф(z) is the CDF of z as defined earlier.
Here, E(Y*), the expected value of Y for observation above the limit, is expressed as χβ plus the expected value of the truncated normal error term (Amemiya, 1984):
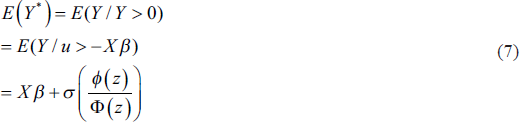
Thus, the primary relationship between the expected value of all observations, E(Y), and the value conditional upon being above the limit, E(Y*), and the probability of being above the limit, Ф(z), is expressed as follows:

McDonald and Moffitt (1980) show that the total change in E(Y) due to change in an explanatory variable Xi (marginal effect of Xi) can be decomposed into two parts as
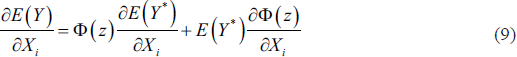
Therefore, the total change in Y is decomposed into two parts: (a) the change in Y of those above the limit weighted by the probability of being above the limit, and (b) the change in probability of being above the limit, weighted by the expected value of Y if above the limit. However, the marginal effect of Xi on the dependent variable [E(Y)] is
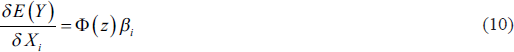
Again, the second partial derivative showing the change in probability of adopting a technology due to a change in an explanatory variable Xi can be specified as
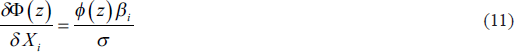
Similarly, the first partial derivative expresses the change in participation intensity with respect to a change in Xi among adopters can be specified as
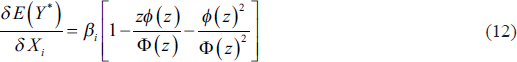
As we know, the Tobit regression coefficients do not reveal the marginal effects of the related explanatory variables on the dependent variable. However, their signs represent the impact direction of change in participation probability and marginal intensity when the explanatory variable changes (Maddala, 1983).
Study Area and Data
This study is based on primary data of 754 farmers obtained from Sirsa and Hisar districts IN Haryana during 2019–2020. Out of the total, 323 are wheat contract farmers, which comprises 174 participants from government corporations in Sirsa, and 149 from private firms in the Hisar district. The remaining 431 samples are non-contract farmers. We selected the Sirsa and Hisar districts as our study region because they contribute the most to Haryana’s total wheat production (Economic Survey of Haryana, 2018–2019). Moreover, the incidence of CF is also relatively higher in these two districts.
We adopted a multistage purposive sampling method. At first, we collected the list of all agribusiness companies working in those two districts from the administrative office of the Deputy Director of Agriculture. After discussing the top five most popular firms, we selected the Haryana Seed Development Corporation Limited, Sirsa in Sirsa district, and Shakti Vardhak Hybrid Seeds Pvt. Ltd., Hisar in Hisar district, for the study purposes. These are high profit-making firms and do business in more than 50% area of the whole district. In the subsequent step, we took the list of contract farmers from the selected contracting firms. This list comprised specific information about the farmers, such as the land area (in hectares) under CF and the crop types they grew. So, farmers are considered the final unit of analysis. We used a scheduled questionnaire to collect data about wheat farmers’ demographic characteristics and other farm-specific features. Also, we collected qualitative data through group discussions with skilled farmers to verify the collected data in every village. Table 2 describes all the study variables incorporated in the latent variable regression model and provides the corresponding descriptive statistics.
Definition and Descriptive Statistics of Variables.
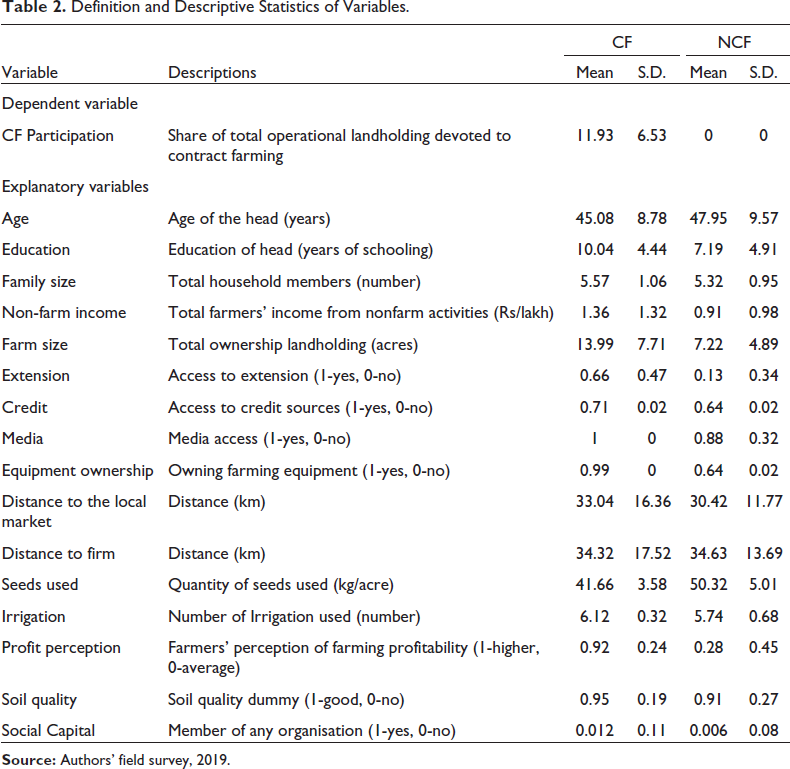
The dependent variable, that is, CF participation intensity of ith farmer, is the share of total land devoted to CF for wheat growing and expressed as

where Ai stands for land devoted to CF, and Li is total operational landholding. So, Yi is participation intensity in CF. The range of Yi values varies between 0 and 1, indicating the intensity of participation in CF, running from no participation to complete participation, respectively. The mean age values of contract and non-contract farmers are 45.08 and 47.95 years, respectively. Generally, experienced farmers are more expected to take the risk of new technology adoption as compared to less experienced farmers. However, some empirical studies show that younger agriculturalists are more inclined to participate in CF (Chang et al., 2006; Hu, 2012). As a result, the theoretical relationship is unclear. The farmer’s educational level is crucial in determining his CF participation. Literate farmers are more aware of the importance of CF and are better able to communicate with firms (Asfaw & Admassie, 2004; Paltasingh & Goyari, 2018). There is little difference between the average number of household members under CF and NCF. Non-farm income is measured as the total income from all earning sources except agriculture. The result shows that the average non-farming income of CF is 1.36 lakh, while for NCF is 0.91 lakh. Farm size (in acres) is the total land owned by farmers. This is expected to impact participation behaviour positively (Akinola et al., 2010; Thuo et al., 2014). The average landholding area for CF is around 14 acres, and for NCF is 7.7 acres. The data show that most CF farmers are medium and large, while NCF farmers are small, suggesting that owning a large landholding area encourages farmers to adopt CF. Contact with extension services is also a dummy variable that takes 1 if farmers interact with agricultural extension services and 0 if not. The mean difference test in access to extension services shows that CF farmers have more extension contacts than NCF, indicating that farmers are more likely to adopt CF if they interact with extension services more frequently (Alene & Manyong, 2007; Paltasingh & Goyari, 2018). Thus, a positive relationship is expected. The farm-specific factor, soil quality, is another dummy variable, taking 1 for good soil quality and 0 otherwise. Farmers’ self-assessment and knowledge about the soil features of the land area are used here under different criteria for soil quality testing. Good quality soil induces farmers to adopt CF because it enhances crop yield (Wubeneh & Sanders, 2006). So, it is likely to have a positive relationship between both. However, the mean value of CF and NCF for soil quality do not differ by much, that is, 0.95 for CF and 0.91 for NCF.
Wheat seeds used under CF are the foundation or certified seeds, and they need less quantity to grow per acre as compared to seeds used under NCF. The CF farmers use 41.66 kg per acre, but for NCF, it is 50.32 kg per acre. Credit plays a vital role in adopting new technologies when a considerable cash investment is needed, especially for small farmers who cannot afford readily available cash (Ghimire et al., 2015). Thus, a positive relationship is expected between both. Social capital, a dichotomous variable indicative of membership in any social or developmental organisation, is hypothesised to augment awareness about new technology through exchanging information among farmers (Akinola et al., 2010; Alene & Manyong, 2007). Distance to the local grain market or contracting firms is a vital factor that influences the participation behaviour of farmers. If the distance to the contracting firm is more than the local grain market, farmers are generally not willing to adopt CF. As a result, this variable is likely to impact CF participation adversely. The access to media is another dummy variable having the value one if the farmer owns a television or radio and zero if not. Media accessibility helps in circulating information that provides the farming community with an essential understanding of contemporary agricultural technologies. So, it enhances the scope for CF participation (Alene & Manyong, 2007; Platasingh & Goyari, 2018). Ownership of farming equipment, that is, car/motorcycle for farming purposes, tractors, plough, cultivator, rotary tiller and so on (if a farmer owns any one of them, then the value of dummy variable is one, otherwise zero) is also a crucial factor influencing CF participation behaviour. So, it is likely to have a positive impact on CF participation.
Profit perception is defined as the expectation of farmers about the final profit that they can earn by adopting CF technology. Farmers were asked to score their perception on a 1–3 Likert scale from high to low profit. We grouped them into only the high and average profit perceptions scale because even a single respondent did not choose low-profit perception. So, a dummy variable defines profit perception as high profit (=1) and average profit or any other perceptions (=0). This profit perception is not only decided based on the offered price and produced yield in past years but also considering some other qualitative factors, such as associated higher production costs, complicated contract nature, instalment payment system, loss of farmers’ bargaining power, zero-compensation for crop failure, cost of contract breaching, a long chain of hired agents between firm and farmers (direct or indirect contract) and access to credit, insurance, subsidies and technical assistance services. By considering all these factors, farmers decide their expected profit level. But, under NCF, farmers’ perception is decided based on only prevailing market price, produced yield, marketing of final products and middlemen (Adhati) behaviour. For these farmers, intermediaries are essential; however, these intermediaries pay a meagre price for their produce. Therefore, profit perception is a key variable influencing the participation in CF under public and private corporations because it provides information about farmers’ viewpoints towards the prevailing CF system.
Participation Intensity of CF Wheat Growers
Generally, the percentage of total owned land that is used for CF defines the intensity of CF participation. Table 3 shows the intensity of CF participation in wheat farming across the different farming groups. The findings illustrate that small farmers are less inclined to adopt the CF, as they allocate only 13% of their total owned landholding to CF, and the remaining 87% of the area is used to grow traditional agriculture. In contrast, medium farmers devote about 53% of their landholding to CF and 47% to NCF. But large farmers show a surprising result. They are committing about 70% of their total landholding to CF in the study area. So, smallholders are not much inclined to CF due to its higher cost of production and complexities in contracts. Usually, they opt to cultivate traditional seeds under NCF rather than taking the risk of CF. However, small farmers’ relative exclusion does not entirely depend on their adoption willingness or attitude towards risk, but as mentioned earlier, private firms also set up some criteria for their selection. These firms deal with only those farmers who own equal to or more than five acres of land or farmers willing to devote at least five acres of their total landholding to CF crops.
Intensity of CF Participation in Study Region.
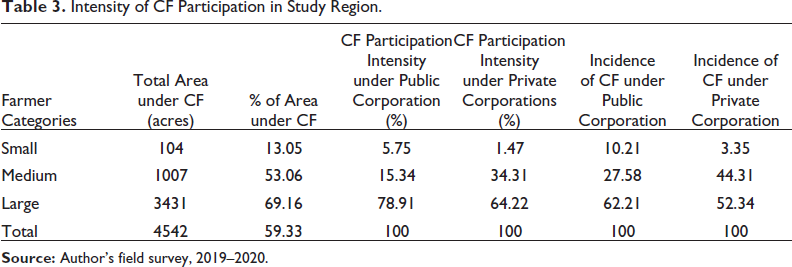
Intensity of CF Participation in Study Region.
Moreover, it also considers the farmers’ socio-economic condition, farm location, farm machinery possession, assured irrigation and farmers’ commitment level to ensure quality wheat supply. However, public corporations work with all categories of farmers, that is, even with marginal farmers operating on the leased-in land. From Table 3, we observed that the participation intensity of small farmers is more sizable under public corporations than private corporations. Nevertheless, the overall trend reveals a rising tendency in participation intensity as the size of owned landholdings grows. Again, it is also assumed that fixed participation costs, risk perception, human costs, etc., play a significant role in participation patterns. Moreover, because of the differences in ecosystems, different factors have varying effects on participation intensity (Swain, 2012, 2018).
Determinants of CF Participation under Varying Firms
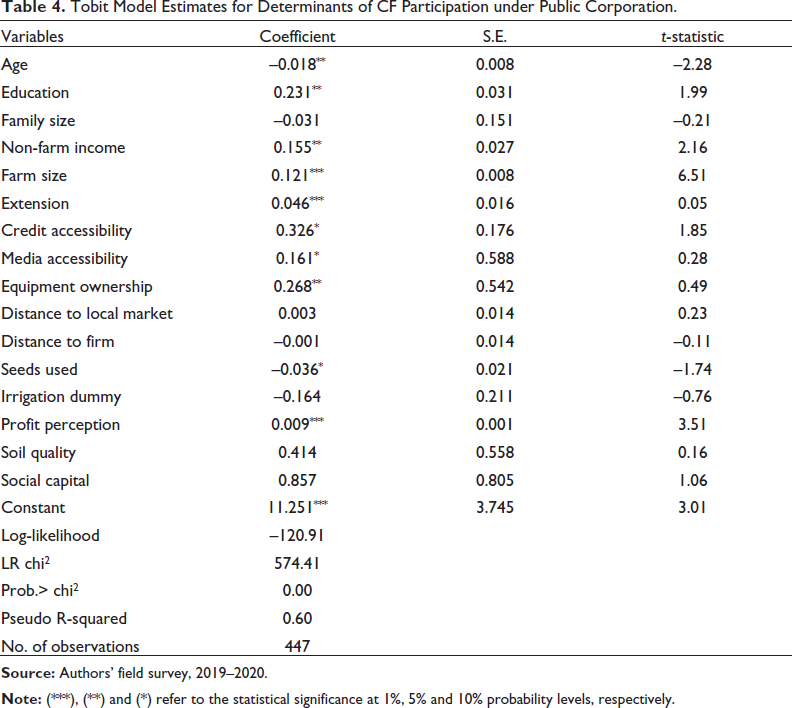
This section reveals the factors influencing the CF participation behaviour among the farmers. Tables 4 and 5 illustrate the ML estimation of the Tobit regression model for the factors impacting the CF participation behaviour of growers under public and private firms, respectively.
Tobit Model Estimates for Determinants of CF Participation under Public Corporation.
Tobit Model Estimates for Determinants of CF Participation under Private Corporation.
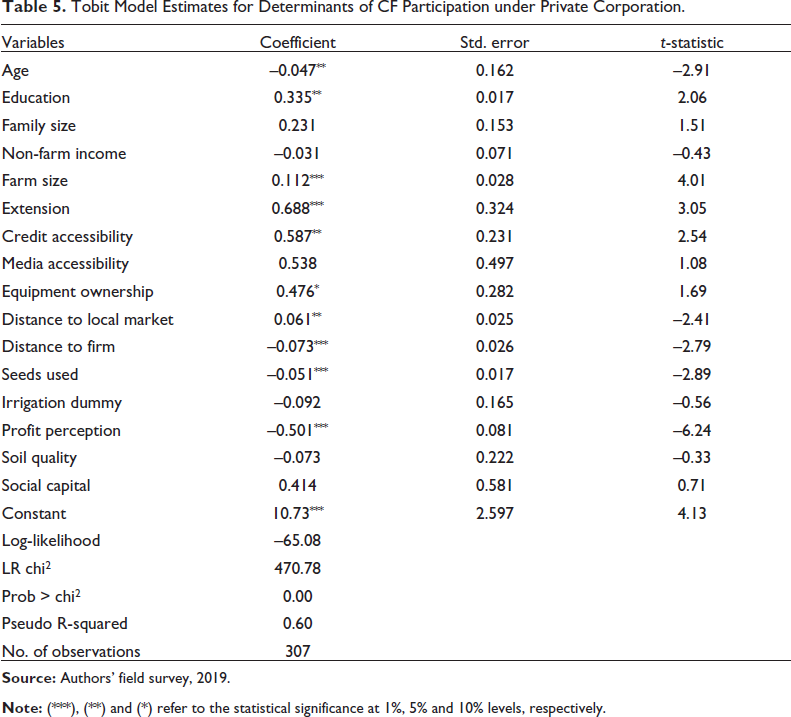
Table 4 presents the determinants of CF participation behaviour under public contracting firms. The estimated result shows that farmers’ age is negatively significant for CF participation. It directs that young farmers are more inclined to adopt the CF schemes. The younger farmers are usually risk lovers and stand ready to take risks ascribed to modern technologies or practices for higher returns (Hu, 2012; Winters et al., 2005). The education level of farmers positively and significantly affects CF participation intensity, implying that educated farmers can understand the significance of CF and are better able to interact with firms (Alene & Manyong, 2007; Asfaw & Admassie, 2004; Paltasingh & Goyari, 2018). Many other studies, like Zhu and Wang (2007), Arumugam et al. (2011) and Hu (2012) have also found a favourable relationship between both. Non-farm income is a significant determinant of CF participation in a public corporation. Usually, off-farm income is relatively more stable than farm output prices, making the aggregate income of the farm households stabilised (Mishra & Goodwin, 1997). A farmer with diverse income sources will have more resources to utilise on the land area. This facilitates the timely purchase and use of all inputs to enhance production and profitability. So, it positively affects the participation behaviour of farmers (Benjamin, 2017; Benjamin et al., 2020).
The coefficient value of landholding is positively significant, inferring that bigger farmers are more likely to adopt CF. Landholding is a vital factor determining participation behaviour for two reasons: First, large farmers are ready to bear the risk of using new technology, as they have more resources to take the risk and reap more returns. Hence, they can afford the commercialisation of agriculture. Second, bigger landholding creates and appropriates more economies of scale, lowering average production costs and increasing average profit. Thus, big farmers are more inclined to participate in market-driven, high-valued agriculture (Cahyadi & Waibe, 2013; Kumar et al., 2018, 2019; Wang et al., 2011). Credit accessibility is a positively significant determinant for CF participation under both types of firms because it helps in the timely accessibility of farm inputs by alleviating budgetary constraints. Many adopters may need to depend on credits to bear the cost of farm inputs and other production expenses. So, it affects the participation decision (Asfaw et al., 2012; Ghimire et al., 2015).
Interaction with extension services significantly impacts CF participation intensity because it helps enhance farmers’ knowledge about advanced technology. So, farmers using innovative technologies are more inclined to adopt CF (Abdulai et al., 2011; Asfaw et al., 2012; Mariano et al., 2012). In addition, Paltasingh and Goyari (2018) argued that a farmer having links with extension services is usually a forward-looking farmer who stands ready to do experiments in his farming activities to earn higher returns.
Owning agricultural equipment and machinery and media accessibility are found to be significant and positive determinants of CF participation intensity. More resourceful farmers are assumed to have more chances to adopt CF (Bidzakin et al., 2019). Profit perception is another vital factor that significantly induces farmers to participate in CF under public firms. This indicates the stability of payment for the value of their products from the government’s firms provokes the farmers to participate in CF and encourages them to enter into a contract with public contracting firms.
Table 5 presents the determinants of CF participation intensity under private contracting firms. Again, we observe that almost the same group of factors affect the private firm’s participation behaviour as those under the public contracting firm. The significant factors are farmers’ age, education level, farm size, extension, credit accessibility, ownership of equipment, distance to the local town, contracting firms, rate of seed use and profit perception. However, distance to a contracting firm is another significant factor that negatively influences participation behaviour in this case only. This implies that a long distance between the contracting firm and the farmers in study villages stands as a hindrance that discourages farmers from adopting CF because it prevents the dissemination of required information, inputs and knowledge to the farmers.
However, profit perception is a vital factor affecting the likelihood of wheat farmers’ participation in CF. However, its statistically significant coefficient is positive under public corporations while negative under private corporations. This difference in the sign explains the importance of perception that affects CF participation intensity and the difference in intensity of participation under private and public contracting firms among the farmers. Generally, farmers who grow under CF earn more profit than those who sell their produce under NCF because both types of contracting firms pay them a higher price for their produce than the local market, which positively affects their profitability. Additionally, we have found that medium and large farmers are more likely to adopt CF, positively affecting their profitability level because they take advantage of economies of scale. Nevertheless, other factors also have a crucial role in forming the CF participation rather than the profit itself. These factors include associated higher production cost, complicated contract nature, instalment payment system, farmers’ bargaining power, compensation for crop failure, cost of contract breaching, more agents between firms and farmers (direct or indirect contract), credit, insurance, subsidies and technical assistance services, etc. During the survey, we noted that farmers face some of these problems under private firms, which negatively affects their willingness to participate in CF to some extent. But, under government firms, there is much assurance of payment even if there is a delay. Besides, private firms are averse to marginal and small farmers, while public firms have non-discriminating attitudes towards them. So, all these factors are reflected by the profit perception, which makes the difference in CF participation intensity between public and private corporations.
Elasticity of CF Participation of Wheat Growers
Table 6 represents the decomposition of overall change in CF participation, that is, the overall elasticity of participation is due to a unit change in an explanatory variable that significantly impacts the CF participation decision of farmers under both types of firms. The overall participation change is decomposed into two components: the change in CF participation probability and the likely change in CF participation intensity (the possibility of a shift in participation intensity once the decision to participate has been made due to changes in the explanatory variables).
Decomposition of Elasticity of CF Participation.
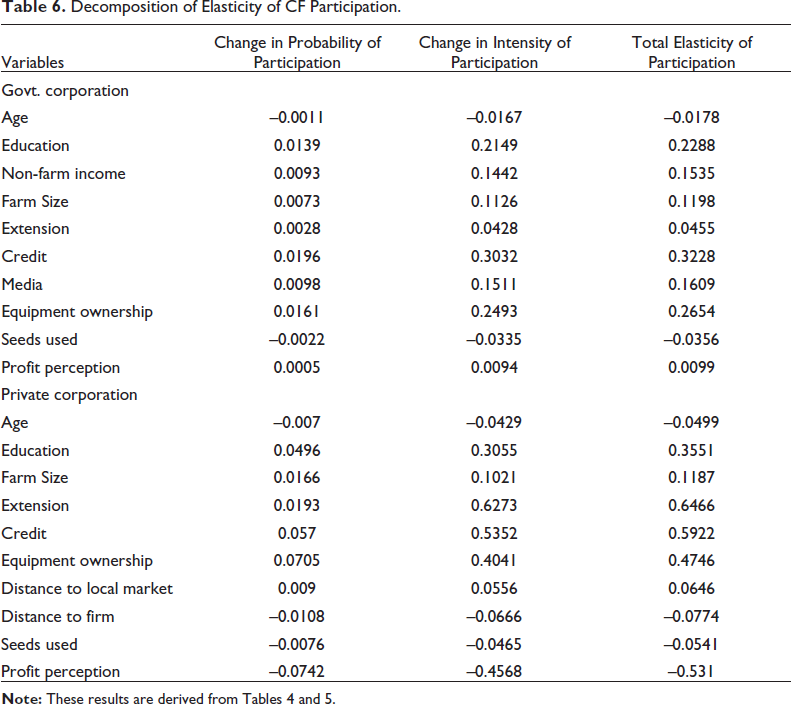
From Table 6, the overall elasticity value for education is 0.22, implying that a 10% increase in farmers’ education would result in around a 23% rise in CF participation. And that 23% total impact is due to a 1.4% expansion in the participation probability and a 21.6% expansion in the participation intensity. The values of the remaining variables can also be explained in the same way. These findings confirm that the change in the participation intensity is comparatively more considerable than a change in the participation probability under both types of firms.
Among all explanatory variables influencing CF participation intensity under public corporations, the variables like education, credit and equipment ownership have relatively greater values for overall elasticities with a higher intensity of participation change. Similarly, in the case of private corporations, education, extension credit and equipment ownership have relatively greater values for overall elasticities with a higher intensity of participation change. This analysis reveals that CF participation intensity effect is relatively higher than the participation probability effect, which implies that these significant factors induce the existing adopters to devote more land area to CF than influencing new participants because the probability effect is negligible.
The evidence in the literature suggests that the provisions of contracts between farmers and companies vary because of the wide variety of cropping methods, the availability of resources and the associated transaction costs. In this study, we highlighted the importance of some factors explaining the intensity of participation of wheat growers in the CF schemes under both public and private corporations in Haryana. We observed that participation intensity is higher under the government corporations than the private firms. Farmers’ age, education, credit accessibility, equipment ownership, seed use rate, etc., determine the participation probability and the participation intensity in the same way for both firms. Still, profit perception has a different significant sign. One of the main reasons behind this mismatch is the existence of differences between the contracting natures under both types of firms. The contracting terms between the public corporation and farmers are less ambiguous and farmer-friendly than the terms of the agreement under the private firm. This difference is noticed in many aspects, such as public firms directly contacting farmers while private firms hire agents to communicate with farmers. So, here, in this case, up to some extent, the success of CF depends on the agent’s dealing behaviour.
Government firms promote marginal and small farmers to adopt CF, while private firms have set out a criterion to select only those farmers who hold a minimum of five acres of land. Payment security is another reason for the intensity difference between types of firms. Moreover, farmers (primarily small and medium) believe that protecting the farmers’ interests is the role of the government. So, it cannot illtreat with them. Consequently, this psychological factor of farmers also induces them to adopt CF under public corporations. Also, farming under a private firm is associated with higher production costs than public firms. All these factors generate the difference between the profitability levels of farmers cultivating under both types of firms.
The study suggests a better institutional structure for contracting firms in order to broaden their scope and framework to accommodate all types of farmers. As previously stated, CF is primarily being adopted by a subset of medium and large farmers, especially under private firms. But when it comes to inclusive development, barriers to smallholders’ CF adoption should be eliminated. One institutional set-up is required to enfold the small and marginal farmers into market-led commercial agriculture. So, in this context, private firms should be encouraged not to be averse toward them. Second, grassroots-level institutions such as Kisan panchayat should have a significant role in deciding the contract structure. Also, the state should control the market to prevent corporations from abusing their market supremacy so that small farmers feel secure and become motivated to take advantage of CF technology. Finally, the private firms should enter into a contract with various incentives such as credit, insurance, input subsidies and better infrastructure so as to encourage farmers to devote the maximum share of their land to CF.
Footnotes
Declaration of Conflicting Interests
The authors declared no potential conflicts of interest with respect to the research, authorship and/or publication of this article.
Funding
The authors received no financial support for the research, authorship and/or publication of this article.