
Abstract
This study investigates the constellation of macroeconomic forces that drive economic growth by focusing on the world’s 10 largest economies (in terms of GDP). It uses cross-country data from 1990 to 2019 (30 years). The macroeconomic forces considered for the study are macroeconomic stability (represented by inflation), infrastructure (represented by mobile cellular subscription per hundred people), foreign trade (represented by exports and imports) and foreign direct investment (FDI) inflow. Real GDP is used as a measure of economic growth. The empirical findings suggested that macroeconomic instability is detrimental to economic growth. Infrastructure improvements and FDI inflows can boost growth of the selected nations. However, trade has an insignificant impact on economic growth.
Introduction
Causes of economic growth have always attracted debates from economists. Economists have developed theoretical research (Szostak, 2009) and empirical models (Barro, 1996; Upreti, 2015) to explain the determinants of economic growth. Gross domestic product (GDP) is a powerful statistical indicator used widely by eminent researchers to measure economic growth. Shrotryia and Singh (2020) mention that calculating the monetary value of finished goods and services produced inside a nation’s borders for a specific time period is central to the concept of GDP. Unsurprisingly, the economic policies have always aimed to augment the production of goods and services and thus boost GDP. Developing and developed nations try to develop lucrative policies (like tax benefits, subsidies, special economic zones (SEZs), etc.) to increase production, support domestic industries, etc.
Perhaps, macroeconomic stability is one of the forces that drive growth. In literature, inflation rate is widely accepted as a yardstick for stability (Ocampo, 2008). Usually, high inflation rates are well-thought-out as detrimental for growth and development (Fischer, 1992; Pinto et al., 2000). On several occasions, inflation has been called ‘public enemy number 1’ by the United States policymakers. However, the idea of some reasonable inflation rate, say 3–6 percent, is well regarded. Excess inflation rate enervates investments and growth. In the case of Nigeria, macroeconomic variability has adversely affected the growth process (Idris & Bakar, 2017). Thus, low and steady inflation rates stimulate investments and support growth.
Infrastructure is one of the crucial factors in the process of growth. Any efforts towards economic growth call for good quality infrastructure and consistent investment in infrastructure. Inadequate physical infrastructure hinders sustained growth (Seethepalli et al., 2008). Adequate investment in infrastructure creates production facilities, trims transaction and transportation costs and provides employment opportunities. In many economies, especially developing economies, capital constraints impede growth. Foreign direct investment (FDI) is a notable capital source, especially for developing economies like India (Ashri & Sahoo, 2021). FDI benefits host countries by playing a catalytic role in transferring technology, knowledge and other factors of production. Technological improvement coupled with consistent investment in the country’s infrastructure boosts growth. Empirical and theoretical evidence has been mounting, advocating open economies grow faster than closed economies. In other words, tearing down trade barriers and encouraging export-driven policies and free trade agreements (FTAs) are the heart of the growth process (Helpman & Krugman, 1985). However, such theories are still debatable (Rodriguez & Rodrik, 2001; Iyke, 2017).
However, even after years of sustained research, economists are still baffled by what drives growth (Basu & Maertens, 2007). The present study is undertaken to examine the constellation of forces that drive economic growth. For this purpose, the study considers a sample of the 10 largest economies in terms of GDP. The literature on determinants of economic growth is rapidly growing because it is becoming imperative for policymakers to identify the drivers of growth. Therefore, this study attempts to add a new perspective by taking a sample of the 10 largest economies in terms of GDP. So far, studies have considered samples of countries based on geographical location, regional economic integrations, World Bank classification of economies, etc. or have studied the determinants for one country only.
Literature Review
Theoretical Underpinnings
This section briefly explores the various economic theories which attempt to explain the relationship between growth and other macroeconomic variables.
Inflation and Growth
Classical growth model given by Adam Smith postulate implicitly suggests negative relationship between growth and inflation, as demonstrated by reduction of firm’s profit due to rising wage costs (Gokal & Hanif, 2004). Under AD-AS framework due to ‘time inconsistency problem’, there exists a positive relationship between inflation and growth (Blanchard & Kiyotaki, 1987). However, this conception was later challenged by the concept of stagflation. During the 1970s, the widely accepted ‘Phillips Curve’ relation was questioned, and Friedman (1968) postulated that the curve does not hold true in the long run. Milton Friedman coined the term ‘monetarism’ and emphasised on the role of monetary growth on inflation. Under endogenous growth theory, inflation has adverse impact on capital accumulation. This, in turn, causes decline in growth rate. Traditional theories assume monetary policies exogenous; however, in practice, a general consensus exists among central banks across the world that price stability fosters growth and high level of inflation is harmful to economic growth.
Infrastructure and Growth
There is no precise definition of infrastructure, but a broad consensus exists (Nugraha et al., 2020). However, Pearce (1986, p. 204) in Macmillan Dictionary of Modern Economics has defined infrastructure as follows:
‘Those structural elements of an economy which facilitates the flow of goods and services between buyers and sellers. Examples of these structural elements are communications and transport (roads, railways, harbours, airports, telephones, etc.), housing, sewerage, power systems etc. These facilities are usually though not necessarily, provided by public authorities and may be regarded as prerequisite for economic growth in an economy’.
The comprehensive definition provided by Pearce (1986) has regarded infrastructure as a crucial ingredient for economic growth. The relationship between growth and infrastructure can be found in growth theory. Infrastructure, measured by public expenditure, was injected in the growth models by Arrow and Kruz (1970). Studies have also utilised Cobb–Douglas production function in the neo-classical growth model and incorporated infrastructure as an input. The Cobb–Douglas production function has two factors, that is, labour and capital. The rationale for injecting infrastructure as a variable is that it can improve efficiency and productivity of both labour and capital (Khan et al., 2020).
Trade and Growth
Origins of theoretical literature examining the relationship between trade and growth can be traced back to the theory of absolute advantage and comparative advantage propounded by Adam Smith and David Ricardo, respectively. As per absolute advantage theory, a country shall produce goods in which it is efficient and import goods in which it does not have production efficiency. On the other hand, Ricardo explained welfare gains by producing goods in which the country has comparative advantage. The H-O theory explained country’s exports are based on the differences in the endowment of factors of production. Later on, benefits of free trade have been discussed by many economists (Bhagwati, 1978). Proponents of endogenous growth models have triggered various models advocating trade as a tool of economic growth. Researches have used several variables such as trade openness, exchange rates and exports (Edwards, 1998). This has led to extensive research on export-led growth (ELG) hypothesis (Balassa, 1978; Bhagwati, 1978; Edwards, 1998).
FDIs and Growth
Economists have discussed the bearing of FDI on growth via two mechanisms: direct effect and indirect effect. In literature, the first mechanism, that is, direct effect, increases the capital stock and expands production. FDI allows productivity rewards and technical movements (Borensztein et al., 1998; Caves & Caves, 1996). The second mechanism, that is, indirect effect, involves diffusion of knowledge and innovation locally due to the presence of multinational enterprises (MNEs) in the host country (Mehic et al., 2013).
In traditional growth theories, FDI is considered merely as an addition to the capital stock and assumes technology is exogeneous (Mehic et al., 2013). This implies that FDI does not have technology spillovers and thus, FDI has short-term impact on growth (Campos & Kinoshita, 2002). However, FDI plays a greater role in boosting growth under endogenous growth theory. FDI can permanently affect growth rate via numerous channels in an endogenous growth model (Campos & Kinoshita, 2002). This is due to the assumption that technology is endogenously determined and thus rate of technology diffusion boosts growth. This allows us to gauge the technology-related benefits that the host country accrued due to FDI.
Empirical Evidence
This section investigates the mainsprings of economic development. The following sub-section reviews the macroeconomic indicators that stimulate economic growth. In this section, role of inflation, infrastructure, foreign trade (exports and imports) and FDI influx in growth process have been discussed.
Inflation and Growth
Inflation is viewed as repeated and perpetual escalation in the overall price level in an economy. This might be either remunerative or lethal to growth (Azam Khan & Khan, 2018). The effect of inflation on growth is highly debated and subject to extreme scrutiny by presenting both empirical and theoretical studies. Early empirical research by Mundell (1963) and Tobin (1965) has supported that inflation dramatically impacts economic growth. Theoretically speaking, inflation and economic growth should have an inverse relation (De Gregorio, 1993). According to Barro (1995), a higher level of inflation reduces investment, adversely affecting economic growth. Previous studies have agreed that higher inflation rates hamper the growth process and stable inflation prompts economic growth (Ayyoub et al., 2011; De Gregorio, 1993; Madurapperuma, 2016; Mkango, 2015; Salian & Gopakumar, 2008). While some studies show that inflation and GDP have a positive association (Mallik & Chowdhury, 2001; Osuala et al., 2013), some have found an insignificant relationship between the former and the latter (Aziz & Azmi, 2017; Sarel, 1996; Sidrauski, 1967). Khan and Ssnhadji (2001) argue that to maintain a positive association between the former and the latter, the inflation rate shall be below the ‘threshold rate’. The threshold rate shall be 1–3 per cent for developed countries, whereas it shall be 11–12 per cent for a developing nation. However, Gultekin (1983) provided a different perspective. He stated the influence of inflation on growth relies on ‘rate of return’. According to him, if rate of return falls, then inflation will harm economic progress.
Infrastructure and Growth
The positive influence of physical capital, such as telephone, length roads and electricity, is well discussed in the literature (Banerjee et al., 2020; Palei, 2015). Investment in roads, railways, air transport and electricity supply increases factor mobility. Thus, positively influences economic progress and national competitiveness.
Early work of Kenneth and Kurz (1970) aimed at highlighting the importance of infrastructure in growth and was later discussed by Aschauer (1989) and Easterly and Rebelo (1993). They conveyed that infrastructural development prompts poverty alleviation and growth. Poor and inadequate infrastructure is one of the critical problems in many developing nations and acts as a bottleneck for businesses to grow (Khan et al., 2020). Therefore, continuous efforts should be made by such nations to bolster growth. Empirical results provided by Seethepalli et al. (2008) proved progress in infrastructure investment augments economic growth; however, these results were contradicted by Straub (2008). Mamatzakis (2008) showed that infrastructural development in Greece is crucial for economic activities. Similarly in Asian countries, infrastructure acts as an imperative driver of growth (Ismail & Mahyideen, 2015). Baldwin and Dixon (2008) have also stressed that efficient infrastructure ensures economic prosperity.
Trade (Export and Imports) and Growth
Empirical studies have advocated that export-driven policies assure higher payoff in terms of output growth than conventional rise in government investments (Saimul & Darmawan, 2020). However, returns will not materialise in the short run. In other words, foreign trade is not a short-run magic bullet. Continuous long-term efforts are required towards aggressive exploitation of trade liberalisation policies. To deduce the impact of trade on economic studies have been carried out at country level, like for CEEC nations (Awokuse, 2007), Vietnam (Nguyen, 2020), etc. and it has been suggested that trade stimulates growth.
In our study, we have opted to represent trade by introducing both imports and exports as a variable in our research model. Early works of some economists have shown exports lead to growth and often denote this as the ‘ELG hypothesis’ (Balassa, 1978; Bhagwati, 1978; Edwards, 1998). The ELG hypothesis is highly debated and subject of intense enquiry. In case of semi-industrialised countries, some scholars believe that export-oriented policies are vital for economic progress (Esfahani, 1991). Increase in domestic skilled labour and technology stimulates export expansion (Krugman, 1984). Shirazi and Manap (2005) have also supported the ELG hypothesis in selecting five South Asian Countries, except Sri Lanka. However, some studies have also presented empirical results rejecting export-growth causality in their respective samples (Ahmad & Harnhirun, 1996; Colombatto, 1990). Xu (1996) rejected the ELG hypothesis in case of India. Considering ASEAN nations, Ahmad and Harnhirun (1996) explain exports do not lead to growth, rather domestic growth indues export expansion. More emphasis shall be laid on ‘internally generated mechanism’ rather than blooming exports. Stellar economic performance is contingent on other factors, such as influx of foreign capital, advancement in technology, etc. In the search of other factors, literature also explores import-led growth (ILG) hypothesis. However, both empirical and theoretical perspectives are inadequate in the literature. This might be due to complexities and undefined relationship between imports and growth (Mujahid et al., 2019). Lawrence and Weinstein (1999) and Mazumdar (2001) mention imports as a vehicle allowing the flow of knowledge and technology to developing nations and thereby enhances the productivity of developing nations. Coe and Helpman (1995) have also favoured that import can stimulate economic growth, as the domestic firm immediately provides production factors. However, expansion of imports might lead to balance of payments deficits. Studies have favoured both export-driven and import-driven growth. However, overemphasis on export expansion and omission of imports might be deceptive (Awokuse, 2007, 2008).
FDI on Economic Growth
The role of inflow of foreign investment in growth has sparked the interest of various scholars and academicians. This is because of a change in the perception of the policymakers from ‘hostility’ to ‘conscious encouragement’ (Ayanwale, 2007). Some of the notable benefits of foreign investment inflows to the host countries include productivity gains, transfer of technical and managerial know-how, better international production networks, etc. (Borensztein et al.,1998; Caves & Caves, 1996). However, foreign inflows lever growth only if the host country attains a certain human capital level (Borensztein et al., 1998). Findlay (1978) advocates that the host country benefits from an increased rate of FDI through a ‘contagion effect’ by getting access to advanced technology.
Literature consists of ambiguous results. The rationale that FDI stimulates economic growth stems from two arguments. First, FDI amplifies trade volume and ensures growth (Markusen & Venables, 1998). Second, FDI elevates the domestic capital (Driffield, 2001). Empirical results provided by various scholars indicate that escalating influx of foreign investment boosts growth (Asiedu, 2002; Carkovic & Levine, 2005; Choe, 2003; Choi, 2004; De Mello, 1997; Dees, 1998). However, contradictory studies are also available arguing that foreign investment does not significantly contribute to a country’s growth process (Chakraborty & Basu, 2002). While advocating the negative effect of FDI on GDP in selected eight countries, Mencinger (2003) states that increasing the current account deficit could be the reason for such results. If proceeds, let us say mergers and acquisitions, are utilised for imports, then it can have an adverse effect on growth.
Some studies suggest that the reason for such mixed results could be the use of aggregate FDI in the previous studies and a sector-level study might be fruitful (Wang, 2009). A sector-level study illustrates that foreign investments contribute positively to the manufacturing sector, but the same cannot be said for non-manufacturing sector.
Research Gap, Objective and Hypothesis Development
Economic growth, usually seen as a rise in the GDP, is affected by various economic factors. In the past, ample studies have been carried out to investigate the nexus between growth and various other economic variables. However, some studies have scrutinised such relations in isolation, like inflation and GDP only (Mkango, 2015). The literature lacks a comprehensive model. Though some studies have attempted to develop a comprehensive model, but empirical evidences are mixed. These mixed results exist for various reasons, like the choice of country, time periods and choice of methodology. So far, studies have considered samples of countries based on geographical location, regional economic integrations, World Bank classification of economies, etc. or have studied the determinants for one country only. However, fewer attempts have been made to create a sample 10 largest economies (in terms of real GDP). Undoubtedly, these 10 largest economies hold a ‘bright spot’ in the world economy and have a significantly higher share in world trade and global politics. Therefore, scrutinising the causes of economic growth in these economies becomes crucial.
This study explores the role of five macroeconomic variables, inflation, infrastructure, exports, imports and FDI inflows in the economic growth of the 10 largest economies.
To succeed in this objective of the study, the following hypotheses have been tested:
H1: Inflation does not have a significant impact on growth.
H2: Infrastructure does not have a significant impact on growth.
H3: Exports have no significant impact on growth.
H4: Imports have no significant impact on growth.
H5: FDI inflows do not have a significant impact on growth.
Research Methodology
Sample and Data
Table 1 represents the 10 largest economies of the world which have been considered for the purpose of the study.
Countries ranked by GDP (2019).
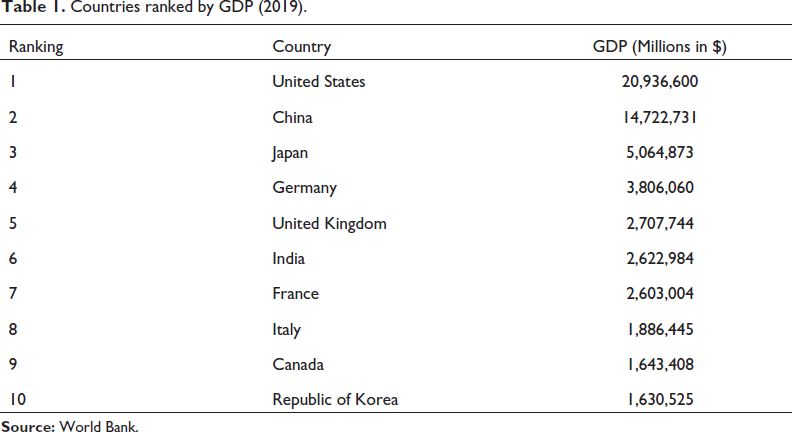
Countries ranked by GDP (2019).
The study is based on secondary data retrieved from the World Bank database, considered to be one of the most reliable data sources, for 30 years (from 1990 to 2019). The selected economic indicators for the study are inflation, exports, imports, infrastructure, FDI inflows and real GDP (as a measure for growth).
Research Model
To examine the influence of the selected indicators on growth in these economies, the following regression model has been proposed:

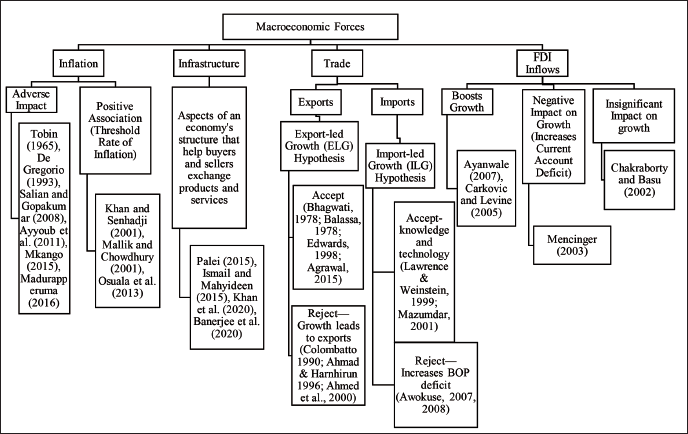
Equation (1) represents the functional relationship between selected economic variables: inflation, infrastructure, exports, imports and FDI and economic growth (represented by real GDP). Real GDP has been chosen as an indicator for economic growth over nominal GDP as it better reflects changes in production levels. The theoretical framework of the study has been depicted in Figure 1.
Conceptual Framework of the Study.
Following panel data regression and introducing baseline model in Equation (1) the has been augmented for pooled ordinary least squares (OLS), fixed effect model and random effect model as given by Equations (2), (3) and (4), respectively:
Pooled OLS:

Fixed effect model:

Random effect model:

where GDP represents the real GDP of country i during time period t. To represent economic stability, we resort to the standard literature measure, inflation, represented by variable INFLA. INFRA represents infrastructure. EX and IM represent export and import, respectively. The variable FDI has represented FDI inflows.
Previously, number of telephones per thousand inhabitants has been used as a proxy for measuring infrastructure (Ancharaz, 2003; Asiedu, 2002). However, this measure fails to capture the reliability of infrastructure as it focuses on availability only (Asiedu, 2002). Furthermore, Demirhan and Masca (2008) have expressed that it excludes cellular telephones and encapsulates only the fixed-line infrastructure. Therefore, due to the shortcomings as highlighted and lack of reliable data, we resort to using mobile cellular subscriptions per hundred people as a measure of infrastructure.
Panel data analysis has been used to determine the impact of particular variables on growth. Both panel regression models and pooled regression models were used in the statistical study. Panel regression models encompass any potential country-specific variation as well as the advantages of pooled regression models.
To examine the best-fit model out of the three estimated models, various statistical tests are utilised. First, to check whether OLS model is better than the fixed effect model standard F-test has been conducted. If the null hypothesis (which assumes that all constants are homogenous; fixed effect does not exist) is rejected, the fixed effect model must be utilised. Additionally, the Hausman (1978) test has been used to choose between random and fixed effect panel models. The Hausman statistic is asymptotically distributed as a chi-square with k degrees of freedom, according to the null hypothesis. Therefore, rejection of null hypothesis leads to utilisation of fixed effect model. Lastly, to compare between the random effect model and common constant model (OLS), Breusch–Pagan Lagrange multiplier (LM) test is used. Simple OLS regression model can be used if there exist no significant differences across countries.
Descriptive statistics of the data collected for each country over the time period for this study have been reported in Table 2. It enables the provision of basic information about variables in a data set.
Descriptive Statistics.
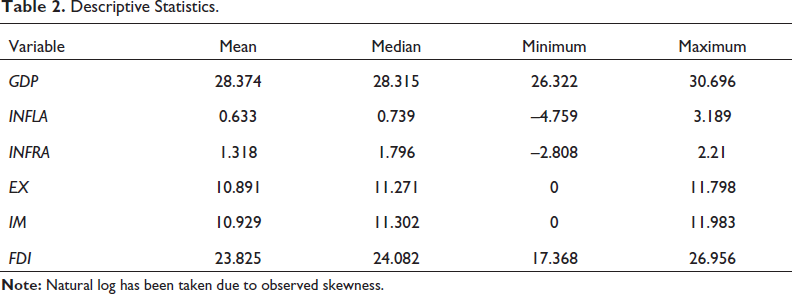
Descriptive Statistics.
Per the descriptive statistics revealed in Table 2, the mean value of GDP is 28.374. It has a range from 26.322 to 30.696. Inflation ranges from –4.759 to 3.189 and the mean value is 0.633. Infrastructure has a mean value of 1.318 and ranges from –2.808 to 2.21. Exports range from 0 to 11.798 and the mean value is 10.891. Imports have a mean value of 10.929. The mean value of FDI is 23.825, ranging from 17.368 to 26.956.
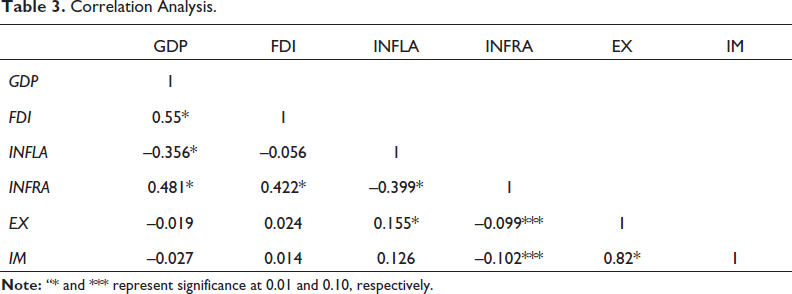
The result of correlation analysis between explanatory variables and the dependent variable is presented in Table 3. According to these results, all the explanatory variables considered in this study which are FDI (r = 0.55), inflation (r = –0.356) and infrastructure (r = 0.481) are significantly correlated with GDP. However, exports (r = –0.019) and imports (r = –0.027) are not significantly correlated with GDP.
Correlation Analysis.
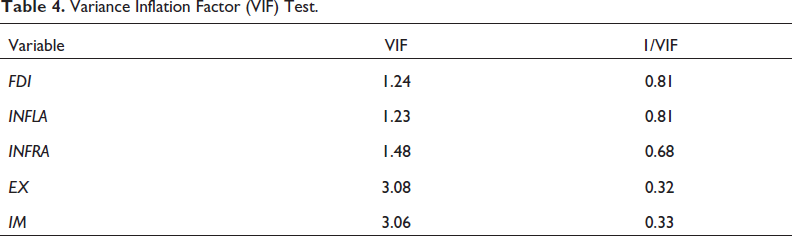
To detect multicollinearity, variance inflation factor (VIF) and tolerance were employed. Any variable with a tolerance value less than 0.10 or VIF value greater than 10 indicates multicollinearity problem. As per the results reported in Table 4, none of the variables have VIF values exceeding 10, therefore no multicollinearity problem exists among the independent variables.
Variance Inflation Factor (VIF) Test.
The results of pooled OLS, fixed effect and random effect models have been reported in Table 5. Per F-statistic, all three models are significant in explaining the impact of selected variables on the growth (pooled OLS model: F = 44.884, p = .000; fixed effect model: F = 33.6496, p = .000; and random effect model: F = 210.4, p = .000). First, to compare the pooled OLS and fixed effect model, F-test has been conducted and the null hypothesis has been rejected. Therefore, fixed effect model is preferred over pooled OLS. Second, to select between random effect and fixed effect models, Hausman test has been performed and per test statistic (16.785, p < .01) null hypothesis has been rejected. Third, the outcome of LM test indicates that null hypothesis cannot be rejected. Therefore, based on the results, it has been concluded that fixed effect model is the appropriate research model for the study.
Panel Data Analysis.
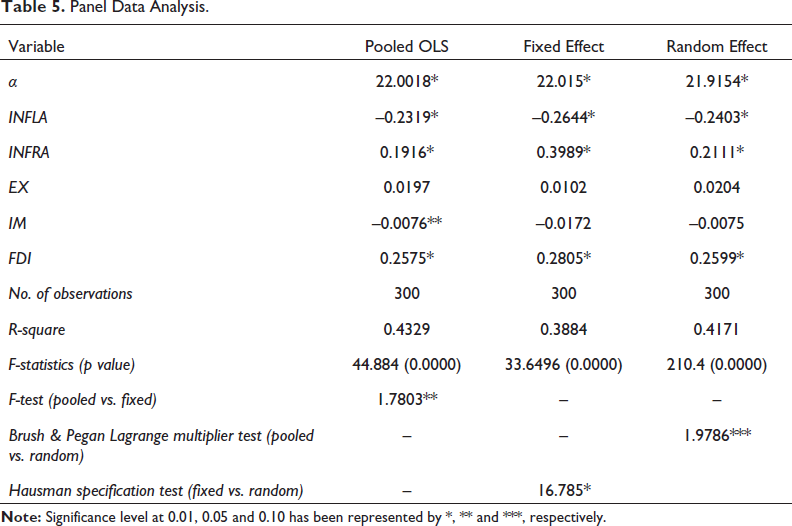
The results for the fixed effect model have been reported in Table 5. As per the fixed effect model, 38.84 per cent of the total variation in the GDP has been explained by the inflation, infrastructure, exports, imports and FDI for the selected countries from 1990 to 2019. Out of five explanatory variables considered in this study, FDI inflows and infrastructural progress have shown a significant positive effect on economic growth. Significant negative coefficient indicates inverse relation between inflation and growth. However, research hypotheses H3 and H4 cannot be rejected due to insignificant coefficients of EX and IM, respectively.
These empirical results have contradicted some of the recent studies that have concluded insignificant association between inflation and growth (Aziz & Azmi, 2017) and some that have discussed a positive relation (Mallik & Chowdhury, 2001; Osuala et al., 2013). The study results have supported the traditional notion that macroeconomic stability is required to attain higher economic growth (Madurapperuma, 2016; Mkango, 2015). High inflation rates make domestic macroeconomic environment unpredictable, which hampers resource allocation decisions and investments. During the 1990s developing economies were able to attain growth by limiting inflation and making progress on fiscal consolidation (Montiel & Servén, 2006). It is not surprising that economic crises coincide with high inflation rates (Fischer, 1992); for instance, Russia had a severe macroeconomic meltdown in 1998 when the inflation rates peaked at 84 per cent (Pinto et al., 2000) and the ongoing Sri Lankan economic downturn (Klem & Samararatne, 2022).
Empirical results concluded that sound infrastructure prompts higher economic growth. Infrastructural development helps to bolster growth in many ways and channels, like reduction of input and transaction costs, productivity enhancement, enhancement of trade and job creation causing economic growth in the end (Khan et al., 2020). Poor infrastructure creates bottlenecks for businesses; for instance in Bangladesh where irregular electricity supply remains one of the biggest challenges (Ahmed et al., 2020). On the other hand, developing countries like Vietnam and China are able to augment growth by investing significantly on infrastructure (Straub, 2008). FDI amplifies trade volume (Markusen & Venables, 1998) and domestic capital (Driffield, 2001). Foreign investments act as a vehicle to transfer technology (Findlay, 1978) and play a critical role in developing knowledge base of the host country (Chatterjee & Kundu, 2021). Developing countries, especially BRICS nations, have been able to reap exponential benefits from foreign investments.
Many favour exports and imports as the path for economic expansion (Agrawal, 2015; Awokuse, 2007). However, this proposition has not been supported by empirical results. Although promoting foreign trade, especially exports, may not be harmful to the economy. However, extensive reliance on exports as a growth engine might be deceptive. It is worth noting that the possible benefits of promoting exports are beyond the scope of the present study. However, the study stresses that considering trade as a focal point of growth might be misleading. The Chinese experience, especially in 1989 and again after 1997, depicts how ELG can create asymmetrical dependence on external economic actors (Breslin, 1999). The Asian financial crisis questioned the Chinese export-orientated strategies, as China lost its competitive advantage in export pricing gained due to devaluation in 1994. Lack of openness was the chief reason why China was able to protect itself during the financial crisis. In China, imports played no significant role in economic expansion during the 1990s (Yu, 1998) rather Chinese growth is input-driven (Krugman, 1994). The Chinese experience raises the question of whether trade leads to sustainable long-term growth. Similarly, stellar growth of many East Asian economies is attributable to various factors, such as rapid growth of service sector, enhancement of labour productivity and expansion of domestic market. Growth leads to exports, rather than growth being export-led (Ahmad & Harnhirun, 1996; Thangavelu & Rajaguru, 2004).
Conclusion
The present study has been conducted to answer one of the most controversial questions in the literature of economics, that is, what drives growth? Economists and eminent scholars have made many attempts to answer this question. However, the literature consists of mixed results. This is because of differences in the selection of samples, time periods, etc. The present study considered a sample of the 10 largest economies (in terms of GDP) for a span of 30 years to examine what boosted growth in these economic giants. The results unveiled that macroeconomic instability or variability is detrimental to economic growth. Empirical results have revealed that influx of FDI bolsters growth in the selected countries. The model has also revealed that infrastructural progress and trade have an insignificant impact on growth. Thus, it contradicts the traditional notion of rapid growth via increasing trade. However, the study does not purport that international trade hinders economic growth. It merely emphasises that extensive reliance on trade for rapid growth might be deceptive.
This study has tried to examine the growth drivers in the 10 largest economies since these countries are the ‘bright spot’ in world economics. The study offers possible future direction of research by extending this study to developing economies, such as MINT economies and ASEAN nations. The study has an important implication for policymaking in developing countries. Additional variables can be incorporated in the model utilised in the study subject to availability of data and theoretical justifications. Despite this, the results have provided well-suited findings for policymakers to understand the growth story of these economic giants and assist them to design an efficient policy framework in developing countries.
This article extends our understanding of the relationship between the constellation of macroeconomic forces and growth. In our view, there is no ready-made solution that can give an accurate picture of drivers of growth, and a ‘handbook’ for the same is not available. Therefore, countries shall adopt a pragmatic approach to economic policies.
Footnotes
Declaration of Conflicting Interests
The authors declared no potential conflicts of interest with respect to the research, authorship and/or publication of this article.
Funding
The authors received no financial support for the research, authorship and/or publication of this article.