






Abstract
In the past decades, G-20 countries have witnessed heterogeneous demographic transitions, yielding diversified economic growth outcomes, and exploring this relationship between the demographic dividend and the economic growth of these countries is of global importance, given the share of G-20 members in the world economy. Along with extensive graphical examinations of the underlying annual data of G-20 countries for the period between 1995 and 2019, this study deploys the panel cross-sectional autoregressive distributed lag method to probe the impact of the demographic dividend on real gross domestic product growth while comprehensively controlling for investment, trade, natural resources, financial development and government expenditure. This study finds evidence that the demographic structure, proxied by the support ratio, is an important conditional determinant of aggregate economic growth among G-20 countries, with statistically significant short-run and long-run associations in the pooled sample.
Introduction
Demographic dividend, in terms of the share of the working-age population in the total population, has been extensively studied in the literature as a factor that drives economic growth. The group of G-20 countries constitutes 60% of the world’s population and contributes 50% of the world’s gross domestic product (GDP). Noticeably, in recent years, members of the G-20 have experienced heterogeneous trends in their population age structure changes, while their economic growth rates vary broadly. G-20 members share a great diversity of geographical locations, demographic compositions and economic development. For example, East Asian countries like China, Japan and Korea have developed a low-fertility and ageing-population environment. In contrast, countries like India, Indonesia and South Africa are still developing a large pool of young and working-age population. Developed countries like the US, UK and EU have higher economic development, both an ageing population and higher human capital formation.
Investigating the demography-growth relationship is crucial, as it is ultimately instrumental in poverty reduction (Mason & Lee, 2004), gender equality (McNay, 2005), social protection (Ye, 2011), environment (Mohd Yaziz et al., 2022), climate change (O’Neill et al., 2000) and democracy (Haffoudhi & Bellakhal, 2020; Lechler, 2014).
This study finds significant positive short-run and long-run impacts of the growth of the demographic dividend on the growth of the economy in G-20 countries, with evidence of a satiation point for the demographic dividend. Investment and government spending also tend to be effective in stimulating higher economic growth. The demographic dividend can be proxied by the support ratio (Prskawetz & Sambt, 2014; Rentería et al., 2016), which is the ratio of the population in the age group of 15–64 years old to the population in the age groups of 0–14 and more than 65 years old. Support ratios of G-20 regions are depicted in Figure 1.
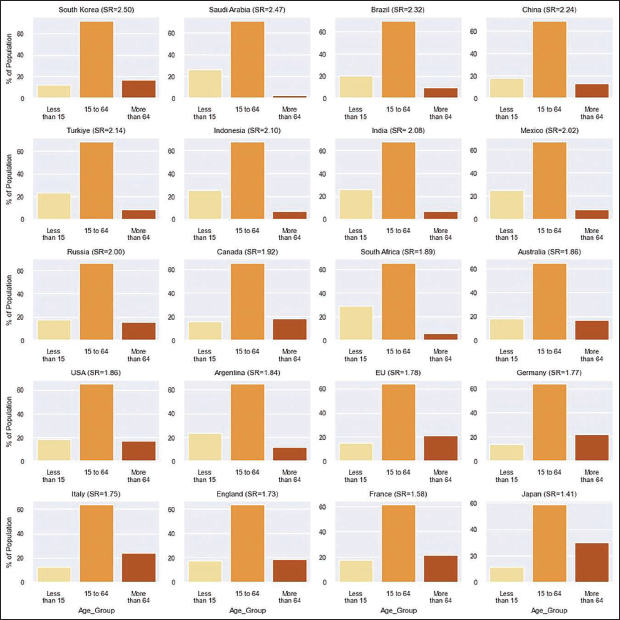
In 2022, South Korea, Saudi Arabia, Brazil and China have the highest support ratios, while Italy, England, France and Japan have the lowest support ratios. The three channels (Hansen, 1939; Kirk, 1996; Lee, 2002) linking a declining support ratio (signifying fading demographic dividend) to a negative impact on economic growth are illustrated in Figure 2.
Plausible Channels of Impact of Support Ratio on the Economy.
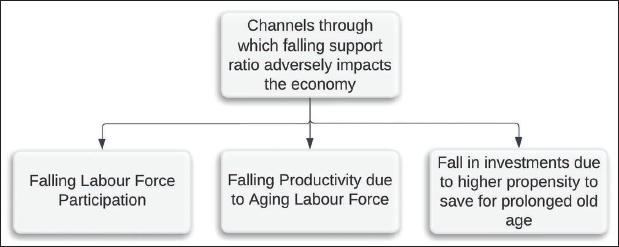
Figure 2 isolates the demographic channel to clarify the theoretical pathways through which support-ratio changes may affect aggregate output. This graphical decomposition does not imply demographic determinism, as the net effect of a changing support ratio depends on complementary factors such as human-capital accumulation, technology adoption, migration, institutional quality and policy responses, any of which can amplify or offset demographic forces. We therefore interpret the figure as showing one channel among several interacting determinants of growth.
However, since the evidence of the direction of the impact of the falling support ratio has been challenged by Acemoglu and Restrepo (2017), it is of appreciable empirical importance to re-probe the relationship between the demographic dividend (proxied by support ratio) and economic growth. Our study takes advantage of the panel cross-sectional autoregressive distributed lag model (CS-ARDL), controlling for other economic factors for G-20 countries, to study the demographic dividend with other economic factors on the economic growth of G-20 countries. The formal model deployed in this study is given in Section III. We selected G-20 countries because they constitute a policy-relevant set of major economies with diversified demographic transitions; the aim is to understand whether a common demographic channel operates after accounting for heterogeneity. The CS-ARDL framework employed here accommodates slope heterogeneity and cross-sectional dependence, allowing cross-country differences in growth mechanisms to be reflected in the estimation while retaining sufficient time-series information for robust inference.
The rest of the article is organised as follows: Section II reviews the relevant literature, followed by Section III, which describes the data. The methodology is presented in Section IV. Findings are presented in Section V, along with the discussion, and the study is concluded in Section VI, which also discusses the limitations of the article, along with ideas for future research.
The recent stream of literature on the relationship between demographic dividends and economic growth can be classified (Figure 3) as theoretical, non-econometric and econometric studies.
Mapping Relevant Literature.
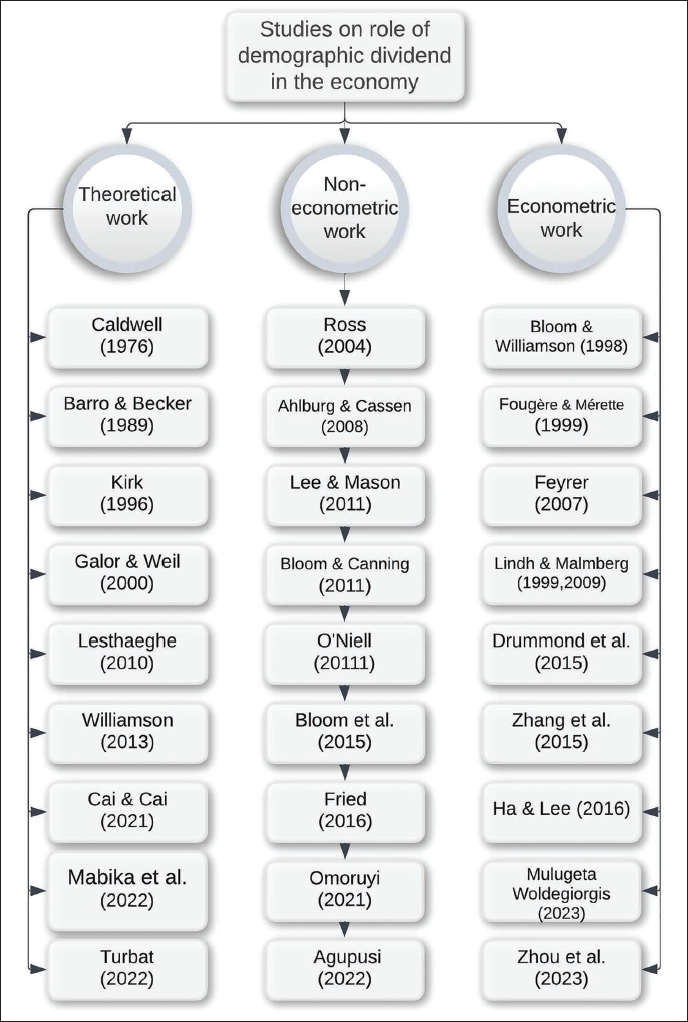
Mapping Relevant Literature.
Theoretical Studies
The theoretical literature links demographic change to economic growth through labour supply, savings behaviour, human-capital accumulation and technological adaptation. Early contributions, such as Barro and Becker (1989) model fertility–growth interactions, while Galor and Weil (2000) formalise how demographic transition and human-capital investment jointly shape long-run development. Kirk (1996) and Caldwell (1976) emphasise that the timing and sequencing of demographic transition matter for economic outcomes. Collectively, these frameworks imply that age-structure effects on growth operate through multiple interacting channels rather than a single deterministic mechanism.
Though Caldwell (1976) suggested that the demographic transition precedes economic growth, the ambiguity in the interaction of economic development and the demographic transition was first highlighted by Kirk (1996). Though the concept of the demographic dividend had not evolved by that time, Barro and Becker (1989) also theorised the interplay of fertility choices and economic growth in their work. The theoretical framework of endogenous demographic transition proposed by Galor and Weil (2000) suggests that, despite a higher dependency ratio in the later phase of transition, improvements in the quality of human capital would result in higher economic growth rates. This theory was formalised by Lesthaeghe (2010) in the context of industrialised Asian economies. Williamson (2013) brought in the element of emigration in the theory of demographic dividend, and Cai (2021) theorised about the transition from demographic dividend to reform dividend. Recently, the theoretical approach of demographic dividend studies has evolved into the operationalisation of the dividend-yielding mechanism, for example, Mabika et al. (2022) and Turbat (2022).
Non-econometric Studies
Policy-oriented and descriptive studies emphasise that demographic dividends are conditional on complementary factors. Bloom and Canning (2011) argue that education, health and labour-market policies are critical for translating favourable age structures into economic growth, while Bloom et al. (2007) highlight similar conditionality in the African context. Ross (2004) characterises demographic transition as a ‘window of opportunity’ that requires appropriate policy responses. He argued that if countries ‘act wisely’, the phase in demographic transition where the share of the working-age population increases can act as a window of opportunity for economic growth. Measurement-focused work by Prskawetz and Sambt (2014) clarifies how support ratios capture demographic dependency, providing a conceptual basis for the empirical analysis.
Ahlburg and Cassen (2008) suggested that demography can impact the economy through its relationship with poverty and the environment. Lee and Mason (2011) contended that the demographic dividend can enhance productivity. In another non-econometric study by Bloom and Canning (2011), it has been concluded that the countries with higher levels of human capital see stronger demographic dividend effects on economic growth. O’Neill (2011) illustrated that societal ageing, contrary to popular perception, is indeed a source of demographic dividend. Bloom et al. (2015) emphasised the importance of the health of the ageing population, which, as per Fried (2016), along with the social capital of this category of population, formed the basis of the ‘third’ demographic dividend. This stream of literature has drawn from the ‘frameworks’ of harnessing the demographic dividend for African countries. For example, Omoruyi (2021) argued for replicating the growth strategy of East Asian countries based on reaping the demographic dividend in Africa.
Econometric Studies
Econometric studies provide mixed evidence on the growth effects of demographic change. Bloom and Williamson (1998) document a strong association between demographic transition and economic growth in East Asia, operating primarily through savings and investment channels. Due to its econometric rigour and reception in the literature, we identify the work of Bloom and Williamson (1998) as a seminal study in the domain of the demography-economy relationship, wherein it was concluded inter alia, 1 that demographic dividend boosts economic growth through higher savings and investment in the economy. This result means that increasing the dependency ratio in an economy would negatively impact economic growth. Yet, Fougère and Mérette (1999) concluded that the ageing population can also contribute to economic growth through the channel of increased investment in human capital.
The impact of age structure on economic growth remains an open question in the literature due to contrasting findings in studies. Feyrer (2007) and Lindh and Malmberg (1999, 2009) find that productivity effects vary across age cohorts, suggesting that demographic impacts depend on the composition of the working-age population. While the former discovered that entry into the 40–49 age group results in better worker productivity, thus positively impacting economic growth in Organisation for Economic Co-operation and Development (OECD) countries, in contrast, the latter found a positive correlation between the initial share of the upper middle-aged group (50–64 years) and the growth rate of the economy. Their study on OECD countries concluded that labour productivity was influenced positively by the 50–64 age group, negatively by the group above 65, and ambiguously by the younger age groups. This contrast in findings emanates from different methods deployed in the two studies. Other studies show that ageing does not necessarily imply slower growth: Fougère and Mérette (1999) and Maestas et al. (2016) find that productivity and human-capital channels can partly offset labour-supply effects, while Acemoglu and Restrepo (2017) emphasise the role of automation and capital substitution. Overall, the literature suggests that demographic effects on growth are heterogeneous and context dependent.
Econometric studies of different regions/countries present different effect sizes of the demographic dividend on the economy. Drummond et al. (2014) found that Africa will account for 80% of the projected 4 billion increase in the global population by 2100. Zhang et al. (2015) incorporated a development accounting framework for Chinese provinces and inferred that almost one-fifth of the rise in GDP can be attributed to changes in the age structure. Cooley and Henriksen (2018) attributed the fall in the economic growth rate of advanced economies to the declining support ratio. In contrast, Goh et al. (2020) found that the declining support ratio produces a mixed impact on economic growth, with both periods of high growth and stagnation as outcomes.
Existing research agrees that demographic structure matters for economic growth, but disagrees on the magnitude and even the direction of the effect, depending on country characteristics, period and complementary factors. Empirical differences arise from sample selection, demographic measures and econometric methods. This study contributes by examining a heterogeneous but economically significant group of countries (the G-20), using the support ratio as a direct demographic proxy, and applying a CS-ARDL framework that allows for slope heterogeneity and cross-sectional dependence while controlling for key macroeconomic factors. To the best of the author’s knowledge, there is no study exploring the impact of demographic dividend on the economic growth of G-20 countries. This study attempts to bridge this gap in the literature.
To answer our research questions, we collected data on annual GDP, the demographic dividend (expressed by support ratio), investment (as a percentage of GDP), the Financial Development Index, trade ratio (as a percentage of GDP), natural resource rent and government expenditure (as a percentage of GDP) for G-20 countries for the period 1995–2019. A description of the variables and their sources is given in Table 1.
Variables Used in the Study.
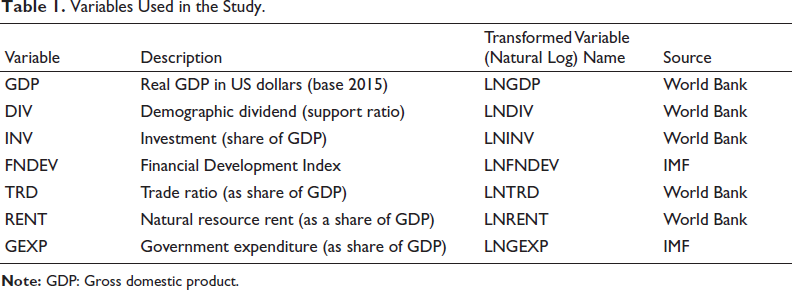
Variables Used in the Study.
In this study, we use aggregate real GDP (LNGDP) as the primary growth variable. We focus on aggregate output because demographic shifts operate through aggregate channels, scale effects on labour supply, aggregate demand and economy-wide capital accumulation, in addition to per-capita productivity channels. The support ratio explicitly captures population-structure changes, which motivates interpreting results in terms of economy-wide growth dynamics. We acknowledge that GDP per capita is widely used in growth literature. Re-estimation with per-capita measures is recommended as a robustness exercise when longer or more consistent country-level panels become available.
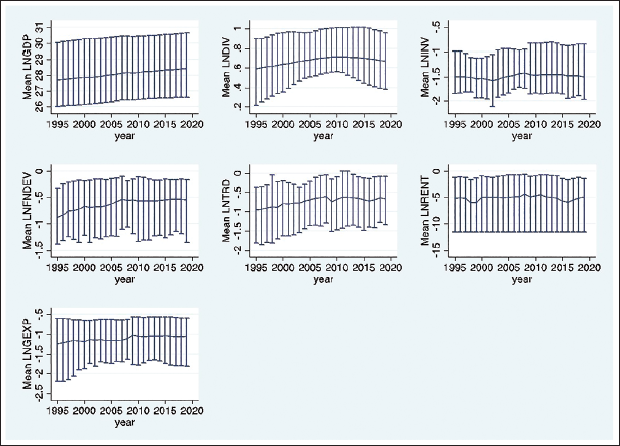
To better understand the data, we calculated related statistics of these variables and visualised the data series with ranges along the time horizon. The descriptive statistics of these variables are given in Table 2. Figure 4 highlights the trend and range of variation in the variables.
Descriptive Statistics.
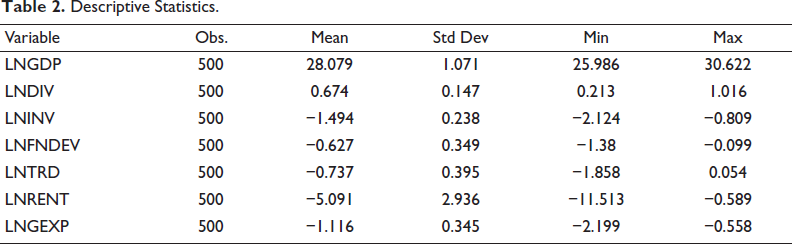
Variables are reported in natural logs. Logarithms of ratios (trade/GDP, investment/GDP and so on) will be negative when the underlying ratio is below unity; hence, the negative mean values in the table do not indicate data errors.
Mean and Range of Variables.
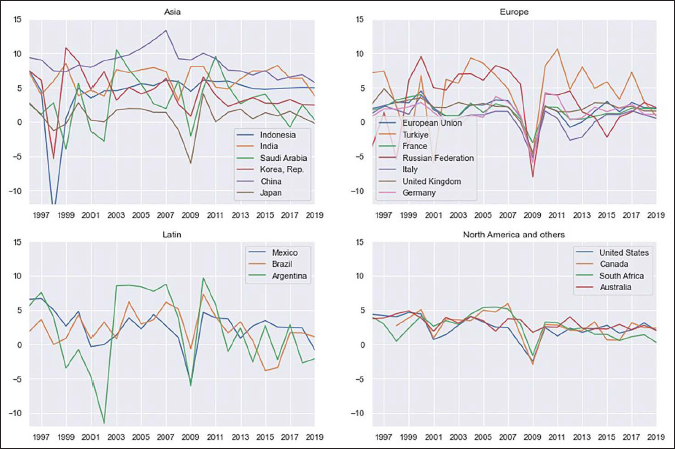
We plot original and annual support-ratio changes for G-20 members, showing Asia’s advantage mainly from Saudi Arabia, India and China. Europe and North America decline after ~2009, while Latin America trends upward.
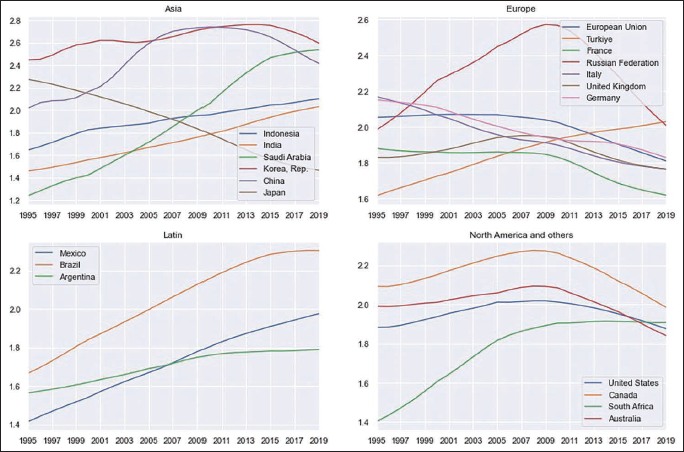
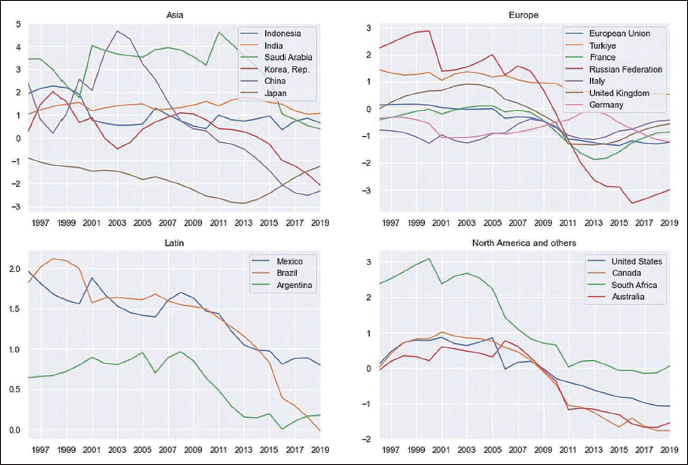
India shows steady support-ratio growth, Saudi Arabia grows fastest, while Japan declines, and China, with South Korea, turns from positive to negative around 2009. Turkey rises; the Russian Federation, France, UK and Italy decline; Latin America’s gains are slowing, and Australia, Canada, USA and South Africa shifted to zero/negative growth around 2009. Lastly, we show the annual real GDP growth rate in all four sub-regions of the G-20 in Figure 5, corresponding to the support ratio visualisation in Figures 6 and 7.
We further conducted a visual examination with greater detail, breaking the sample into four time-horizon regimes, before proceeding to the econometric analysis.
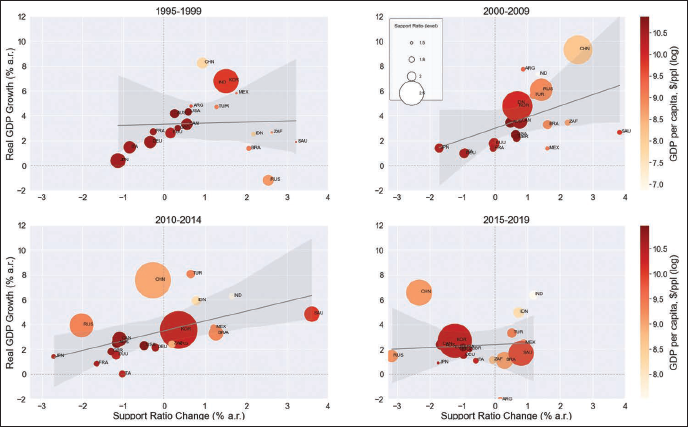
Figure 8a depicts the regime median dot plots, wherein the size of the dots indicates the size of the population. The time regime is broken down into four parts by a 5 or 10-year window. China’s economic growth remains high despite a leftward shifting support ratio, as technological gains in China are seemingly able to outpace the impact of the falling support ratio. Most of the countries are shifting leftwards in the support ratio in subsequent regimes. The economic growth varies widely at the right end of the range of support in all four regimes, compared to that in the left and the middle of the range of the support ratio, indicating that, as the support ratios of countries fall, the economic growth converges. Countries having high GDP per capita occupy the centre space in all four regimes. This could mean high-income countries are able to maintain economic growth (probably due to immigrant labour or by labour-substituting capital), but they find it difficult to match the economic growth of emerging economies. In three of the four regimes, the support ratio’s relationship with economic growth is categorically positive. The slope of the support ratio growth-GDP line starts flattening in the last regime (bottom right panel). These observations motivated us most to econometrically analyse the relationship between demographic dividend and economic growth in G-20 countries.
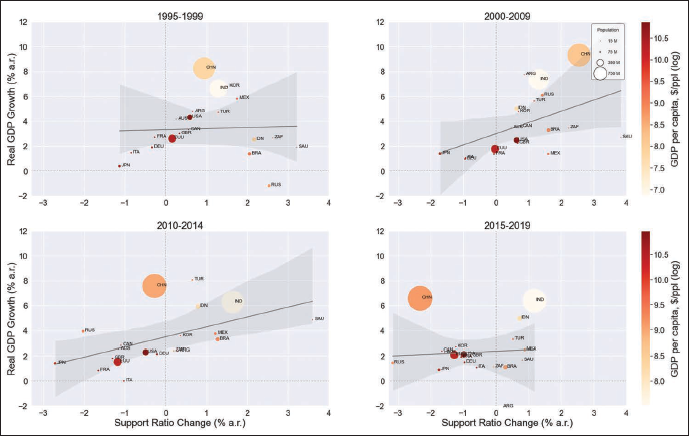
The dynamics of the support ratio-GDP relationship progressing across regimes depict (Figure 8b) that support ratio levels are shrinking with time in general, while GDP growth rates are less prominent. Given that the support ratio levels are low for most countries in the first regime (top-left panel), as well as the regression line slope changes in these four subplots (steeper than flattening in recent years), there is possibly an inverse U-shaped curve between the support ratio level and economic growth.
Our empirical objective is to estimate both short-run dynamics and long-run relationships between the support ratio and aggregate GDP while allowing for heterogeneous slope effects and common shocks across countries. We therefore adopt the CS-ARDL framework. The CS-ARDL combines the ARDL error-correction logic (which permits I(0) and I(1) regressors) with cross-sectional augmentation (averages of dependent and independent variables) to capture unobserved common factors and cross-section dependence. Given our panel (G-20, 1995–2019; N = 20, T = 25, total obs. = 500), the CS-ARDL provides a suitable balance between dynamic flexibility and the need to model cross-sectional dependence.
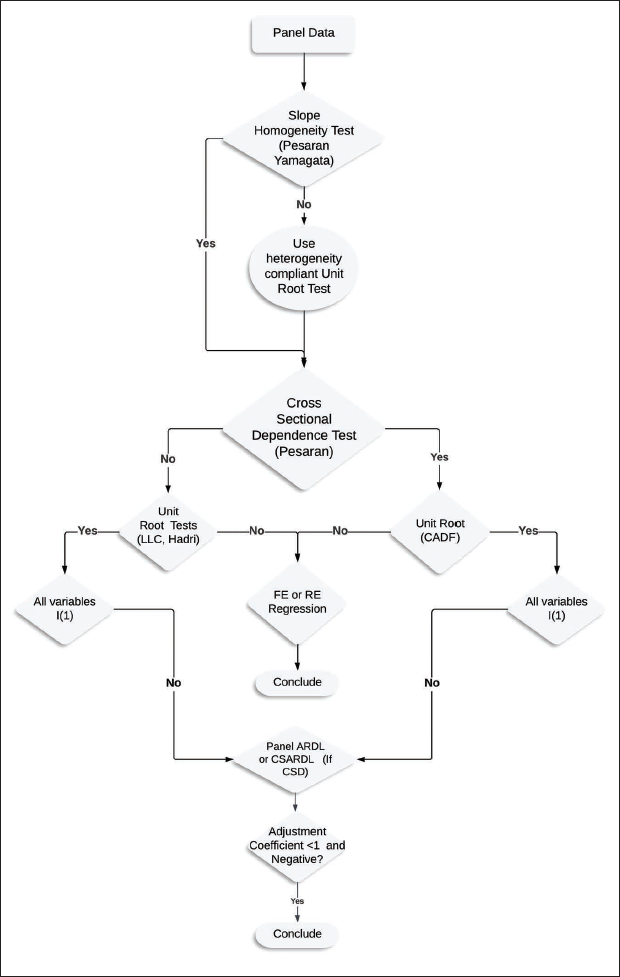
Following the decision tree depicted in Figure 9, we first carry out the Pesaran–Yamagata panel heterogeneity test 3 and both the cross-sectional dependence test and the stationarity test.
Decision Tree.
Decision Tree.
Theoretically, the impact of demographic dividend (proxied by support ratio) on the economy emanates from the ‘compositional effect’ given by Auclert et al. (2021) of the age structure of the population, wherein the support ratio is the age distribution of age j at time t, given by 
In this study, we take j as the canonical age group of 15–64, and (1–j) represents the summation of the population in age groups less than 14 and above 65.
Further, the aggregate output of an economy is given by

Wherein Kt is the capital proxied by investment, Zt is other factors (such as investment, financial development, trade ratio, natural resource rent and expenditure). While Lt is the average effective labour input given by

Where 
The impact of the support ratio
The Z vector is chosen to capture core macroeconomic channels highlighted in theoretical and empirical growth work, while preserving cross-country comparability and the panel dimension required by CS-ARDL. Specifically, investment share, trade ratio, financial development, natural resource rents and government expenditure are included because they are (a) theoretically important, (b) available for essentially all G-20 members for 1995–2019, and (c) amenable to the dynamic panel treatment. Variables commonly used in growth studies, such as more granular human-capital measures (such as years of schooling disaggregated by cohort), governance or institutional indices with sporadic annual coverage, or detailed labour-market policy dummies, are not used because besides the availability of data for the period under study, their inclusion would either drop many country-years or force use of shorter, uneven panels that undermine CS-ARDL’s T requirements. We therefore treat these omitted variables as potential confounders and address them conceptually in the robustness discussion and empirically in future research when longer, harmonised panels permit.
The formal model to be run in this study, having growth in GDP as a function of the explanatory variables, is represented in Equation (5).
The following linear model can be deployed to find coefficients:

where LNGDP is real GDP, LNDIV is support ratio, LNINV is investment (share of GDP), LNFNDEV is Financial Development Index, LNTRD is trade as (share of GDP), LNRENT is natural resource rent (as share of GDP), and LNGEXP is government expenditure (as share of GDP); all variables in log-transformed form.
Subsequently, the ARDL approach involves the following model specification:

where
While per-capita GDP is a standard dependent variable in many micro-founded growth studies, the principal mechanism we investigate, the changes in the support ratio, affects both the level of effective labour and aggregate demand, as well as per-worker productivity. Using aggregate real GDP allows us to capture scale and aggregate labour-supply channels together with productivity channels, while the explicit inclusion of the support ratio isolates compositional effects from pure population growth. The CS-ARDL framework accommodates mixed integration orders and dynamic adjustments; nevertheless, we note that interpretations should be read as conditional on the chosen growth measure. We flag estimation with GDP per capita and related robustness checks (such as controlling for population growth separately) as desirable extensions when longer time series permit.
The long-run coefficient 
Where
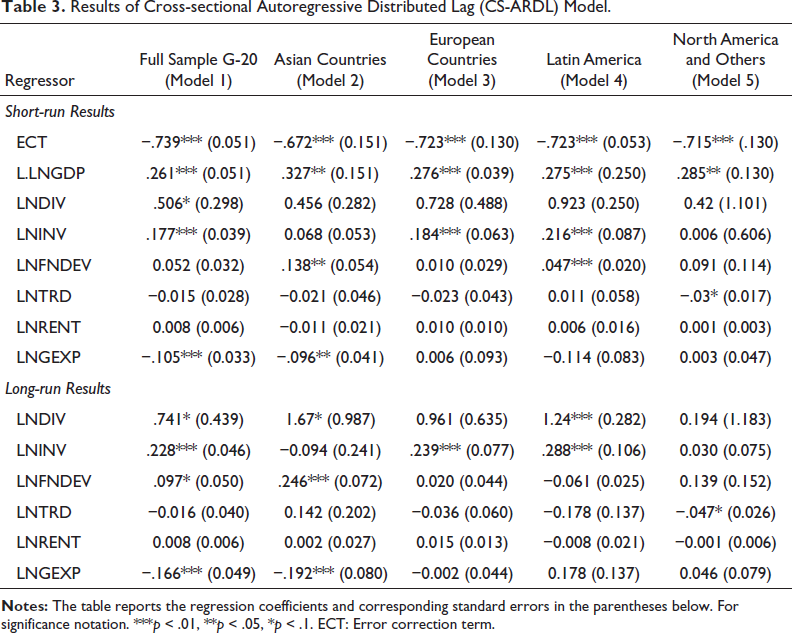
In CS-ARDL, cointegration is commonly assessed via the ECT: a negative and statistically significant ECT indicates a stable long-run relationship. Accordingly, Table 3 in the next section reports a negative and significant ECT across models, providing evidence that the variables are cointegrated and that long-run coefficients are meaningful.
While GDP per capita is standard in many growth studies, this study focuses on aggregate real GDP growth because the demographic dividend can operate through scale and aggregate labour-supply channels as well as through productivity. The support ratio explicitly captures population structure; using aggregate GDP growth, therefore, aligns with the article’s objective to examine economy-wide output dynamics. We note that re-estimating with GDP per capita is a useful robustness check and encourage this in future work when longer panels are available.
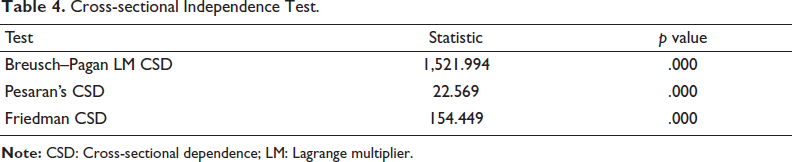
All three results of the cross-sectional dependence test reject the null hypothesis of no cross-sectional dependence (Table 4), and the null hypothesis of slope homogeneity is rejected in the results of the slope homogeneity test (Table 5).
Cross-sectional Independence Test.
Cross-sectional Independence Test.
Slope Homogeneity Test.
Correlation Matrix.
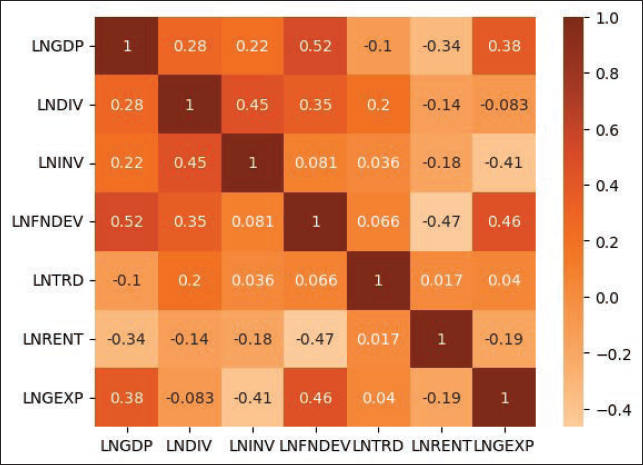
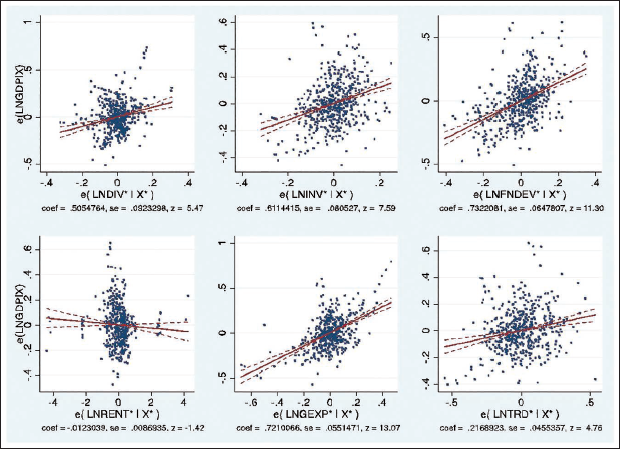
Figure 10 shows the correlation between variables, and the results of the Hausman tests are available with authors. We examine the correlation of GDP growth with each of the explanatory variables, conditional on other variables. The added variable plots, as in Figure 11, depict the direction of the relationship of explanatory variables with economic growth.
Added Variable Plots for Correlation.
CS-ARDL results (Table 3) show that the adjustment term is less than one, negative and significant for the growth of demographic dividend, investment, government expenditure, natural resource rent and financial development.
Results of Cross-sectional Autoregressive Distributed Lag (CS-ARDL) Model.

The results indicate that in all the sub-regions of G-20, there is long-run adjustment (the ECT’s coefficient is negative and significant) towards equilibrium, with a speed of adjustment of 74%. Interpreting the full-sample estimates, a 1% increase in the support ratio is associated with approximately a 0.51% increase in GDP growth in the short run and a 0.74% increase in the long run, conditional on the model specification and controls employed. For brevity and to keep the manuscript focused, we do not present a battery of formal panel cointegration tests in the main text. Instead, we rely on the CS-ARDL error-correction representation and the estimated ECT as our primary evidence of long-run equilibrium (see Table 3). The full panel cointegration test results (e.g., Westerlund, Pedroni, Kao) are available with authors.
Short-run effects of the demographic dividend are generally insignificant across subgroup models (2–5), likely due to limited data or a weak short-term impact. The long-run effect is broadly significant across models, though weaker in Models 3 and 5 for Europe, North America and other mostly developed countries. Higher investment raises GDP in both short and long runs, but changes in the support ratio have three times the impact of investment. Government spending lowers long-run GDP (crowding out); financial development helps only in the long run, while natural resources and trade show no significant effect. The lack of a statistically significant effect for trade openness in the full sample likely reflects that G-20 economies are largely mature, and the marginal contribution of additional openness to growth is limited; regional heterogeneity is visible in sub-sample estimates. Likewise, natural resource rents may have ambiguous growth effects depending on institutional quality and volatility. The insignificant coefficient in the pooled model is consistent with the mixed evidence in the literature.
We also have a robustness check (Table A1 of Appendix A) for the CS-ARDL model through mean group (MG), common correlated effects MG (CCEMG), and augmented MG (AMG) estimations. The significant positive relationships of the demographic dividend, investment and government expenditure on economic growth are mostly confirmed in MG, CCEMG and pooled mean group estimations. Different robust estimators (MG, CCEMG, AMG) weight cross-sectional slopes and common factors differently; hence, divergence in numerical magnitudes across estimators is not unexpected. Importantly, the sign and qualitative inference for the demographic dividend (LNDIV) are broadly consistent across estimators, supporting the main conclusion.
This study aims to investigate the relationship between the demographic dividend, as proxied by the support ratio, and the GDP growth rate among G-20 countries, and the analysis is guided by sound theoretical underpinnings; second, there is a comprehensively classified review of the literature; third, the exploratory data analysis deploys advanced graphical methods; and fourth, the appropriate methodology is preceded by a decision tree and succeeded by a robustness check. The observed positive association between the support ratio and GDP growth in G-20 countries has policy relevance for both developed and developing economies, though the magnitude and transmission mechanisms are likely to vary across country groups. Demography is largely endogenous; capital, migration and labour-force policies determine if a country captures the demographic dividend, many are near or past the window.
To maximise remaining gains, urgently scale education and skills, job creation, health and social protection, infrastructure, migration policy and financial inclusion. This study has certain limitations that we encourage researchers to address in future investigations. Due to the constraint of the requirement of a much longer time series for a fixed number of cross-section, we cannot run regressions by time-horizon regime breakdowns, which is a limitation of the study, though we do have our graphic analyses along the time-horizon regimes, compensating for this limitation. Also, due to the lack of data, we cannot decompose the impact of the demographic dividend. Because CS-ARDL requires sufficiently large T relative to N, splitting the G-20 sample into more finely grained groups or adding many additional controls would materially reduce usable observations and estimation reliability. We therefore leave a developed bifurcation and alternative specifications (including GDP per capita, human-capital interactions and formal nonlinearity tests) to future research when longer panels or more consistent cross-country series are available. The findings of this study are conditional on using aggregate GDP as the dependent variable. Future work should re-examine the demographic–growth relationship using GDP per capita and alternative output measures when longer panels become available.
Footnotes
Declaration of Conflicting Interests
The authors declared no potential conflicts of interest regarding the research, authorship and/or publication of this article.
Funding
The authors received no financial support for the research, authorship and/or publication of this article.
