
Abstract

Introduction
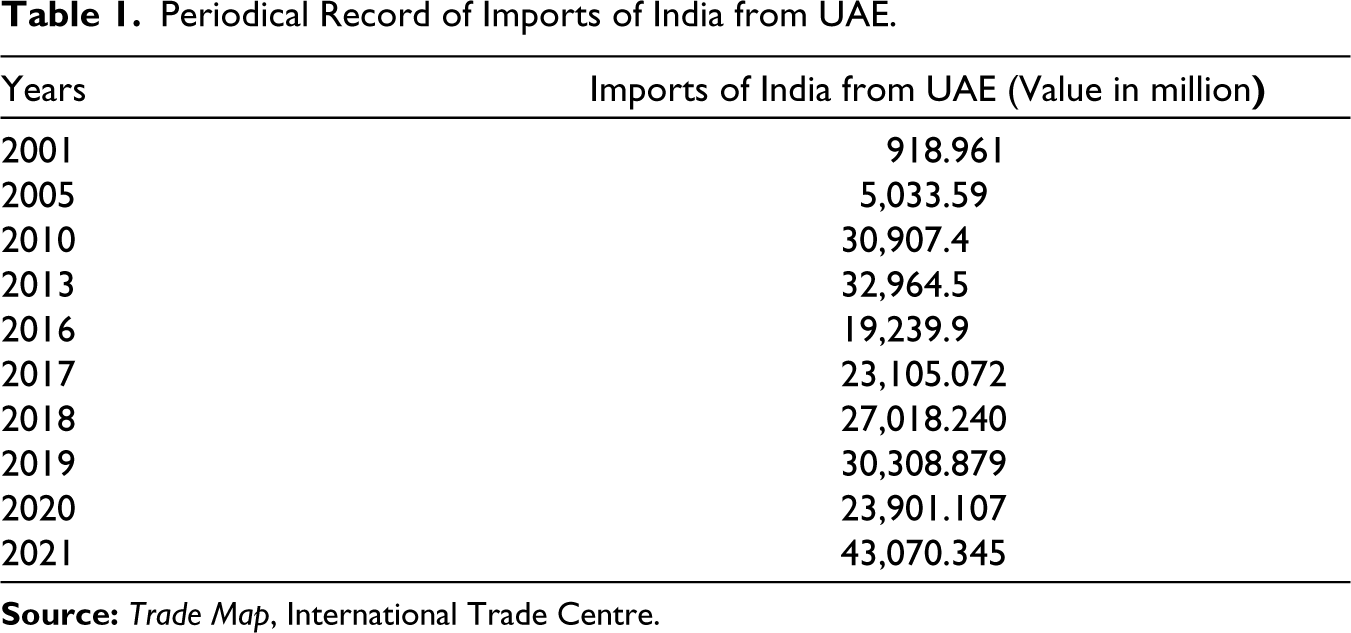
International trade is a global phenomenon. Basically, trade is an activity that brings people together, by means of culture and traditions that are being exchanged between the countries (Bhagwati, 2011). Moreover, it brings peace and gives it a place among the trading countries. It is the health of political relations which helps rise and gives direction to bilateral trade between the concerned countries. It needs to be highlighted that after 1991, due to neo-liberal economic reforms in India, it has emerged as leading industrialising economy followed by China. Growth of Indian economy picked up the pace which pushed up the demand for energy and oil resources (Elizabeth, 2019). At present, UAE is the third largest trading partner of India. Moreover, in 2008–2009 and in consecutive years it was the top-most trading partner of India (Department of Commerce, MOC). Hence it is fruitful and appropriate to know the strength and dependency of India and UAE on each other in terms of bilateral trade. Following is the periodical record of India’s imports from and exports to UAE from 2001 to 2021, a 20-year period has been taken into account (See Tables 1 and 2). From 2017 to 2021 continuous figures are being taken.
Periodical Record of Imports of India from UAE.
Periodical Record of Exports of India to UAE.
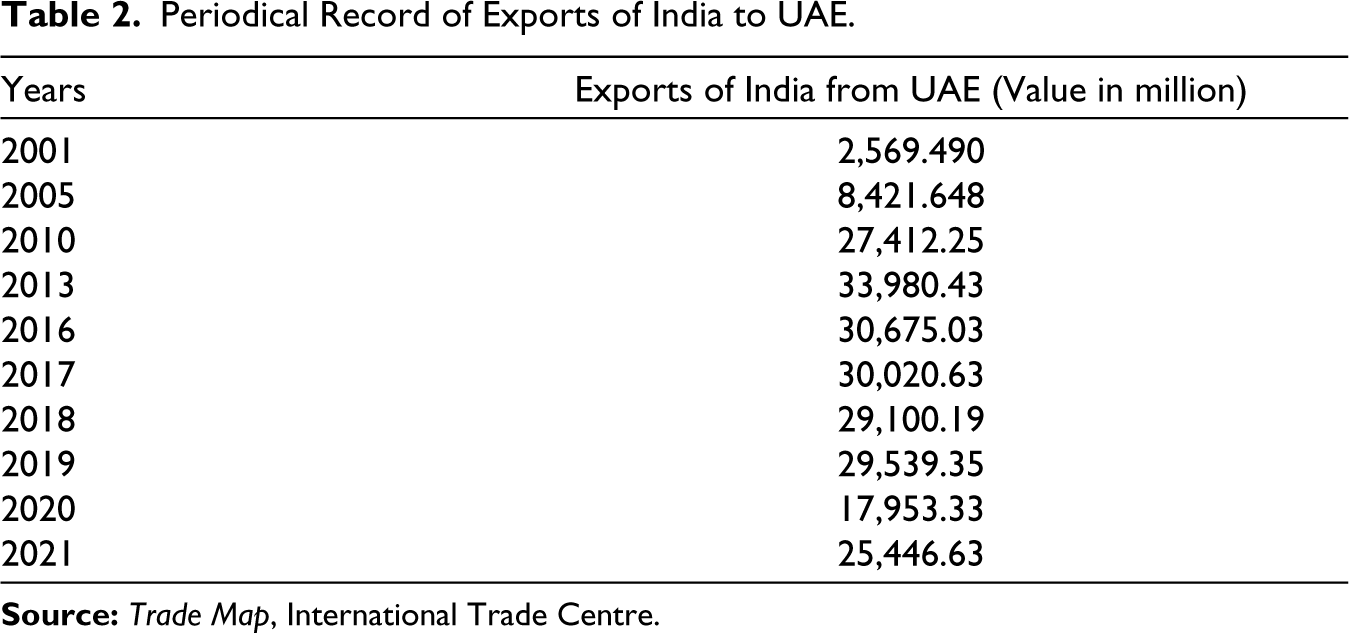
If we go through data provided by the Ministry of Commerce and Industry, trade basket of India and UAE is quite rigid. There is a rare change in the major trading commodities. Important exports of India to UAE are: pearls, precious/semiprecious stones, gold jewellery, coin, mineral fuel, mineral oil, bituminous substances, articles of apparel and clothing knitted or crochet. Articles of apparel and clothing not knitted, ships, boats, and floating structures, electrical machinery, its equipment, nuclear reactors, boilers and mechanical appliances, cereals, articles of iron and steel.
Method
This study had been carried out by taking into account secondary data from different national and international sources. In order to calculate the above-mentioned indices, data have been extracted for the period 2001 to 2016 from world integrated trade solution (WITS), International Trade Centre, generally known as trade map. Besides that, directorate general of foreign trade, Ministry of Commerce, Government of India, is other important source of data. Directorate of trade statistics, International Monetary Fund. Ministry of Economy, UAE, annual reports by the Central Bank of UAE. Data from annual reports published by the Ministry of Commerce, government of India, of different periods, are also taken into account.
The index used is Trade Intensity Index (TII). Trade Intensity Index reflects intensity of trade between the countries. This index was introduced by Kojima (1964). TII is a simple and useful tool to measure share of trade of one country with another country as a proportion of latter’s share of world total trade (Goyal & Vajid, 2018). The value of the index lies between 0 and 1. If the value of index is zero, it means that there is no trade between the concerned regions. Likewise, if the value is 1 it indicates high trade relations. If the values are more than 1 it means that there is much scope for trade between the concerned countries (Kumar, 2018).
Results
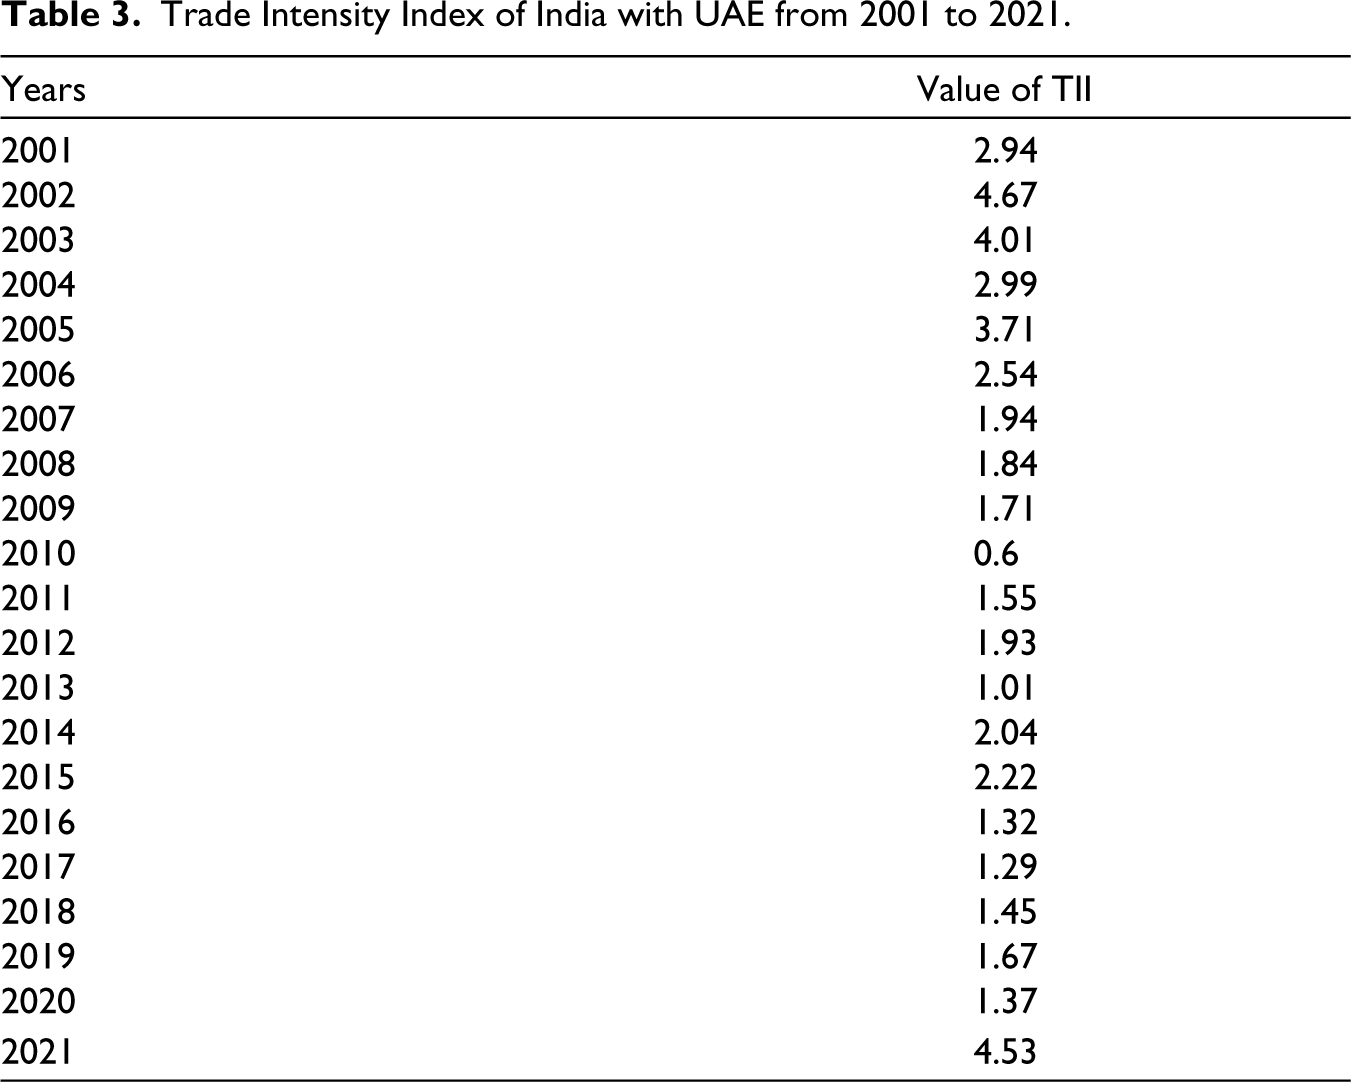
Trade Intensity Index of India with UAE from 2001 to 2021.
Discussion
As per the estimates produced by the Trade Intensity Index, all the values are greater than one except for the year 2010 (see Table 3). In 2001, index value was found to be 2.94, indicating intense trade between India and UAE as compared to UAE’s trade with rest of the world. For the years 2002 and 2003, the value of the index continued to rise and reached 4.67 and 4.01, respectively. It signified that India and UAE have remained strong and intense trade partners. Further, for the year 2004, trade intensity declined with a value equivalent to 2.99. Trade intensity improved between India and UAE during 2005, which was 3.71. However, there was a little decline in intensity for the very next year, that is, 2006, when 2.54 was the value of the index. Moreover, the trade intensity for the three consecutive years, that is for 2007, 2008 and 2009, remained very close to each other. It has been found to be least fluctuating and these are 1.94, 1.84 and 1.74, respectively. During the year 2010, trade intensity between India and UAE was found to be less than one and lowest value among all the years (2001 to 2016). Value for TII for 2010 was calculated as 0.6. Trade between India UAE expanded from 2011 to 2013 and the values of TII were computed as 1.55, 1.93 and 1.01, respectively (See Table 3). Values indicating that intensity of trade between India and UAE had remained considerably high for the years 2011, 2012 and 2013. As 2014 was the year in which Indian exports showed impetus growth so accordingly trade intensity during 2014 accounted as 2.04 from 1.01 in 2013, which showed a significant recovery. In 2015, intensity of trade became better with a value of index equal to 2.22, again in 2016 there is slight fall in the value of TII which was calculated as 1.32. Till 2021, trade intensity remained almost consistent, particularly from 2016 to 2020. In 2021, the intensity became very high. Values of TII between India and UAE throughout the study period except for 2010, were estimated as greater than one which suggested that India and UAE have intense trade with each other as compared to UAE’s trade with the rest of the world. Besides, t in 2013 trade intensity between India and UAE was found to be perfect as the value of index is nearly equal to one, which shows high trade relations between India and UAE. TII values show that there is no upward trend, in fact, the graph shows a negative trend. Trade intensity of India is declining with UAE, simply because UAE has now reached the third rank among major trading partners of India, which ultimately raises the intensity with USA and China, which are top two leading partners of India. Continuous rise in trade intensity between India and UAE from 2001 to 2003 was due to the continuous significant increased demand in UAE for Indian exports of vegetables, fruits, organic chemicals, salt and sulphur, tobacco, rubber, silk, manmade filaments, textile, pearls, jewellery, electronic machineries, Iron and Steel (Ministry of Commerce and Industry). Besides that some impetus in growth in exports of petroleum and fuel products had been observed. It was found that trade intensity between the concerned countries was becoming low but still greater than one. It is due to decline in imports of India from UAE, and the commodities whose imports have declined are organic commodities, lead and nickel. But another strong reason behind some reduction in trade intensity was drastic increase in import and exports of India with the world. Acute reduction in trade intensity between India and the UAE in the year 2010 was due to the decline in Indian imports from the UAE, and the commodities concerned were cereals, pharma products, silk and textile, along with fall in exports of cereals, pharma products, man-made staple and cement (WITS). More justified reason of lower trade intensity during 2010 was the financial crises of 2008 and its long-run impact on global economy. According to a report prepared by the Ministry of Commerce in 2010–2011, impact of 2008 crisis displayed on Indian trade sector in 2009–2010. Due to this, India’s global exports got reduced to 34.2%. During this period, the UAE was India’s largest trading partner, therefore we can say that India–UAE trade must have been affected.
Conclusion
The present study has discussed the strength and potential of bilateral trade flow between India and the UAE. Visible trade between them has increased enormously (see Tables 1 and 2). In 2016–2017 exports of India to the UAE accounted for $31.18 billion, at the same time imports accounted for $21.51 billion, whereas India’s exports for the year 2001–2002 registered $2.50 billion and imports registered $0.915 billion during the same year . The stupendous growth in trade between these two countries which is reflected by the figures, is the result of the need of economic circumstances of both the nations. The study suggests that during the period 2001 to 2021, there was consistent increase in the intensity of trade between India and the UAE. Except for the year 2010, when trade with the UAE was at the lowest. But it was one of the severe after-effects of the 2008 financial crisis when India’s total trade fell down to a large extent. Even after the COVID-19 hit, India’s trade got affected badly but still India–UAE trade remained substantial. We can conclude that during the last few years, in 2021 India attained intense trade with the UAE and was recovering in a speedy way. Recently, India and the UAE have signed a comprehensive trade agreement, on the basis of which we can predict immense trade outcomes in coming years.
Footnotes
Declaration of Conflicting Interests
The authors declared no potential conflicts of interest with respect to the research, authorship and/or publication of this article.
Funding
The authors received no financial support for the research, authorship and/or publication of this article.