
Abstract
The article examines the transformative role of the Government of Odisha’s Mission Shakti programme in advancing rural women’s empowerment through self-help groups (SHGs) across the selected KBK districts: Kalahandi, Balangir, Koraput and Subarnapur. Anchored in the theoretical frameworks of diversity, equity and inclusion (DEI) and literature on social capital, the research adopts a mixed-methods design that integrates quantitative assessments with qualitative case studies. Empowerment is analysed across social, economic, political and psychological dimensions, supported by both field data and participatory insights from SHG members. A Women’s Empowerment Index (WEI) was developed to gauge inter-district variations and the depth of empowerment outcomes. The findings reveal substantial progress in social participation and political representation, while economic and psychological empowerment remain uneven due to constraints such as financial illiteracy, limited market access and entrenched socio-cultural norms. The study concludes that effective empowerment under Mission Shakti necessitates strengthening institutional capacities, promoting inclusive participation and fostering livelihood diversification. Integrating DEI principles within SHG frameworks can further enhance the inclusivity and sustainability of women’s empowerment in rural Odisha.
Keywords
Introduction
Diversity, equity and inclusion (DEI) are recognised as core principles that strengthen group dynamics, productivity and innovation. This article introduces their integration into the analysis of Mission Shakti–led women’s self-help groups (SHGs), advancing scholarship on rural women’s empowerment in India by moving beyond economic outcomes to examine structural dimensions of inclusivity, equity and representation. The framework of DEI offers a powerful lens to understand social transformation and empowerment. Diversity values the presence of differences across gender, caste, ethnicity, class and experience as assets to society. Equity recognises the unequal starting points created by systemic barriers and calls for differentiated opportunities to achieve fairness, while inclusion emphasises creating spaces where every individual feels respected, valued and able to participate meaningfully. Together, these principles form the ethical and structural foundations for understanding women’s empowerment not only as economic advancement but also as a broader process of social justice (Anand, 2022).
Building on this, empowerment is defined as the expansion of people’s ability to make choices and act on them, highlighting access to information, inclusion in decision-making and local organisational capacity as essential to strengthening agency (Narayan, 2005). This formulation positions empowerment as both a personal and an institutional process rooted in freedom, accountability and collective participation.
The evolution of empowerment has been traced from its radical feminist roots grounded in collective resistance and social transformation to its later use as a depoliticised development concept (Batliwala, 2007). The critiques show how global and national agencies have reframed empowerment into a managerial exercise centred on microcredit and SHGs’ original political essence and call for reclaiming empowerment as a collective and political process that restores agency to marginalised groups and challenges structural inequalities rather than merely addressing economic deficits.
The scholarship on social capital further complicates this debate by examining how power and hierarchy shape collective action. Putnam (1993) viewed social capital as networks and norms of trust that foster cooperation and strengthen democratic participation. However, Mohapatra (2001) argues that in stratified societies like India, social capital is neither neutral nor universally accessible. Trust and reciprocity often function within rooted hierarchies, reinforcing exclusion instead of dismantling it. He contends that meaningful empowerment requires linking marginalised communities to accountable and responsive state institutions, as community solidarity alone cannot overcome structural inequality (Mohapatra, 2001).
Building on these structural critiques of power and exclusion, Kabeer (2005) cautions against equating empowerment with access to education, employment or representation. Expanding such opportunities, though seemingly progressive, remains limited if it fails to challenge patriarchal and institutional hierarchies. Education may still replicate gender bias, and economic participation can sustain inequality within markets. This perspective critiques the DEI and empowerment frameworks by warning that inclusion without structural change becomes symbolic. True empowerment requires collective agency, critical awareness and accountable institutions that lead to real shifts in power and equality.
In Odisha, the SHG framework as shown in Figure 1 under the Mission Shakti initiative reflects these broader ideas by promoting women’s empowerment through collective action and institutional support. The programme operates through a multi-tiered structure—Gram Panchayat Level Federations (GPLFs), Block Level Federations (BLFs) and District Level Federations—that ensures decentralised planning and participatory governance within the SHG ecosystem (Mohapatra, 2025). At the village level, the GPLF acts as a platform for experience sharing, financial management and conflict resolution, while the cluster-level forum fosters collaboration, leadership and access to welfare entitlements.
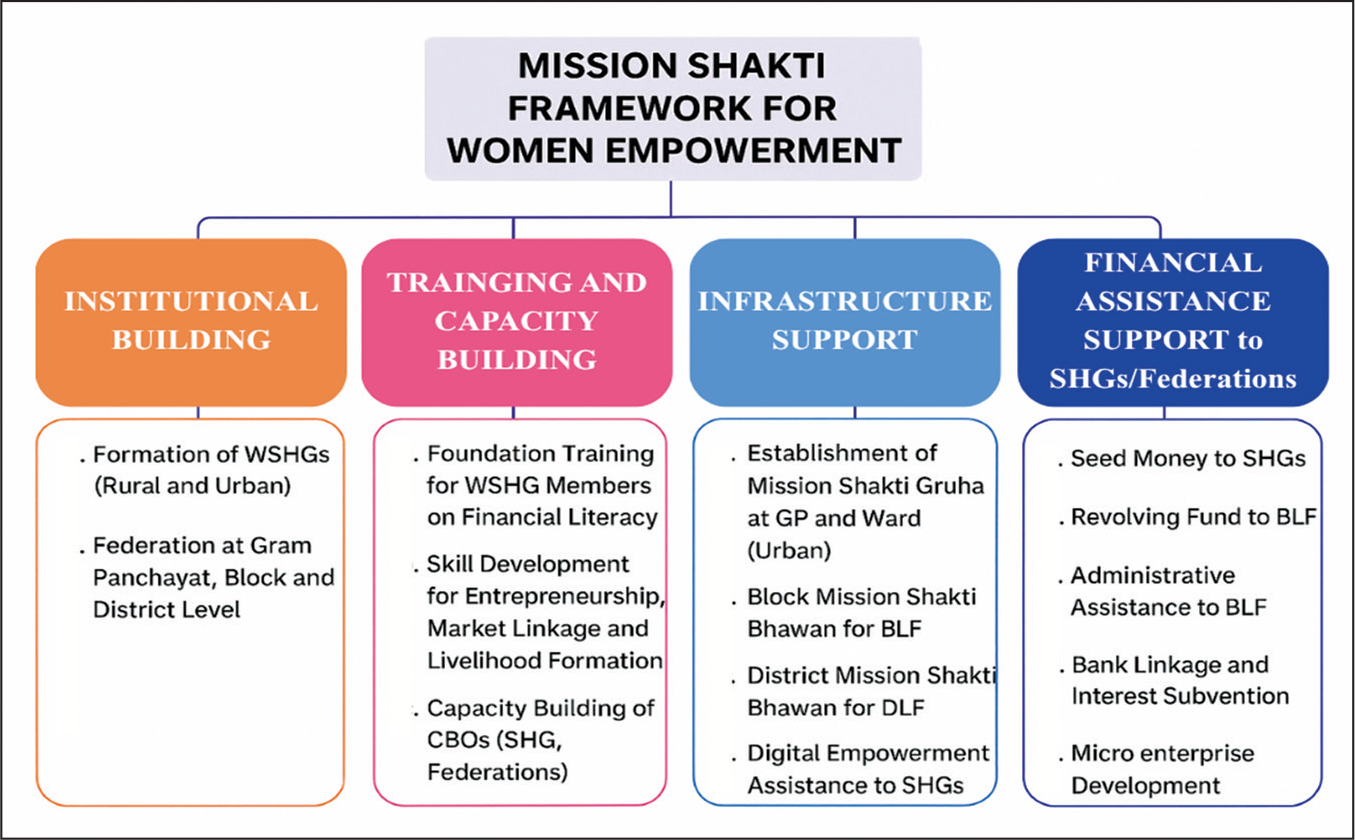
Importantly, the effective functioning of these federated structures is guided by the ‘Dasa Sutras’ (Ten Golden Principles) used by the Mission Shakti, Odisha. These principles emphasise financial discipline, transparency and participatory decision-making. The initiative emerged in response to rural and tribal women’s economic marginalisation, who lacked access to credit, market orientation and decision-making avenues. Within two decades, Mission Shakti has matured substantially, expanding from 41,475 SHGs in 2001 to nearly 6 lakhs by 2024, mobilising about 70 lakh women across Odisha (Department of Mission Shakti, 2024). Its integrated approach, combining microfinance, skill-development and livelihood promotion, aligns with the Sustainable Development Goals on gender equality and poverty reduction (Mohapatra, 2023).
The study on which this article is based assesses both individual and collective dimensions of empowerment attained by Mission Shakti SHGs in Odisha. The key research question underlying this study is: To what extent has participation in Mission Shakti SHGs enhanced women’s empowerment in Odisha across economic, social, political and psychological dimensions?
Literature Review
A detailed empirical assessment of Mission Shakti in Odisha stated that women’s self-help groups (WSHGs) serve as vital instruments of women’s economic empowerment and development, and their potential remains underutilised without consistent institutional support, capacity-building measures and effective governance mechanisms (Mohanty, 2015). This highlights that empowerment cannot be achieved through economic participation alone; it must also address the deeper social and structural barriers that limit women’s agency and autonomy.
Women’s powerlessness is deeply rooted in multiple domains, with systems-level gender discrimination, restricted access to education and skills and agency suppressed by family and community norms being recurring themes. Empowerment is a multifaceted phenomenon, involving not just the possession of resources but crucially agency (the ability to make authentic choices) and achievements (tangible outcomes in autonomy and well-being) (Carr et al., 1996). Expanding access to resources does not, by itself, guarantee shifts in agency or control. Agency is most meaningfully exercised when collective organising and market integration are present, as both elements facilitate the translation of potential opportunities into realised gains.
Women-run cooperatives and social enterprises reveal that structural design is central to empowerment outcomes (Datta & Gailey, 2012). Collective ownership, democratic participation, profit sharing and voluntary association are identified as key institutional features that embed empowerment within business models, as opposed to top-down models characterised by single-leader dependence. For instance, in the case of worker-owned enterprises, Datta and Gailey (2012) report that flexibility, supportive peer networks and transparent profit-sharing enhance women’s sense of ownership and control and foster social solidarity that transcends the limitations of caste, class and religion.
Further, intersectionality emerges as a critical analytical lens. It takes into account caste, class, religion and gender interaction to create unique constellations of disadvantage for rural women in India (Dy et al., 2017). Social entrepreneurship interventions that recognise and work to disrupt these intersectional barriers by fostering collective organisation, building leadership ‘from below’, and enabling flexible participation, report more resilient gains in women’s autonomy, status and bargaining power. Critically, sustainable empowerment is most likely when social enterprises embed continuous training, skill upgradation and market-facing strategies, as opposed to relying solely on initial capital, short-term skills, or a single charismatic leader (Agrawal et al., 2023). The empowerment through SHGs is multidimensional and hinges not only on financial inclusion but also on strong institutional systems, periodic monitoring and sustained capacity-building to ensure long-term and equitable outcomes (Padhi & Sahoo, 2024).
Methodology
The article is based on a mixed-methods study conducted in four districts of Odisha, namely, Kalahandi, Balangir, Koraput and Subarnapur, to gauge the impact of Mission Shakti in empowering rural women through Mission Shakti WSHGs initiatives.
The WEI, which captures the multifaceted character of empowerment across social, economic, political and psychological dimensions, was constructed to assess empowerment at the individual and group levels (Roy et al., 2018). The study used descriptive statistics, such as mean, standard deviation and coefficient of variation (CV), for the quantitative analysis to synthesise empowerment indicators and socio-economic traits throughout the KBK districts. Using variables including income level, social category and educational level, a one-way ANOVA with replication was used to assess the statistical significance of differences across important demographic and socio-economic characteristics. A comprehensive knowledge of the scope and factors influencing women’s empowerment under Mission Shakti in Odisha’s KBK region was made possible by the integration of various analytical tools.
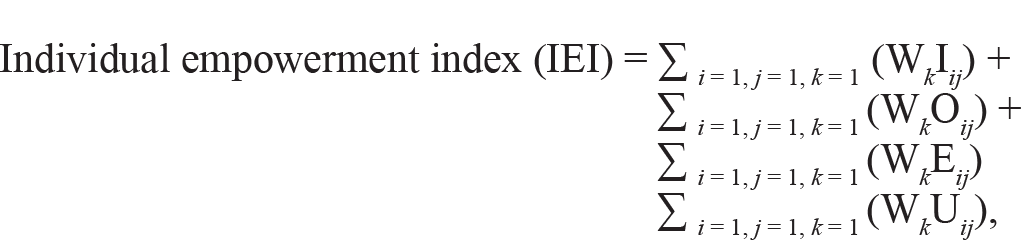
where ∑ i = 1–49, W i = 1 and W1= W2 =… = W49.
Hence, based on the above expression, the IEI is determined individually for each woman who is a part of an SHG. An empowerment score of 0.8 or above is regarded as sufficient empowerment. Women achieving this threshold are considered to have reasonable control over resources, participation in household decision-making and an active voice in family matters.
After arriving at the individual empowerment values, a collective or group empowerment score is computed, drawing on the framework used for constructing the WEAI developed by Alkire et al. (2012). The group empowerment index for SHG women is given as follows:

where We = % of women with adequate empowerment; Wn = % of women without adequate empowerment = (1 − We); and Da = % of domains in which disempowered women have adequate empowerment.
Group Empowerment Index
Once the individual indices were obtained for each district, these were aggregated to determine the overall group empowerment index.
For SHG women, the percentage of adequately empowered women (We) was 21.94 per cent. The number of disempowered women was 153. Given that empowerment was examined across four domains, namely, economic, social, political and psychological, the total possible domain count for these women equals 153 × 4 = 612.
Out of these, disempowered women showed empowerment in 57 domains, leading to:
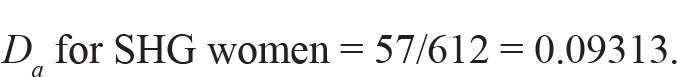
The values for We, Wn and Da from the above computations are: We = 0.2194; Wn = (1 – 0.2194) = 0.7806; Da = 0.09313.
Therefore, WEI for SHG women= We + Wn (Da).

Hence, the WEI for SHG members stands at 0.292.
This index was developed to evaluate the empowerment level of rural and tribal women participating in Mission Shakti–supported SHGs across the four KBK districts. The analysis covers 196 SHG members belonging to ninety six SHGs. Based on observations of their engagement in various livelihood activities encouraged by the Department of Mission Shakti, four key empowerment dimensions, namely economic, social, political and psychological, were identified for assessment.
Certain domains act as direct enhancers of empowerment, while others represent its outcomes. To gauge the effects of these broader domains, several sub-indicators were specified under each, allowing quantification of empowerment at different levels. Equal weights were assigned to each sub-indicator so that their combined value equals one. Each indicator was coded in binary form, where ‘1’ indicates empowerment and ‘0’ indicates its absence. The total empowerment score for an individual, therefore, ranges between 0 and 1. A score exceeding 0.8 denotes adequate empowerment, signifying that the woman enjoys decision- making capacity, access to resources and considerable autonomy.
Results and Discussion
The study focused on four KBK districts of the state of Odisha, namely Kalahandi, Balangir, Koraput and Subarnapur. These regions are known for their tribal populations and socio-economic vulnerabilities (refer Appendix A). A purposive sampling method was employed to select ninety six SHGs comprising 201 household heads and 196 women SHG beneficiaries across eight blocks within these districts. The sampling criteria emphasised representation across caste groups (Scheduled Tribes (STs), Other Backward Classes (OBCs), Scheduled Castes (SCs) and General category), social make-up of SHGs, geographic diversity and the maturity level of SHGs formed under different self-help promoting agencies.
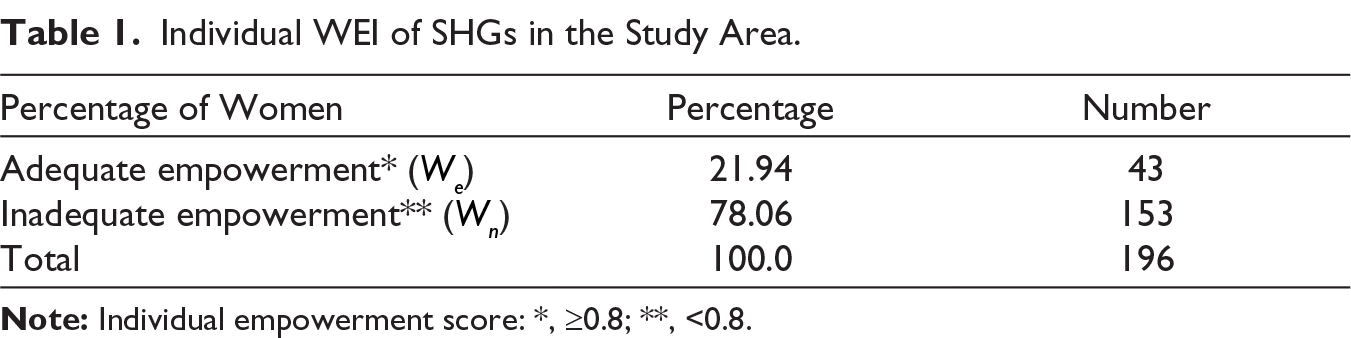
The data in Table 1 indicates that participation in Mission Shakti–supported SHGs has led to a satisfactory level of empowerment among 21.94 per cent of rural and tribal women in the study area. However, a considerable 78.06 per cent of beneficiaries continue to exhibit inadequate levels of empowerment.
Individual WEI of SHGs in the Study Area.
An inquiry into the individual empowerment scores of SHG members across the four KBK districts (Table 2) shows notable variation. Kalahandi district recorded the highest proportion of adequately empowered women at 34 per cent, followed by Subarnapur (25.7%) and Balangir (16.7%). Conversely, Koraput exhibited the lowest empowerment level, with only 13.7 per cent of women achieving adequate empowerment scores. The relatively lower empowerment outcomes in Koraput can be attributed to the higher representation of Scheduled Tribes, particularly members of the Bhattoda and Gond tribes, coupled with the operation of SHGs in remote and geographically isolated regions, where literacy rates and awareness levels remain limited.
District-wise Levels of Empowerment among SHG Participants.
Overall IEI of SHGs in Selected Districts.
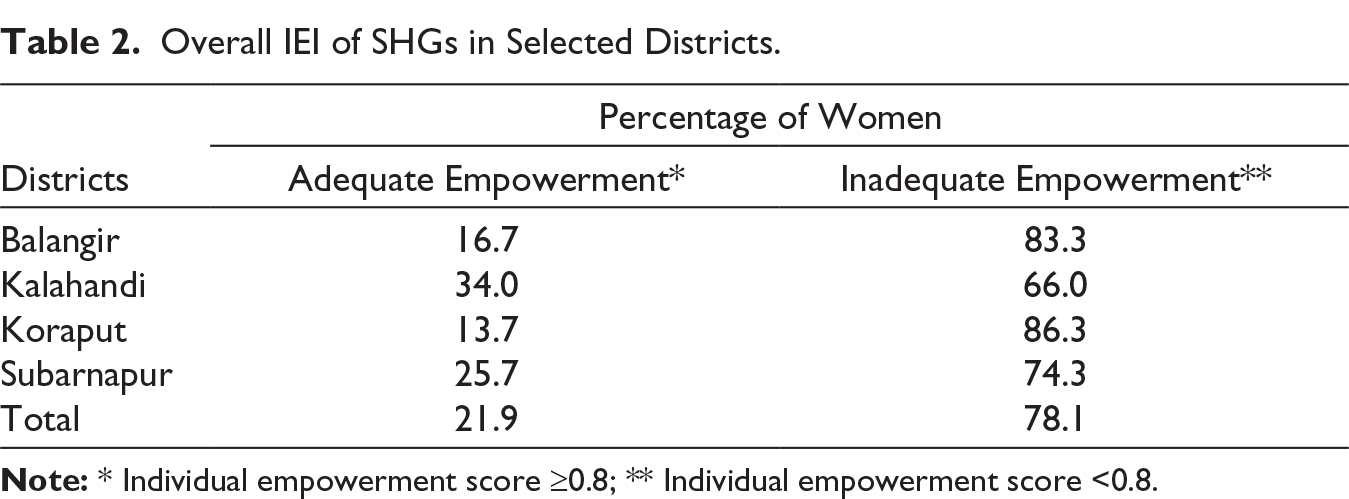
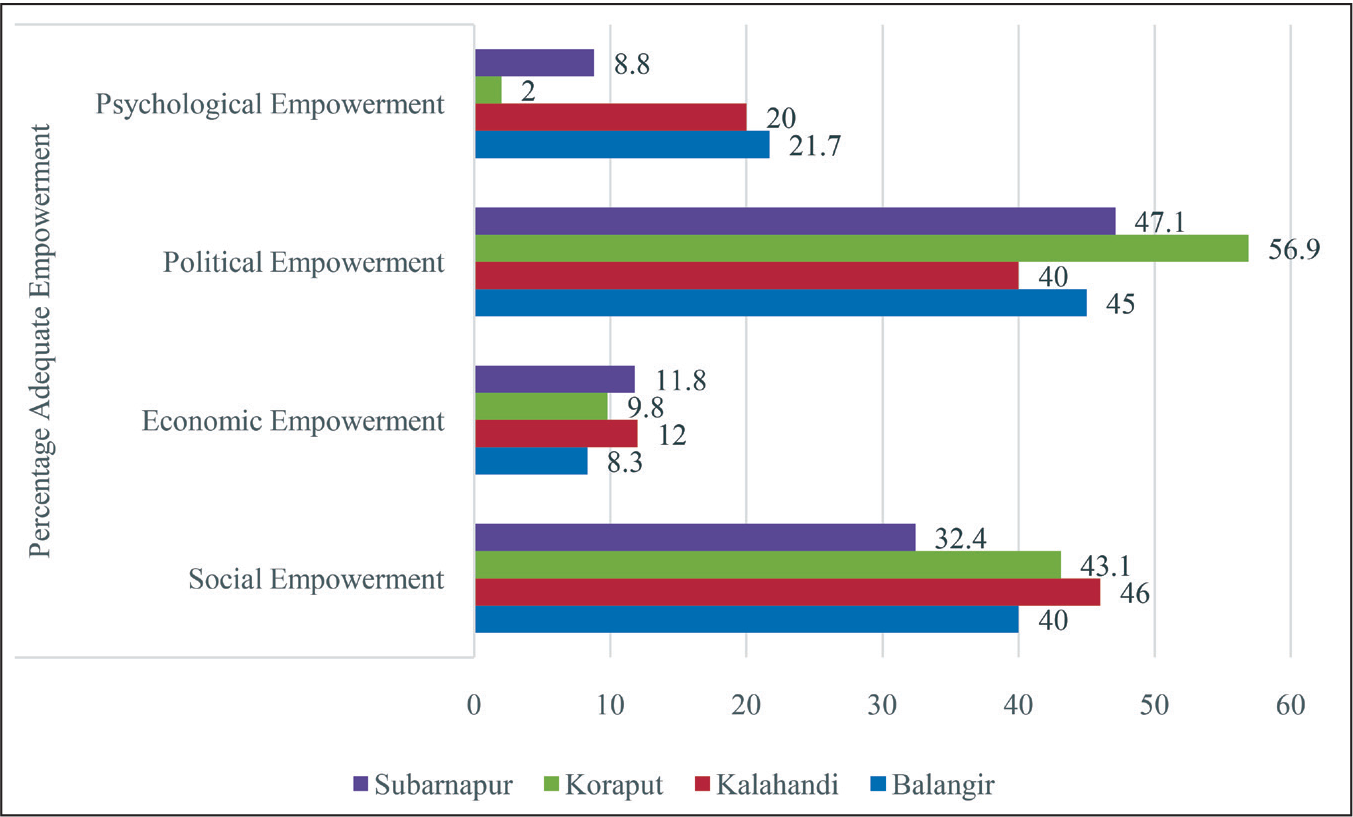
Figure 2 illustrates district-wise variations in empowerment across social, economic, political and psychological dimensions. The data reveal that Mission Shakti SHGs have significantly advanced women’s political representations and social participation, while economic and psychological empowerment remain comparatively weaker. This divergence underscores the need for targeted interventions that strengthen financial inclusion and psychological support, thereby balancing the multidimensional outcomes of empowerment.
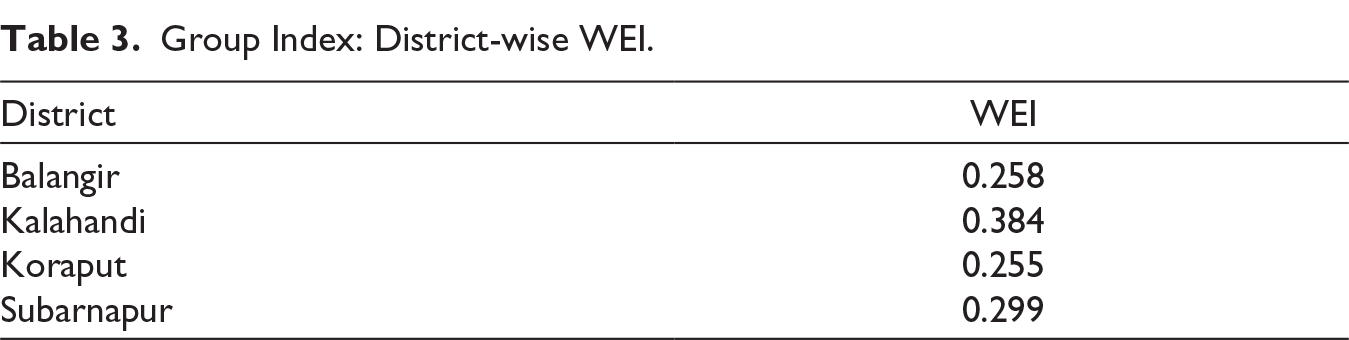
Table 3 shows district-wise WEI scores ranging from 0.255 to 0.384, reflecting modest but uneven levels of empowerment. Koraput (0.255) records the lowest score, linked to weak market access, low literacy and limited SHG cohesion, while Kalahandi (0.384) demonstrates the highest empowerment, supported by strong group engagement and institutional support. Balangir (0.258) and Subarnapur (0.299) fall in the mid-range, underscoring the need to strengthen social networks and collective activities to enhance empowerment outcomes.
Group Index: District-wise WEI.
From Table 4, it is evident that there are significant inter-district differences in the demographic and economic features of women under Mission Shakti. The district’s tribal concentration is shown by the fact that OBC women make up the majority in Kalahandi (15.80%) and Balangir (16.33%), whereas ST women predominate in Koraput (22.95%). Despite its minuscule size, Subarnapur also has a fair percentage of ST women (8.67%). Indicating regional variations in youth involvement, the age distribution highlights that women between 30 and 40 years of age are most active in Kalahandi (12.76%), Balangir (14.29%) and Subarnapur (6.63%), while younger women (18–30 years) participate more in Koraput (10.71%).
Cross-sectional Assessment Indicating Dominant Percentage Patterns Across KBK Districts.
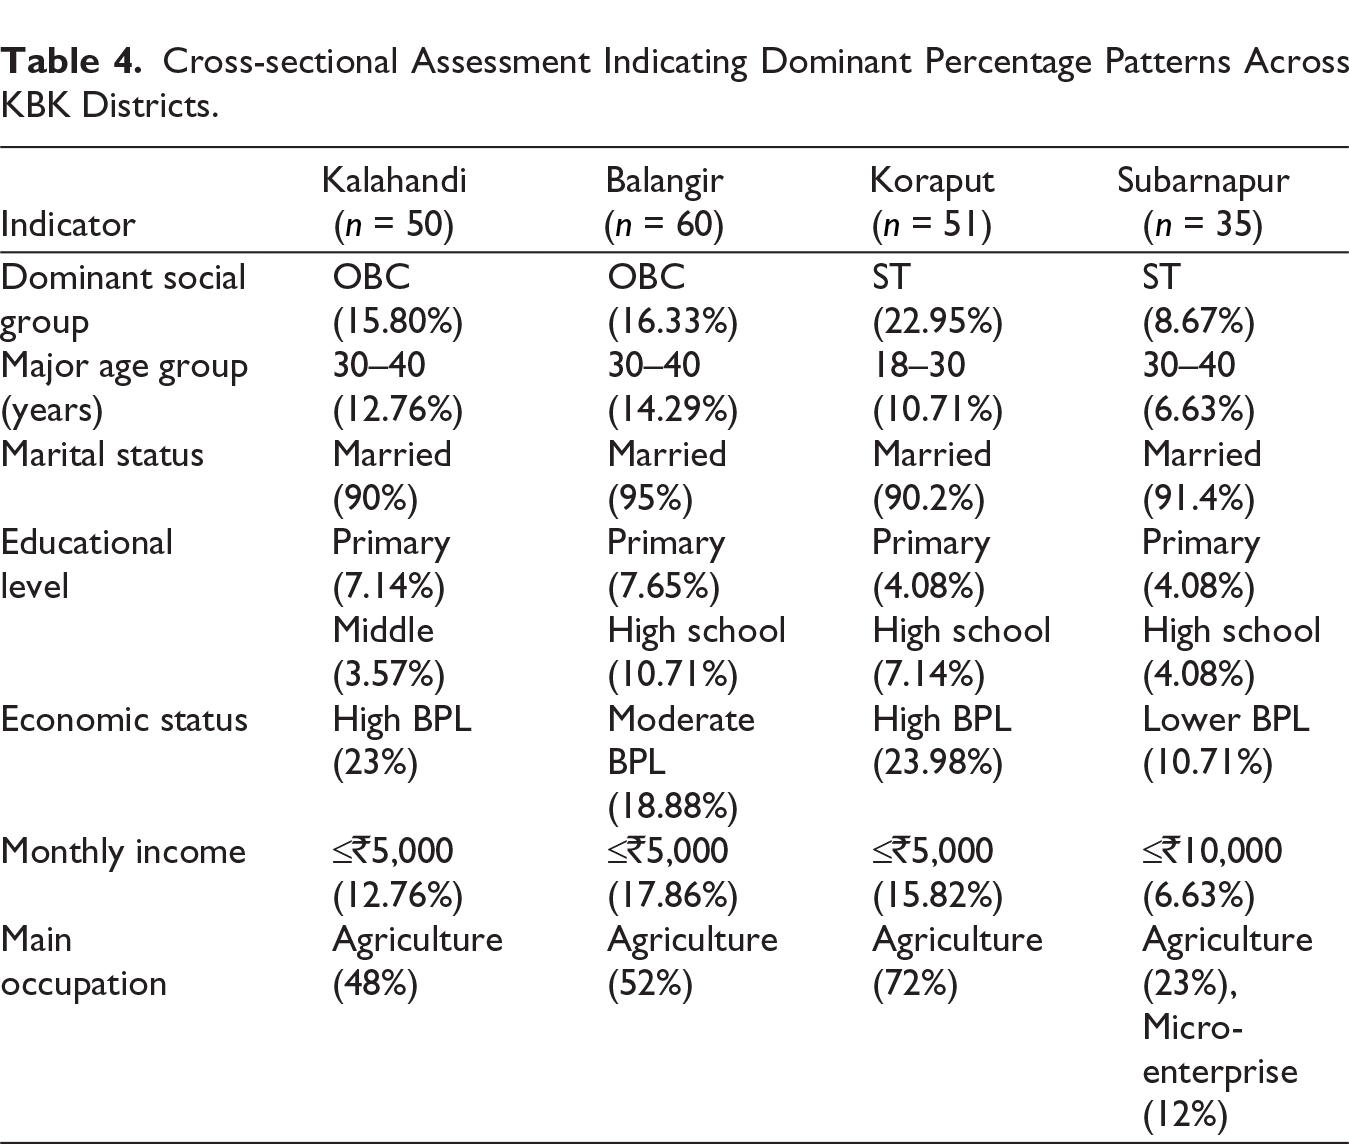
Over 90 per cent of the respondents are married, and the greatest percentage of this is in Balangir (95%). Marital status is essentially consistent throughout the districts, indicating that family-based involvement in Mission Shakti’s SHGs is the norm. Throughout the region, educational attainment is still quite low. While high school-level education peaks in Balangir (10.71%) and is still scarce elsewhere, a notable share of women in Kalahandi (7.14%), Balangir (7.65%), Koraput (4.08%) and Subarnapur (4.08%) have only completed primary school.
Inequalities in financial well-being are further exposed by economic indices. Relative economic progress is evident in Subarnapur, where the percentage of BPL households is lowest at 10.71 per cent, moderate in Balangir (18.88%) and largest in Koraput (23.98%) and Kalahandi (22.96%). The majority earn ≤₹5,000 a month, with Balangir having the highest percentage (17.86%) and Subarnapur having the lowest (6.63%), while some women there make up to ₹10,000. Also, agriculture is the most common occupation in all districts (48per cent in Kalahandi, 52 per cent in Balangir and 72per cent in Koraput); however, Subarnapur has a more varied pattern, with 12 per cent in micro-enterprises and 23 per cent in agriculture.
Significant socio-economic and educational differences across population factors in the KBK region are highlighted by the descriptive analysis (Table 5). SCs have low representation and comparatively high inequality among the social groupings, with a mean of 2.8 and a CV of 105.84. While the OBC group (mean = 9.57; CV = 127.09) shows relatively constant involvement and moderate economic engagement, the ST group (mean = 11.22; CV = 141.61) shows greater fluctuation and moderate-income levels.
Distribution of Socio-economic and Demographic Characteristics Across KBK Districts Based on Mean, SD and CV (%).
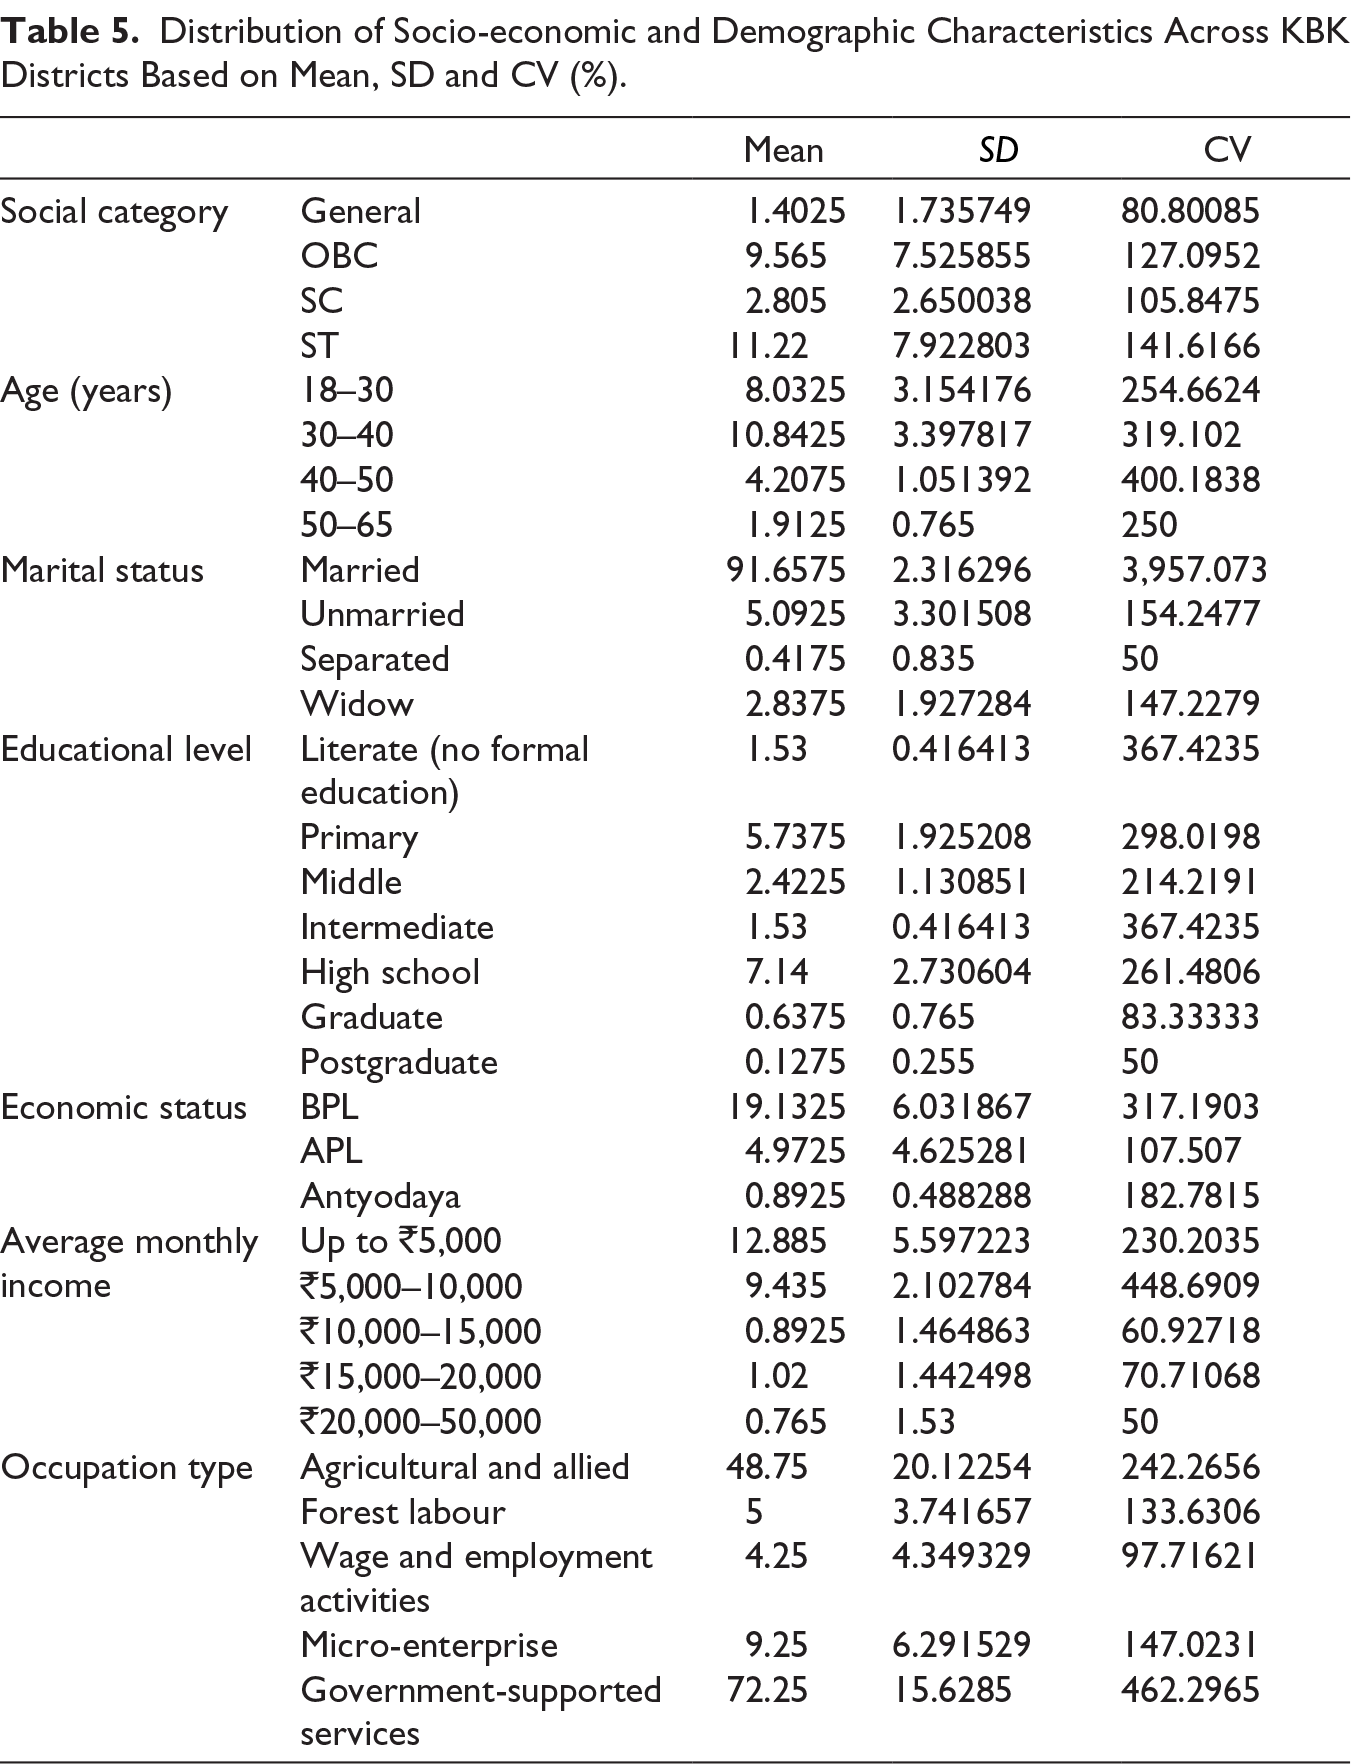
The 30–40 age group (mean = 10.84; CV = 319.10) is the most economically active segment, representing peak production and workforce involvement according to age-wise distribution. However, after 50 years of age, involvement dramatically decreases (mean = 1.91), suggesting fewer prospects for income and greater reliance on the economy in later life.
Married respondents predominate in terms of marital status (mean = 91.66; CV = 3,957.07), indicating social security and stable households. The widowed (CV = 147.22) and separated (CV = 50) groups, on the other hand, show greater fluctuation, suggesting social and economic fragility. Its crucial influence on economic stability is highlighted by the distribution of education levels. While the graduate (CV = 83.33) and postgraduate (CV = 50) categories show lower variability despite their smaller proportion, primary (mean = 5.74; CV = 298.02) and high school (mean = 7.14; CV = 261.48) levels exhibit moderate consistency. This suggests that higher education lessens income fluctuation but is still limited in rural accessibility.
Economically speaking, the majority falls under the BPL category (mean = 19.13; CV = 317.19), indicating a sizeable population base with low incomes. Antyodaya category (CV = 182.78) and above-poverty-line (CV = 107.51) families, similarly, exhibit more inequality, suggesting unequal economic gains within these groupings. Higher income groups (over ₹15,000) are uncommon and show great variability (CV > 140), indicating deep economic stratification. The income distribution also shows concentration in the ₹5,000 and ₹5,000–₹10,000 ranges (mean = 12.89 and 9.44; CV = 230.20 and 448.69, respectively).
In the occupational study, the main sources of income are agriculture and related industries (mean = 48.75; CV = 242.27) and government-supported services (mean = 72.25; CV = 462.30). Even within these industries, however, significant income variability is indicated by high CV values. The precarious aspect of informal rural employment is highlighted by employment under wage labour (CV = 97.72) and forest-based work (CV = 133.63), which exhibit volatility and vulnerability.
The combined impact of socio-economic category and education level on income across the KBK districts was investigated using a two-factor ANOVA without replication (Table 6). The findings indicate that income variation is significantly influenced by both factors. With a p value of 8.0 × 10⁻12 (8.01E−14) for the social category, the F-value (320.75) was higher than the critical value (F crit = 3.28), suggesting significant income disparities across the General, OBC, SC and ST categories. With a p value of 1.28 × 10⁻12 (1.28E−17), the F-value (793.25) for the education level was significantly higher than the F threshold (2.90), indicating a strong positive correlation between income and education.
ANOVA Results for the Combined Influence of Education and Social Category on Income in the KBK Region.
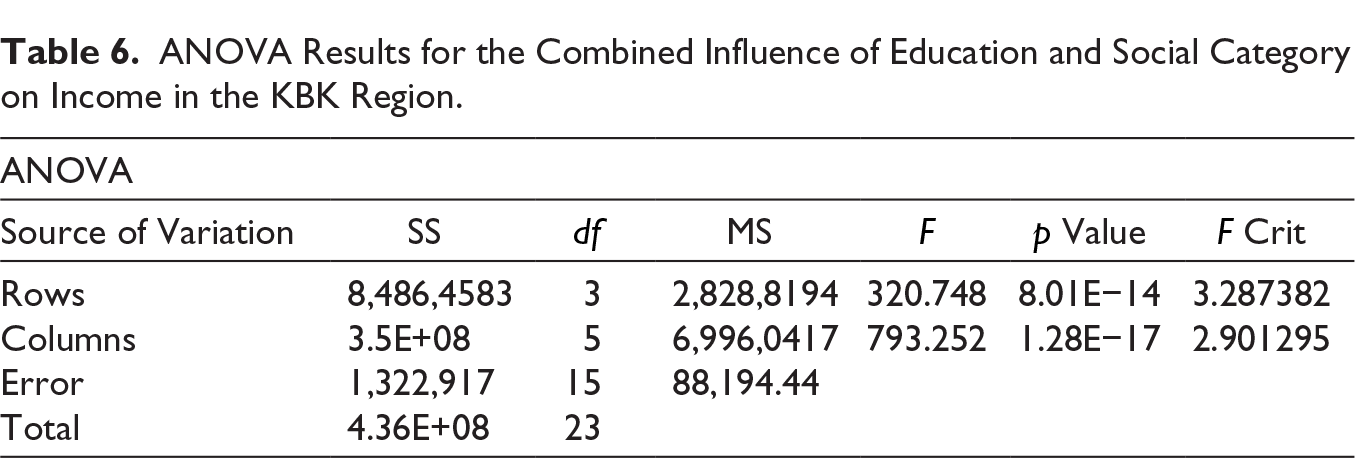
Higher education significantly boosts earning capacity, as seen by the steady increase in average salary from ₹9,250 among literate people to ₹20,250 among postgraduates. However, caste-based inequalities still exist because the General and OBC groups routinely make more money than the SC and ST groups. Education benefits vary by district: Balangir and Subarnapur perform better with more educated and economically advantaged individuals, whereas Kalahandi and Koraput trail due to lower literacy and a higher percentage of SC/ST populations.
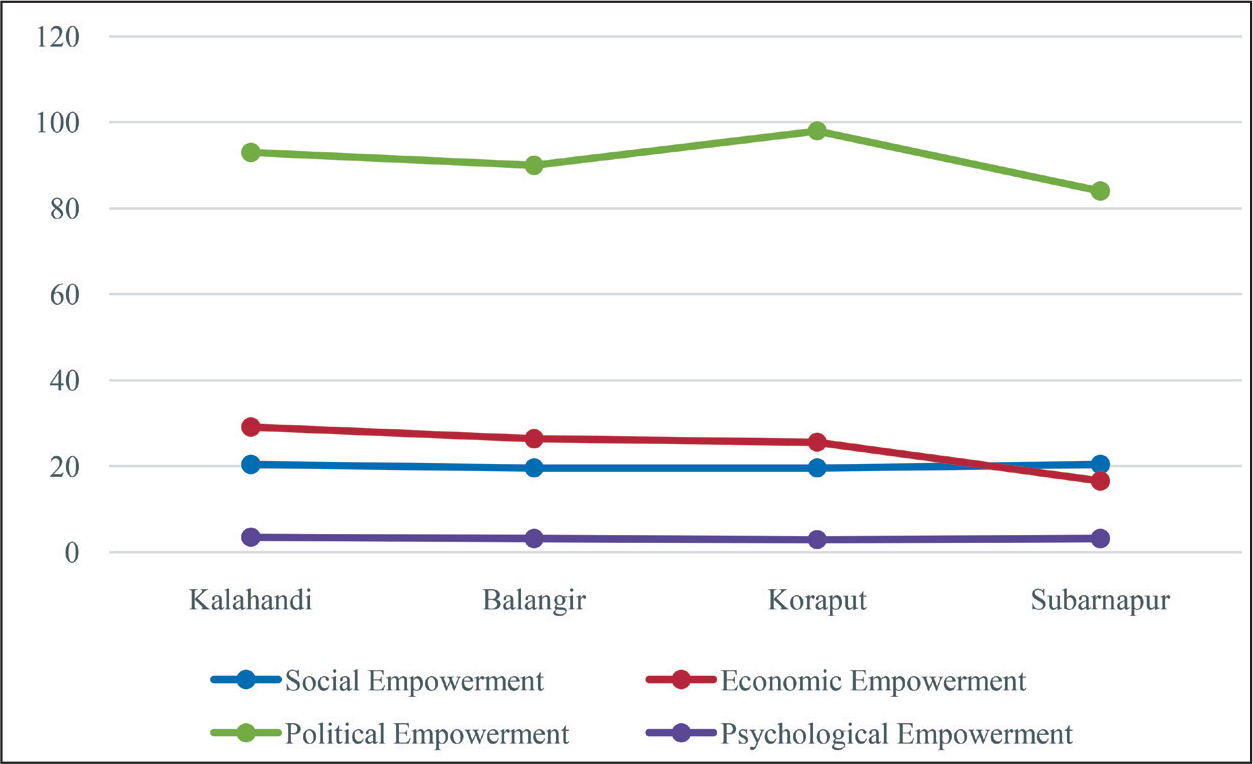
Figure 3 examines women’s empowerment under Mission Shakti in the KBK districts of Kalahandi, Balangir, Koraput and Subarnapur and reveals both advancements and inequalities. Strong financial inclusion and leadership are demonstrated by Kalahandi’s leadership in economic empowerment (29.1), psychological empowerment (3.50) and political empowerment (93).
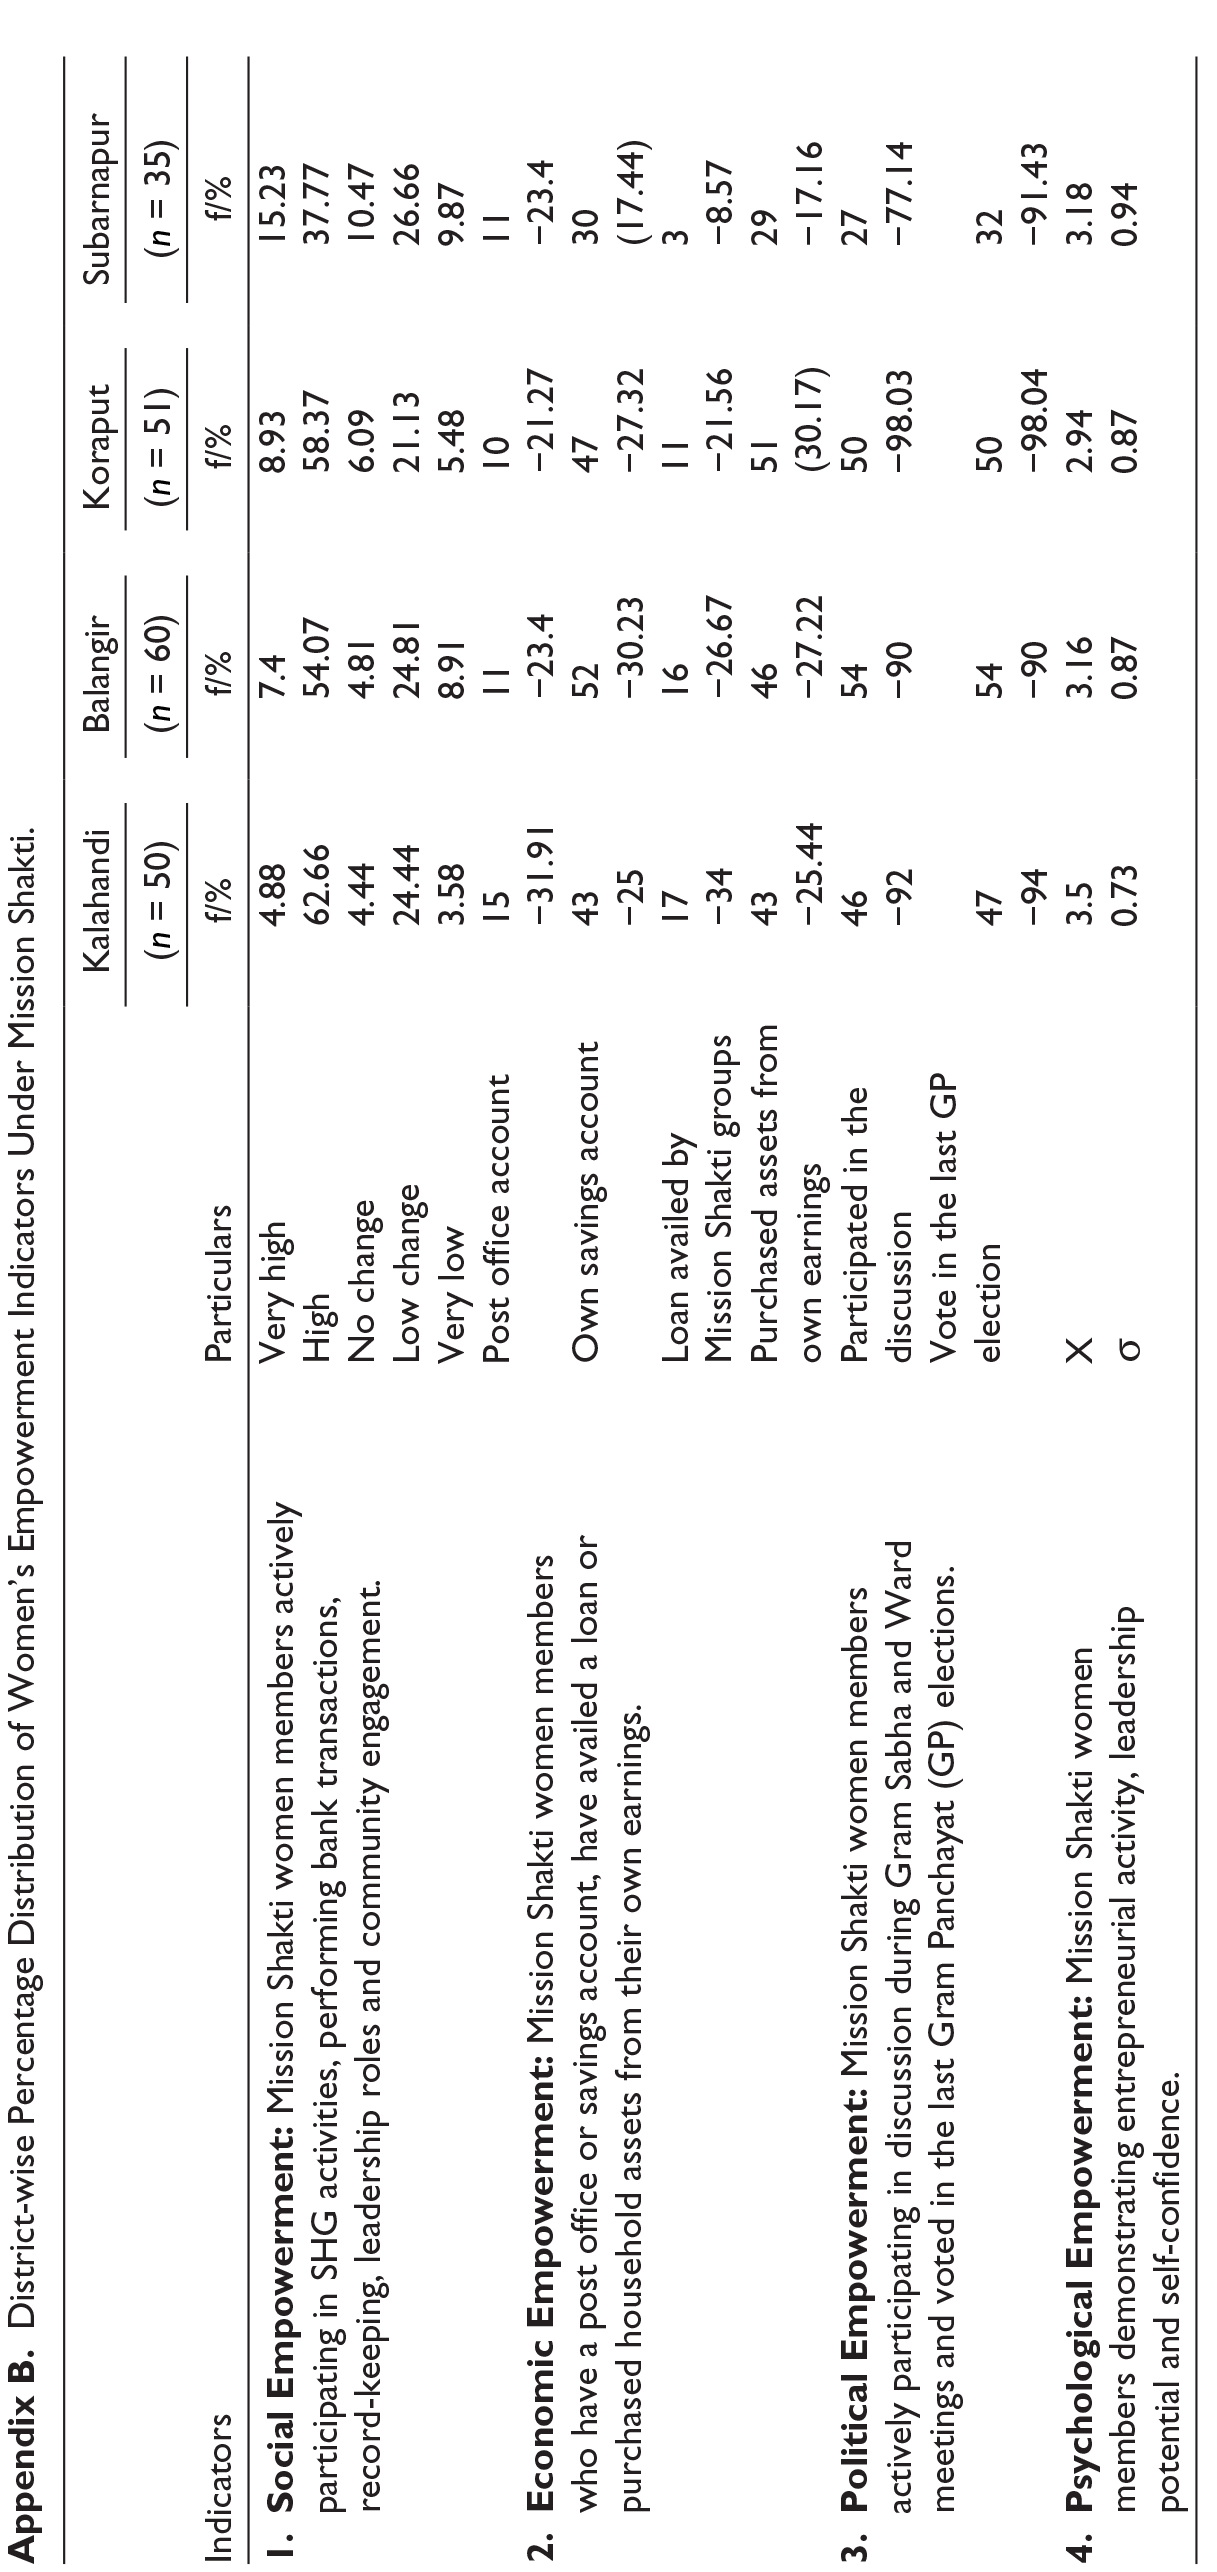
Overall, Balangir’s performance was average, whereas Koraput records the highest political involvement (98) but middling results in other areas. Subarnapur is at par with Kalahandi concerning social empowerment (20.4); however, it falls short with regard to economic (16.6) and political (84) metrics. Figure 3 shows that while Mission Shakti has greatly increased political inclusion and social participation, there remains unequal economic and psychological empowerment due to poor credit availability and financial knowledge. The level of political empowerment seems to be on the higher side because of women’s participation in local elections increasing after joining SHGs and exhibiting confidence, autonomy and a willingness to take leadership roles (refer Appendix B). Given the diverse nature of the groups and the differential level of skills, the level of confidence in running micro-enterprises and the ability to identify a new business opportunity seems to be lower. Entrepreneurial activities in a rural and patriarchal society in Odisha state are often community-driven and male-centric in nature.
Comparative Assessment of Mission Shakti’s Impact on Womens’ Empowerment Across KBK Districts.
Empowering Rural Women Through Mission Shakti: Some Case Studies
Koraput: Mission Shakti Cafe by Adarsha Women SHG
The establishment of Mission Shakti Cafes is ushering in a wave of new opportunities for SHGs. It is a major enterprise launched in districts with the target of providing affordable, good-quality and nutritious food in rural areas. The Mission Shakti Cafe was formally inaugurated by the MLA, Peetam Padhi. The cafe is managed by the Adarsha Mahila Mandal, WSHG at Semiliguda block falling under Koraput district, with support from the USHA BLF, and the District and Block Administrations, and operates in the periphery of the Semiliguda Block Office. It was formed on 27 August 2018 with ten members—comprising two from ST, five from SC and three from OBC. The group was facilitated by the local Anganwadi Worker (AWW). The members primarily engage in small-scale business activities. Over a span of thirty nine months, the group accumulated a total savings of ₹172,633 and accessed loans amounting to ₹1,150,000 from GPLF and BLF combined. Initially, they prepared around fifty lunch and breakfast plates daily, and occasionally, some members of the SHG have been involved in preparing cooked meals for block-level training programmes and Mid-Day Meal initiatives at the Block Colony Upper Primary School. The idea is to promote women-led cafes like these on all the blocks across the state. The quality of food and the hospitality of the cafe staff all contribute towards a long-lasting impression on those who visit. The Mission Shakti Cafe case shows how SHGs can build livelihoods through savings, loans and enterprise, while also fostering social cohesion across caste and community lines, gaining political visibility through engagement with local administration and strengthening psychological confidence by managing a public enterprise with dignity.
Balangir: Jai Shri Ram SHG Involved in Weaving Sambalpuri Sarees
Established in 2016 in Kandhakelgaon, Saintala block, the Jai Shriram SHG has ten members from the weaving (meher) community. Their primary occupation is looming Sambalpuri sarees, a family activity, for which they source bandh patterns from Bargad and Barapali. Each member saves ₹100 monthly, contributing to a total of ₹5,900, while the SHG account holds ₹33,939. A related thirty five-member producer group, Maa Karamsani, received ORMAS training on bandh design in 2020. In 2017, the group received GPLF loans of ₹50,000 and ₹100,000, respectively. During the Covid-19 epidemic, saree prices dropped from ₹2,000 to ₹1,500. The SHG received ₹20,000 from the Special COVID Fund and ₹15,000 as revolving money, which has been deposited in the SHG account for future investment plans. This initiative moves members away from the previous system, where local moneylenders provided materials for daily wage payments. In addition to economic gains, the revival of traditional weaving has reinforced community identity and cultural pride, while boosting members’ confidence and self-esteem through recognition of their art and craft.
Kalahandi: Mo Upakari Bagicha (Nutrition Garden) by Bhawani WSHGs
Launched in 2018 through Odisha Livelihoods Mission and Azim Premji Philanthropic Initiatives, the Mo Upakari Bagicha nutrition project promotes nutrition gardens to improve dietary diversity and reduce undernutrition among vulnerable groups. In Kalahandi, Bhawani WSHG adopted organic kitchen gardens with technical support, enabling Gita Rana of Maa Bhawani SHG to overcome economic hardship and provide fresh food for her husband and young son, who previously relied on market vegetables that often spoiled without refrigeration.
Her situation changed following a visit from OLM employees and BLRP staff. They encouraged Gita and her SHG to start a ‘Moo Upakari Bagicha’ (kitchen garden) to grow several varieties of indigenous vegetables using organic methods. They provided technical advice on land preparation, bio-compost and organic insecticides. She adopted the practice and received free vegetable saplings and ten fruit plants from the OLM. By developing this organic garden, she successfully provided fresh food for her family and saved the money previously spent at the local market. She is grateful to the OLM and BLRP staff for their support. For members like Gita Rana, the initiative not only eased economic hardship but also fostered social empowerment through collective learning and community mobilisation, political empowerment via engagement with local institutions and psychological empowerment by building confidence and dignity in providing nutritious food for their families.
Subarnapur: Engagement of Women SHGs in Paddy Procurement—The Case of Jay Maa Tulsi SHG
The Department of Mission Shakti’s 2019 initiative to engage Women SHGs in paddy procurement ensures farmers receive minimum support price and counters exploitation. The initiative’s backbone is the Paddy Procurement Automation System (P-PAS). WSHGs are trained to use this ICT-enabled platform, which authenticates genuine farmers via Aadhar-linked IDs and biometrics, issues online tokens for a clean queue, records paddy quality and processes direct digital payments. This system is crucial for weeding out middlemen.
The Jay Maa Tulsi SHG exemplifies the financial success of this model. The group’s financial journey began with strong internal savings, or ‘seed money’, which grew from ₹ 50 to ₹200 per month in 2006, accumulating a total savings of ₹6 lakhs by 2021. This financial discipline enabled them to secure a significant ₹5 lakh loan from the State Bank of India in 2019. The SHG strategically used this loan to purchase a car, facilitating their members’ daily commute to the centre. This SHG’s business insight is evident in its earnings. In 2019–2020, they achieved a remarkable annual turnover of ₹34 lakhs, derived from ₹11 lakhs in rabi and ₹23 lakhs in kharif crops. By receiving a government commission of ₹31.25 per quintal for procuring paddy, the group generates a substantial net profit. This successful operation provides each of its ten members with an income of ₹20,000 per season, demonstrating a powerful synergy between government policy and grassroots financial empowerment. Beyond net profit, paddy procurement has fostered social solidarity among SHG women, enhanced their political participation through direct engagement with governance processes and built psychological confidence by enabling them to manage large-scale operations with autonomy and dignity.
Conclusion
The evidence from Mission Shakti SHGs initiatives reflects differentiated outcomes of women’s empowerment in Odisha, with substantive gains in social participation and political representation but persistent constraints in economic and psychological domains. This unevenness resonates with Sen’s (1999) capability approach, which underscores that empowerment entails substantive freedoms beyond resource access and with feminist institutionalism, which highlights the persistence of informal norms that reproduce gendered hierarchies despite formal inclusion (Mackay 2011). Addressing these constraints requires integrative strategies that combine financial capacity-building and market access with normative change and psychological support, thereby consolidating collective agency into durable transformations in women’s autonomy and resilience.
Policy Recommendations
Based on the study, three priority areas emerge for strengthening Mission Shakti’s impact at Gram Panchayat, Block and District federations, aligned with the principles of diversity, equity and inclusion:
Collectively, these measures can translate the Mission Shakti’s achievements into a scalable and replicable framework of inclusive development, advancing sustainable transformations in women’s autonomy and resilience.
Footnotes
Declaration of Conflicting Interests
The author declared no potential conflicts of interest with respect to the research, authorship and/or publication of this article.
Funding
The author disclosed receipt of the following financial support for the research, authorship, and/or publication of this article: This article is an outcome of a research project entitled “Evaluation of the Impact of Mission Shakti in Women Empowerment in KBKI Districts in Odisha”. This project was sponsored by the National Commission for Women (NCW), New Delhi.
Appendix
District-wise Percentage Distribution of Women’s Empowerment Indicators Under Mission Shakti.
| Indicators | Particulars | Kalahandi | Balangir | Koraput | Subarnapur |
| (n = 50) | (n = 60) | (n = 51) | (n = 35) | ||
| f/% | f/% | f/% | f/% | ||
| Very high | 4.88 | 7.4 | 8.93 | 15.23 | |
| High | 62.66 | 54.07 | 58.37 | 37.77 | |
| No change | 4.44 | 4.81 | 6.09 | 10.47 | |
| Low change | 24.44 | 24.81 | 21.13 | 26.66 | |
| Very low | 3.58 | 8.91 | 5.48 | 9.87 | |
| Post office account | 15 | 11 | 10 | 11 | |
| −31.91 | −23.4 | −21.27 | −23.4 | ||
| Own savings account | 43 | 52 | 47 | 30 | |
| −25 | −30.23 | −27.32 | (17.44) | ||
| Loan availed by Mission Shakti groups | 17 | 16 | 11 | 3 | |
| −34 | −26.67 | −21.56 | −8.57 | ||
| Purchased assets from own earnings | 43 | 46 | 51 (30.17) | 29 | |
| −25.44 | −27.22 | −17.16 | |||
| Participated in the discussion | 46 | 54 | 50 | 27 | |
| −92 | −90 | −98.03 | −77.14 | ||
| Vote in the last GP election | |||||
| 47 | 54 | 50 | 32 | ||
| −94 | −90 | −98.04 | −91.43 | ||
| X | 3.5 | 3.16 | 2.94 | 3.18 | |
| σ | 0.73 | 0.87 | 0.87 | 0.94 |