
Abstract
In India, over time, the share of own revenue (tax and non-tax) in the total revenue of urban local bodies (ULBs) has declined while that of governm ent transfers has increased, indicating growing fiscal dependency. It depicts the high dependency of local governments on the upper tiers of government to meet their expenditure needs, which has made them more vulnerable and less efficient, and has significantly eroded their autonomy. Internationally, amongst the own sources of revenue, property tax is a significant contributor to the ULBs’ fiscal landscape. However, India is at a low level with only 0.2 per cent of property tax contribution to GDP, which is much less than that of other countries. Therefore, this article aims to understand the administration of property tax through an assessment framework to arrive at the leakages and capitalise on low-hanging fruit in the municipal treasury and suggest suitable recommendations.
Introduction
Property tax, also known as house tax or housing tax, is a form of direct taxation levied on the ownership or possession of real estate properties within the city jurisdiction. It is a crucial revenue source for local governments, enabling them to fund their municipal operations. It is a form of direct taxation levied by local governments (K, 2016). Property tax not only provides a sustainable and predictable source of revenue but also creates an income avenue to reduce the city’s reliance on other forms of assistance from upper tiers of government. It is often based on the assessed value of properties, ensuring that those who own more valuable properties pay higher taxes. This progressive and buoyant nature of property tax promotes fairness in the tax system by taxing individuals and businesses in proportion to their property wealth. However, the buoyancy is limited due to the interference of the legislative agents in many instances (Mishra, 2020; Bandyopadhyay, 2013).
In various developed economies, the governments have an established financial system that enables more fiscal decentralisation. Although this idea is relatively recent in developing nations, the fiscal transfers from the centre to the state to local governments have not been equivalent (Norregaard, 2013). In most countries, the power to tax is held by higher levels of government, with only a few exceptions, such as the Nordic countries, where local governments have significant access to large and buoyant tax sources like income tax. The sources of revenue for local governments vary across countries but generally include taxes, user fees, charges, intergovernmental transfers, investment income, property sales, licences and permits. Property tax is regarded as one of the most important tools for raising revenue at the local government level around the world (Tax, 2004; William McCluskey, 2022).
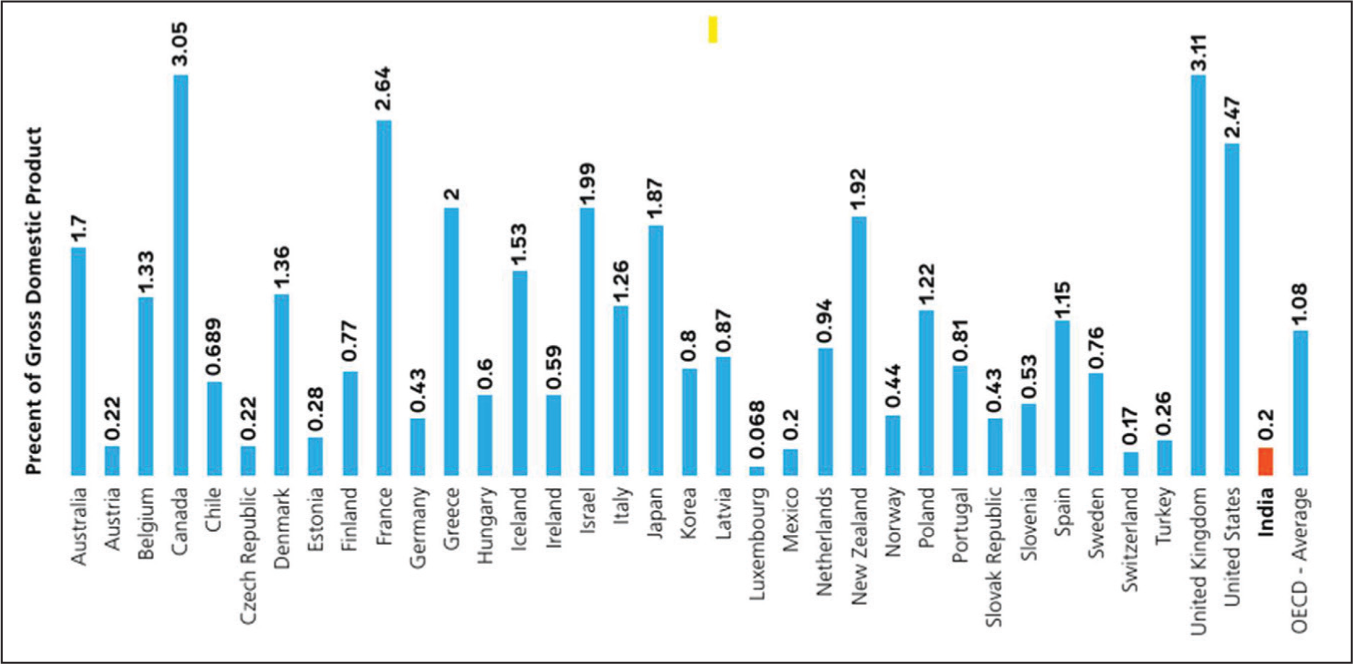
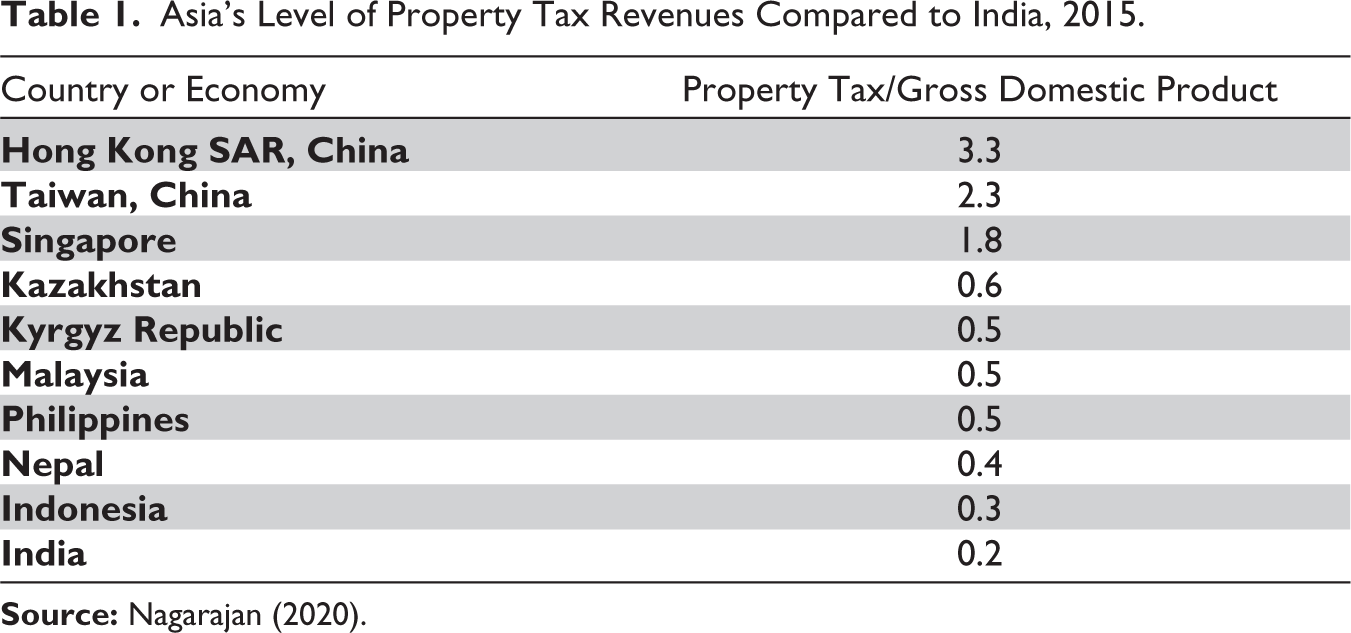
Property tax collections, as in Figure 1, account for about 3 per cent of the GDP in several Organisation for Economic Cooperation and Development (OECD) nations, including Canada, the United Kingdom and the United States. It assumes a crucial source of local government revenue. Property tax is concentrated on a few high-income economies in Asia, as shown in Table 1. India is at a low level with only 0.2 per cent of the GDP as property tax. It opens a wide spectrum of possibilities to increase the property tax collection, which is one of the main sources of ‘own income’ for local governments (Prakash, 2013).
Asia’s Level of Property Tax Revenues Compared to India, 2015.
The Indian tax system operates by collecting taxes from its citizens to generate revenue for public infrastructure projects and to enhance the country’s economic position (Janaagaraha Centre for Citizenship and Democracy, 2021). Local bodies possess the authority to levy taxes on properties (such as buildings) and taxes/user charges for utilities like water supply and drainage (Carlson, 2004; K, 2016), but there are seldom revisions to the rates, and such revisions require state approval. However, the power of levying taxes and determining tax rates for Indian cities is controlled mostly by the respective state governments. Hence, it can be said that the federal nature of Indian democracy is limited only to the state level and has not percolated further down to the city level. The kind of financial jurisprudence that the states enjoy has not been developed to the city level (Bandyopadhyay, 2012).
The local governments, being closer to the citizens, have a higher responsibility for municipal service delivery and ensure a better quality of life for their residents. However, with such enormous responsibilities, authorities are limited, leading to weaker accountability along with deficient systems and governance. Another pressing issue is the lack of reliable and comprehensive municipal-level data. Despite the recommendations of the previous two Central Finance Commissions to improve the availability of municipal-level data, and the existence of urban development departments in each state, fundamental information on municipal finances remains unavailable. Additionally, the coverage and quality of services continue to be deficient in most states (Tyagi, 2012).
In India, fiscal decentralisation led to the constitution of the State Finance Commission under the 73rd and 74th Constitutional Amendment Acts. Article 280 was amended to add two sub-clauses dealing with the measures needed to augment the consolidated fund of a state to supplement the resources of Panchayats and Municipalities based on the recommendations of respective State Finance Commissions. Due to this, the Finance Commissions could also make recommendations about the share of local self-government in central resources (PRIA, 2018; Rao, 2013).
Even after strong recommendations from the fifteenth Finance Commission for augmenting their own sources of revenue (OSR), they are still quite low in Indian urban local bodies. A major share of OSR comes from property tax. However, scattered evidence suggests that property tax collection is abysmally low in Indian cities (Ahluwalia, 2019). Since property tax remains a major source of income for the cities, it is pertinent to have a deeper understanding of the administration of the same in Indian cities. Thus, this research article attempts to understand the status quo, current practices, evaluate the leakages and identify strategic areas of improvement for better property tax management. The present study attempts to understand the current scenario of property tax in the smart cities of India and the factors influencing the assessment of the value of properties in India and provides recommendations for property tax administration.
Methodology
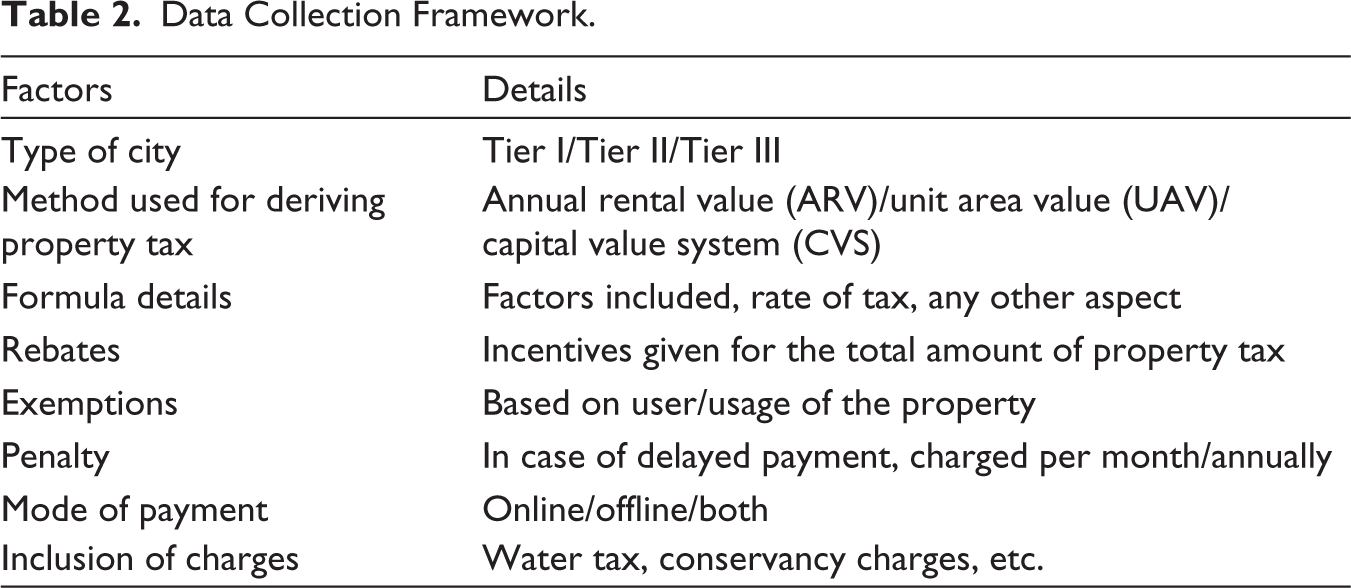
For the study, out of 100 smart cities under Smart City Mission, eighty-six cities were studied, as data was available for these cities. The smart cities were chosen under the pretext that they would already have better capabilities and performance than other cities, since they were all selected under the mission through a competitive procedure. Being a smart city, they would have digitised information available on the municipal website as a secondary source of data. A rigorous framework, as in Table 2, was designed to understand property tax administration.
Data Collection Framework.
Data collection was based on secondary data from published sources of 100 smart cities across India. Data had been sourced from city websites and state Acts of relevant states to understand the property tax management system. Some interviews were also conducted with city officials to get better clarity on the information available on the website. The details are in Annexure 1 (list of all the smart cities across India). Based on the data collected through the above framework, certain findings were generated.
Findings and Discussions
Formula-based Findings
Property tax collection in India mainly uses three different methods. Each state has adopted one of the available three methods. The collection is greatly influenced by the formula used to calculate the tax liability for individual properties. The formula takes into account various factors to determine the tax amount owed by property owners such as the Annual Rental Value of property (depending on area of the property, construction type, age, location, amenities and prevailing market rates), rate of tax (depending on usage occupancy and location of property), exemptions and rebates, assessment and collection mechanisms (refer Annexure 1 for details).
If the formula does not consider all the factors, then it may lead to incorrect valuation of property, and the owner might end up paying less/more than the actual value. Discrepancy in the assessment of property tax may lead to issues in operationalising billing and collection mechanisms and may create a point of leakage of revenue. In India, the municipal corporations primarily use one out of the three methods of calculating property tax, as listed in Table 3.
Methods Used in India for Calculating Property Tax.
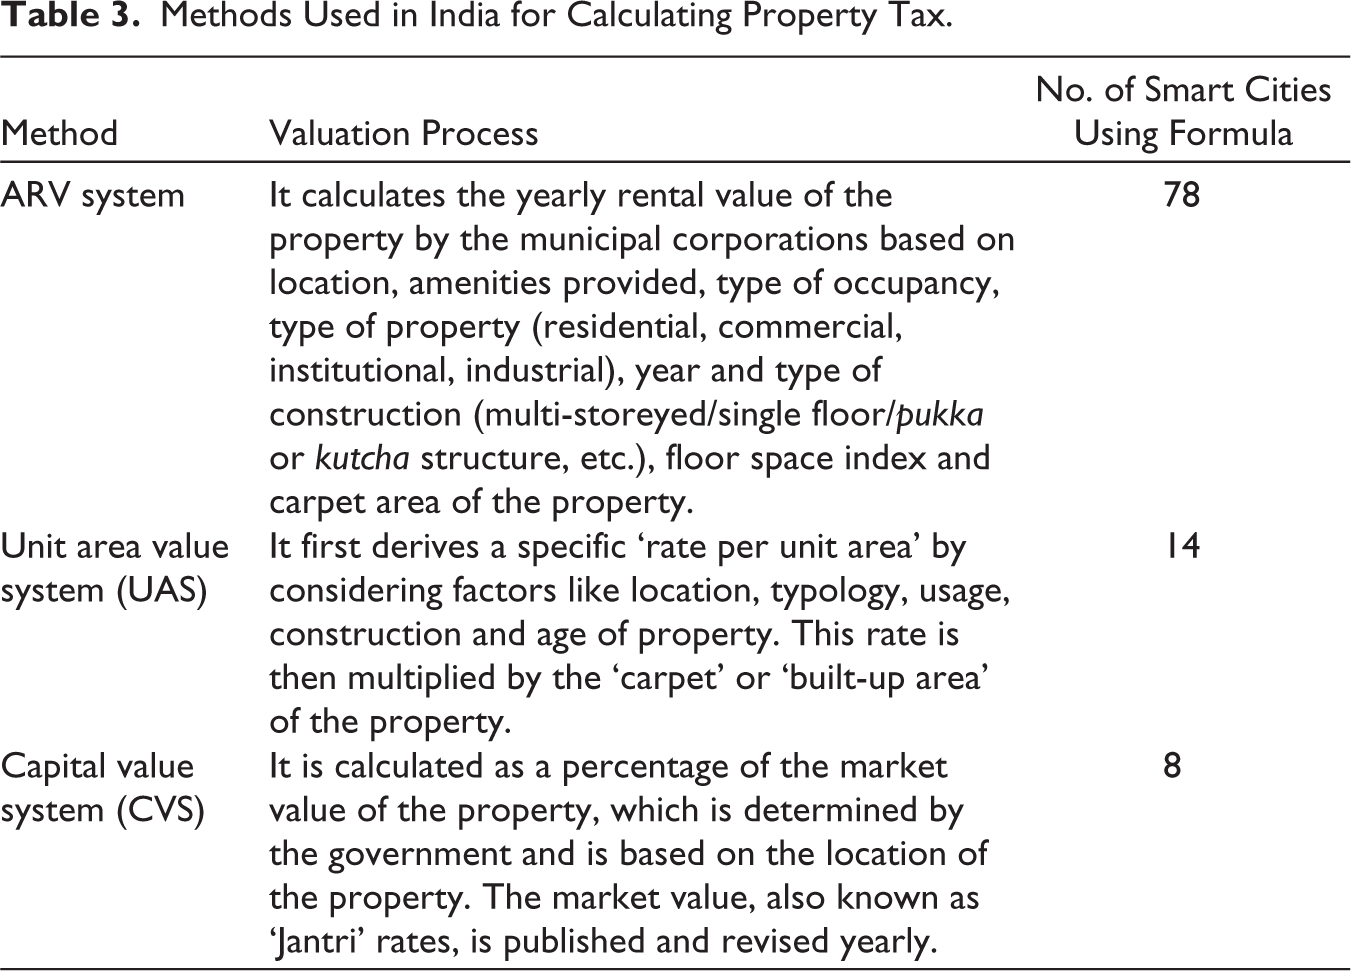
Out of the 100 smart cities, the maximum number of cities are of Tier II typology, which constitutes 85 per cent (Figure 2), while Tier I and Tier III cities form 7 per cent and 8 per cent each. It is also observed that the most popular formula used to derive property tax is the ARV (Figure 2) calculated considering the property’s proximity to landmarks and other amenities and its condition, size and location. The ARV method calculates property tax based on the potential rental income and applies to cities where properties have rental income potential. However, since the rental values are ‘estimated’, the assessment is highly subjective and can introduce variations and potential inaccuracies due to the estimated rental value not aligning with the ‘actual rental income’ of the property. This system can potentially lead to lower tax revenue for the local government since, in certain cases, properties may have a higher market value than their ‘estimated’ potential rental income. Thus, in such cases, using the ARV method may result in property tax assessments that do not adequately capture the property’s overall value and cause a leakage in the property tax administration of the ULBs. Thus, it requires a stringent framework of assessment to reduce discrepancies.
Typology of Smart Cities in India and the Most Popular Formula Used for Deriving Property Tax in India.
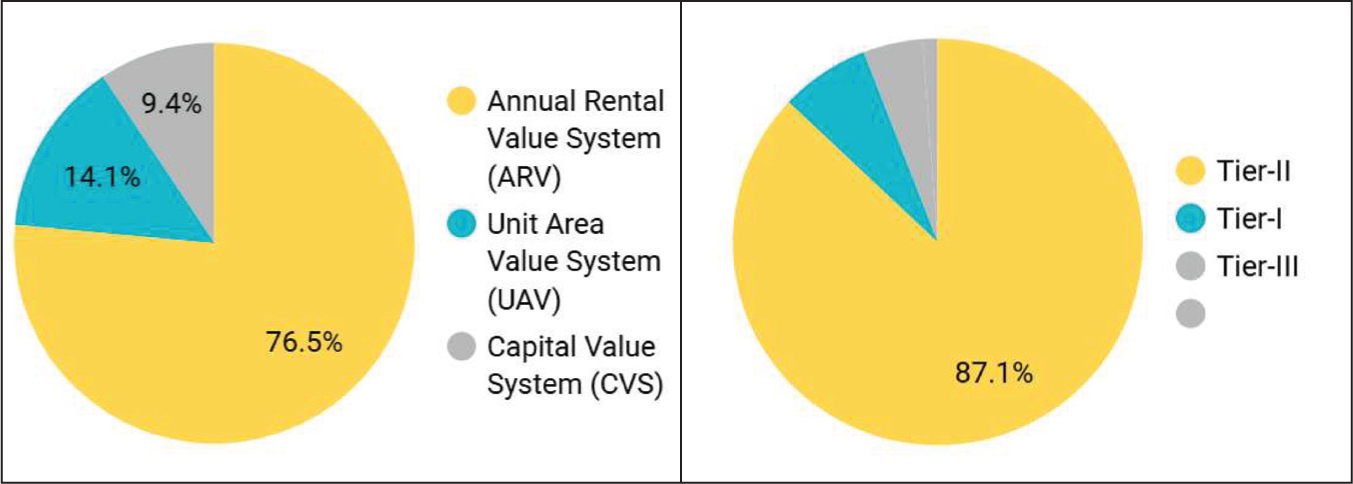
The second most popularly used formula for calculating property tax is the unit area value (UAV) system, which is used in fourteen smart cities in India out of the 100. It derives a specific ‘rate per unit area’ based on factors like location, land price, usage, etc., and then factors it with the carpet area of the property. However, the unit area system fails to take into consideration the fluctuation in the value of property with the rapid urbanisation. This method may not effectively account for changes incurred in property value over time. For example, if significant improvements or renovations are made to a property, increasing its value, the tax assessment may not reflect this change until a reassessment is conducted. This can lead to discrepancies and potential under-taxation. The unit area method is primarily suitable for residential properties, where a standardised approach can simplify tax assessment.
However, it may not be appropriate for properties that are for commercial or industrial purposes. This is coupled with an increase in cost-of-service delivery (assessment by assessors) and impacts on the financial health of ULBs over time. Thus, there should be a regular revaluation of property values, after which the UAV rates should be at least indexed to inflation and revised periodically.
The capital value system (CVS) is considered the most efficient of the three methods, but currently, only seven cities in the sample of 100 smart cities follow this method. It is calculated as a percentage of the market value of the property, also known as ‘Jantri rates’ in India, depending on the locality. Currently, it is only adopted by cities in Maharashtra, accounting for seven smart cities in India out of 100. The capital value method considers the market value or capital value of the property. As property values tend to change over time, the capital value method allows for adjustments based on market fluctuations. This ensures that property tax assessments reflect the current value of the property and can capture appreciation or depreciation in value. Although it is a very transparent method, determining the accurate market value of a property can be challenging, as Jantri rates are not very frequently revised and remain stable for a long duration. The capital value method may result in higher tax burdens for property owners in areas with rapidly increasing land/ property values.
Thus, all three methods have their fair share of pros and cons. However, it depends on the context, type of city, and to adhere to the method best suited according to their local tax structure and administration. However, the capital value method can generate better revenues for the city.
Rebate-based Findings
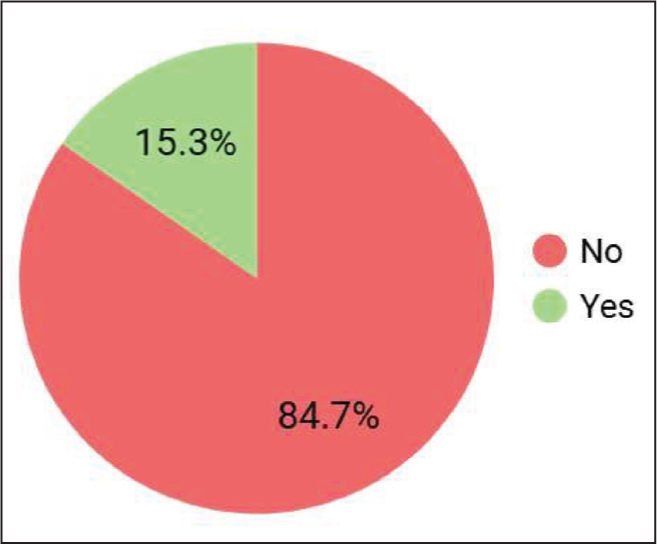
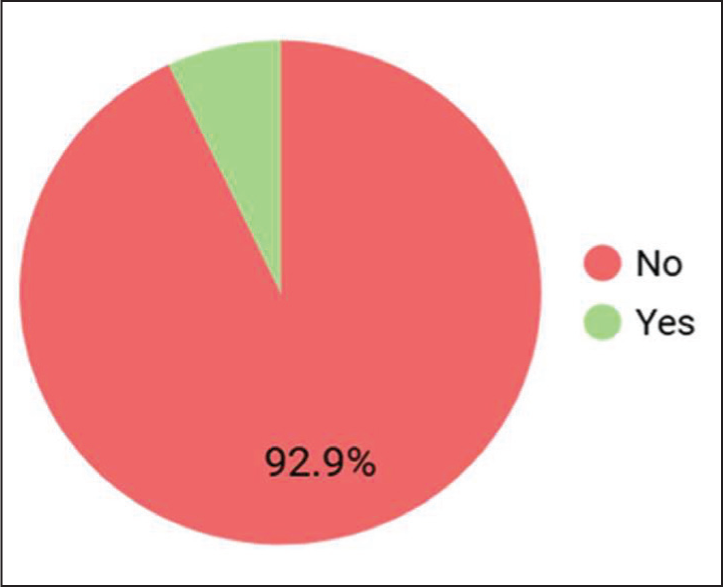
Figures 3–6 in property tax refer to specific deductions or discounts provided to certain categories of property owners or under certain circumstances, such as timely payments, owner-occupied properties, senior citizen or disabled individuals, low-income or socially disadvantaged groups and energy-efficient facilities. These rebates aim to incentivise desired behaviours by nudging owners to provide relief and promoting fairness in the property tax system.
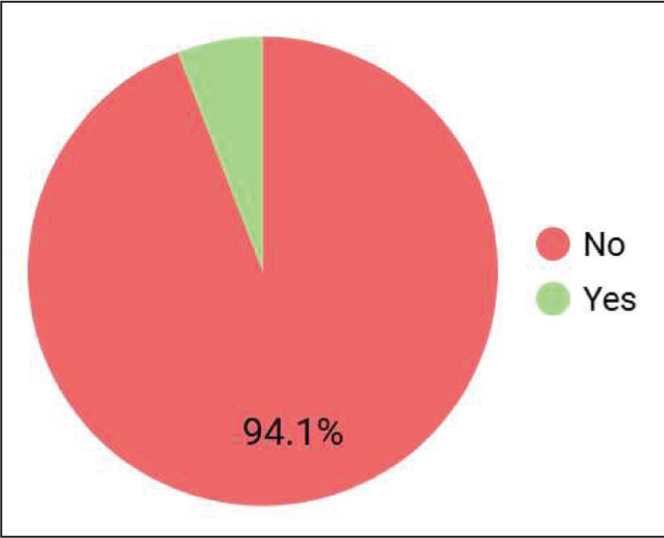
Rebates Given for Installation of Sustainable Facilities/Techniques in Premises.
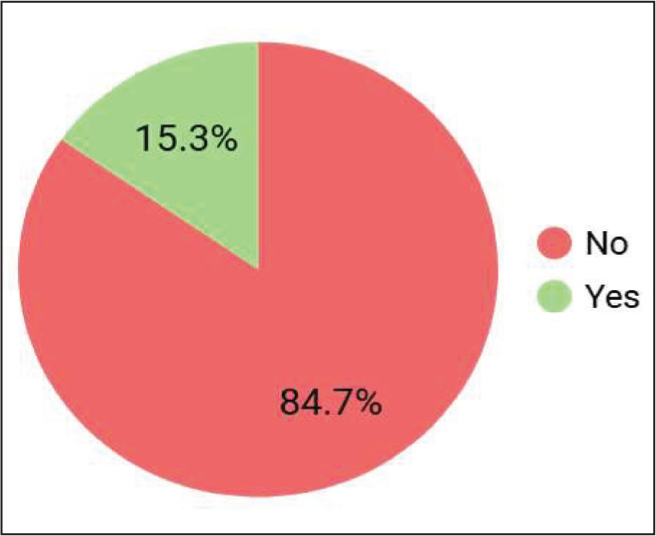
Rebates Given on the Property’s Annual Rental Value (of the 78% Cities Which Follow This System).
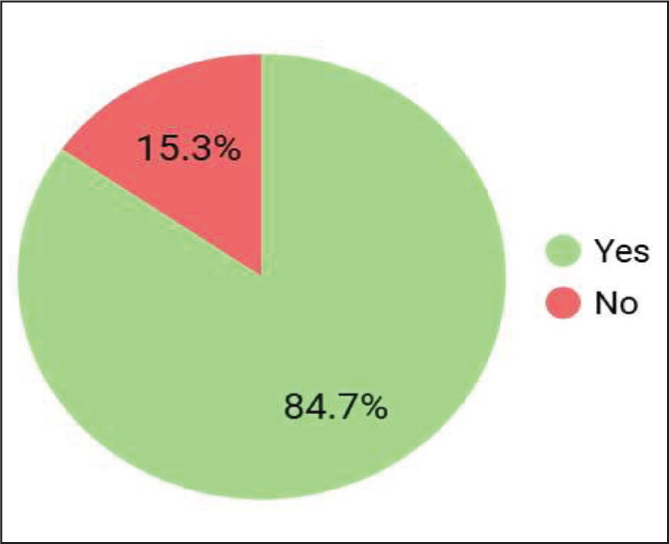
Rebates Given on Payment Before Due Date.
Rebates Given on Owner Occupied Properties.
The most popular rebate is the one given on early payments of property tax before the due date. Out of the 100 smart cities, it has been adopted in seventy-eight cities, and owners get rebates ranging from 10 to 15 per cent on the property tax. Since penalty rates ranging from 1 to 2 per cent per month are charged in case of delayed payment, and seldom taken due to political indulgence, this rebate leads to a major leakage in the municipal treasury. Instead of incentivising early payments, a punitive approach of penalising delayed payments with higher penalties would act as a better motivator. Many city governments recall all penalties closer to local elections as a freebie to attract citizens. Wherein this is not a big motivator at the individual household level, but its cumulative effects are huge at the municipal level.
The second most common rate is a given factor based on a two-step tax calculation. Mostly, it is observed in the ARV method. For example, in Telangana, the following rebates are given on ARV: 2 per cent on ARV ranging from ₹50 to 100, 4 per cent on ARV ranging from ₹101 to 200, 7 per cent on ARV ranging from ₹201 to 300, 15 per cent on ARV ranging from ₹300 and above. This two-step process of tax calculation, where the second step significantly erodes the calculated value, leads to major leakage in the assessment itself. The rebate system, especially the higher percentages applied to higher ARV ranges, can lead to a substantial reduction in the calculated tax value. This could potentially result in a loss of revenue for the government. The complexity of the two-step process may introduce opportunities for errors or deliberate manipulation during assessment. This can lead to underreporting of ARVs or misclassification of properties to take advantage of lower tax rates. If this is coupled with lower collection efficiency, then the leakage gets a multiplier effect.
Seven municipal corporations out of 100 smart cities give rebates to properties that have used vernacular or local material/techniques for construction or installed any of the five sustainable facilities like solar panels, rainwater harvesting, vermicomposting, etc. For example, the Pune Municipal Corporation gives a rebate to residential properties with vermiculture, solar panels, and rainwater harvesting, and can get a 5 per cent discount on municipal tax for any one of these facilities, along with a 10 per cent discount for two of these projects. It has been at the forefront of the green building movement by introducing eco-housing in the city in 2003. Since then, the PMC has worked closely with GRIHA and IGBC to promote green buildings in Pune by giving rebates on the installation of any of the five facilities, such as solar panels, rainwater harvesting, etc. The city improved efficiencies in property tax collection by setting up payment kiosks, improving online information and starting a voluntary disclosure scheme for citizens to declare their property for taxation without penalty (Tilak, 2019).
In Chennai, owners of occupied properties get a rebate of up to 25 per cent. Around 5 per cent of smart cities provide a rebate of up to 50 per cent to owner-occupied properties despite using the same level of services as rented properties. Since it is not serving economically, physically or socially weaker sections of society, such practices induce unwanted leakages in the property tax assessment stage.
Tax Exemptions-based Findings
Exemptions (Figures 7–10) in property tax refer to specific cases or categories of properties that are fully or partially exempted from paying property taxes, such as government-owned properties, charitable organisations, educational institutions, agricultural land and heritage properties. These exemptions are granted by the relevant tax authorities and are typically based on certain criteria.
Rebates Given on the Basis of the Age of Property.
Exemptions Given to Charitable Institutions and Trusts, Land for Public Worship, and Government-owned Buildings.
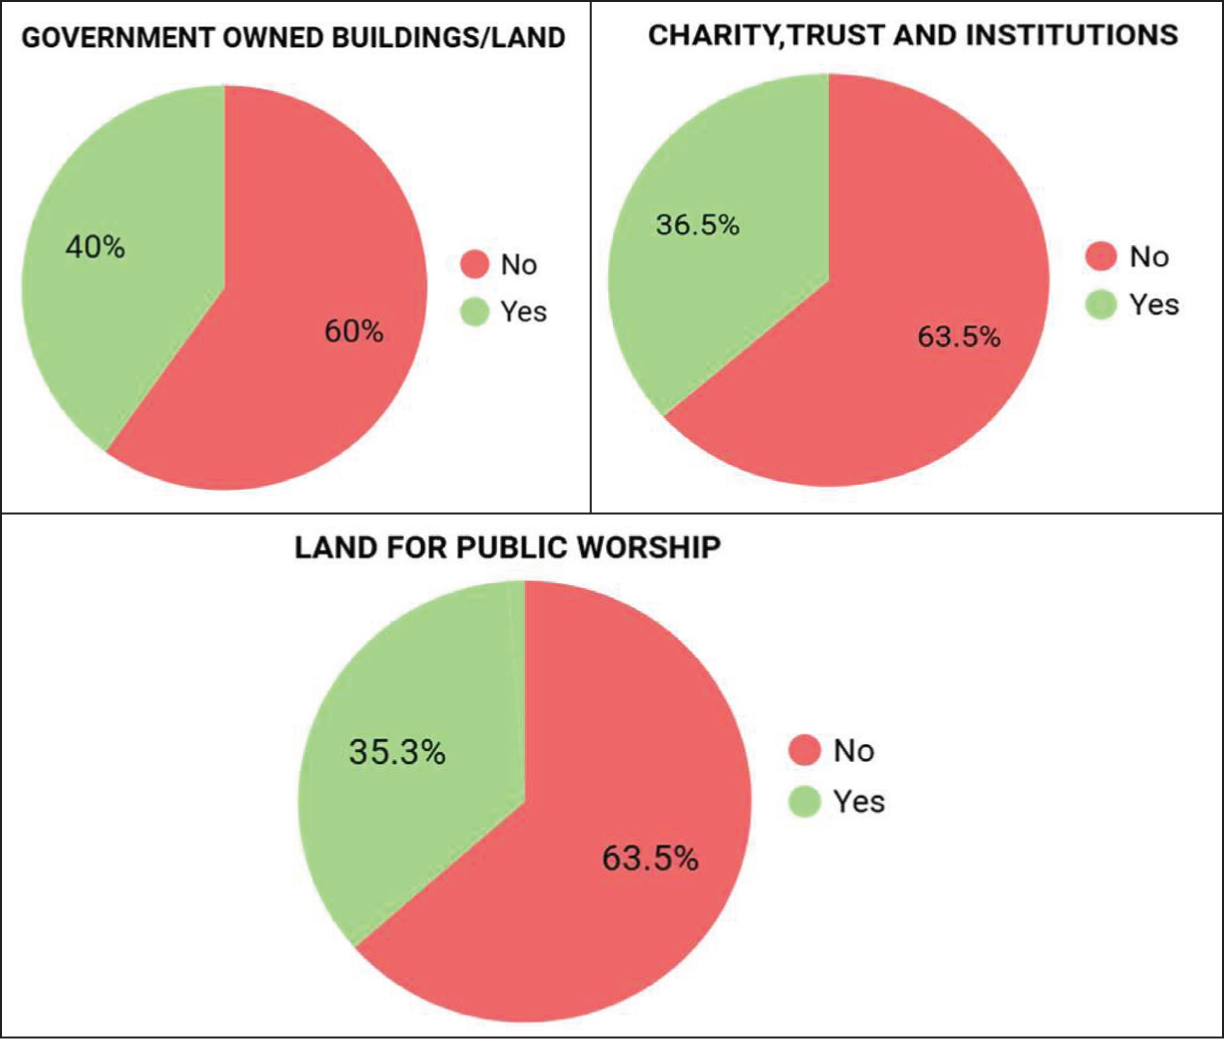
The most popular exemption (Figure 9) is the one given to charitable trust institutions and land for public worship. Although only 34 per cent of smart cities have exempted taxes on charitable trusts and institutions to encourage more funders to provide means for the less privileged and backward sections of society, it would be for the greater good if all smart cities followed it. Also, 33 per cent of smart cities exempt land for public worship; however, to avoid leakage in revenue, assessors should periodically inspect the site to check that no vacant land has been encroached.
Exemptions Given to Properties Used for Public Worship, Crematoriums and the Differently Abled.
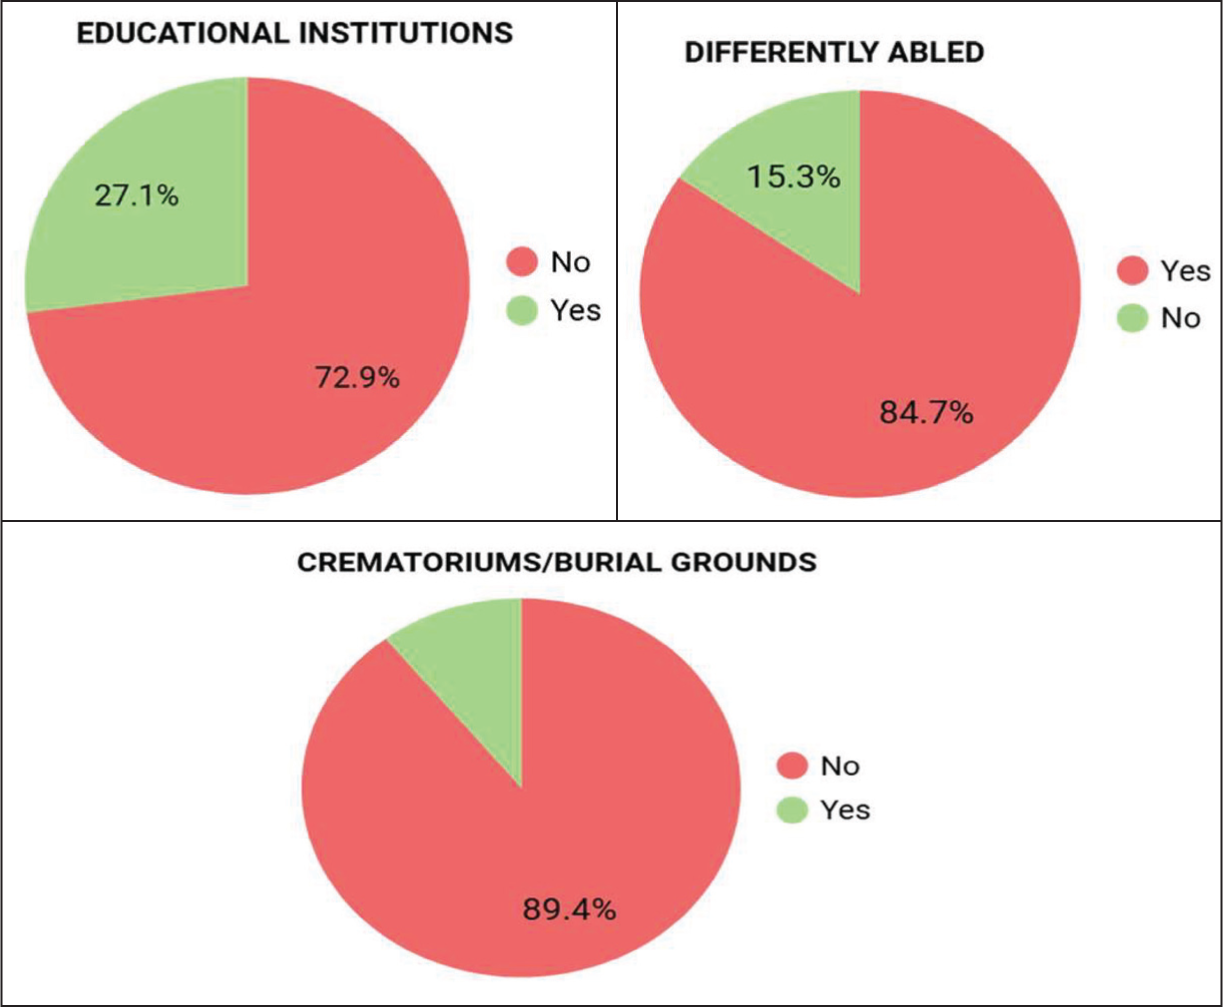
Based on the calculated property tax, exemptions are given on various parameters. Educational institutions are exempted from paying property tax in about 25 per cent of the smart cities, which amounts to a leakage in the municipal treasury since these institutions are not funded, and they occupy large areas of land. Moreover, educational institutions charge a lot from the students and are commercial in nature. Such an exemption leads to much erosion in the tax base of the city. However, government-owned schools (centre/state/municipal corporation) are exempted from paying property tax in 35 per cent of smart cities (Figure 10).
Exemptions Given to Properties Owned by Differently Abled and Heritage Buildings.
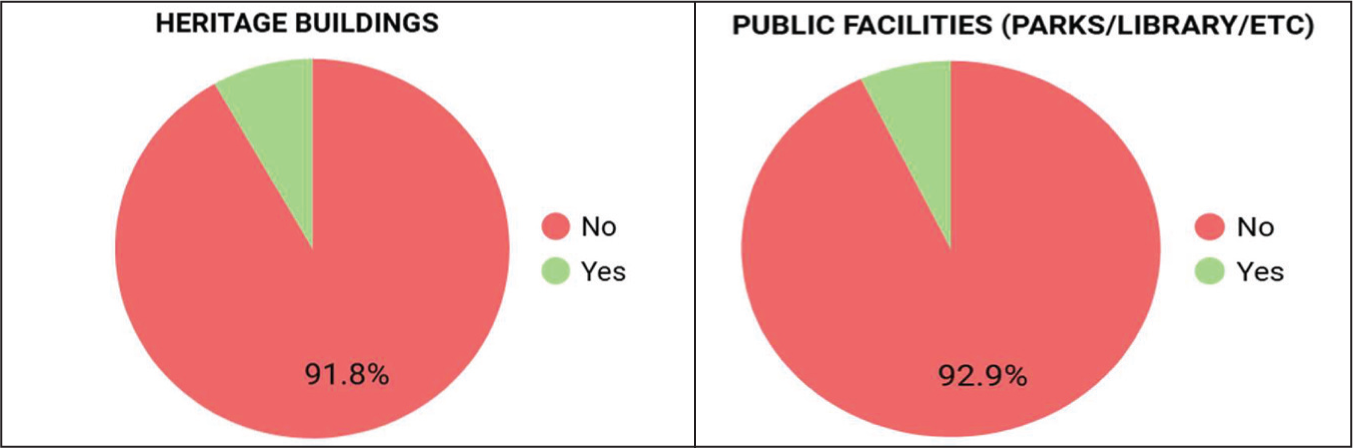
Only 7 per cent of smart cities, like Amritsar, exempt heritage properties to maintain the order of the cities. Heritage properties which charge visiting fees from the public should be encouraged to be liable to pay tax and may get a rebate since maintenance of such structures is also important and may be expensive. Cities like Udaipur and Ahmedabad, which have a rich heritage both culturally and architecturally, can specifically adopt this mechanism to enhance the beauty of the city and eventually their smart cities ranking as well.
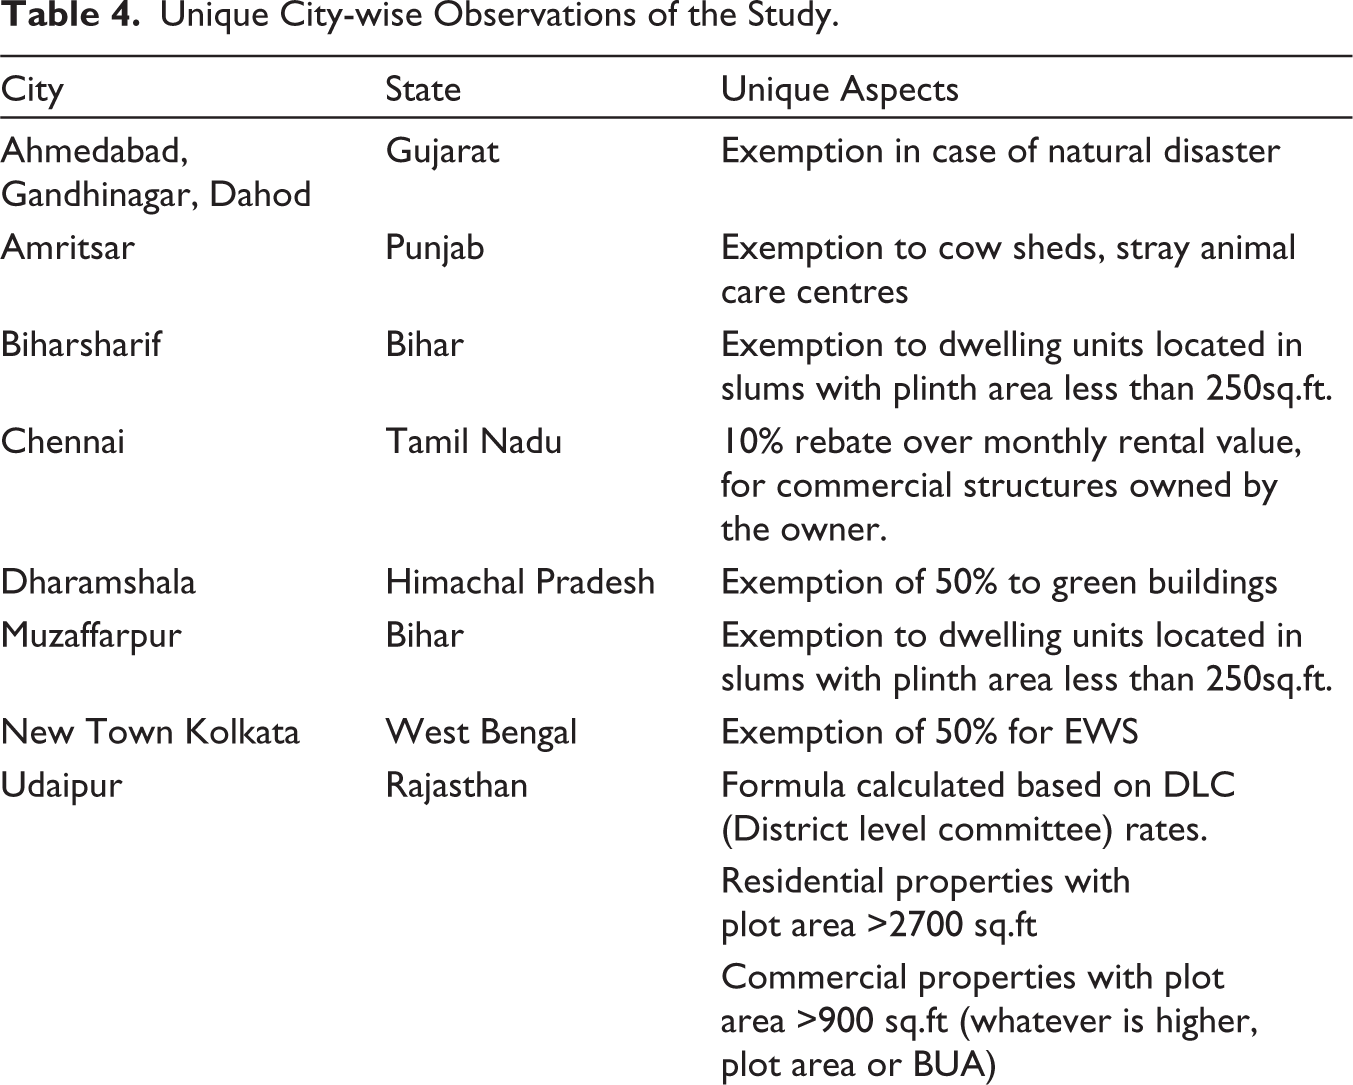
Unique Observations
Table 4 represents good initiatives to enhance the adoption of sustainable practices by households, leading towards environmental conservation. The state of Maharashtra is proactive in adopting the capital value method for property tax calculation. The tax calculation system, at the same time, indicates a major leakage in Rajasthan. Besides the above, it has also been observed that the efficiency of collecting property tax is quite low in many cities.
Unique City-wise Observations of the Study.
Property Tax Collection Efficiency
Property tax collection efficiency can be significantly enhanced through a system-wide strengthening of billing enforcement and digital systems, rather than isolated interventions. Despite the kinds of incentives and penalties, citizens tend to defer the payments, and eventually, the state government provides them with relief at the time of elections to garner support from the citizens. Sometimes cities adopt a Property Tax Amnesty Scheme or a One-Time Settlement scheme. This is a limited-time opportunity offered by municipalities to tax defaulters to pay their overdue taxes without incurring the usual severe penalties or interest. Often, the scheme allows for a 50 to 100 per cent waiver of accumulated interest and penalties, provided the principal amount is paid in full.
Few cities have adopted technology-based solutions like the assessment of properties through GIS (geographical information systems), which not only maps the properties but also constantly monitors newer developments and updates the databases. The enumeration can also be done through ‘feet on streets’, third-party agencies that are empanelled by the urban local bodies for ‘door-to-door’ collection of property taxes (this practice is popular in Odisha). Therefore, the billing and collection efficiency are as important as the enumeration/assessment of properties. The collection efficiency is a ratio of tax collected to the demand raised. However, the efficiency of tax collection only pertains to the ULBs’ ability to collect taxes from properties that have undergone assessment and received bills. It does not consider properties that are taxable but have not yet been assessed. Only 40 per cent of smart cities use GIS for assessment of properties, but their coverage is not yet known. When compared to peers in the OECD, India performs poorly in generating revenues from the urban immovable property tax. The data show that while the average collection from property taxes in the OECD group is about 1.1 per cent of national gross domestic product, the figure for India is about 0.2 per cent, which is just one-sixth (Nagarajan, 2020). Even in the better-performing Indian states, property tax collection is considerably lower than in OECD countries. There are various factors contributing to this low property tax revenue in India, such as undervaluation of properties, incomplete registration systems, inadequate policies and ineffective administration. Thus, in order to improve property tax administration, both coverage and collection efficiency will have to be drastically enhanced. Strong penal provisions for defaulters, public disclosure of demand and collection data (including defaulters), and regular MIS-based performance monitoring can create both deterrence and transparency. Together, these measurements shift from a reactive manual approach to a proactive data-driven collection regime, thereby improving both compliance and overall collection efficiency (Ministry of Housing & Urban Affairs, n.d.).
The sixteenth Finance Commission report (Janaagraha, 2026) also indicates a clear structural shift towards strengthening OSR, with property tax at its core, by embedding revenue performance into the intergovernmental fiscal framework. The report highlights that urban grants are no longer need-based but also increasingly linked to efficiency and fiscal effort, with OSR performance being factored into the allocation formula and performance grants explicitly tied to OSR growth. This marks a transition from passive dependence on transfers to an incentive-driven regime where cities are rewarded for increasing their own revenues. Since property tax constitutes the largest component of OSR for ULBs, this effectively places property tax reforms at the centre of municipal finance strengthening. The inclusion of OSR as a criterion even in inter-state allocation (10% weight), and the requirement for states to ensure minimum transfers linked to Finance Commission grants, together create a multi-level push for revenue mobilisation. In essence, the report positions property tax not merely as a local tax instrument but as a strategic lever for unlocking higher fiscal transfer, improving accountability and enabling urban service delivery, thereby aligning local revenue effort with national fiscal devolution priorities.
Conclusion and Recommendations
Based on the above findings, it can be understood that property tax assessment and administration need a significant revamp to enable cities to increase their own source of income. A reform in this direction is a better point of leverage for making cities self-sustainable. Some of the recommendations are as follows:
To develop a standardised and transparent methodology for property valuation to ensure consistency and fairness across jurisdictions. Although the ARV system is prominently used in most Indian smart cities, the CVS is a better approach since it considers not just the value of property but the percentage of the market value of the property. Also, because land is an appreciating asset, it may cause a tax burden on payers, and is complex to operationalise on the ground. However, it will yield the actual value of property and increase OSR for municipal corporations. Establish a robust property data management system that maintains accurate and up-to-date property records (since currently only 40% of smart cities in India have started assessment on GIS). This includes digitisation of property records and integration of GIS technology for regular enumeration, yielding accurate property valuations and providing better coverage. Since 25 per cent of the 100 smart cities exempt educational institutions that are not funded by any trust, it is a major leakage, and they should not be exempted from paying property tax. It leads to a heavy loss of revenue for the local government. Educational institutions, especially private institutions, should not be exempted since they are collecting substantial fees from the students and are situated across many acres of land. All states should add a property tax levy on vacant land and notified slums. It should also be ensured that these notified slums are included in the tax base, promoting inclusivity and equity with regular updating of the property registry to include newly constructed properties and remove demolished or non-existent ones. Only 34 per cent of the smart cities permit exemptions for charitable trusts and institutions. An exemption should be allowed across the 100 cities to set a benchmark for encouraging community service. Only 22 per cent of smart cities encourage rebates on the installation of sustainable facilities like solar panels and rainwater harvesting. It should be mandated across all 100 smart cities for climate-resilience incentivising. Many NGOs have been deployed in the state of Odisha for collecting property tax. These ‘feet on the street’ can be empanelled by the municipal corporations for nudging people to pay property tax and ensure timely inspection of properties on the ground to update records. The feet on the street would act as an intelligence agency for the ULB and would help in increasing collection efficiency even after adopting online payment measures. Provide training and capacity building programmes for property tax officials to enhance their skills in property valuation, data management, customer service and enforcement. Regular training programmes ensure that tax officials are equipped with the necessary knowledge and expertise to administer property taxes effectively. ULBs should implement comprehensive integrated information systems for enumeration, collecting and billing, reminders, online payments, digital records, integration with GIS systems and property tax registers, as well as making it easier to collect monthly and quarterly property taxes. Penalties for late payments should be tightened, and the publication of a list of defaulters should be maintained. The rate of interest in case of late payment should be the same across all cities to avoid inequality. Inter-departmental coordination and data sharing between relevant government agencies should be strengthened to streamline property tax administration. Also, property tax data should be integrated with other databases, such as land records, utility billing systems and demographic information, to improve accuracy and efficiency. Implement a system to monitor and evaluate the performance of property tax administration, including collection rates, compliance levels and customer satisfaction. Regular evaluation helps identify areas for improvement and allows for evidence-based decision-making.
Limitations and Future Scope of Study
Although this article is limited to the 100 smart cities of India, the study can be extrapolated to various other cities, despite the typology. It is the need of the hour that the constitutionalised bodies of local governments (through the Seventh Schedule) improve their financial autonomy to take independent decisions for the welfare of the city. Since property tax forms the biggest chunk of the OSR for the ULBs, it must be formulated and operationalised to its maximum potential to yield the desired results. Thus, the first step requires correction of the assessment framework based on which the amount of property tax to be paid is decided. If it is not calculated properly, considering the various factors, then it shall cause leakage in the municipal treasury, and no matter how much is invested in the corresponding steps of billing and collection, they would not yield the desired efficiencies, repeating the loop.
Footnotes
Declaration of Conflicting Interests
The authors declared no potential conflicts of interest with respect to the research, authorship and/or publication of this article.
Funding
The authors received no financial support for the research, authorship and/or publication of this article.
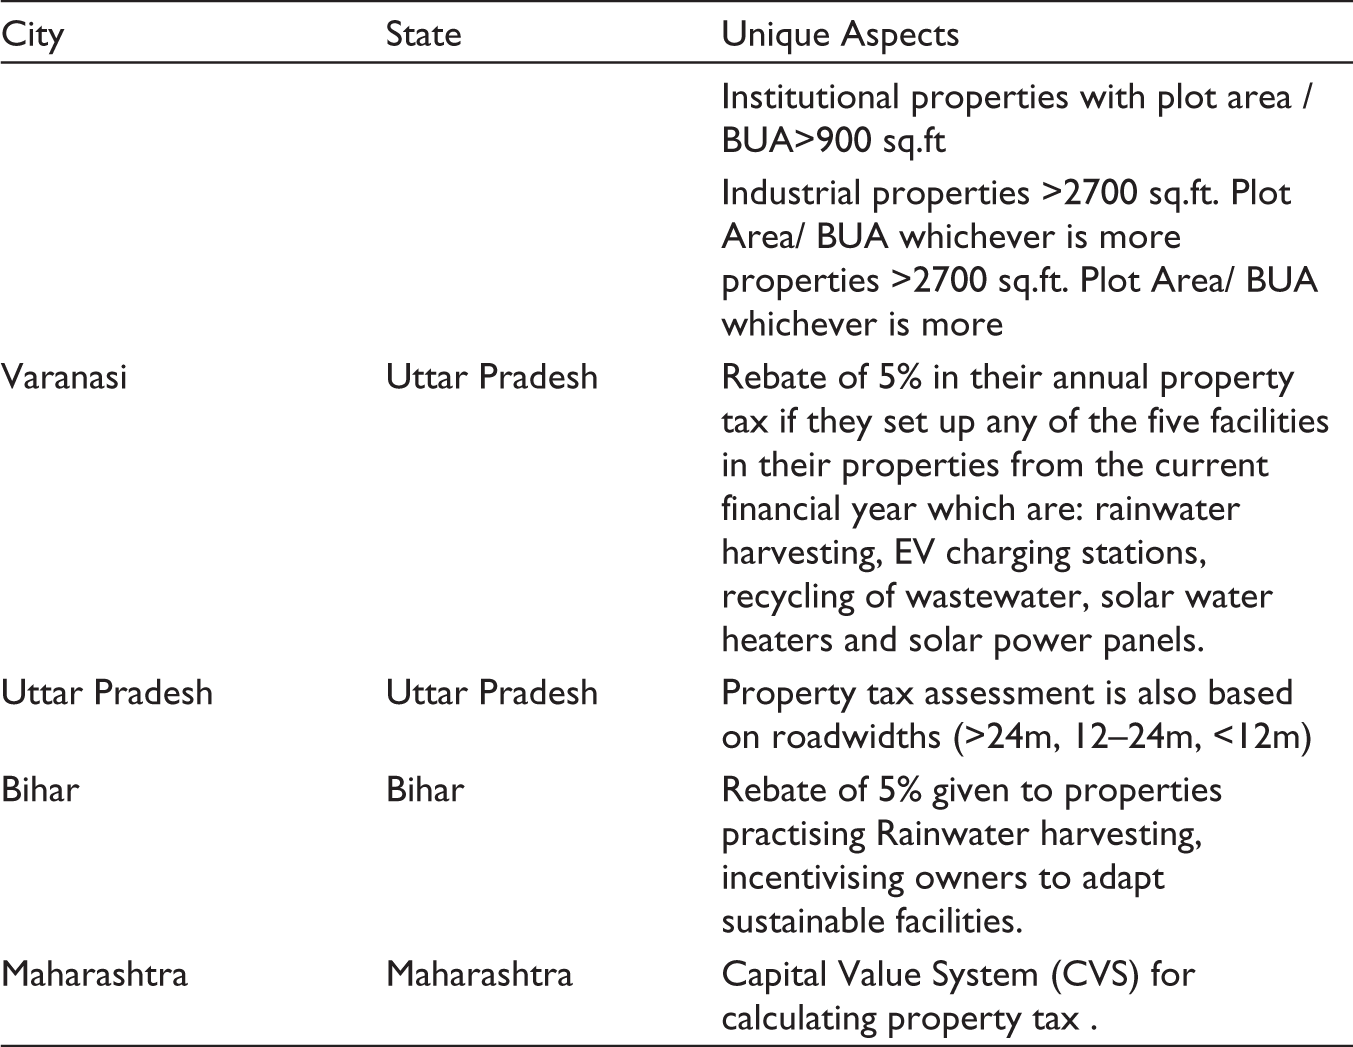
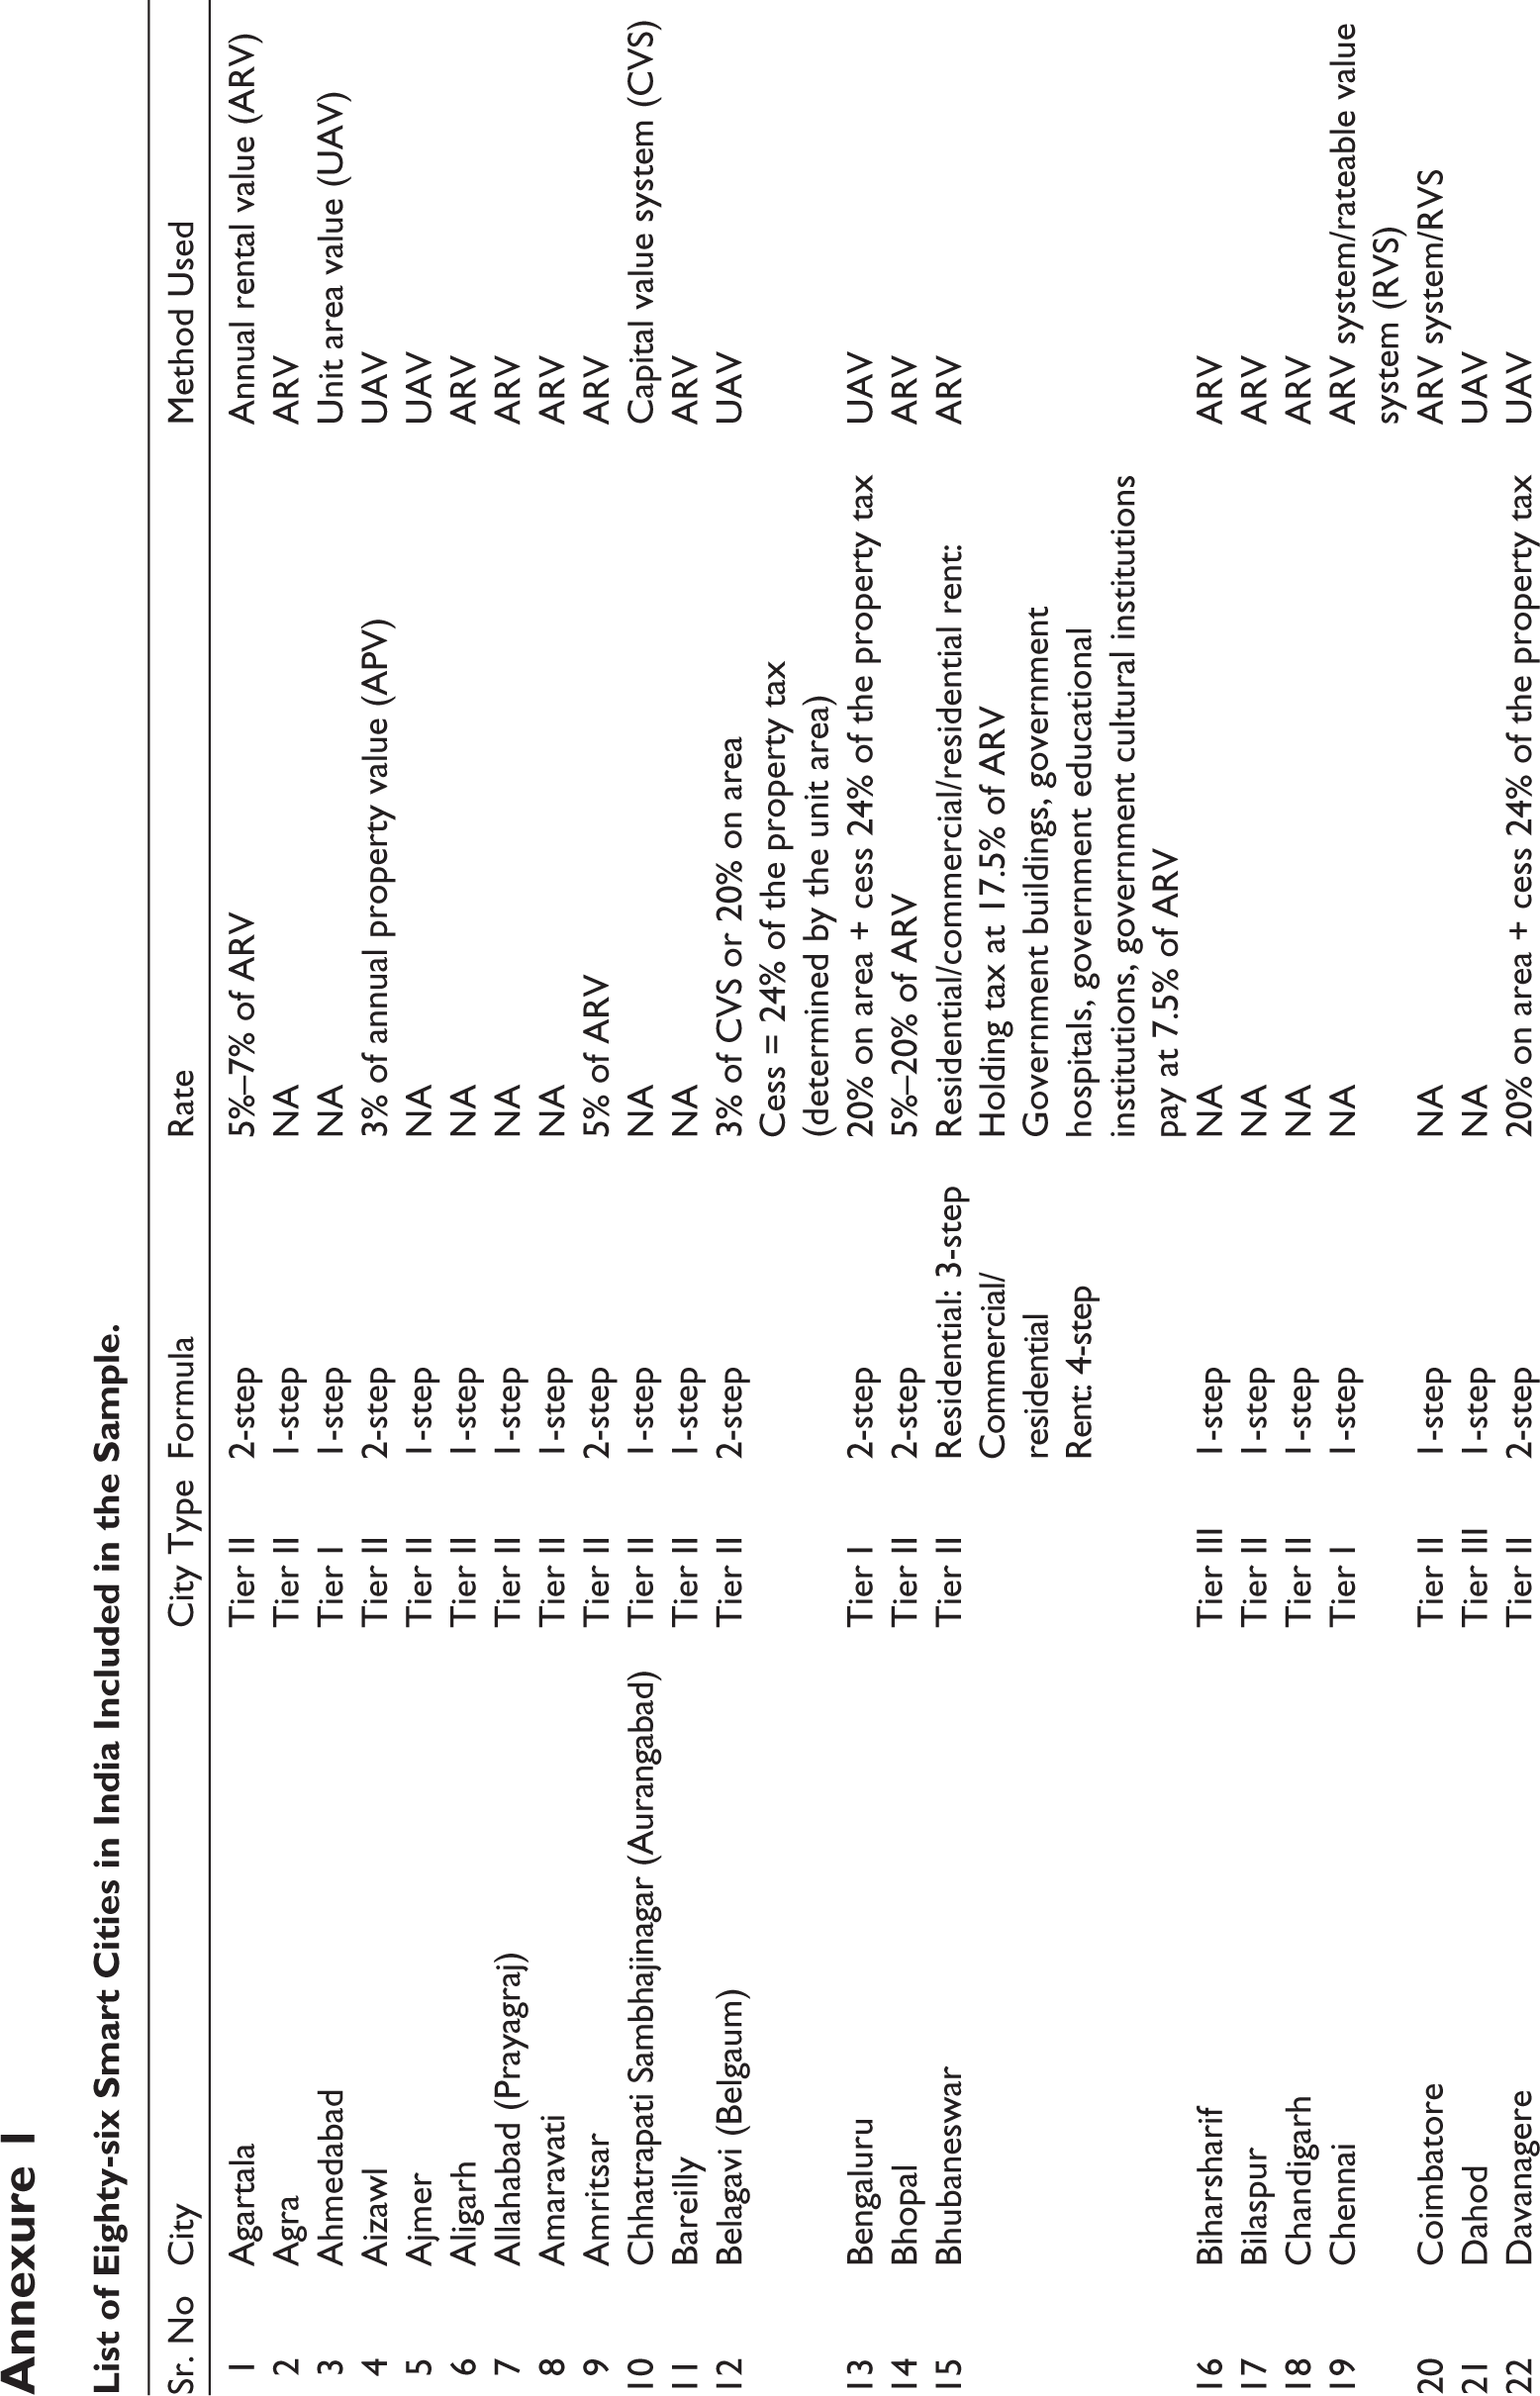
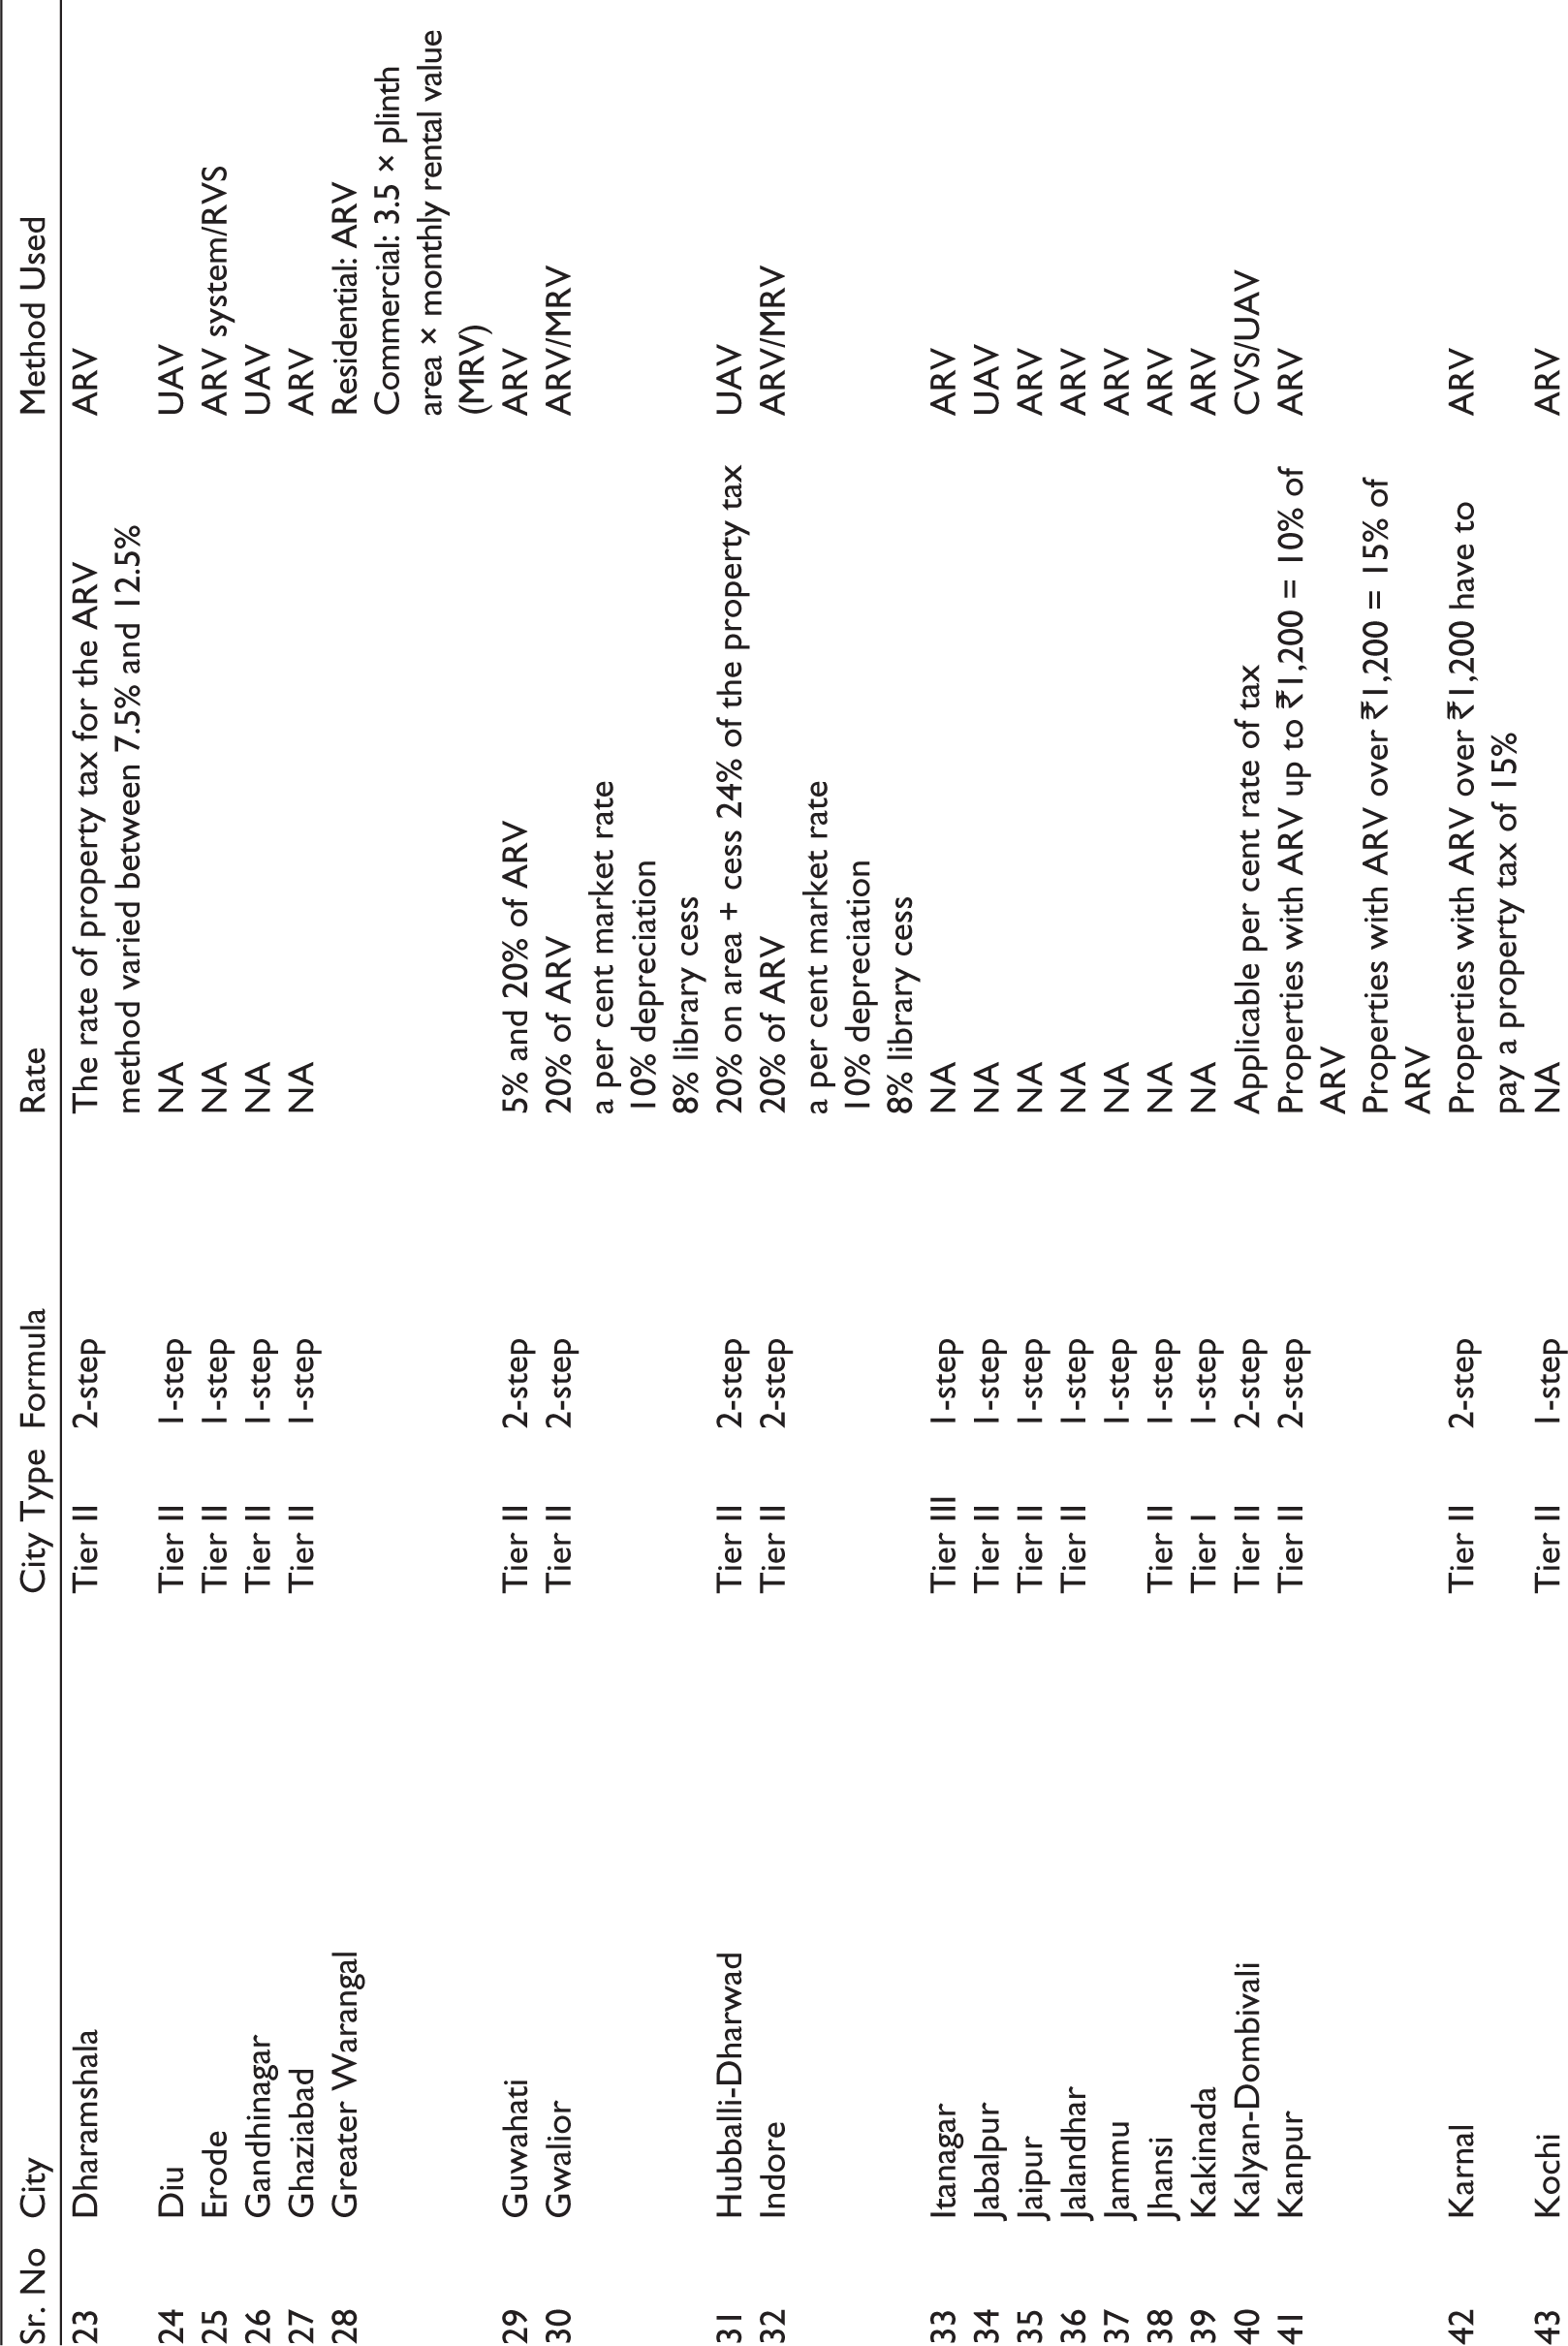
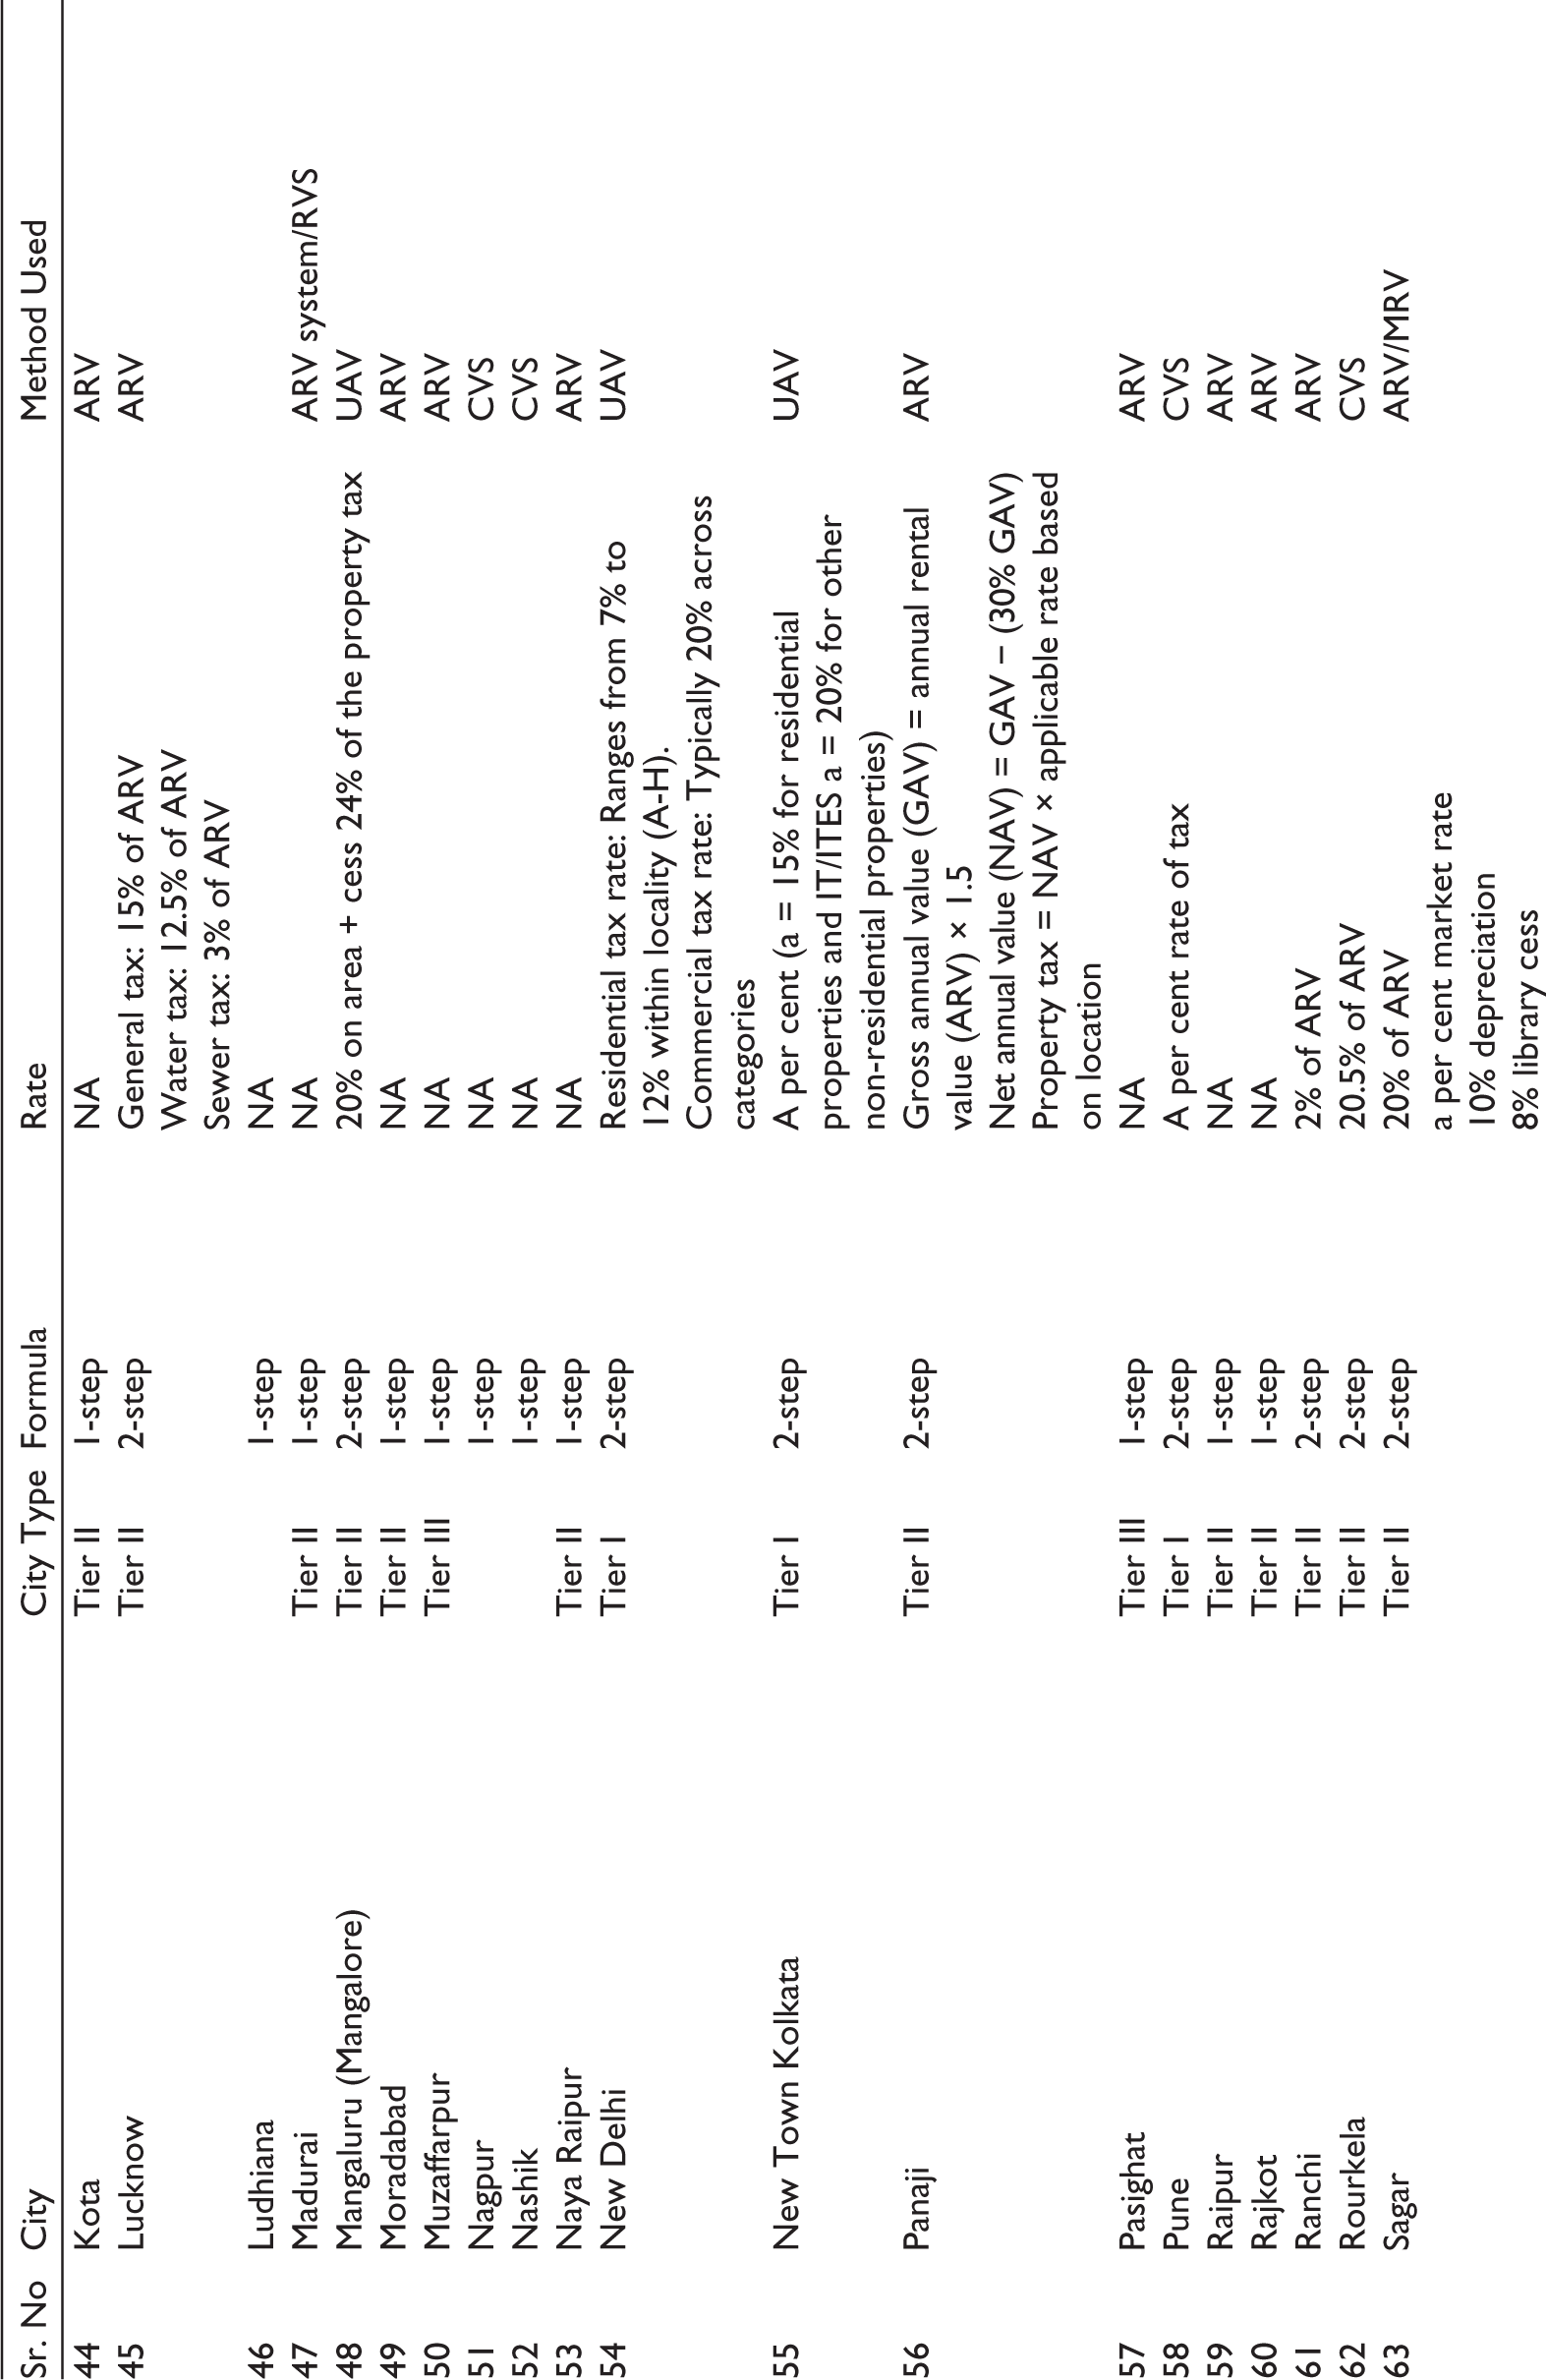
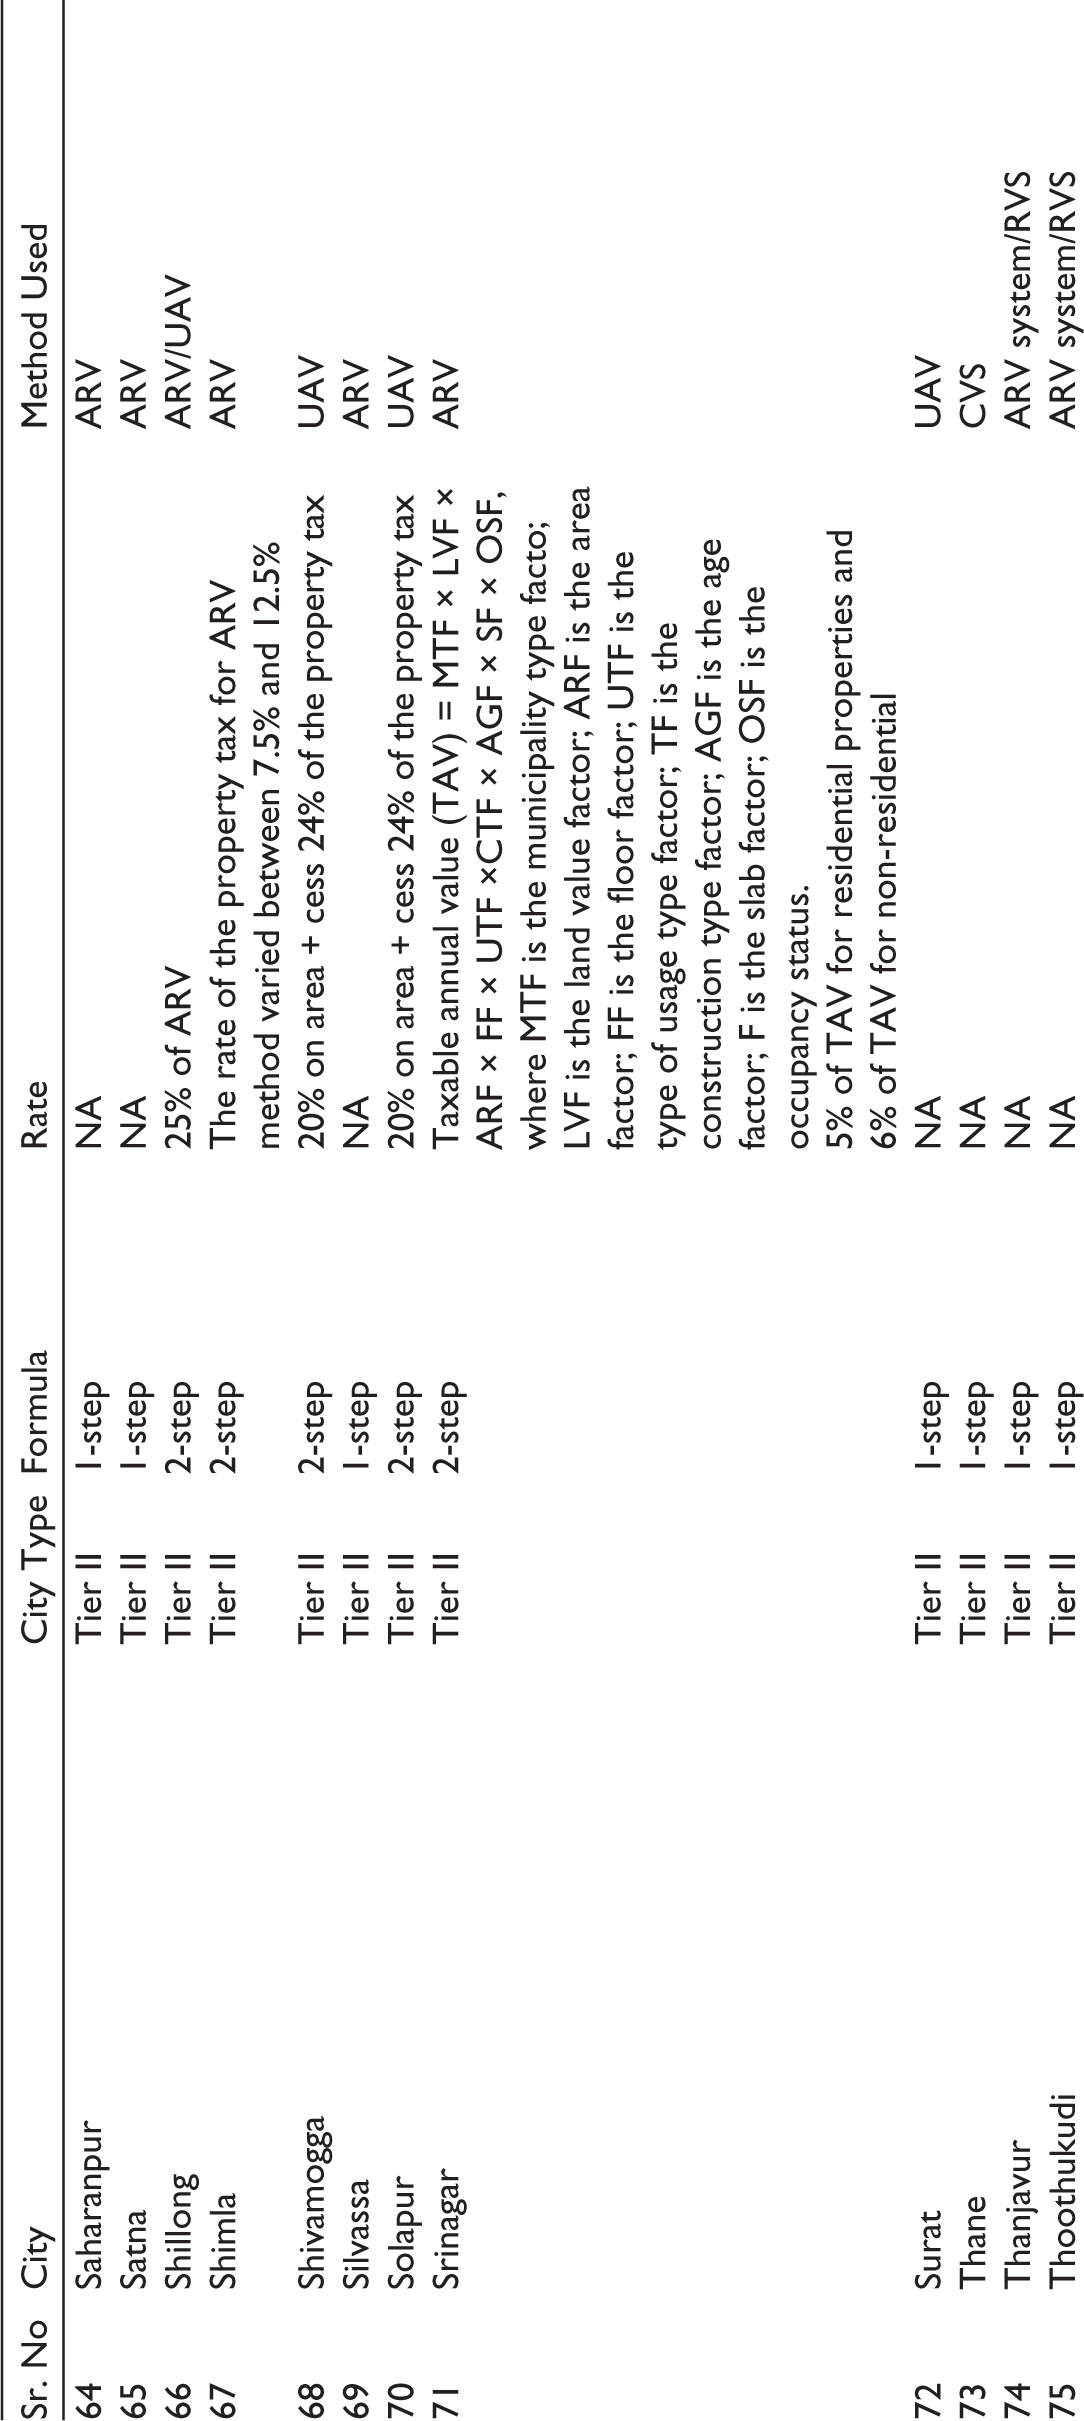
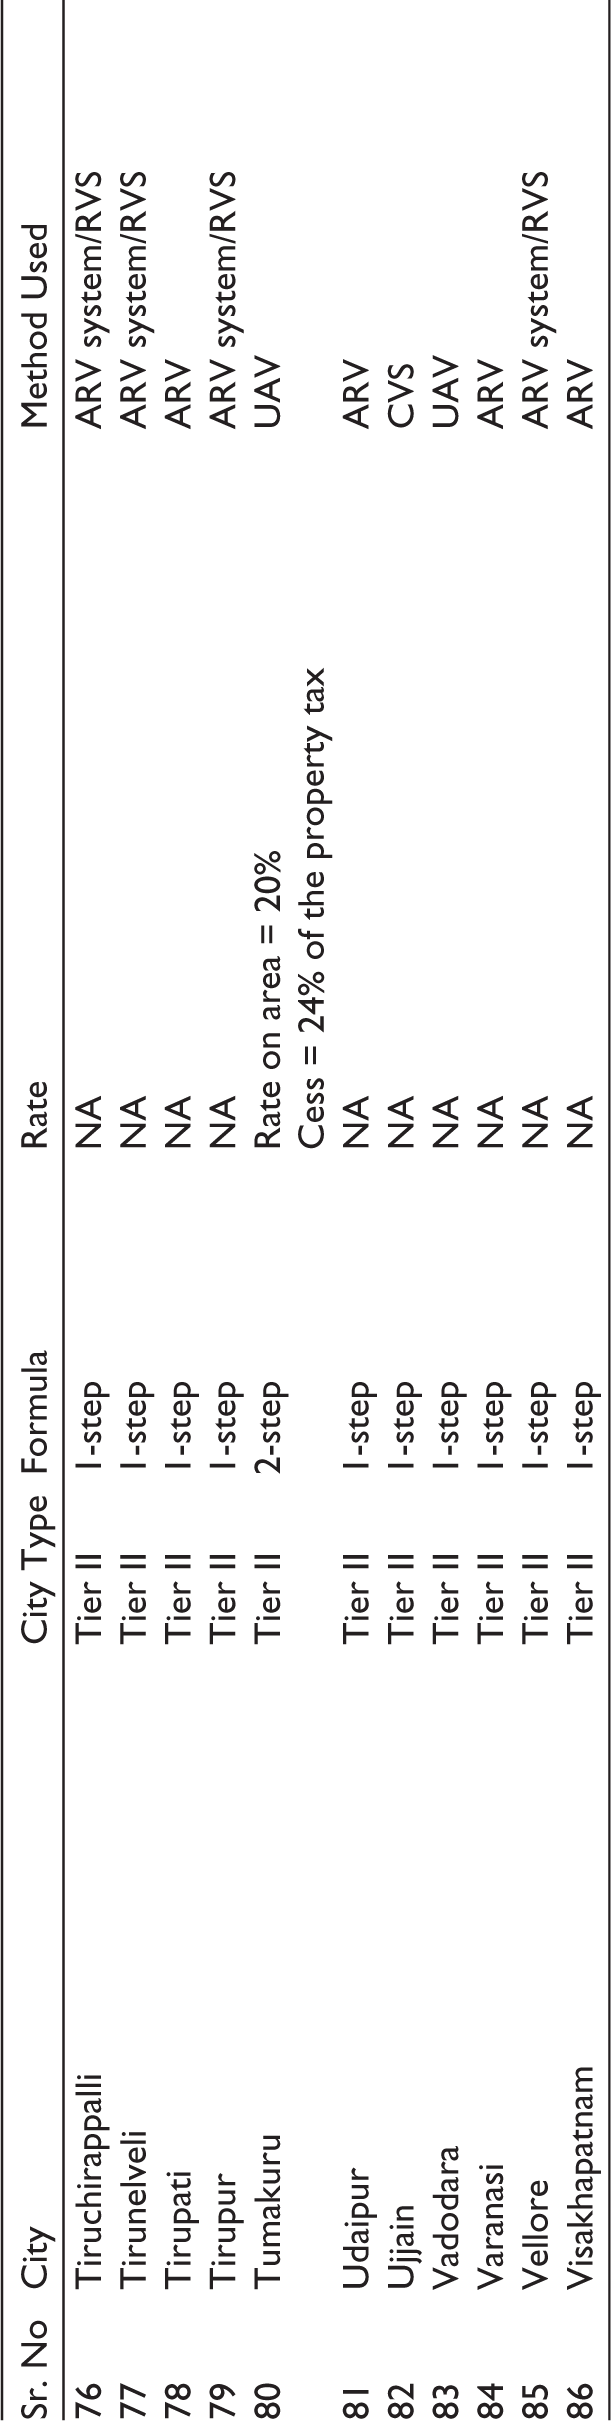
Annexure 1
List of Eighty-six Smart Cities in India Included in the Sample.
| Sr. No | City | City Type | Formula | Rate | Method Used |
| 1 | Agartala | Tier II | 2-step | 5%–7% of ARV | Annual rental value (ARV) |
| 2 | Agra | Tier II | 1-step | NA | ARV |
| 3 | Ahmedabad | Tier I | 1-step | NA | Unit area value (UAV) |
| 4 | Aizawl | Tier II | 2-step | 3% of annual property value (APV) | UAV |
| 5 | Ajmer | Tier II | 1-step | NA | UAV |
| 6 | Aligarh | Tier II | 1-step | NA | ARV |
| 7 | Allahabad (Prayagraj) | Tier II | 1-step | NA | ARV |
| 8 | Amaravati | Tier II | 1-step | NA | ARV |
| 9 | Amritsar | Tier II | 2-step | 5% of ARV | ARV |
| 10 | Chhatrapati Sambhajinagar (Aurangabad) | Tier II | 1-step | NA | Capital value system (CVS) |
| 11 | Bareilly | Tier II | 1-step | NA | ARV |
| 12 | Belagavi (Belgaum) | Tier II | 2-step | 3% of CVS or 20% on area Cess = 24% of the property tax (determined by the unit area) |
UAV |
| 13 | Bengaluru | Tier I | 2-step | 20% on area + cess 24% of the property tax | UAV |
| 14 | Bhopal | Tier II | 2-step | 5%–20% of ARV | ARV |
| 15 | Bhubaneswar | Tier II | Residential: 3-step Commercial/ residential Rent: 4-step |
Residential/commercial/residential rent: Holding tax at 17.5% of ARV Government buildings, government hospitals, government educational institutions, government cultural institutions pay at 7.5% of ARV |
ARV |
| 16 | Biharsharif | Tier III | 1-step | NA | ARV |
| 17 | Bilaspur | Tier II | 1-step | NA | ARV |
| 18 | Chandigarh | Tier II | 1-step | NA | ARV |
| 19 | Chennai | Tier I | 1-step | NA | ARV system/rateable value system (RVS) |
| 20 | Coimbatore | Tier II | 1-step | NA | ARV system/RVS |
| 21 | Dahod | Tier III | 1-step | NA | UAV |
| 22 | Davanagere | Tier II | 2-step | 20% on area + cess 24% of the property tax | UAV |
| 23 | Dharamshala | Tier II | 2-step | The rate of property tax for the ARV method varied between 7.5% and 12.5% | ARV |
| 24 | Diu | Tier II | 1-step | NA | UAV |
| 25 | Erode | Tier II | 1-step | NA | ARV system/RVS |
| 26 | Gandhinagar | Tier II | 1-step | NA | UAV |
| 27 | Ghaziabad | Tier II | 1-step | NA | ARV |
| 28 | Greater Warangal | Residential: ARV Commercial: 3.5 × plinth area × monthly rental value (MRV) | |||
| 29 | Guwahati | Tier II | 2-step | 5% and 20% of ARV | ARV |
| 30 | Gwalior | Tier II | 2-step | 20% of ARV a per cent market rate 10% depreciation 8% library cess |
ARV/MRV |
| 31 | Hubballi-Dharwad | Tier II | 2-step | 20% on area + cess 24% of the property tax | UAV |
| 32 | Indore | Tier II | 2-step | 20% of ARV a per cent market rate 10% depreciation 8% library cess |
ARV/MRV |
| 33 | Itanagar | Tier III | 1-step | NA | ARV |
| 34 | Jabalpur | Tier II | 1-step | NA | UAV |
| 35 | Jaipur | Tier II | 1-step | NA | ARV |
| 36 | Jalandhar | Tier II | 1-step | NA | ARV |
| 37 | Jammu | 1-step | NA | ARV | |
| 38 | Jhansi | Tier II | 1-step | NA | ARV |
| 39 | Kakinada | Tier I | 1-step | NA | ARV |
| 40 | Kalyan-Dombivali | Tier II | 2-step | Applicable per cent rate of tax | CVS/UAV |
| 41 | Kanpur | Tier II | 2-step | Properties with ARV up to ₹1,200 = 10% of ARV Properties with ARV over ₹1,200 = 15% of ARV |
ARV |
| 42 | Karnal | Tier II | 2-step | Properties with ARV over ₹1,200 have to pay a property tax of 15% | ARV |
| 43 | Kochi | Tier II | 1-step | NA | ARV |
| 44 | Kota | Tier II | 1-step | NA | ARV |
| 45 | Lucknow | Tier II | 2-step | General tax: 15% of ARV Water tax: 12.5% of ARV Sewer tax: 3% of ARV |
ARV |
| 46 | Ludhiana | 1-step | NA | ||
| 47 | Madurai | Tier II | 1-step | NA | ARV system/RVS |
| 48 | Mangaluru (Mangalore) | Tier II | 2-step | 20% on area + cess 24% of the property tax | UAV |
| 49 | Moradabad | Tier II | 1-step | NA | ARV |
| 50 | Muzaffarpur | Tier III | 1-step | NA | ARV |
| 51 | Nagpur | 1-step | NA | CVS | |
| 52 | Nashik | 1-step | NA | CVS | |
| 53 | Naya Raipur | Tier II | 1-step | NA | ARV |
| 54 | New Delhi | Tier I | 2-step | Residential tax rate: Ranges from 7% to 12% within locality (A-H). Commercial tax rate: Typically 20% across categories |
UAV |
| 55 | New Town Kolkata | Tier I | 2-step | A per cent (a = 15% for residential properties and IT/ITES a = 20% for other non-residential properties) | UAV |
| 56 | Panaji | Tier II | 2-step | Gross annual value (GAV) = annual rental value (ARV) × 1.5 Net annual value (NAV) = GAV − (30% GAV) Property tax = NAV × applicable rate based on location |
ARV |
| 57 | Pasighat | Tier III | 1-step | NA | ARV |
| 58 | Pune | Tier I | 2-step | A per cent rate of tax | CVS |
| 59 | Raipur | Tier II | 1-step | NA | ARV |
| 60 | Rajkot | Tier II | 1-step | NA | ARV |
| 61 | Ranchi | Tier II | 2-step | 2% of ARV | ARV |
| 62 | Rourkela | Tier II | 2-step | 20.5% of ARV | CVS |
| 63 | Sagar | Tier II | 2-step | 20% of ARV a per cent market rate 10% depreciation 8% library cess |
ARV/MRV |
| 64 | Saharanpur | Tier II | 1-step | NA | ARV |
| 65 | Satna | Tier II | 1-step | NA | ARV |
| 66 | Shillong | Tier II | 2-step | 25% of ARV | ARV/UAV |
| 67 | Shimla | Tier II | 2-step | The rate of the property tax for ARV method varied between 7.5% and 12.5% | ARV |
| 68 | Shivamogga | Tier II | 2-step | 20% on area + cess 24% of the property tax | UAV |
| 69 | Silvassa | Tier II | 1-step | NA | ARV |
| 70 | Solapur | Tier II | 2-step | 20% on area + cess 24% of the property tax | UAV |
| 71 | Srinagar | Tier II | 2-step | Taxable annual value (TAV) = MTF × LVF × ARF × FF × UTF ×CTF × AGF × SF × OSF, where MTF is the municipality type facto; LVF is the land value factor; ARF is the area factor; FF is the floor factor; UTF is the type of usage type factor; TF is the construction type factor; AGF is the age factor; F is the slab factor; OSF is the occupancy status. 5% of TAV for residential properties and 6% of TAV for non-residential |
ARV |
| 72 | Surat | Tier II | 1-step | NA | UAV |
| 73 | Thane | Tier II | 1-step | NA | CVS |
| 74 | Thanjavur | Tier II | 1-step | NA | ARV system/RVS |
| 75 | Thoothukudi | Tier II | 1-step | NA | ARV system/RVS |
| 76 | Tiruchirappalli | Tier II | 1-step | NA | ARV system/RVS |
| 77 | Tirunelveli | Tier II | 1-step | NA | ARV system/RVS |
| 78 | Tirupati | Tier II | 1-step | NA | ARV |
| 79 | Tirupur | Tier II | 1-step | NA | ARV system/RVS |
| 80 | Tumakuru | Tier II | 2-step | Rate on area = 20% Cess = 24% of the property tax |
UAV |
| 81 | Udaipur | Tier II | 1-step | NA | ARV |
| 82 | Ujjain | Tier II | 1-step | NA | CVS |
| 83 | Vadodara | Tier II | 1-step | NA | UAV |
| 84 | Varanasi | Tier II | 1-step | NA | ARV |
| 85 | Vellore | Tier II | 1-step | NA | ARV system/RVS |
| 86 | Visakhapatnam | Tier II | 1-step | NA | ARV |