
Abstract
This article examines the relationship between performance-based pay and widening wage inequality using data from the Employer Costs for Employee Compensation (ECEC). The results suggest that jobs using performance-based pay have made only a modest contribution to increased inequality during the 1994 to 2010 period. These results contrast with those reported by Lemieux, MacLeod, and Parent (2009), who investigated the relationship between performance-based pay and wage inequality using the Panel Study of Income Dynamics. They found that pay for performance accounted for about one-fifth of the growth in the variance of male wages between the late 1970s and the early 1990s, and for almost all of the increase in wage inequality in the top quintile during the same period.
Earnings inequality in the United States has been on the rise over the past three decades. Compensation inequality, while much less studied, has been moving upward as well (Pierce 2001, 2010). The character of the growth in pay dispersion has not been constant over time, however. In the 1980s, inequality widened throughout the entire distribution of earnings (Levy and Murnane 1992; Juhn, Murphy, and Pierce 1993). More recently, though, the overall growth in inequality has been less broad-based; it has been driven by a widening in the top half of the distribution, which has, if anything, been partly offset by a narrowing in the bottom half (Autor, Katz, and Kearney 2008; Lemieux 2010). While not directly comparable to the data used in most studies of inequality, income tax data suggest that the rise in inequality is even faster in the uppermost part of the top half of the distribution of income (Bakija, Cole, and Heim 2012; Piketty and Saez 2003, updated 2012). Motivated in part by an attempt to explain trends in the upper part of the distribution, Lemieux, MacLeod, and Parent (2009)—henceforth LMP—investigated the relationship between the use of performance pay schemes and wage inequality, using the Panel Study of Income Dynamics (PSID). Viewing such a contractual arrangement as a channel through which rising demand for skill is translated into increased inequality, they estimated that pay for performance accounts for about one-fifth of the growth in the variance of male wages between the late 1970s and the early 1990s, and for almost all of the increase in wage inequality in the top quintile during the same period.
In this article, we also look at the relationship between performance pay and inequality, making a number of new contributions to the literature. 1 First, the data set we use, the Bureau of Labor Statistics’ quarterly Employer Costs for Employee Compensation (ECEC), allows us to look at a broader concept of pay than was used by LMP, which consisted largely of hourly earnings inclusive of performance pay (bonuses, piece-rates, and commissions). Using the ECEC, we can obtain a similar measure, which, for reasons of brevity, we will refer to as a wage rate, as well as a much broader measure of compensation, which includes non-wage benefits, which we call total compensation. Total compensation reflects actual willingness to pay on the part of companies and, at least in simple competitive theories, equals the value of marginal product. In addition, as Barkume (2004) suggested in a similar context, it is important to relate methods of pay to total compensation because any effects noted on wages may be offset or amplified when one moves to broader definitions of compensation.
Second, the types of bonuses are numerous, not all of which fall under the rubric of pay for performance, and we are able to distinguish among them in some of our analyses. Third, while the LMP analysis ends in the mid-1990s, our investigation is of a more recent time period, 1994 to 2010.
Data: Employer Costs for Employee Compensation
We conduct the analysis using the quarterly microdata from the ECEC, which is part of the National Compensation Survey (NCS). The ECEC measures the cost to employers for wages and salaries and benefits per employee hour worked. 2 As suggested above, it has a number of advantages for our analysis, including the presence of a large representative sample, the availability of information that allows us to construct measures of performance pay, and the measurement not only of wage rates but of a comprehensive measure of compensation. While the ECEC has been conducted since the 1980s, the information we need to construct measures of performance pay is only readily available from 1994 on. The ECEC data have not been used previously to study the relationship between performance pay and pay inequality, 3 but they have been used to study the two topics independently. 4
The ECEC includes establishments with one or more workers in private industry and in state and local government. Excluded from the private industry sample are the self-employed, farm and private household workers, as well as those who set their own pay. For the purposes of this article, we focus on private industry, given that, as LMP indicated, in the absence of profit maximization, it is not always clear what pay for performance might mean. The ECEC sample is a probability sample of establishments (not firms). Jobs are sampled proportional to employment in the job, but, when weighted, the data represent the average worker and not the average job. 5 The number of jobs selected generally ranges from four to eight depending on establishment size. In contrast to the case of the microdata traditionally used in analyses of pay inequality, the unit of analysis is a job rather than an individual.
Jobs are defined using the employer’s most narrow occupational classification. Job-specific information includes a Standard Occupational Classification (SOC) code 6 along with indicators for union coverage, full-time status, and whether the pay is tied, at least in part, to commissions, piece rates, production bonuses, or other incentives based on production or sales (incentive pay). The jobs are also assigned a work level, which is an index constructed on the basis of several ordinal factors describing job duties. Of these underlying factors, Knowledge is the most important and is meant to capture skills related to schooling, training, and experience. Job controls and complexity covers the amount and type of direction received and the complexity of work. Contacts involves the nature and purpose of contacts within a job but outside the supervisory chain. Physical environment covers the nature of risk and the amount of physical demand in a job. The variables collected in this process are useful proxies for skill differences across jobs (Gittleman and Pierce 2011, 2012). 7
In the ECEC, earnings are defined to include incentive pay but to exclude premium pay for overtime, holiday, and weekend work; shift differentials; bonuses not directly tied to production; payments by third parties such as tips; and payment in kind such as room and board. Premium pay for work in addition to regularly scheduled work, shift differentials, and nonproduction bonuses (to be explained below) are measured as benefits. The ECEC also measures the following types of benefits: paid leave, such as vacations, holidays, sick leave, and personal leave; insurance benefits, such as life, health, short-term disability, and long-term disability; retirement and savings benefits, such as defined benefit and defined contribution plans; and legally required benefits, such as Social Security, Medicare, Federal and State unemployment insurance, and workers’ compensation. 8 The ECEC data are converted to a cost per hour worked using work schedule information common to all workers and averaged over the incumbents within a job.
As is detailed in Pierce (2010), the following caveats can be kept in mind when considering these data. First, as the name implies, the data refer to employer costs, which will differ from employee valuations due to a number of considerations including taxes, that the same benefits are being provided to a large group, and divergences between an employer’s price for a benefit and what an employee would have to pay as an individual (Famulari and Manser 1989). Second, a certain amount of measurement error is involved in getting job-specific data for some of the components of the ECEC; for example, because respondents are sometimes able to report data only for a broader group than the job incumbents (such as the average for all white-collar workers or for all workers). Third, though we can use work level and other variables as predictors of wages, we do not have demographic information on the incumbents of the job. As a result, we implicitly consider men’s and women’s jobs together, something that is not usually done in the inequality literature; we discuss this point later in the article.
A fourth caveat, one worth discussing at length for a study of this type, is that because the unit of observation is the job, our pay measures are job-level averages. As noted above, a job is defined along a number of different dimensions: the establishment’s most narrow occupational classification, work level, union coverage, full-time status, and incentive-pay status. Definitionally, all incumbents in a given job must be identical along these five dimensions, serving to reduce within-job pay variation. For the wage concept we use and for compensation, we cannot gauge how much within-job dispersion we are missing. For instance, individuals in the same job, particularly if they are in different family situations or are of different ages, may have important differences with respect to health and pension benefits. They may also receive different bonus amounts.
The NCS in recent years collects rates for all individuals in the job for a narrower conception of wages than we use. For this narrower measure (wages including incentive pay, but excluding non-production bonuses, premium pay, and shift differentials), only about 2% of all private-sector wage variation is within-job. Calculations using this within-job variation suggest we are missing little by not taking account of within-job dispersion in incentive and base pay. We have no evidence, however, of the importance of within-job variation in non-production bonuses (or benefit costs), and this remains an important caveat to our findings.
Before turning to a discussion of the definition of pay for performance in the ECEC, it may be worthwhile to say a bit more about the scope of the ECEC. The continuing work of Piketty and Saez (2003, updated 2012) and others using IRS tax return data has focused attention on the increased share of income going to the top percentile and fractions thereof. The ECEC data that we will present are not comparable with these data for a number of reasons. First, the IRS data include self-employment income, while the ECEC reports the cash and non-cash compensation of wage and salaried workers. Second, realized capital gains, for example, from employees cashing in stock options, are not included in the ECEC, while they are in many calculations using the IRS data. Third, the ECEC excludes corporate officers and those who set their own pay; for example, top management and owners of closely held businesses are not in the ECEC’s scope. The breakdown of the top percentile in tax return data contained in Bakija, Cole, and Heim (2012) shows that nearly one-third are executives, managers, or supervisors, many of whom are in closely held businesses. The ECEC does, however, capture bonuses going to its sample of wage and salaried employees, so that bonuses going to the financial sector (Bishow 2010), for example, can be tracked.
ECEC data collection to some extent dictates how we designate jobs as pay for performance in this study. If either of two conditions holds, we consider the job to be a performance-pay job. First, if pay is tied, at least in part, to commissions, piece rates, production bonuses, or other incentives based on production or sales, we consider the job to be a performance-pay job. Such jobs are referred to as incentive-pay jobs (Barkume and Moehrle 2001). 9 Second, if the job has a non-production bonus we consider a job to be a performance-pay job. ECEC non-production bonuses include (despite the label) a number of different payment schemes that seek to better align pay and productivity. The NCS places non-production bonuses into five different categories: employment-incentive awards, performance-based awards, recognition awards, union-related bonuses, and a catch-all category called “other.” Details on non-production bonuses are offered in the Appendix.
The most appropriate measure of performance pay would take into account whether a job is eligible to receive such pay, independent of whether such pay is received in a given time frame. The NCS definition of incentive-pay jobs satisfies this criterion, so all those in such jobs are regarded as pay for performance. Now consider non-production bonus programs. Assuming that all such programs are designed to better align pay and productivity, an assumption that we will return to, and assuming that the mere presence of a plan is sufficient to influence such things as the degree of monitoring, straight-time wages, and promotions, we would want to also count as pay for performance all jobs in which a non-production bonus program is in place. We do not know whether a program is in place for parts of the sample and, as a result, we base our main definition, instead, on whether job incumbents receive a bonus payment. 10 We recognize that this approach—using costs instead of plan presence—puts us at some risk for understating pay-for-performance incidence, but any understatement of performance pay that results is lessened by the fact that the non-production bonus amounts are job-wide averages. Thus, if any individual in a job receives a non-production bonus, all incumbents are considered to be in a performance-pay job. In addition, some non-production bonuses are smoothed over time, so that if a bonus is annual, for example, a year-end bonus, NCS procedures indicate receipt over four quarters. 11
The period of analysis in this study is from 1994, the first year in which data on incentive-pay jobs are readily available, to 2010, the latest year for which data were available at the time the analysis began. Because of breaks in series and changing availability of data, we also repeat some of the analysis for the mid-year, 2002. For example, as occupations were dual coded in 2002, it is possible to compare 1994 to 2002 and 2002 to 2010, but 1994 cannot be compared directly to 2010. In addition, data on work level are available only from 2002 forward. As noted, up to this point, we are assuming that all non-production bonus programs fall under the rubric of pay for performance. Some, however, clearly do not, such as payments in lieu of benefits, while others fall into a gray area. In most of our analyses, our definition of pay-for-performance jobs is one that includes all incentive-pay jobs and all jobs for which non-production bonuses are paid. 12 For 2010, it is possible to consider a second definition that includes all incentive-pay jobs and only the non-production bonus jobs where performance-based bonuses are received, as opposed to the other types of non-production bonuses. Unfortunately, only in very recent years is information on non-production bonus types available for all establishments in the sample, so using the second definition for 1994 and 2002 is not possible.
The Prevalence of Pay for Performance
As LMP noted, in the standard competitive model, the entire labor market is aware of a worker’s marginal product, and competition ensures that workers are paid their marginal product. In the real world, however, circumstances such as uncertainty about a worker’s ability and the dependence of effort on wage levels may provide scope for pay-for-performance schemes, which we are loosely defining as any attempt to better align pay with productivity. According to the theory and some empirical evidence, 13 firms will use piece rates and other pay-for-performance schemes to elicit higher levels of effort and/or attract more productive workers. Such schemes cannot be used everywhere, however, in part because of the presence of costs of monitoring output. LMP’s theoretical model, based on Lazear (1986), has among its implications that more productive workers will be paid for performance and that increases in returns to ability will enhance the attractiveness of pay for performance.
We begin by assessing the prevalence of pay for performance in the private economy in 2010. As noted in the previous section, we use two definitions of pay-for-performance jobs: the first one includes all incentive-pay jobs and all jobs in which non-production bonuses are paid, and the second one includes all incentive-pay jobs and jobs in which the non-production bonuses received are performance-based awards. 14 Since some bonuses may be only weakly performance-related (for example, if a bonus is received in lieu of a benefit payment, or for referring a worker to the company), an examination of the sensitivity of the results to the definition is warranted. 15 The main types of bonuses excluded in the second definition are those in the employment incentive (hiring, referral, and retention) and the recognition (attendance, longevity, etc.) categories.
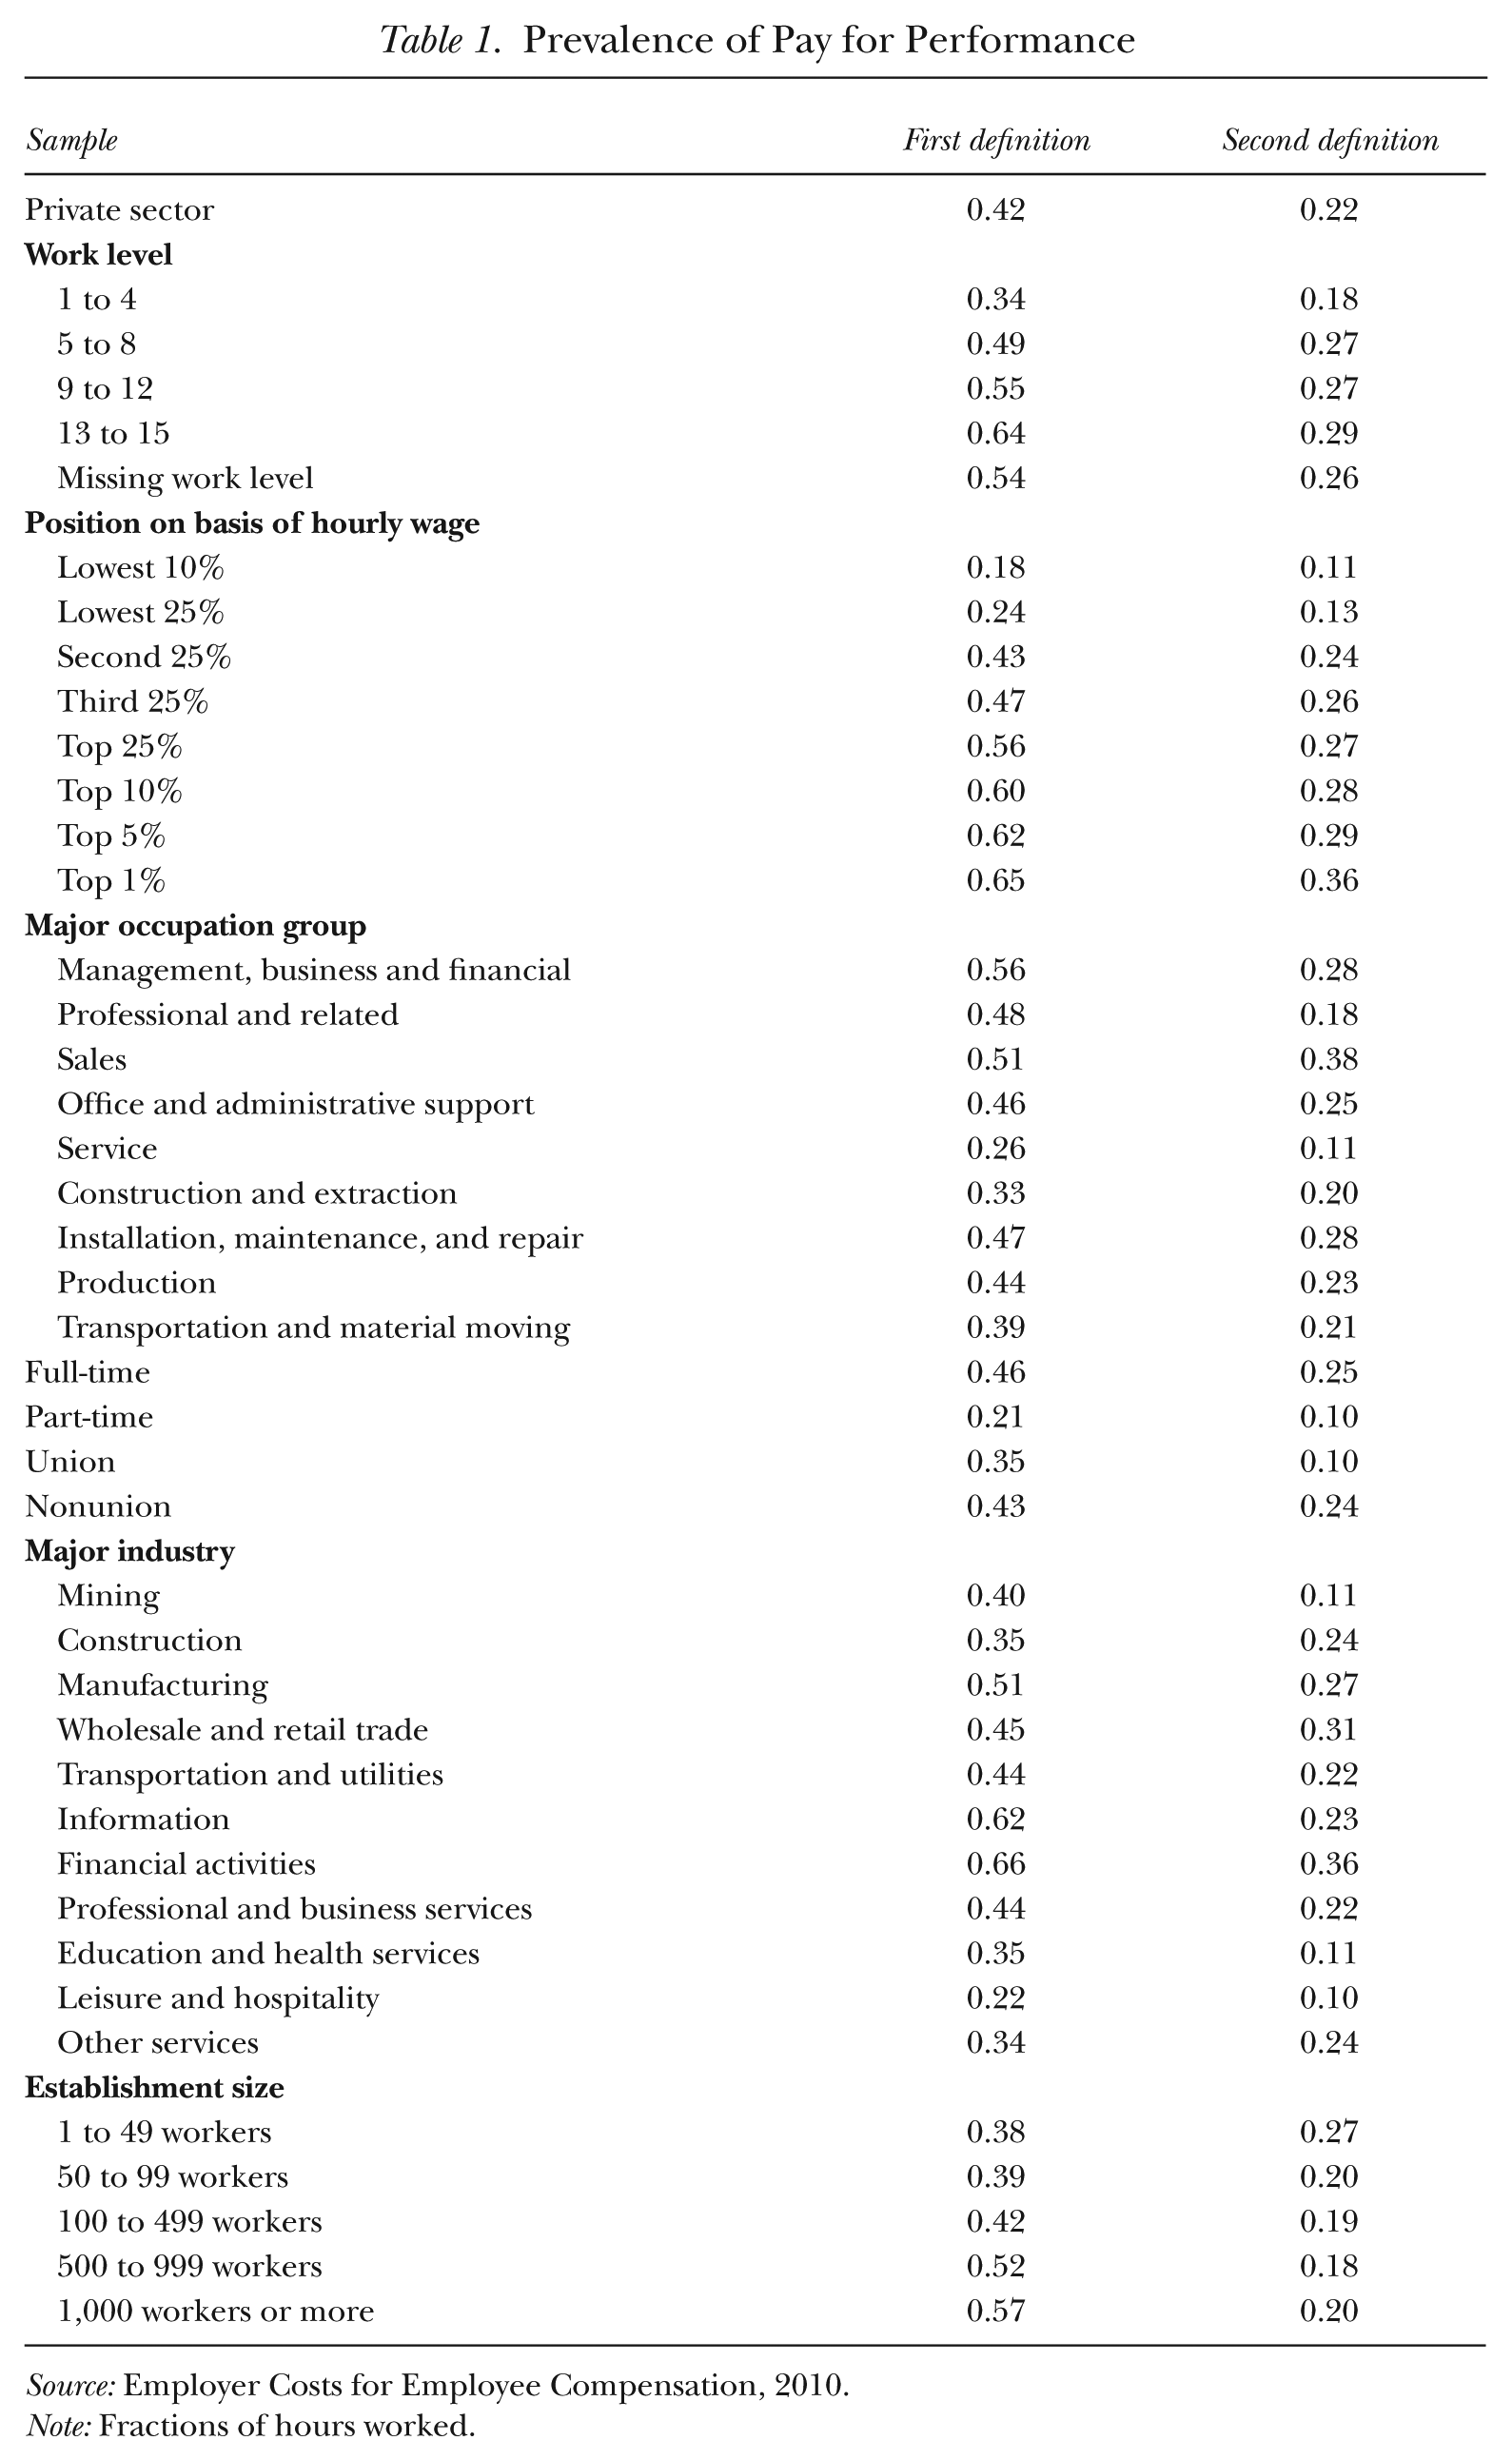
Table 1 shows how prevalent pay for performance is, for the private sector as a whole and by various worker and establishment characteristics. In 2010, the share of all hours in pay-for-performance jobs, as measured by the first definition, was 0.42, nearly double that by the more restrictive definition. How does prevalence vary with skill, as represented by work level groups? 16 By the first definition, the incidence rate climbs steadily as work level rises, with the highest work level group having a rate nearly double that of the bottom. The situation is different with the second definition, however, as the prevalence levels off after a steep increase from the bottom to second work level group. The difference under the two definitions suggests that many at the top work levels are receiving non-production bonuses that are not performance-based awards, but instead are bonuses of a different nature.
Prevalence of Pay for Performance
Source: Employer Costs for Employee Compensation, 2010.
Note: Fractions of hours worked.
The proportion of performance-pay hours rises with the wage rate, though the slopes of the curves are, once again, somewhat different across the two definitions. Both, however, show evidence of a strong rise in the top quartile: under the first definition, the incidence rate for the whole top quartile is 0.56, but that for the top 1% is 0.65, while under the second designation, the comparable figures are 0.27 and 0.36.
As measured by the first definition, the rate of incidence by major occupation ranged from 0.56 for management, business, and financial occupations to 0.26 for service occupations. While service occupations have the lowest incidence (0.11) under the second definition as well, sales have the highest incidence (0.38), owing to the use of commissions in cases when it is relatively straightforward to measure performance through the level of sales. Not surprisingly, pay for performance tends to be much more widespread among full-time employees than among part-timers, while, consistent with the results in LMP, such schemes are more common for nonunion employees than for union ones. According to Freeman (1982), unions prefer standard payment systems because a sense of solidarity is built by having all workers in the same job paid at the same rate and because they seek to avoid supervisory arbitrariness.
Irrespective of definition, pay for performance is most common in financial activities, and least common among leisure and hospitality. The situation is less consistent by size of establishment, however. Under the first definition, larger establishments (500 or more employees) are more likely than their smaller counterparts to have pay-for-performance schemes, but, under the second definition, it is the smallest establishments (fewer than 50 employees) that have the highest incidence rates.
Figure 1 plots a time series of the prevalence of performance-pay jobs, under the first definition, for 1994 through 2010. The incidence rate climbs steadily through 2001, before beginning a descent that left it below its starting point in 1994. These changes appear substantial to us, but they are smaller than the 2010 difference between our two definitions. The up-and-down movement in incidence contrasts with the steady rise in performance-pay jobs noted by LMP between the late 1970s and the early 1990s. Under their preferred definition, the overall incidence climbed from about 0.38 to 0.45 over this span, a rise they attribute to two factors: 1) a lowering of the costs of monitoring output coming about from innovations in information and communication technologies; and 2) shifts in demand in the direction of more skilled workers that raise the benefits of the use of pay-for-performance schemes without necessarily having a change in monitoring costs. Unless these two factors have moved in the opposite direction in the past decade, other forces must be at work. Candidates include cyclical factors related to the deep recession at the end of the period and compositional shifts. 17 We found, in analysis not shown, that shifts in the industrial and occupational composition of the economy do not seem to have played an important role, as the decline in performance-pay incidence occurred within, rather than between, industries and occupations.
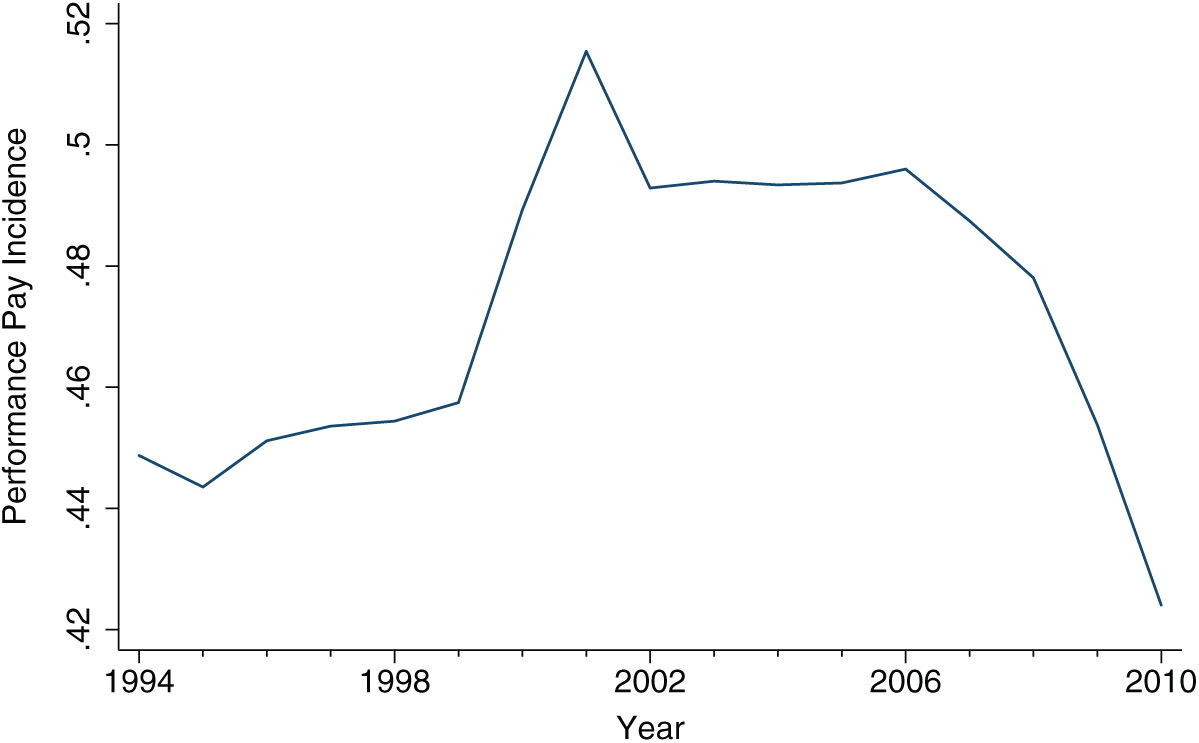
Prevalence of Performance Pay Jobs
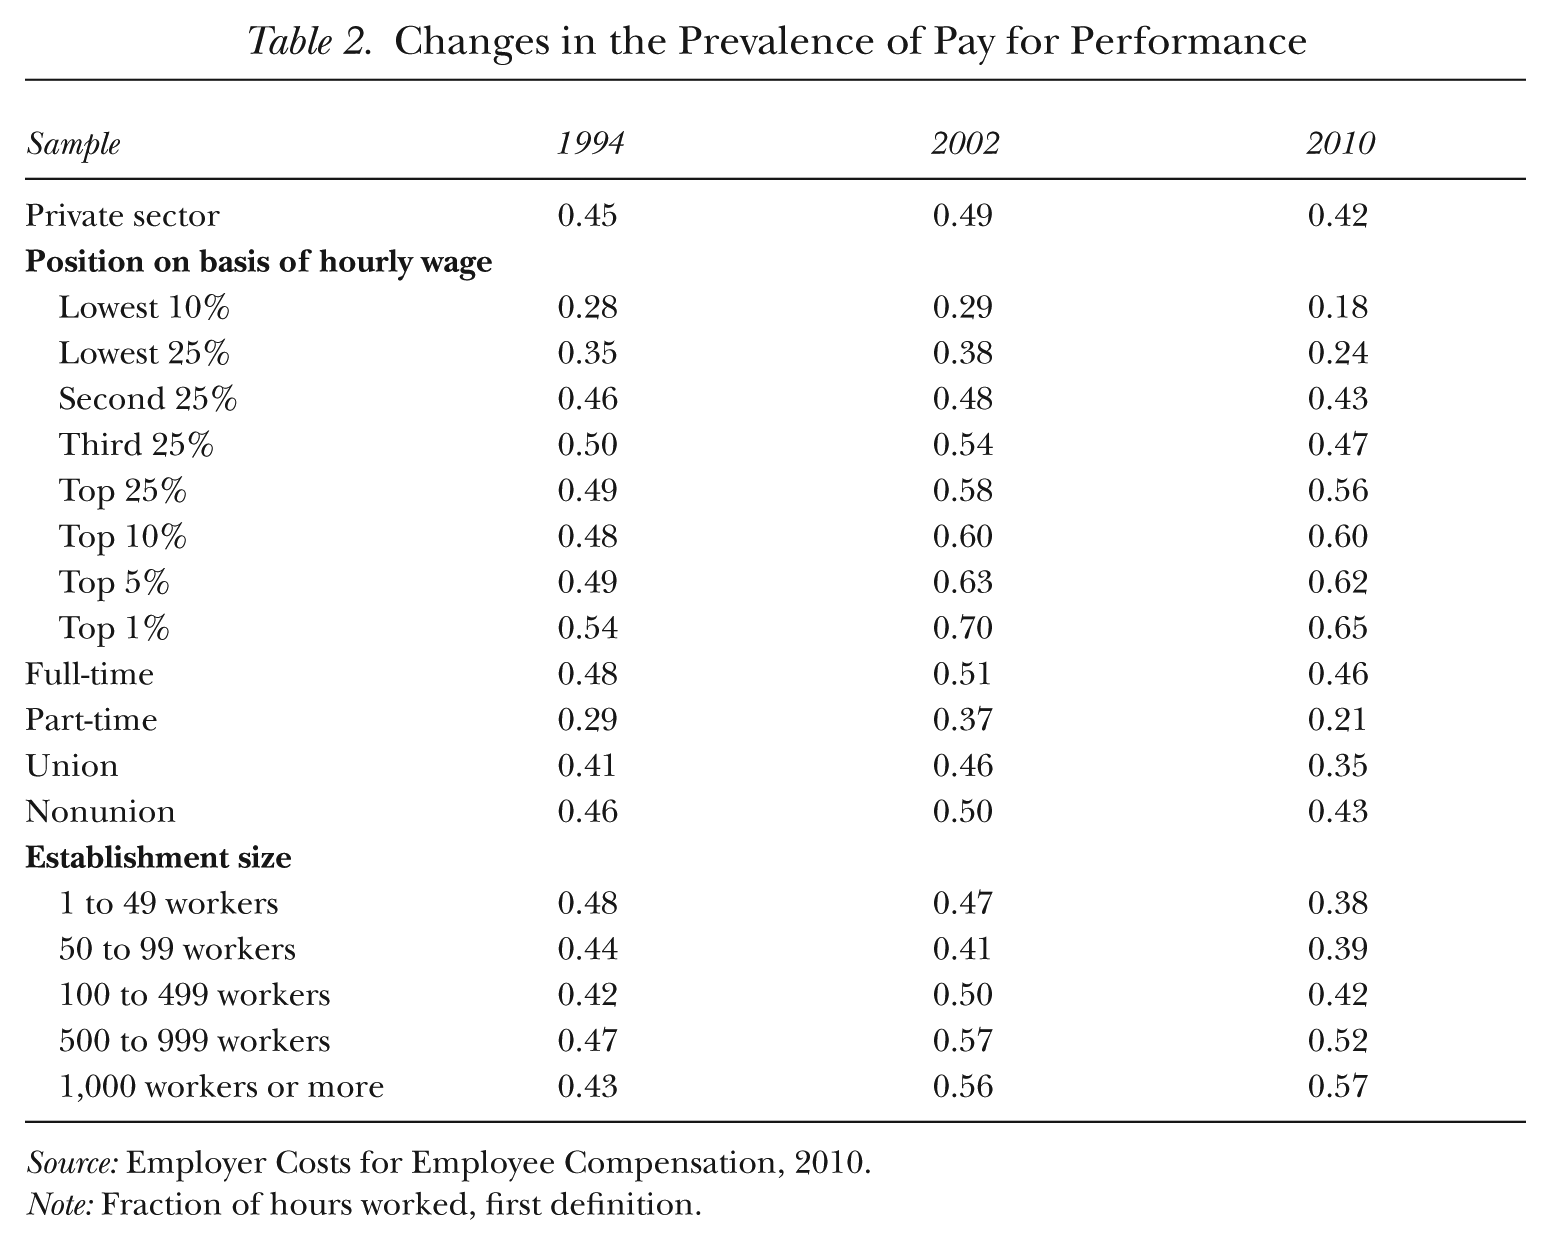
In Table 2, we examine changes in the prevalence of pay for performance across the years used in the pay and inequality analysis that follows: 1994, 2002, and 2010. We are forced to confine our attention to the first definition of pay for performance because data on non-production bonus types for the whole sample are available for only very recent years. Using this definition, the prevalence rose from 0.45 in 1994 to 0.49 in 2002 before tumbling to the 0.42 already noted in 2010.
Changes in the Prevalence of Pay for Performance
Source: Employer Costs for Employee Compensation, 2010.
Note: Fraction of hours worked, first definition.
A glance at Table 2 suggests, however, that the overall trends in prevalence are masking important relative shifts in incidence, particularly with respect to position in the wage distribution. Those in the bottom quartile of the distribution saw their relative incidence rates steadily erode during the period, while those in the top quartile, particularly those in the top decile, saw marked increases. These shifts will be important to keep in mind when we assess the effects of performance pay on changes in the distribution of compensation. Other notable changes are that performance pay became increasingly concentrated among full-timers and among larger establishments.
Performance Pay and the Wage Structure
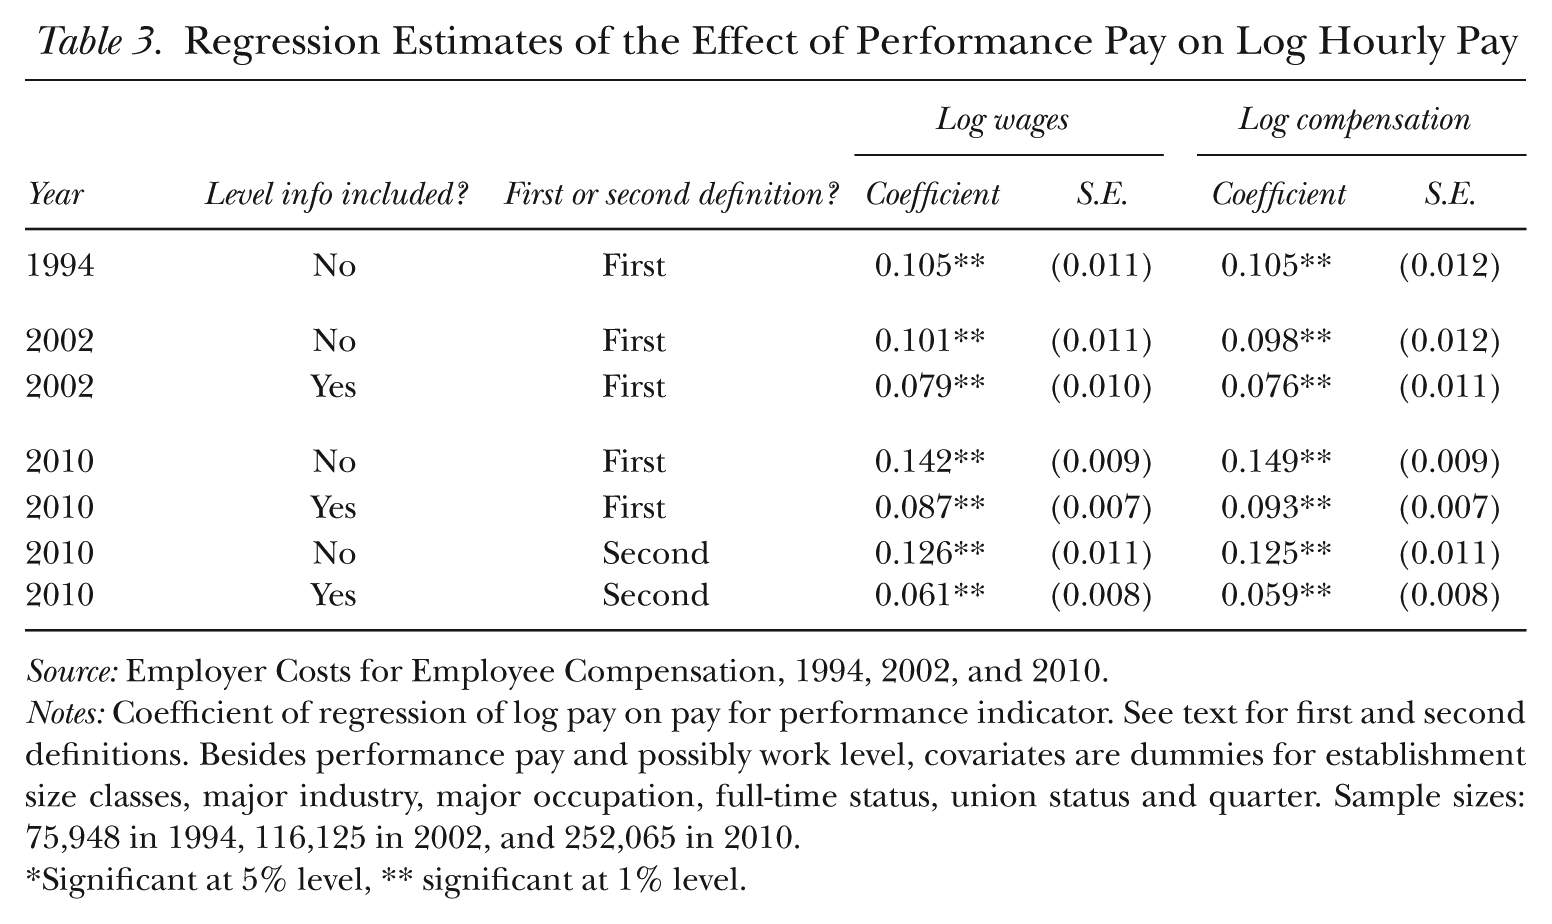
As a precursor to our examination of the connection between performance pay and inequality in the next section, we now measure pay differentials by performance-pay status. These differentials are displayed in Table 3 and have been estimated by regressing the log of wages or compensation on an indicator of pay for performance, along with controls for establishment size, major industry, major occupation, full-time status, union status, and quarter. In addition, for 2002 and 2010, when work level controls are available, regressions are run with and without these controls. The inclusion of such controls allows a better isolation of the impact of pay for performance, while excluding such controls facilitates comparisons over a longer time span.
Regression Estimates of the Effect of Performance Pay on Log Hourly Pay
Source: Employer Costs for Employee Compensation, 1994, 2002, and 2010.
Notes: Coefficient of regression of log pay on pay for performance indicator. See text for first and second definitions. Besides performance pay and possibly work level, covariates are dummies for establishment size classes, major industry, major occupation, full-time status, union status and quarter. Sample sizes: 75,948 in 1994, 116,125 in 2002, and 252,065 in 2010.
Significant at 5% level, ** significant at 1% level.
Starting with 1994, we see that, all else equal, wages are higher in pay-for-performance jobs by 0.105 log points, consistent with sorting that leads to higher-ability workers in pay-for-performance jobs, as well as with such workers providing higher levels of effort. 18 Note that the inclusion of non-wage benefits into the measure of pay has virtually no impact on this result, as the coefficient in the total compensation regression is almost the same. Thus, it does not appear that increased pay for performance is offset by components of non-wage compensation. For 2002, a regression of the same form, that is, without work levels, generates quite similar point estimates to those from the corresponding regression for 1994. Some of the return to performance pay is probably attributable to sorting on skill, as the coefficient declines by about one-fifth, to 0.08 log points, when work levels are included.
Consistent with the growing relative incidence of pay for performance at the upper end of the distribution, in 2010, in regressions without work level, the return to performance pay is up by more than two-fifths over 2002 for both wages and compensation. When work levels are controlled for, however, the increase is much smaller. Finally, we also examine returns to the second measure of pay for performance, which could be higher or lower, depending on the location in the pay distribution of those who have pay-for-performance jobs under the first regime but not the second one. The return to performance pay using the second definition is lower, particularly when work level controls are included. The finding that the differential for pay for performance is greater under the first definition, particularly when work level, a proxy for productivity, is included, suggests that at least some of that differential may be the result of the introduction of (possibly additional) bonus programs among already highly paid workers.
Performance Pay and Inequality
In this section, we examine the relationship between pay for performance and the level of and changes in wage and compensation inequality, in which pay for performance is measured both in terms of the first and second definitions. We would expect performance pay to tend to increase the level of inequality at a firm at a given point in time. In the simplest case, one could have one type of job and all workers of an uncertain ability paid a fixed wage. A switch to pay for performance would clearly increase dispersion as pay becomes better aligned with productivity. The overall impact on inequality is harder to assess, as it depends on where in the distribution the pay-for-performance workers are located. As LMP pointed out, the situation is similar to the relationship between labor unions and inequality, that is, unions tend to reduce the dispersion among unionized workers but may increase inequality relative to nonunion workers. To be clearer, the point is not that performance pay and unions have a similar impact on inequality, but that one needs additional information to move from incidence rates of performance pay and performance-pay differentials to estimates of performance pay’s impact of inequality, such as the location in the distribution of those receiving pay for performance.
To obtain this additional information to assess the relationship between performance pay and inequality, we use the reweighting approach of DiNardo, Fortin, and Lemieux (1996) and compute estimates of what distributions would look like if performance-pay jobs were not present, or, in other words, if all jobs were paid as if they were non-performance-pay jobs. As elaborated in LMP, we can calculate the counterfactual distribution of pay that would prevail in this case by reweighting all non-performance-pay observations using a factor that, for any given observation, is the ratio of the share of non-performance-pay jobs to the probability that the observation is non-performance pay given its characteristics. The numerator is constant across observations. We estimate the denominator, the conditional probability of being non-performance pay, by running a logit for the probability of being paid for performance as a function of observable characteristics. 19 Those groups that are underrepresented among non-performance jobs will have a lower denominator and thus will have a larger reweighting factor so that they will not be underrepresented in the counterfactual distribution.
Before turning to this section’s results, it may be useful to situate the level of inequality and its trend in the ECEC within the context of the patterns of the more familiar Current Population Survey (CPS). We restrict the CPS samples to a scope similar to that in the ECEC for the private sector. In Appendix Table A.1, we present calculations both from the Outgoing Rotation Groups (ORG) in the CPS and from the March CPS, as the former is thought to provide better hourly wage measurement while the latter includes performance pay in its annual earnings. The table shows the 90-10, 50-10, 90-50, and 95-90 percentile wage gaps for 1994 and 2010 for the ECEC and the CPS. 20 These values are measured by the log of the ratio of the two relevant percentiles. Comparing the statistics for the ECEC, which cannot be separated by sex, with those for the CPS for both men and women combined (“All”), we see some similarities and some differences. Though the exact magnitudes differ, the ECEC and the two CPS “All” data sets show a widening of the 90-10 gap that is the result of an expansion of the 90-50 gap more than offsetting the narrowing of the 50-10 gap. In the upper tail, however, as measured by the change in the 95-90 wage gaps, both the ECEC and the CPS-ORG show a widening, while the March CPS shows a narrowing.
To see how wage inequality in the ECEC compares with compensation inequality in the same source, we display them, in Figures 2 and 3, respectively, for the 1994 to 2010 period. The figures show the relevant percentile gaps, as measured relative to their 1994 values, which are set to zero. A rising plot indicates an increase in dispersion. While the patterns are not identical, one can discern in both series the following: 1) a widening of the 90-50 percentile gap; 2) a narrowing of the 50-10 percentile gap; and 3) a resulting mild increase in the 90-10 percentile gap.
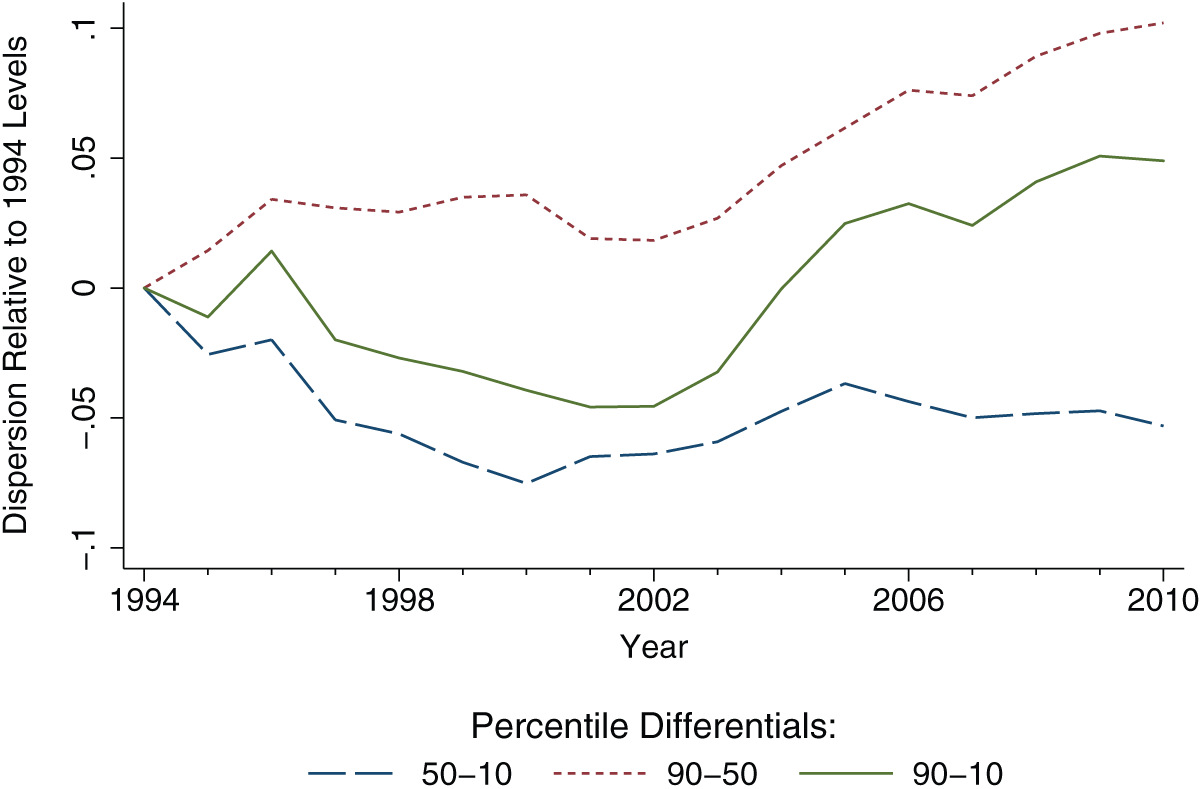
Growth in Log Wage Dispersion
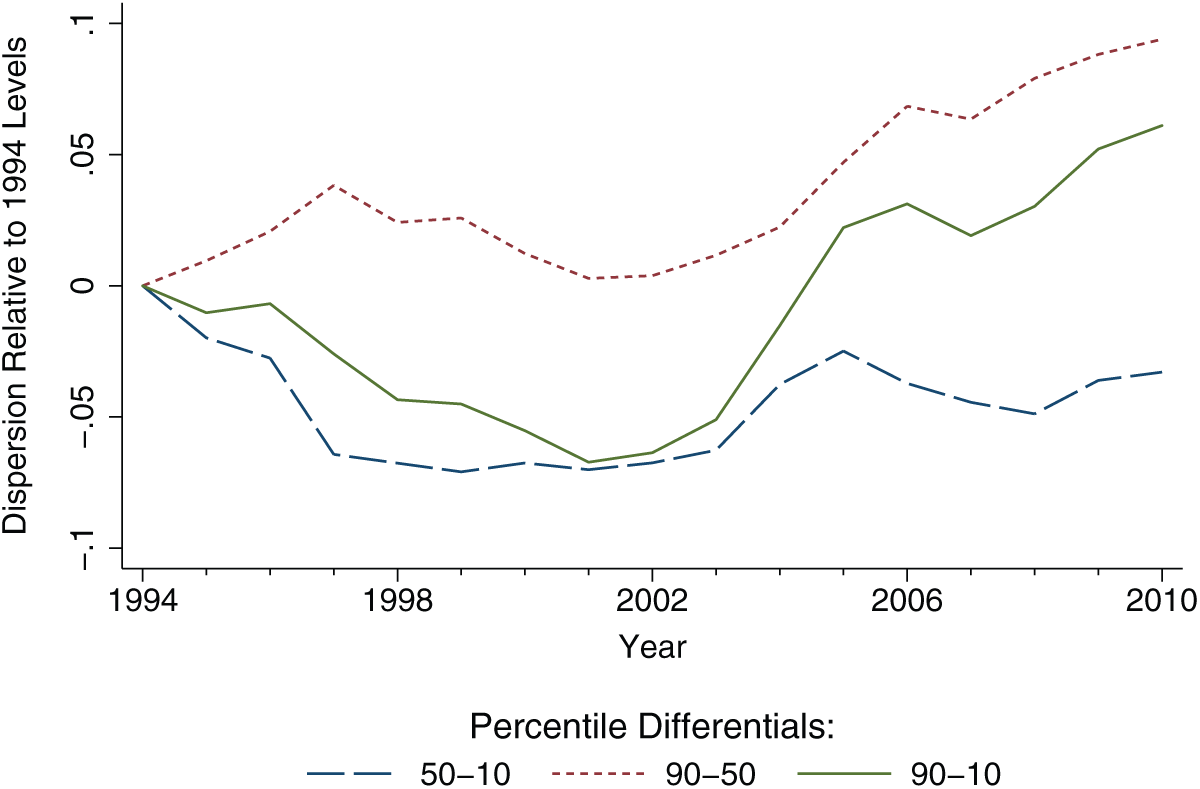
Growth in Log Compensation Dispersion
We begin our examination of the relationship between performance pay and the wage distribution for 2010 using the first definition of the former. We can see by the counterfactual distribution, which has a lower variance, that the presence of pay-for-performance jobs tends to widen inequality, but its overall effects are relatively mild. The 0.019 difference in overall variance (Table 4) represents a reduction in dispersion on the order of 5%. What effects there are tend to be concentrated at the top of the distribution. The effect of performance-pay jobs is to widen the 90-10 difference by 0.035 log points, but the 99-90 gap is increased by 0.039 log points.
Reweighting Estimate of the Effect of Pay for Performance Jobs on Measures of the Distribution of Pay, 2010
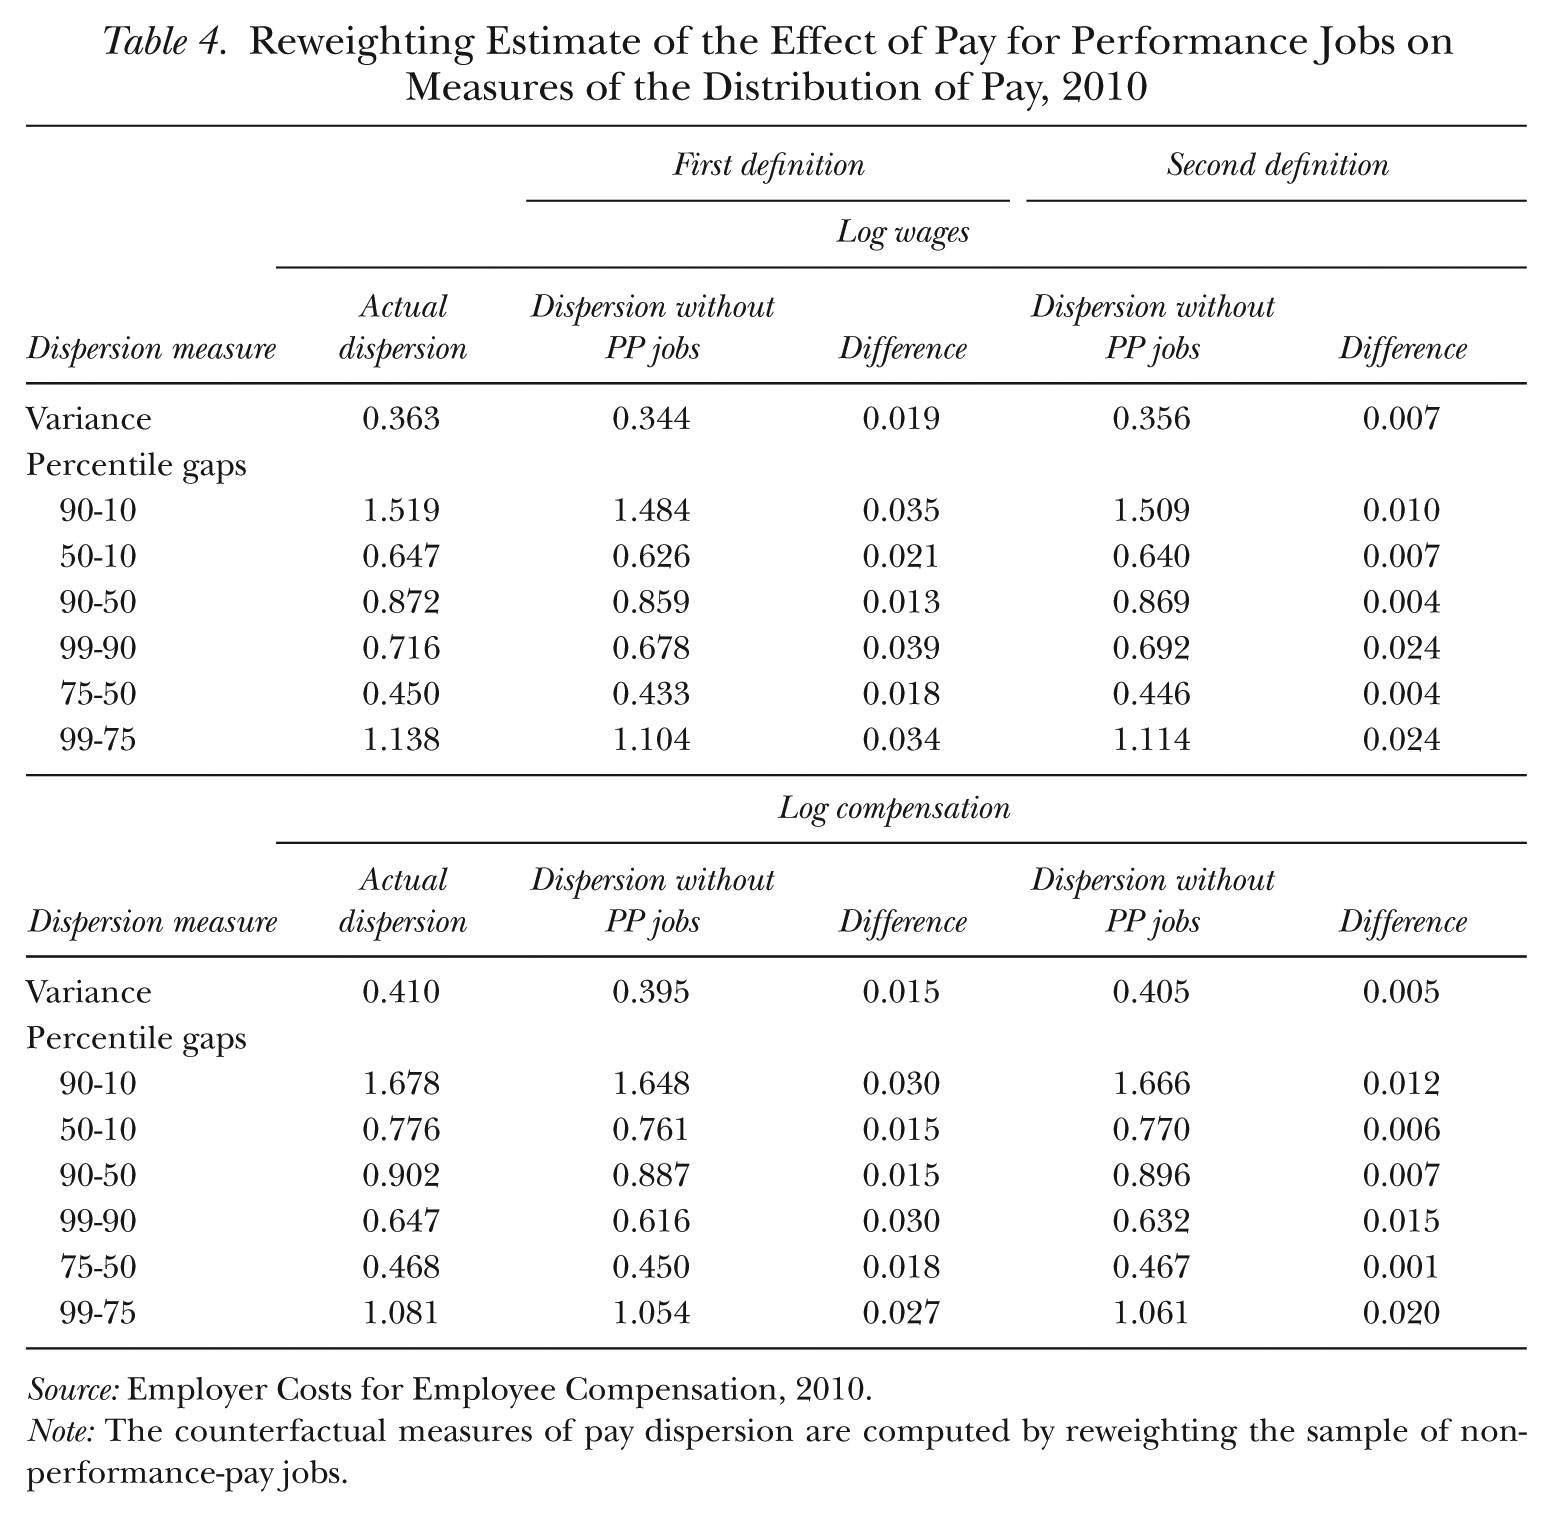
Source: Employer Costs for Employee Compensation, 2010.
Note: The counterfactual measures of pay dispersion are computed by reweighting the sample of non-performance-pay jobs.
We now consider the impacts of performance-pay jobs on total compensation, shown in the second panel of Table 4. The effects could be greater or lesser, depending on whether the non-wage components are magnifying or offsetting. In this case, we find a slightly offsetting effect. The impact of pay for performance is to increase overall variance by 4% instead of 5%. The general pattern of other effects tends to be the same as for wages, just somewhat smaller.
Under the second definition of performance pay, the effects on inequality could be greater or smaller than under the first definition, as the impacts depend not just on incidence but on how the performance-pay jobs are spread throughout the distribution. As it turns out, the effects of performance-pay jobs are more muted for the second than for the first definition, both for wages and compensation, though the effects that are present are still concentrated toward the upper part of the distribution. This result is consistent with that from Table 3, for which pay-for-performance differentials were smaller using the second definition.
What would the trends in inequality noted at the start of this section have been like if not for the presence of performance-pay jobs? Unfortunately, for the rest of the article, the lack of availability of bonus types over time forces us to restrict the analysis to the first definition. 21 As LMP discussed in detail, pay-for-performance jobs can affect trends in inequality in two ways. One is through changes in the proportion of jobs that are pay for performance and the other is through fluctuations in the inequality-enhancing effect of performance-pay jobs over time. These two channels have different implications for what might be driving changes in inequality. In the first case, it may be that an exogenous change, for example a reduction in the costs of monitoring output, has led to increased use of performance pay. In the second case, underlying shifts in demand toward more skilled workers, coming about from technical change and globalization, lead both to wider inequality and to increased use of performance-pay schemes. In this case, it is the relative demand shift in favor of more skilled workers that is the real cause, and performance pay is an important channel through which the demand shifts are transmitted. LMP concluded that, in their results, most of the impact of performance pay on wage inequality was attributable to the fact that returns to observable skills increased faster in performance-pay jobs than in non-performance-pay jobs, which is consistent with the second channel. While distinguishing between these two scenarios is not an easy task, it will be of interest in the present examination to see what can be learned from comparing our two subperiods, given that prevalence of performance pay moved upward in one and sharply downward in the other.
We now turn to Table 5, which summarizes the results of an analysis of the 2002 to 2010 period. During this time, the overall inequality of wages, as measured by the log variance, increased to 0.363 from 0.331, a rise of about 10%. When we look at the change in the 90-50 (0.083 log points) and 50-10 percentile log differences (0.011 points), it is clear that virtually all the increase in inequality was occurring in the top half of the distribution, consistent with what has been found with CPS-based studies. To calculate the contribution of performance pay to wage inequality, we first use reweighting to estimate what the variance and percentile log differences would look like in the absence of pay-for-performance jobs for each year. Calculating that change and dividing it by the actual change yields the percentage of change explained by the performance-pay jobs in the final column.
Reweighting Estimate of the Effect of Pay for Performance Jobs on Measures of the Distribution of Pay, 2002–2010, First Definition
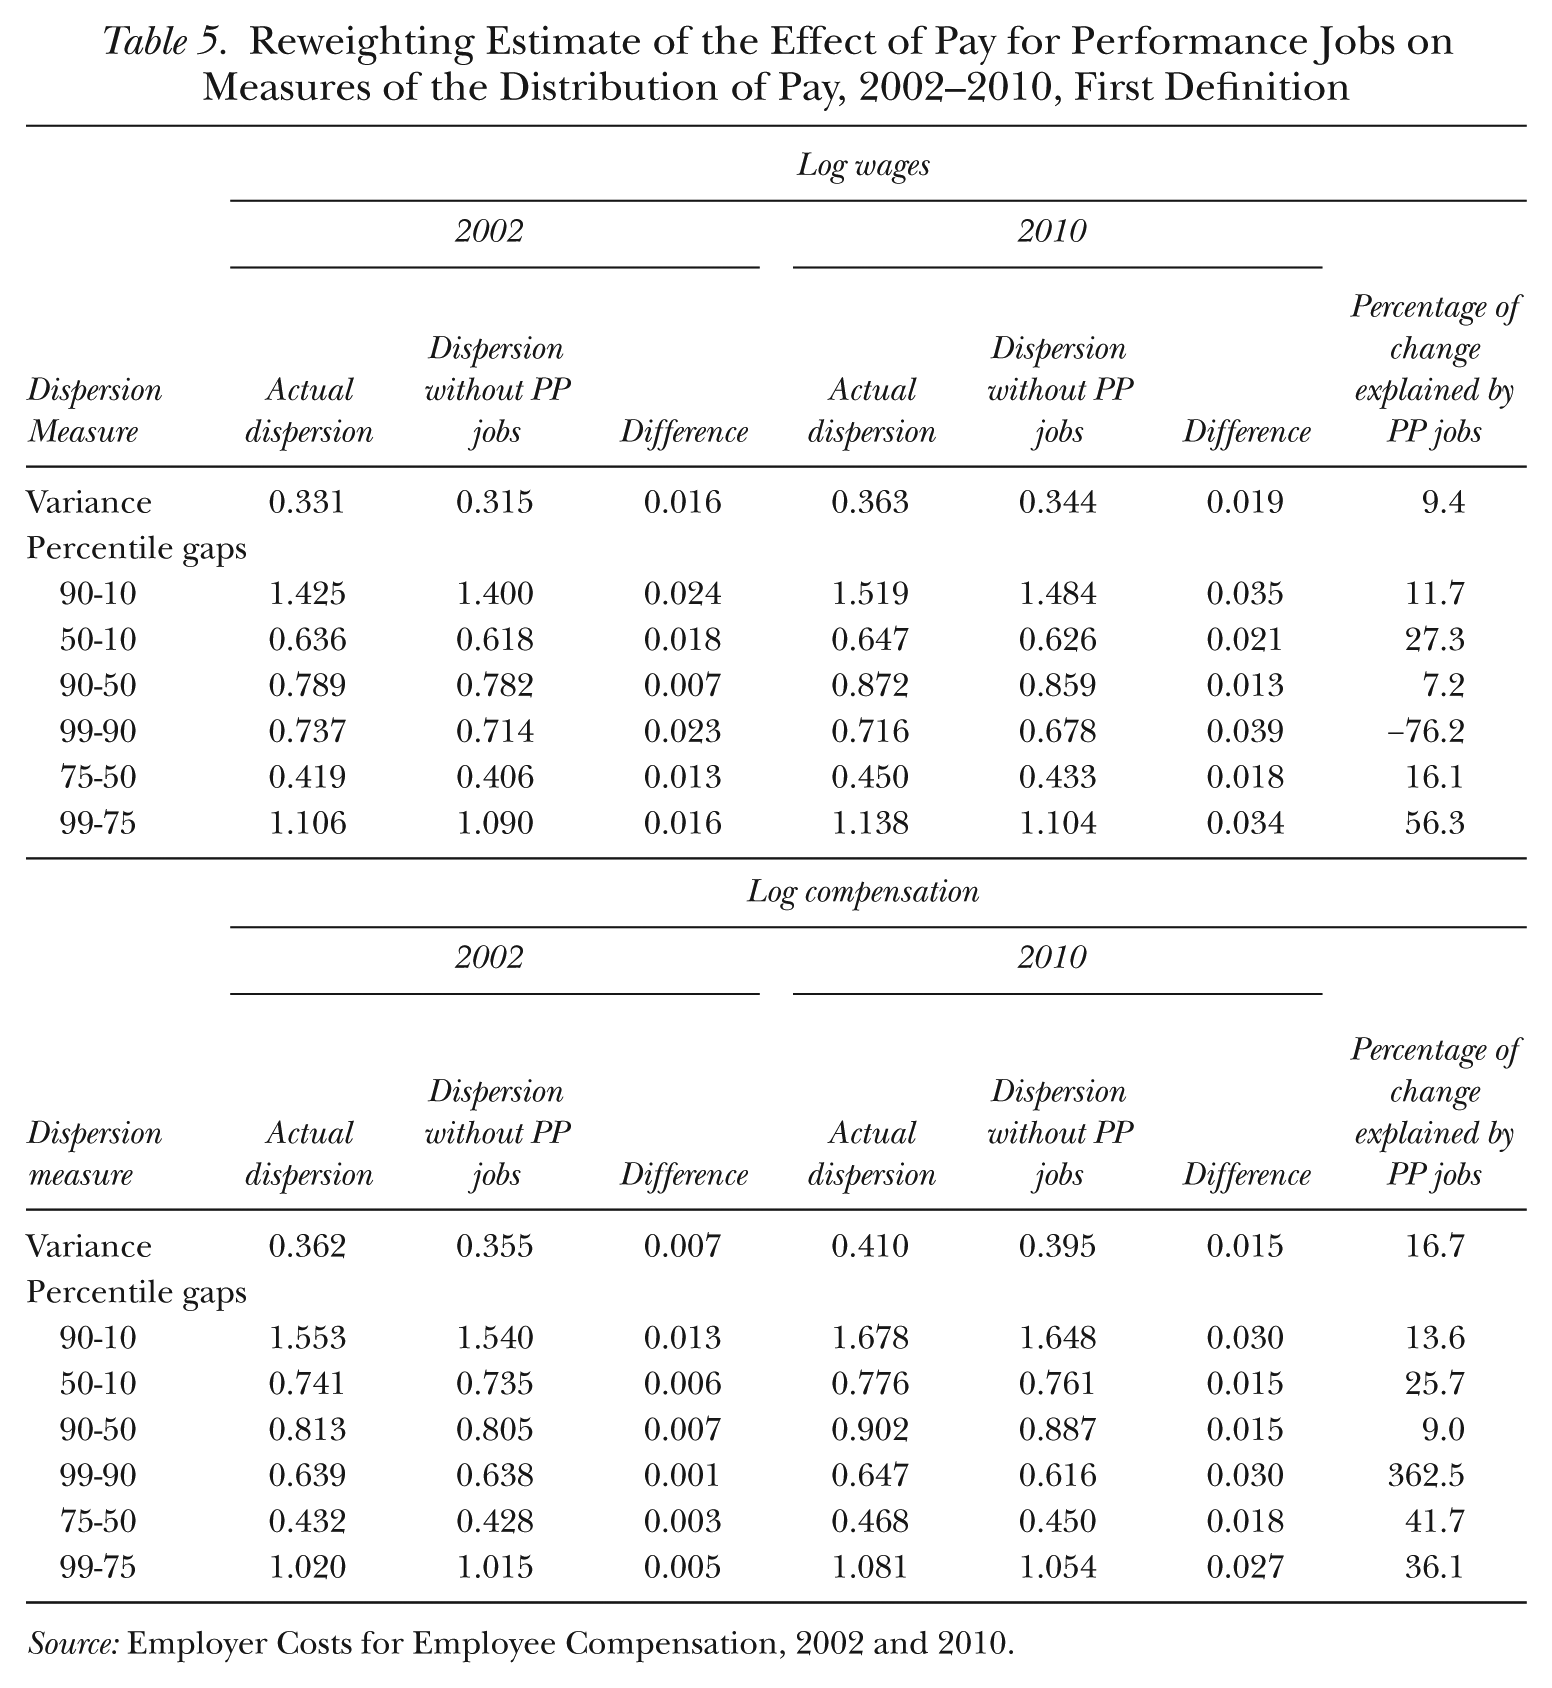
Source: Employer Costs for Employee Compensation, 2002 and 2010.
During this period, when the incidence of performance pay declined from 0.49 to 0.42, the effect of performance pay was relatively modest. It accounts for 9.4% of the overall increase in variance, 7.2% of the widening of the 90-50 gap, and 11.7% of the increase in the 90-10 gap. As percentages, the results for the other percentile gaps tend to be larger, but these are over a small base. 22
It may, however, be surprising that performance pay accounts for any of the increase in inequality, given that its prevalence fell. That it does indicates that the remaining performance-pay jobs are playing more of an inequality-increasing role than the previously larger performance-pay sector.
Turning to compensation, the patterns are fairly similar to those for wages. The log variance increased by 13%. The 90-10 gap widened a bit more than for wages, primarily because there was more movement in the 50-10 gap, though, as with wages, the 90-50 gap widening was the driving force behind the overall increase. The explanatory power of performance pay continues to be modest, 16.7% of overall variance, 13.6% of the 90-10, and 9.0% of the 90-50. Once again, however, keep in mind that the incidence of performance pay declined during the period.
To see what happened when prevalence was on an upswing, we turn to the 1994 to 2002 period, in Table 6. 23 During this time, overall inequality actually declined both for wages and for total compensation, as the 50-10 gaps narrowed appreciably, while the 90-50 gaps widened slightly. For overall inequality and for percentile gaps that do not involve the 99th percentile, the reweighting estimates suggest that pay for performance worked in the direction of increasing inequality, although the absolute impact was not great. For instance, for log wages, the estimates suggest that the 90-10 percentile gap would have narrowed by 0.021 log points more if not for the presence of pay-for-performance jobs, while for compensation, the comparable magnitude is 0.015. For wages, the 99-90 and 99-75 percentile gaps would have been about 0.03 log points wider if not for pay for performance, though there was less of an impact on these gaps for total compensation.
Reweighting Estimate of the Effect of Pay for Performance Jobs on Measures of the Distribution of Pay, 1994–2002, First Definition
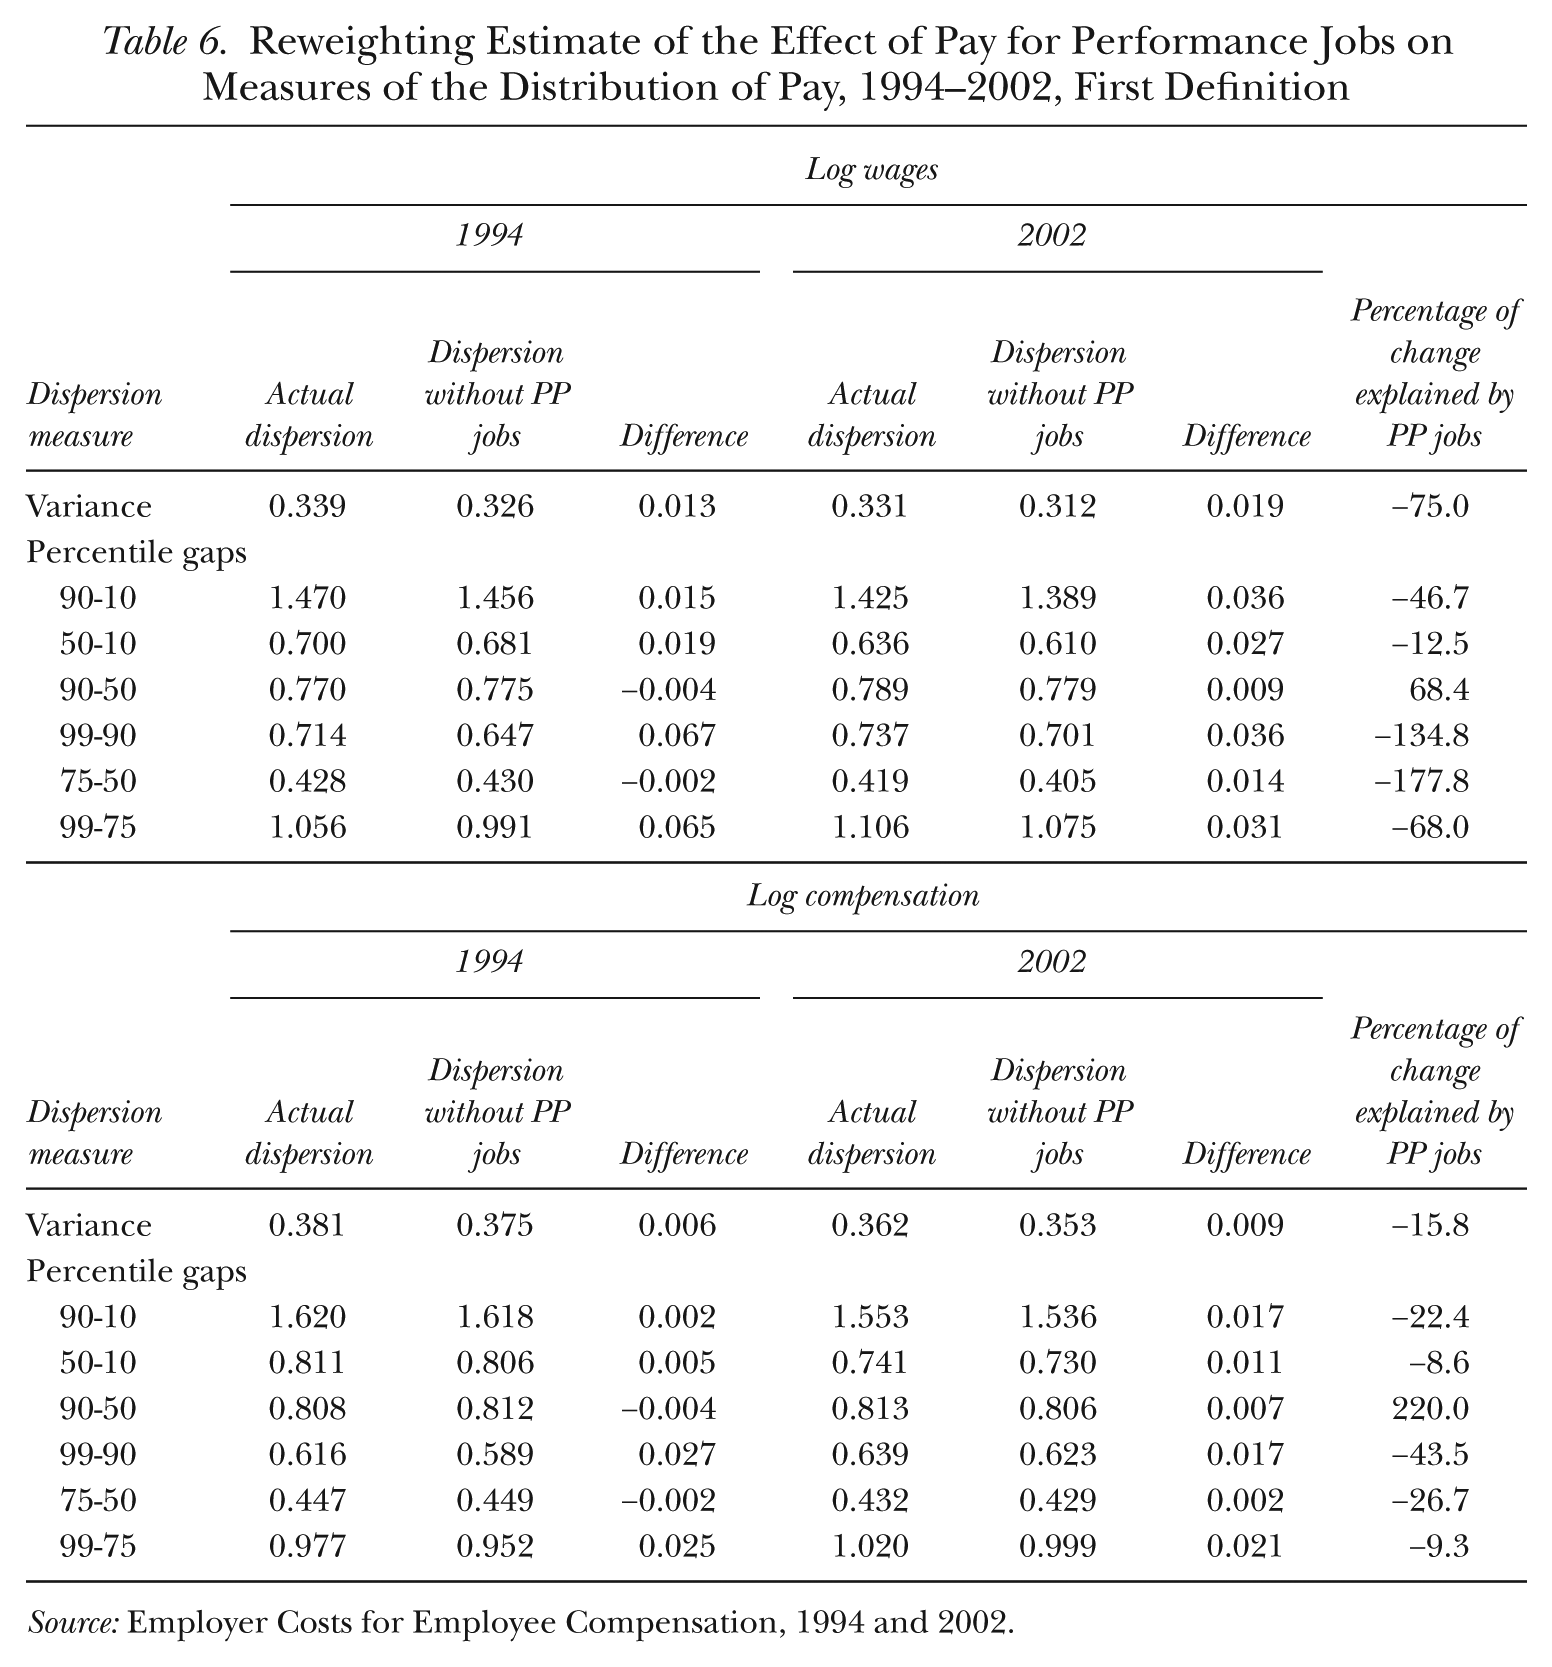
Source: Employer Costs for Employee Compensation, 1994 and 2002.
The results in Tables 4 to 6 suggest that pay for performance contributed in an accounting sense to inequality, and to inequality growth. During the recent 2002 to 2010 period, the contribution was slightly larger to compensation than wage inequality growth and occurred despite falling incidence of pay for performance. Further, the effects appear greater in the upper half of the respective distributions. The overall magnitudes, however, are smaller than those identified by LMP using household survey data on males for the mid-1970s to early 1990s.
Gender Differences
As noted earlier, the employer-based ECEC data necessarily include both men and women whereas household-based data typically allow their separate identification. It may be that combining men and women prevents us from finding stronger effects of pay for performance. By way of analogy, a recent study by Heywood and Parent (2012) concluded that the tendency for performance pay to be associated with greater wage inequality at the top of the male earnings distribution applies only to white workers and not to black workers. Whites are more likely to be in pay-for-performance jobs and to receive a higher differential when they are in such jobs. The higher differential is attributable in part to a greater relative likelihood of whites receiving bonuses at the top of the distribution, while blacks are subject to piece rates at the bottom. While one would not expect an identical story for women relative to men, it is possible that the relationship between performance pay and wage inequality found by LMP applies to a greater extent to men than to women. 24
We conducted two exercises to investigate how excluding women might impact the ECEC sample. We cannot reach firm conclusions with these, but we can give readers some sense of the possibilities. First, we recalculated the incidence of performance pay in the ECEC by benchmarking the weights for industry-by-occupation cells to that found for men in the CPS, and found that this has little impact. This finding suggests that any gender differences in performance pay would relate mainly to within-cell differences in incidence. Second, as shown in Appendix Table A.1, for the CPS-ORG, the presence of women tends to mute changes in inequality. That is, except for the 50-10 differential, which is affected little by the addition of women, increases in inequality are all greater for men alone than for men and women combined. For the March CPS, the difference between the All and Men series tends to be fairly muted, except for the 95-90 gap, which widens more for men. Putting the two pieces together, without women in the ECEC sample, it seems as though we would have similar levels of performance pay (but for any within industry and occupation differences), and, overall, greater increases in inequality for performance pay to potentially explain.
Conclusions
In this article, we examined the link between pay for performance and pay inequality using the microdata from the quarterly Employer Costs for Employee Compensation over the period 1994 to 2010. Several interesting findings emerged. First, in contrast to the earlier trends in the PSID noted by LMP, the incidence of performance pay has not been moving decidedly upward post-1994. Instead, the prevalence climbed in the first part of the period, stayed on a plateau until 2006, and then declined. Whether the share of performance-pay jobs will recover as economic growth strengthens is an open question; and if so, what parts of the earnings distribution will be most affected. Second, the trends for the private sector as a whole mask a growing relative incidence at the top of the wage distribution. Third, the impact of pay-for-performance jobs on the levels of inequality tends to be fairly modest in the ECEC, especially when the second definition of pay for performance is used. Fourth, owing to an increase in impact of pay for performance on the levels of inequality, pay for performance did push in the direction of a small increase in inequality during the period.
We can imagine several avenues for further study on this topic. First, it would be useful if the trends in performance pay that we document in the ECEC could be investigated in other data sets. For example, examining trends in the PSID from the mid-1990s forward would be fruitful. We are saying this not only because this would help in any reconciliation with our results but also because it appears that the PSID may have diverged somewhat from the CPS in inequality during the period that LMP studied. For instance, the 90-10 in LMP’s sample increased by 0.372 log points from 1976–79 to 1990–93; whereas using data underlying Autor, Katz, and Kearney (2008), we find an increase of 0.210 over the same period in the March CPS. The majority of the difference can be found in the top half of the distribution. Whether this divergence is related to LMP’s results is an open question.
Second, it remains to be seen whether bonus receipt will recover to the levels seen in the early years of the first decade of the 2000s. If it does, pay for performance may show a greater contribution to any growth in inequality going forward. Finally, it will be useful to observe how the incidence of performance pay evolves according to our second definition (which excludes bonuses that appear less directly related to incentives provision), and whether future trends differ by definition.
Footnotes
Appendix
Acknowledgements
We thank Erika McEntarfer, Tony Barkume, the editor, and two anonymous referees for their comments.
Earlier versions of this article were presented at the 2013 Society of Labor Economists annual meetings and the 2012 BLS-Census Workshop.
The authors prepared this work within the scope of their employment with the Bureau of Labor Statistics. The views expressed here are those of the authors and do not necessarily reflect the views or policies of the Bureau of Labor Statistics or any other agency of the U.S. Department of Labor. The Bureau of Labor Statistics permits replication of articles using confidential BLS data. One procedural requirement is that the work must be performed on-site at the BLS. Please see ![]() for details.
for details.
2
See U.S. DOL (undated) for further details.
4
See Barkume and Moehrle (2001), Barkume (2004), and Bishow (2009, 2010) for analyses relating to performance pay, and Pierce (2001, 2010) for studies of compensation inequality. After this study was completed, we were alerted to the performance pay study of ![]() , which uses data from the ECEC as well as other surveys.
, which uses data from the ECEC as well as other surveys.
5
Published ECEC estimates represent the average worker. We further adjust weights by multiplying by scheduled hours worked, so that our estimates represent the average hour worked.
6
In the early years of the ECEC, Census occupation classification systems were used, so that SOC-based codes are available only from 2002 on.
7
One major way in which NCS data are put to use is to enable the President’s Pay Agent, which consists of the Secretary of Labor and the Directors of the Office of Management and Budget and the Office of Personnel Management, to compare rates of pay under the General Schedule (GS) to non-Federal rates of pay. The NCS work levels range from 1 to 15 and are meant to correspond to the GS levels. For additional details on the collection of job factors and how these factors are aggregated to a work level assignment, see ![]() .
.
8
Stock options do not form part of the compensation measured by the NCS. As we discuss below, top corporate officers, the most likely recipients of substantial stock options, are not in scope for the NCS. ![]() found that broadly offered stock plans (meaning stock or options offered to many or most employees) are unusual and appear to reflect hiring and retention motivations.
found that broadly offered stock plans (meaning stock or options offered to many or most employees) are unusual and appear to reflect hiring and retention motivations.
9
Unfortunately, the data do not allow us to distinguish incentive pay from base pay for incentive pay workers.
10
The ![]() describes a robustness check based on a more inclusive alternative definition. As noted, our analysis is complicated by the fact that for parts of the sample we do not know without error whether a bonus plan is in place. We examined the sensitivity of our results to the exclusion of this group and found that, while there are minor impacts on incidence rates, trends in such rates are little affected. In addition, little qualitative difference is seen in our results on the impact of performance pay on the level and trends in inequality.
describes a robustness check based on a more inclusive alternative definition. As noted, our analysis is complicated by the fact that for parts of the sample we do not know without error whether a bonus plan is in place. We examined the sensitivity of our results to the exclusion of this group and found that, while there are minor impacts on incidence rates, trends in such rates are little affected. In addition, little qualitative difference is seen in our results on the impact of performance pay on the level and trends in inequality.
11
LMP’s preferred measure of pay for performance takes into account receipt in any year that an employment relationship is observed. They noted that their measure is an understatement because a job may terminate before performance pay is received or because part of the time in the job is either before or after the sample range. One of our robustness checks experimented with observing receipt of non-production bonuses in jobs that were in the sample before and after the current quarter. Such an approach raises the prevalence of performance pay, without having much of an impact on trends or the relationship between performance pay and the level of and changes in inequality.
13
See, among others, Lazear (1986, 2000) and Brown (1990, ![]() ).
).
14
For the small portion of the sample for which bonus type is unavailable, we assume that bonuses are not performance-based. The results are not sensitive to this decision.
15
LMP referred to performance-pay jobs as “employment relationships in which part of the worker’s total compensation includes a variable pay component (bonus, commission, or piece rate).” This sounds closer in spirit to our first definition but this may depend on respondent interpretation. The PSID does not allow a distinction to be made among different types of bonuses.
16
The distribution of work level groups is as follows: some 51% of employment is in the bottom work level group, 26% in the second, 11% in the third, and 1% in the top. The remaining share of employment has work level missing, owing to respondent unwillingness or inability to provide information needed to assign a work level.
17
A negative correlation occurs between the quarterly unemployment rate and the incidence of performance pay over the entire 1994 to 2010 period, but not within all subperiods or, if one extends the time horizon, the period beyond 2010. For instance, the incidence of performance pay has continued to decline through 2013, while the unemployment rate has gradually come down. We find it difficult to reliably separate out cyclical factors from secular trends over this short horizon.
18
A third explanation for a finding that those with performance pay have higher wages is that they receive a compensating differential for sharing in the risks of production.
19
Observable characteristics used for 1994 are dummy variables for establishment size, major industry, major occupation, full-time status, union, and quarter. For 2010, and when 2002 is compared with 2010, work level is added.
20
While we later calculate pay gaps using the 99th percentile of the ECEC, we do not do so using the CPS, because the 99th percentile in that survey is affected by top coding.
21
We can only speculate what our results would look like if we did have bonus types over time. If the relative explanatory power of the two definitions was the same in 2002 as in 2010, then the second definition would tend to have less ability to explain changes over time in inequality.
22
As a check on whether our results were affected by ignoring within-job dispersion, we did a similar analysis as in ![]() using the narrow wage concept that is available both at the individual and the job-average level. With individual level wages, we were able to account for slightly more of the change in dispersion in absolute terms, but the share of the change in dispersion was usually small.
using the narrow wage concept that is available both at the individual and the job-average level. With individual level wages, we were able to account for slightly more of the change in dispersion in absolute terms, but the share of the change in dispersion was usually small.
23
The two sets of 2002 results are not identical because the one matched with 2010 includes controls for work level, while the one matched with 1994 does not.
24
We cannot check that speculation directly because the PSID does not collect data on bonuses and commissions for all working men and women, only for working heads of households (assumed to be male in husband-wife pairs).
25
26
An important exception is when prior quarter costs for the job are known to be zero, in which case the imputation is for a rate of change applied to prior quarter costs, resulting in a zero cost value for the current quarter.