
Abstract
The authors empirically test the cross-sectional relationship between hiring discrimination and labor market tightness at the level of the occupation. To this end, they conduct a correspondence test in the youth labor market. In line with theoretical expectations, results show that, compared to natives, candidates with a foreign-sounding name are equally often invited to a job interview if they apply for occupations for which vacancies are difficult to fill; but, they have to send out twice as many applications for occupations for which labor market tightness is low. Findings are robust to various sensitivity checks.
Becker (1957) argued that discrimination is difficult to sustain in a perfectly competitive product market because it is costly, so a firm that discriminates by not hiring a productive minority worker will be driven out of the market by a competing firm that takes advantage of this profit opportunity. 1 Similarly, Cahuc and Zylberberg (2004) argued that discrimination is necessarily linked to some imperfection in the labor market. Employers that pay discriminated-against workers a wage lower than marginal productivity are driven out of the market by the free entry of firms without a preference for discrimination because these firms are willing to offer to these workers a wage that does equal marginal productivity. 2
In reality, product and labor markets are imperfectly competitive, and therefore, discrimination can prevail. In particular, contributions to the literature (see, e.g., Manning 2003) showed that employers, even if they operate in labor markets composed of many competing firms, can exercise a certain degree of monopsony power and can therefore discriminate against certain groups of workers without being driven out of the market. Monopsony power rises with the search costs of employees and falls with the search costs of employers. On the one hand, search costs incurred by workers and induced by mobility costs (Gordon and Morton 1974; Barth and Dale-Olsen 1999) or imperfect information (Black 1995; Bowlus and Eckstein 2002; Rosén 2003) limit the capacity to change employer and, hence, confer some power to employers to discriminate. On the other hand, search costs on the employers’ side increase the output they forgo during the period that vacancies remain unfilled if a minority candidate is turned away. This means that discrimination should fall with labor market tightness. Building on the works of Black (1995) and Rosén (2003), Biddle and Hamermesh (2013) developed an equilibrium search model that theoretically underpins this intuition that employers discriminate less in a tight labor market. 3 This article provides suggestive evidence for this second prediction.
Contrary to the relationship between competition in the product market and discrimination, 4 the relationship between labor market tightness and discrimination has received little attention in the economic literature. Biddle and Hamermesh (2013) cited Ashenfelter (1970) and Freeman (1973), arguing that “the perceived costs to employers of discriminating was higher in tight labor markets” but adding that “neither found empirical evidence of cyclical movements in pure wage discrimination in the aggregate data” (2013: 2). In their analysis, Biddle and Hamermesh themselves found mixed empirical support for this relationship in the United States. Dustmann, Glitz, and Vogel (2010) reported for Germany and the United Kingdom significantly larger unemployment responses to economic shocks for immigrants relative to natives within the same skill group but little evidence for differential wage responses. These authors, however, did not directly link these differential responses to discrimination varying with labor market tightness. 5 Last, Booth, Leigh, and Varganova (2012) suggested that the heterogeneity in the discrimination rate found across Australian cities could be partly driven by differences in labor market tightness. Apart from the aforementioned authors, we could not find any discussion of this relationship in the literature.
In this article, we examine whether ethnic discrimination in the hiring process is lower in occupations in which recruitment is difficult than in occupations in which it is easy. The extent of discrimination is assessed on the basis of a correspondence test in Flanders, one of the three regions in Belgium. 6 We sent out 752 fictitious job applications of school-leavers, randomly assigned to individuals with either a Flemish- or a Turkish-sounding name, to 376 vacancies for jobs requiring no work experience. To maximize the variation in occupational tightness, roughly half of the applications were sent out to vacancies that were difficult to fill according to the Public Employment Service (PES). Our analysis shows that discrimination is essentially present only in occupations without identified recruitment difficulties. This result is found to be robust to alternative measures of tightness.
This strong negative cross-sectional relationship between discrimination and recruitment difficulties does not necessarily mean that tightness causes less discrimination. It may be the other way around. Firms may post vacancies in occupations in which wages are so low and working conditions so bad that typically no worker or, if any, only minority workers, not finding any other job because they are discriminated against, would want to apply. In this case, the absence of hiring discrimination in occupations with recruitment difficulties is induced by discrimination in wages and working conditions by occupational segregation. 7 To rule this out, we checked whether the negative relationship between occupational tightness and discrimination we found continued to hold if we controlled for average wages and indicators of job quality. But even if our main finding turned out to be robust for the inclusion of these control variables, we acknowledged that this is no proof that discrimination by occupational segregation plays no role. This is because these control variables were obtained from external sources and aggregated to the occupational level, so they do not necessarily reflect the actual wages and working conditions of the jobs for which our fictitious job candidates applied.
Readers may take an interest in this study for a number of additional reasons. First, we focus on ethnic discrimination against school-leavers. Discrimination against this group is particularly relevant because discrimination at the first stage of the career may cause, through scarring (Arulampalam 2001; Gregg 2001; Gregg and Tominey 2005), long-term adverse labor market outcomes even if discrimination does not play a role during the later stages of a worker’s career. Second, we provide evidence on hiring discrimination in the Flemish labor market. Flanders, and by extension Belgium, is an interesting case for a couple of reasons. In 2011, the youth unemployment rate in Belgium of non-EU-15 residents was as high as 32%, compared to 18% for natives, a gap of 14 percentage points, which is reported to be one of the largest in the Organisation for Economic Co-operation and Development (OECD) (Nonneman 2012). 8 Furthermore, in the 1990s the International Labor Office (ILO) conducted a series of ethnic-discrimination studies in the three Belgian regions on the basis of audit and correspondence tests. Discrimination in Belgium was found to be a significant and, compared to other OECD countries, more pronounced impediment to the employment of foreigners (Arrijn, Feld, and Nayer 1998). But a report issued by the OECD (2008) argued that the results of the ILO studies probably had a stronger policy impact in Belgium than elsewhere. Affirmative action, in combination with a stricter anti-discrimination legislation introduced in 2007, should have diminished labor market discrimination. Together with the recent studies of Capéau, Eeman, Groenez, and Lamberts (2012a, 2012b), our findings raise doubts on this conjecture. Third and last, for our sensitivity analysis we adopted the econometric framework recently proposed by Neumark (2012) to correct for the potential bias introduced by (ethnic) group differences in the variance of unobservable job-relevant characteristics.
Experimental Design
Detecting Ethnic Discrimination Using a Correspondence Test
Correspondence experiments testing for the presence of discrimination in the labor market have been extensively used (and refined) during the last decade. These experiments consist in sending carefully matched pairs of fictitious written job applications, randomly assigned to individuals revealing their minority status by their name or another individual characteristic, to real job openings and monitoring the subsequent callback rate. Concerning the identification of ethnic discrimination, the extensive correspondence test conducted by Bertrand and Mullainathan (2004) is seminal. These authors showed that, in the U.S. labor market at the start of the 2000s, applications with white-sounding names received 50% more positive callbacks on their job applications than those with African American–sounding names. In Europe, pervasive levels of ethnic labor market discrimination were found in Greece, Ireland, Sweden, and the United Kingdom (Bursell 2007; Carlsson and Rooth 2007; Wood et al. 2009; Drydakis and Vlassis 2010; McGinnity and Lunn 2011). In addition, recent correspondence studies concluded that evidence exists of varying degrees of hiring discrimination based on, for example, 1) gender in Austria, France, and Spain; 2) beauty in Sweden; and 3) sexual orientation in Austria, Greece, and Sweden (Weichselbaumer 2003, 2004; Petit 2007; Drydakis 2009; Rooth 2009; Albert, Escot, and Fernández-Cornejo 2011; Ahmed, Andersson, and Hammarstedt 2013). Furthermore, the correspondence methodology has also been applied to identify discrimination in other markets (e.g., Carlsson and Eriksson 2012, in the Swedish housing market).
These field experiments have been widely viewed as providing the most convincing evidence on discrimination (Riach and Rich 2002; Pager 2007). Researchers using nonexperimental data possess far less information than employers do. Native and foreign employees who, based on these data, appear similar to researchers may therefore be very different from the employers’ perspective. In a correspondence test, selection on individual unobservable characteristics is not an issue because all the employers’ decision-making information is controlled for by the researcher. Thereby, strict equivalence between candidates is ensured. As a consequence, this approach allows researchers to disentangle employer discrimination from alternative explanations for differential hiring rates between migrants and natives, such as differential employee preferences and network effects. 9
Construction of Applications and Matching Them with Vacancies
We generated template curricula vitae (CVs) and cover letters for eight profiles of school-leavers. First, three middle-educated profiles with a secondary education diploma (International Standard Classification of Education [ISCED] 3) in commerce, metallurgy, and organization help. For the middle-educated all three chosen forms of specialization match with both bottleneck and nonbottleneck occupations. Second, five high-educated profiles holding a professional bachelor’s degree in business administration (ISCED 5), each with a different specialization (accounting and tax, finance and insurance, logistics, marketing, and legal practice). 10 This bachelor’s degree was chosen because some of its specializations (accounting and tax, and logistics) typically match with bottleneck occupations, for which recruitment is difficult, whereas other specializations typically match with nonbottleneck occupations.
All profiles were of single males of Belgian nationality who graduated in June 2012. Depending on the region of the announcement’s workplace vacancy, their residence was located in one of the suburbs of either Antwerp or Ghent, the two largest cities in Flanders. The middle-educated school-leavers were 18 years old, and the high-educated school-leavers were 21. So, none of the candidates had experienced a grade retention in the past. In addition, we added to each application the following features: Dutch as a mother tongue, 11 adequate French and English language skills, driving license, computer skills, and student employment experience. Moreover, the cover letters signaled a motivated, structured, and capable person. For the high-educated school-leavers, we also mentioned sport club membership and student leadership. Last, we included a fictitious postal address (based on real streets in middle-class neighborhoods) and the date of birth in the CVs. (The CVs and cover letters are available on request.)
For five months, from November 2011 until March 2012, we randomly selected vacancies from the database of the Flemish Public Employment Service (PES; or VDAB in Dutch), the major job-search channel in Flanders, for which (at least) one of our eight profiles met the minimum educational requirements. We restricted the sample to vacancies for which no work experience was required and which were posted less than a fortnight before the start of the experiment. 12 We also ensured that roughly half of the vacancies referred to occupations that the PES identified as “difficult to fill” (see the Variation in Occupational Characteristics section).
The ethnicity of the candidate was signaled only by the name. Turkish names were used because the Turkish community forms the most significant ethnic minority in Ghent and the second most important one in Antwerp. In addition, the unemployment rate for residents of non-EU-15 countries (which include Turkey) is very high. In 2011, 23% of the active non-EU-15 residents were unemployed in Belgium, compared to 6% of the active Belgians. 13 Finally, typical Flemish and Turkish names can be easily distinguished. 14
For each of the eight profiles of school-leavers, we created two types of CVs and cover letters: Type A and Type B. This allowed us to send two applications, one of each type and of each ethnic group, for the same vacancy. To maximize comparability, both application types were identical in all job-relevant characteristics, such as number of months of experience in student work, 15 language skills, and quality of extra-curricular engagements. Type A and Type B candidates were educated in the same types of school, with comparable reputations. The applications just differed in inessential details, such as the name of the school, favorite sports, and other particular engagements, and in appearance, that is, fonts and layout. 16 To completely erase any chance of dependence of callbacks on the application type, a Flemish- or Turkish-sounding name was alternately assigned to the Type A and Type B versions, and, subsequently, both sent in an alternating order to a vacancy, each time with a one-day delay in between.
We matched to each assigned name an e-mail address and a mobile phone number. These were registered with large commonly used Internet and telecommunication providers. For each application sent, we logged the number of announced (similar) job positions in the vacancy, the address of the workplace, the gender of the recruiter (if available), the date of the application, the application profile (one of the five high-educated profiles or one of the three middle-educated profiles) and the application type (A or B).
Measurement of Callback
All applications were sent to the employer by e-mail. Callbacks for interviews were received by telephone voice mail or by e-mail. The content of the responses are available on request. Because we included postal addresses with a nonexistent street number in the applications, callback via regular mail could not be measured. However, several human resource managers confirmed that employers rarely, if ever, invite job candidates by regular mail to selection interviews. To minimize inconvenience to the employers, any invitations received were immediately declined. All callbacks received later than 40 days after the application were sent were neglected. This, however, turned out to be an artificial restriction; no response was received after 40 days.
In our analysis, we distinguished between two interpretations of positive callback. In a narrow sense, we classified the feedback from the employer side as positive if the candidate was invited to an interview related to the job to which he applied. This is the definition mostly used in the literature and is therefore our benchmark definition. We also considered the receipt of an alternative job proposal and a request to provide more information or to contact the recruiter as positive callback in a broad sense. In what follows, we refer to these two interpretations of positive callback as invitation to a job interview (narrow) and any positive reaction (broad).
Variation in Occupational Characteristics
We matched each vacancy one to one with an occupation in the classification list of the PES. 17 As mentioned previously, roughly half of the applications were sent out to occupations identified by the PES as bottleneck occupations. For each occupation, the research unit of the PES publishes each year two measures of labor market tightness (we used the 2011 version). First, the bottleneck status of the occupation is obtained by combining three statistical criteria and is then assessed by a number of labor market specialists. These three criteria are that 1) at least 10 vacancies must be registered in the PES database for the occupation to be retained, 2) the vacancy-filling rate must be lower than the median filling rate for all occupations together, and 3) the median duration until a vacancy in this occupation is filled must be greater than the median for all occupations together. A second measure of labor market tightness reported by the PES is the median duration required to fill a vacancy in an occupation. This duration is right censored at vacancy withdrawal. In the benchmark empirical analysis, we relied on the first measure. The second measure was used in a sensitivity analysis as a robustness check. Table A.1 (in Appendix A) lists the classifications of the occupations, some variables characterizing these occupations, and the number of fictitious applications that were sent to each of these occupations. First, both PES measures of labor market tightness for these occupations in 2011 are reported. The occupations with the minimum and maximum median vacancy duration in our experimental data set are consultant in recruitment and selection (13 days) and demonstrator (109 days). Bottleneck occupations are industrial cleaner, classic cleaner, private cleaner, customs declaration officer, executive expedition operator, planning and logistics clerk, shipping agent at the quay, bookkeeper, accountant, seller, representative, call-center employee, and tele-seller. Second, Table A.1 lists a measure of the extent to which the occupation is dominated by women, 18 an indicator of intensive customer contact in the occupations, the average wage in the occupation, 19 and a measure of job quality. 20 The latter statistics were used in the regression analyses. Last, the table reports the number of observations (twice the number of vacancies) for each of the occupations by level of education. For three occupations (administrative clerk, commercial clerk, and representative), applications were sent out for both the middle- and high-educated profiles, depending on the particular requirements in the vacancy. Table A.2 presents the summary statistics on the occupation characteristics by the bottleneck status of the occupation. It also contains statistics on the additional variables included in the regression analyses reported in the Results section.
Research Limitations
Here we briefly assess some research limitations inherent in our experimental design. For an in-depth discussion of the strengths and weaknesses of correspondence tests in general, we refer readers to Riach and Rich (2002) and Pager (2007) and for an elaboration on the ethical aspects of these tests, we refer readers to Riach and Rich (2004).
First, our experimental design can demonstrate discrimination, if any, only at the initial stage of the selection process. Because we simply measured callback rates for first interviews, we cannot make any statements about discrimination in the later stages of the selection process, let alone in wages. Bertrand and Mullainathan (2004), however, argued that a lower interview rate can be expected to be reflected in reduced job offers and in lower earnings. Moreover, because job interviews are costly, firms invite candidates to an interview only if they have a reasonably high chance of getting the job. Cédiey, Foroni, and Garner (2008) reported on the basis of a field experiment conducted in France comprising all stages of the hiring process that 85% of the total discrimination rate they identified was realized before the employer met the candidate in an interview.
Second, we investigated discrimination only for a selection of occupations and for vacancies posted in the PES database. Possibly, discrimination is more, or less, pervasive in other sectors than those covered by the database and among employers who rely on other channels (e.g., social networks) to fill their vacancies. Whether these limitations, taken together, may lead to an overestimation or an underestimation of discrimination in the Flemish youth labor market is unclear. Keep in mind, however, that here we are especially interested in the relationship between discrimination and labor market tightness. If, therefore, the limitations mentioned proportionally shift the discrimination measures for bottleneck and nonbottleneck occupations, our main research conclusions remain valid.
Last, as demonstrated by Heckman (1998), a standard correspondence test does not allow us to distinguish between taste-based discrimination (Becker 1957) and statistical discrimination (Arrow 1971). Kaas and Manger (2012) and Carlsson and Rooth (2010) showed that, to some extent, these forms of discrimination can be disentangled within the correspondence test framework, but this is outside the scope of this article. An alternative way to discriminate between taste-based and statistical discrimination would be available only if one of the two (theoretically) varied with labor market tightness. In the Conclusion and Discussion section, we explain why this is not the case.
Results
In this section, we first report the main results of our analysis, which show that discrimination is absent in bottleneck occupations but is important and highly significantly different from zero in nonbottleneck occupations. Subsequently, we check the extent to which our main results hold when we control for other occupational characteristics that may correlate with both the bottleneck status of the occupation and the extent of discrimination. Next, we test the robustness of these results by allowing for more subtle forms of discrimination as in the heteroskedastic probit model of Neumark (2012), on the one hand, and by adopting alternative measures of labor market tightness at the occupational level, on the other hand.
Main Results
Descriptive Analysis
Table 1 presents the main experimental results using our narrow definition of positive callback (invitation to a job interview). Table A.3 lists the corresponding descriptive statistics for the alternative, broad callback measure (any positive reaction). Because two applications were sent to each vacancy, four outcomes were possible: 1) positive callback for neither candidate, 2) positive callback for both candidates, 3) positive callback only for the Flemish-name candidate, and 4) positive callback only for the Turkish-name candidate. Overall, for 79 (139 for the broad definition; see Table A.3) of the 372 vacancies at least one candidate received an invitation to a job interview (any positive reaction); in 29 (45) cases a positive callback was received for just the Flemish candidate, and in 7 (15) cases a positive callback was received for the Turkish candidate only. The net discrimination rate is calculated as the ratio of the difference between the number of vacancies in which the Flemish and Turkish candidate was treated favorably, and the total number of vacancies in which at least one candidate received a positive callback. Overall, the net discrimination rate is 0.28 (0.22), when we adopt the narrow (broad) definition of positive callback. A standard χ² test of the hypothesis that the candidates of both ethnicities were treated unfavorably equally often is rejected at the 1% level. Based on this statistic, we conclude that evidence of discrimination against Turkish school-leavers is present in the Flemish labor market.
Probability of an Invitation to a Job Interview: Unequal Treatment of Flemish and Turkish Job Candidates
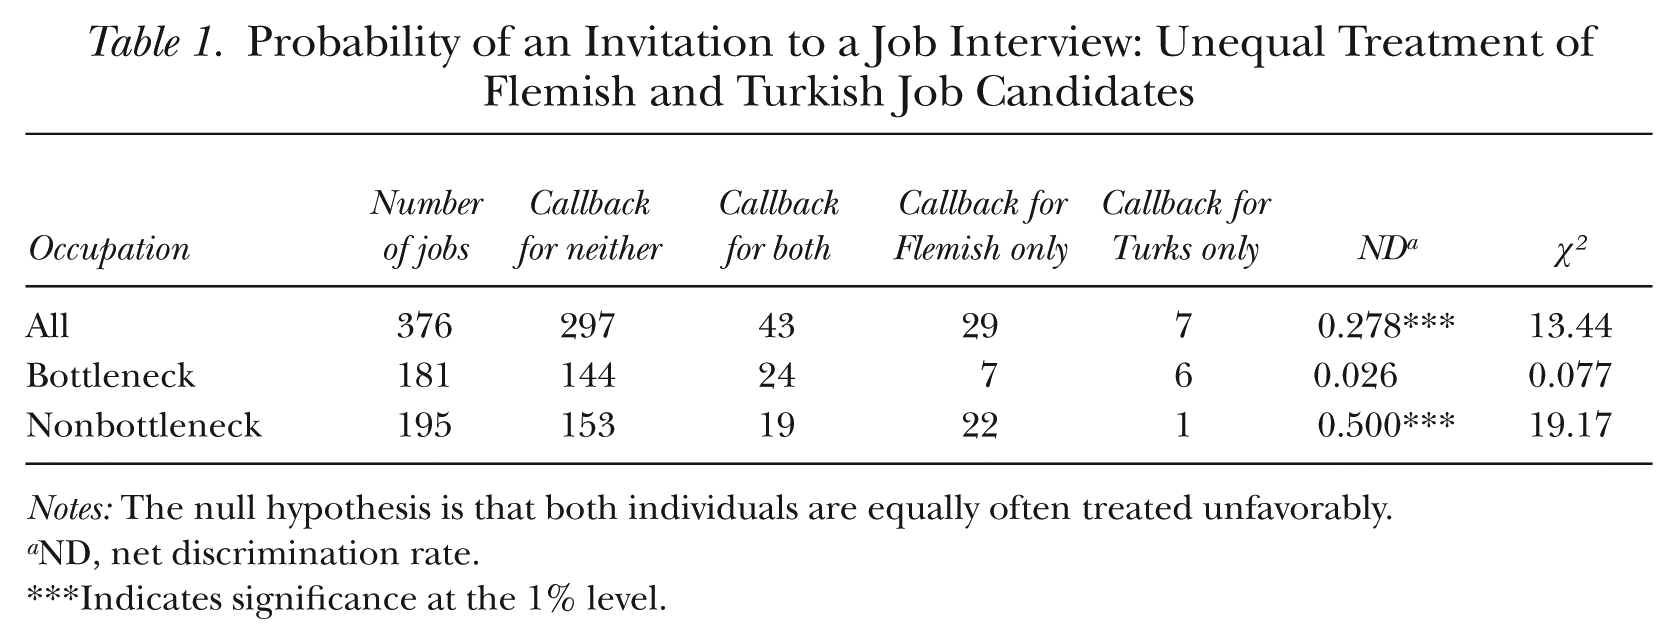
Notes: The null hypothesis is that both individuals are equally often treated unfavorably.
ND, net discrimination rate.
Indicates significance at the 1% level.
Tables 1 and A.3 show the same descriptive statistics for vacancies in bottleneck and nonbottleneck occupations. For the remainder of this subsection, we focus, unless stated otherwise, on the results for this split and on our narrow interpretation of positive callback (invitation to a job interview). Note that the results based on the broad interpretation of positive callback (any positive reaction) are qualitatively the same across all presented statistics.
Table 1 indicates that the net discrimination rate varies with labor market tightness at the occupational level in the expected direction. It is hardly different from 0 for bottleneck occupations. In sharp contrast, this statistic is 0.50 for nonbottleneck occupations; whereas for 22 of the 195 vacancies only the Flemish candidate received a positive callback, for just one vacancy did only the Turkish candidate receive a positive response.
Table 2 presents callback rates by ethnicity. These confirm the findings based on the net discrimination rate. The callback rate is defined as the number of positive callbacks relative to the total number of applications sent. The callback ratio was obtained by dividing the Flemish callback rate by the Turkish callback rate. This ratio is significantly different only from one for the individuals applying for nonbottleneck occupations. Candidates with Turkish-sounding names needed to send out more than twice as many job applications to be invited to as the same number of job interviews as the Flemish candidates.
Probability of an Invitation to a Job Interview: Positive Callback Rates for Flemish and Turkish Job Candidates
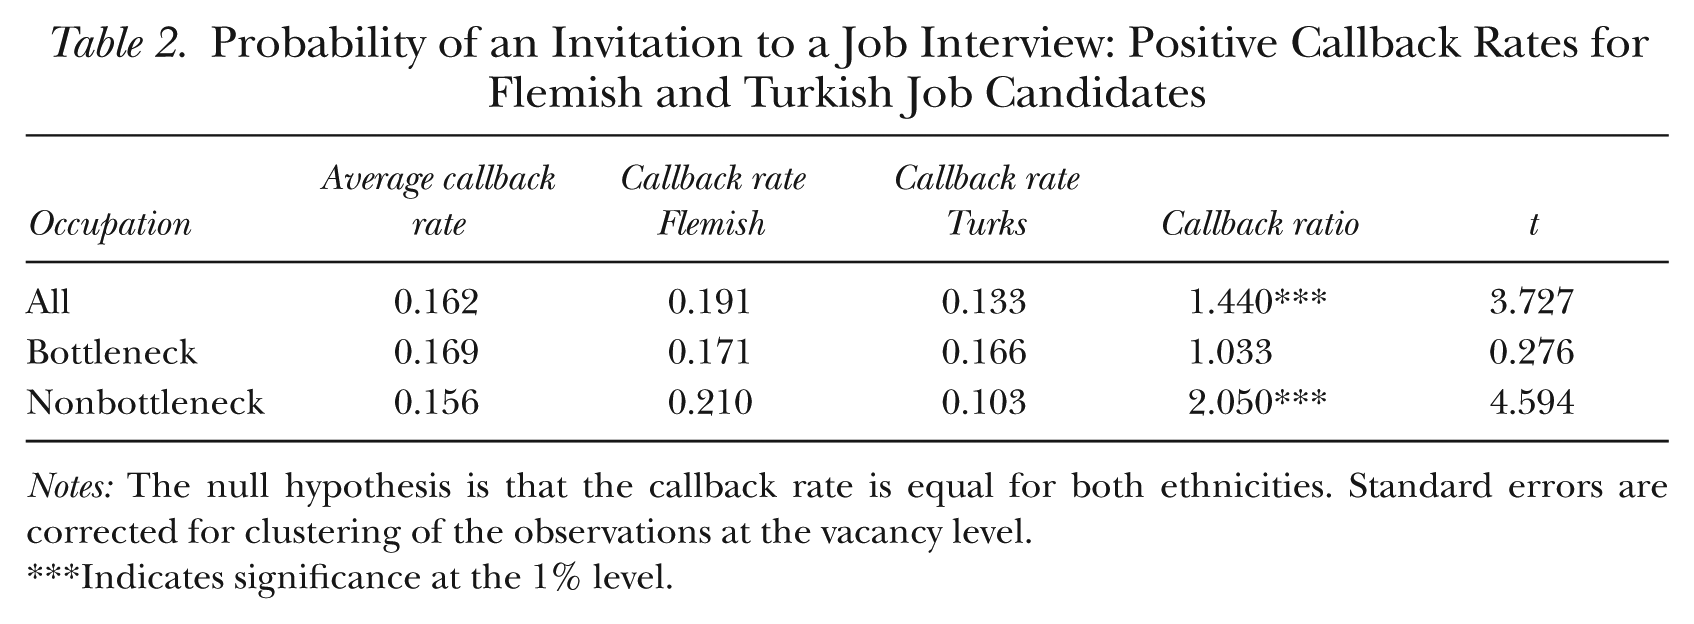
Notes: The null hypothesis is that the callback rate is equal for both ethnicities. Standard errors are corrected for clustering of the observations at the vacancy level.
Indicates significance at the 1% level.
Intuitively, bottleneck occupations are expected to have a higher callback rate than nonbottleneck occupations because the bottleneck should reflect a lack of candidates for the job and so applicants should have higher chances of being called for a job interview. Nevertheless, even though this expectation is confirmed on average, we observe the reverse for Flemish candidates (see Table 2). We explain this as follows. A vacancy is difficult to fill if an insufficient number of job applicants who match the requirements of the vacancy apply. Even though in the field experiment we attempted to match the profiles of the job applicants as closely as possible to the requirements mentioned in the vacancy, we might not have been equally successful in this attempt across occupations. 21 Consequently, if the quality of the match in bottleneck occupations was systematically lower than in nonbottleneck occupations, we might observe a lower callback rate in bottleneck occupations. Notice, however, that this does not necessarily invalidate the analysis because we controlled for the profiles of the candidates of different ethnicity and so the match would be equally inadequate for a candidate with a Turkish- or a Flemish-sounding name.
More concretely, we have reason to believe that the profiles of the job candidates were less well matched in the bottleneck than in the nonbottleneck occupations. For instance, an important share of the applications for bottleneck occupations was for classic and private cleaning services. The average callback rate for both the Flemish and Turkish candidates for these occupations is very low, namely 0.09. In view of the social context, employers may prefer females to males for these kinds of jobs. In addition, our medium-skilled candidates might have been relatively overqualified for these jobs. Indeed, if we exclude these 168 applicants (84 vacancies) from the analysis, the likelihood of the Flemish candidates being invited to a job interview (getting any positive reaction) for the bottleneck occupations increases from 0.17 (0.32) to 0.24 (0.39). This is higher than the callback rate in the nonbottleneck occupations. Observe that this does not affect our conclusion of less discrimination when candidates apply for bottleneck occupations because, after the exclusion of these observations, the callback rate of the Turkish applicants for the bottleneck occupations increases at nearly the same rate, that is, to 0.23 (0.41). Given this observation, we controlled in the regression analysis for the potential mismatch between the requirements of the job and the profile of the applicant by conditioning it on measures of overeducation and of female dominance in the occupation.
Figures B.1 and B.2 (in Appendix B) provide alternative descriptive evidence for the main finding that discrimination in not present in bottleneck occupations. In these figures, we present scatterplots of the average callback rate of the Flemish applicants against the average callback rate of the Turkish applicants for 12 occupation aggregates. This aggregation is required to avoid a too large sampling error in cases in which the number of applicants for a particular occupation was too small. 22 Figures B.1 and B.2 show that, for both measures of callback for most nonbottleneck occupation aggregates, the points lie below the 45° line. This means that the callback for candidates with Turkish-sounding names for these occupations was on average lower than the callback for the candidates with Flemish-sounding names. By contrast, for most bottleneck occupation aggregates the points are very close to the 45° line.
Regression Analysis
So far, we have provided descriptive evidence that job applicants with a Turkish-sounding name are less discriminated against when they apply for jobs in bottleneck professions. Nevertheless, we have several reasons to believe that this relationship between discrimination and the type of profession is not causal. Here, we investigate this issue using various regression analyses.
The results of these regressions are reported in Table 3 for the narrow callback measure (invitation to a job interview) and in Table A.5 for the broad callback measure (any positive reaction). As a benchmark, we first present in column (1) of Table 3 and column (1) of Table A.5 the probit model that reproduces the findings of the descriptive analysis in Tables 2 and A.4. Note that, because the characteristics of applicants are by construction orthogonal to ethnicity, including these characteristics in the probit model does not affect the estimates of our main coefficients of interest—interaction effects with ethnicity. We therefore chose to exclude these characteristics from the probit regressions. In our experimental data set overall, a Turkish-sounding name lowers the probability of receiving an invitation to a job interview by 11 percentage points after applying for a nonbottleneck occupation, whereas the callback rate does not differ between candidates with Turkish and Flemish names for bottleneck occupations. The hypothesis that the differential callback rate between Flemish and Turkish applicants is equal for bottleneck and nonbottleneck professions is rejected at the 1% level.
Probability of Invitation to a Job Interview: Main Regression Analysis
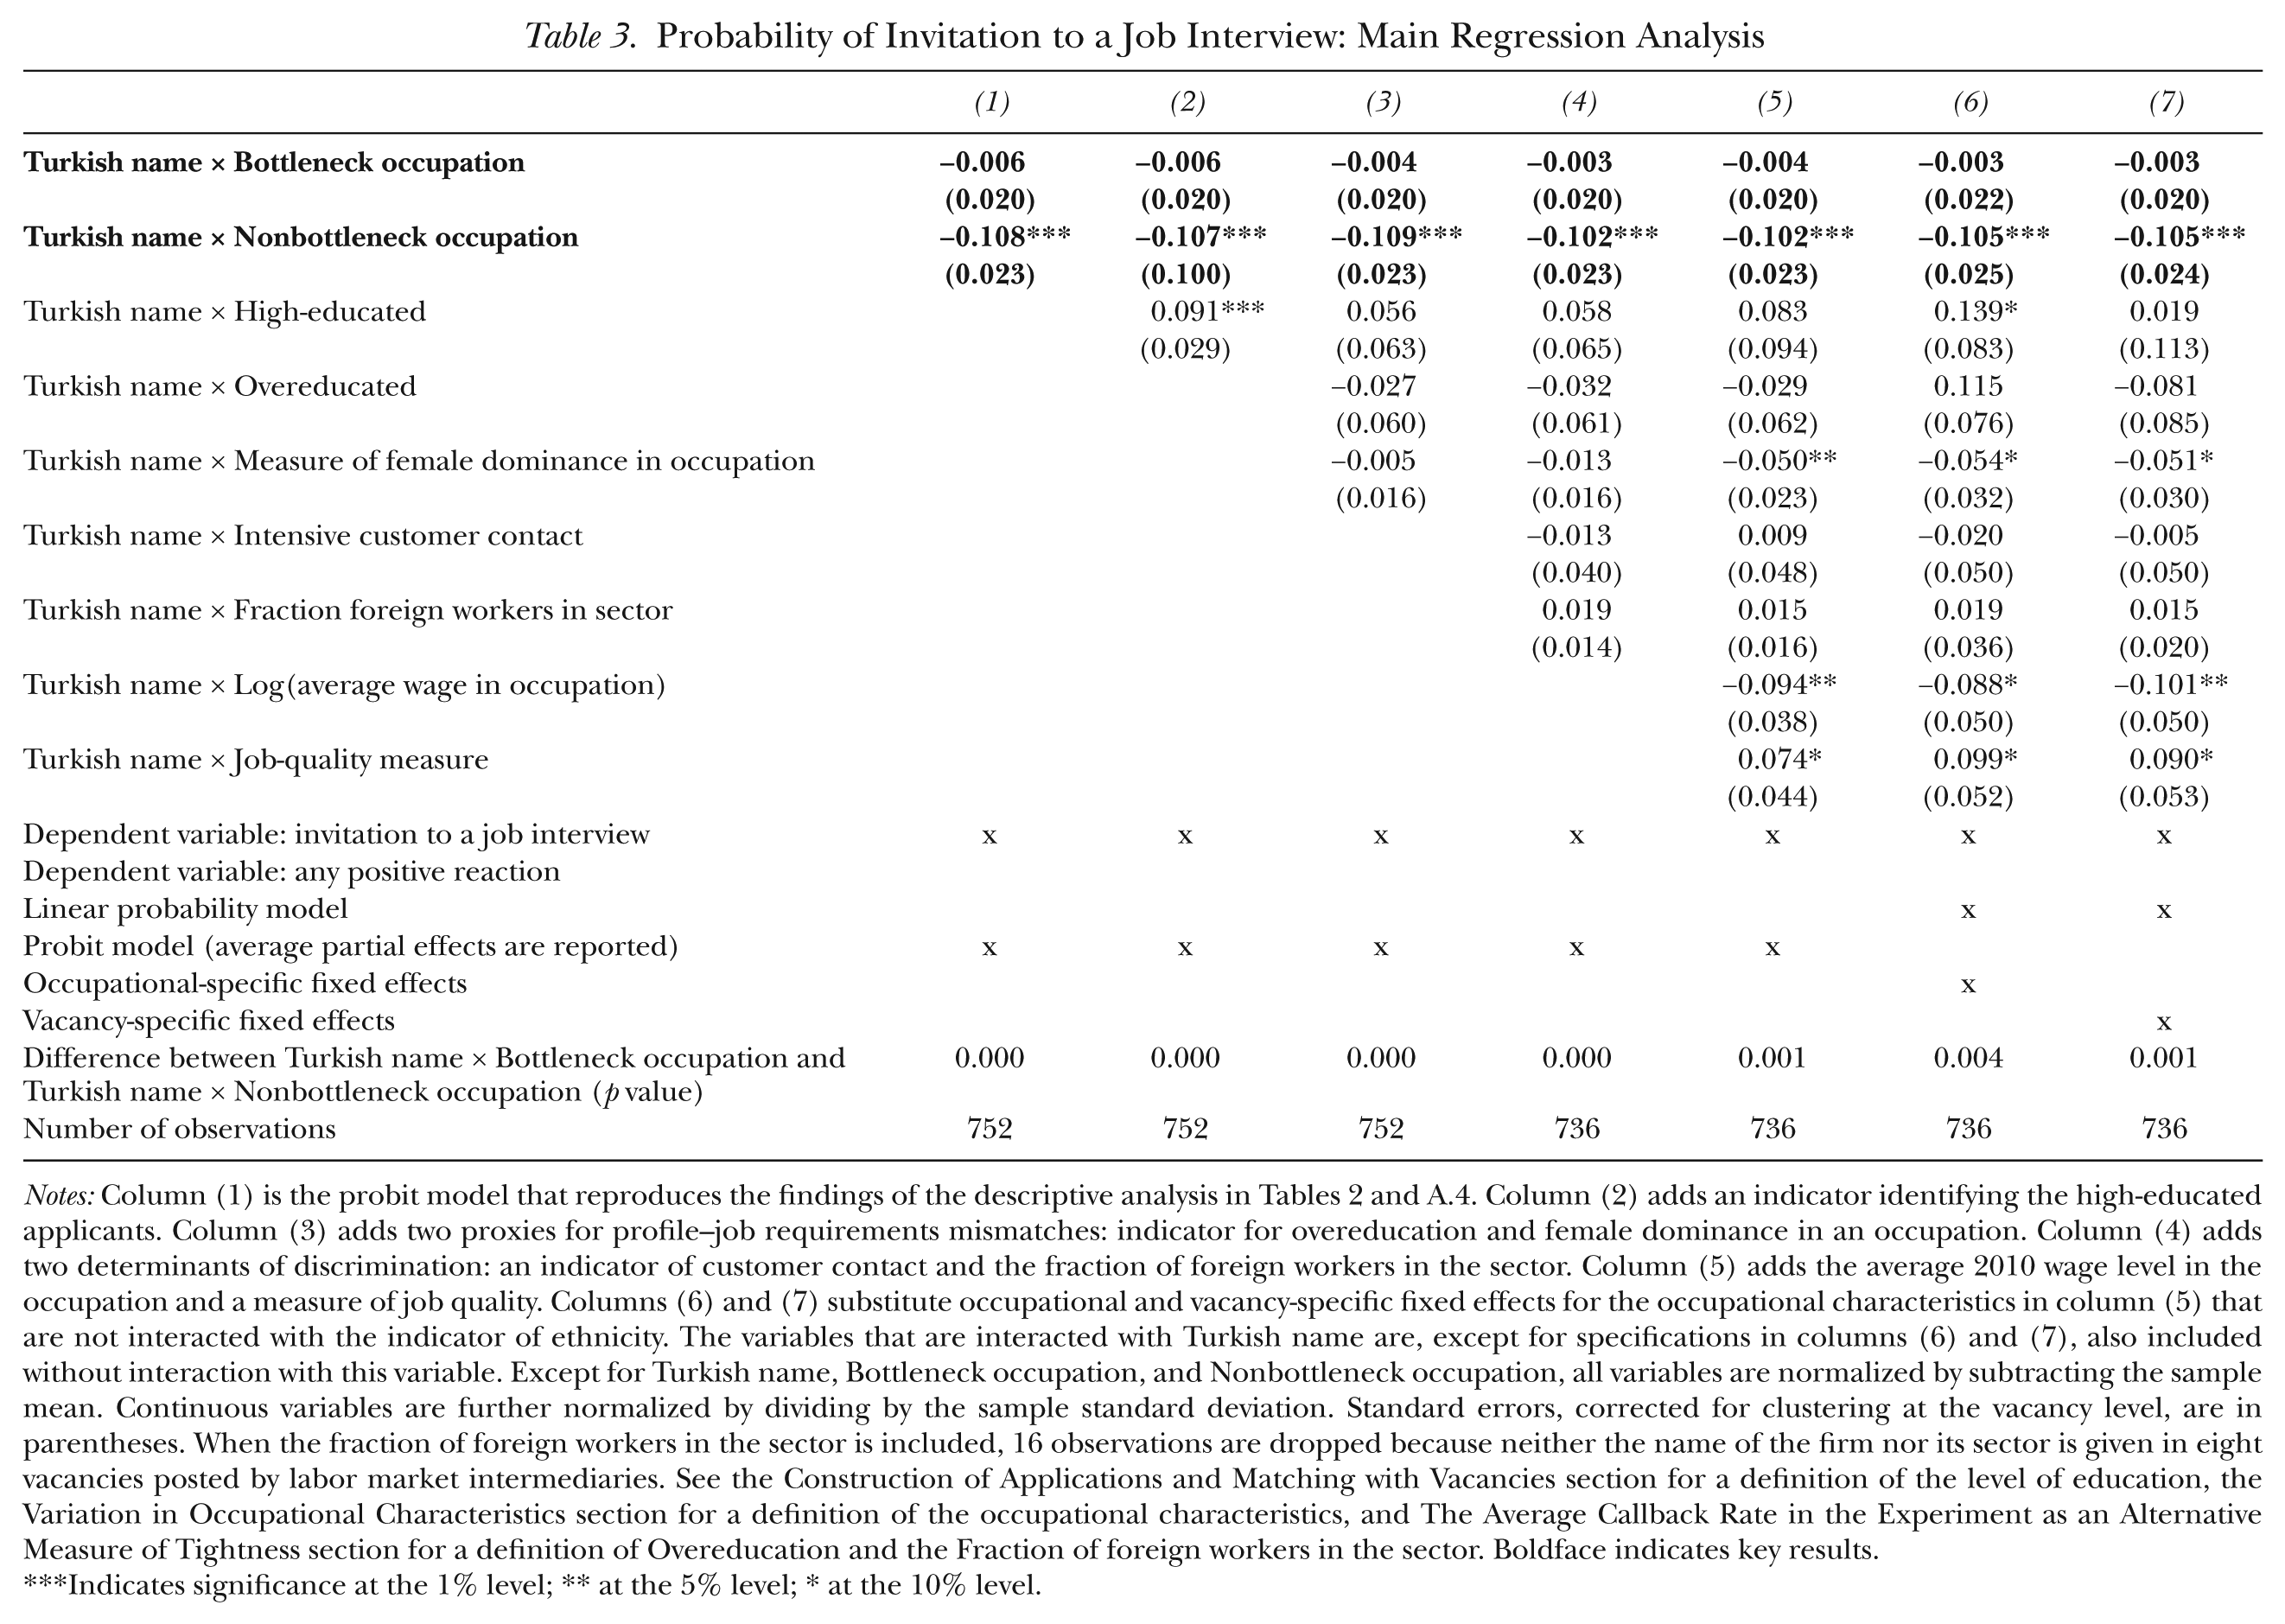
Notes: Column (1) is the probit model that reproduces the findings of the descriptive analysis in Tables 2 and A.4. Column (2) adds an indicator identifying the high-educated applicants. Column (3) adds two proxies for profile–job requirements mismatches: indicator for overeducation and female dominance in an occupation. Column (4) adds two determinants of discrimination: an indicator of customer contact and the fraction of foreign workers in the sector. Column (5) adds the average 2010 wage level in the occupation and a measure of job quality. Columns (6) and (7) substitute occupational and vacancy-specific fixed effects for the occupational characteristics in column (5) that are not interacted with the indicator of ethnicity. The variables that are interacted with Turkish name are, except for specifications in columns (6) and (7), also included without interaction with this variable. Except for Turkish name, Bottleneck occupation, and Nonbottleneck occupation, all variables are normalized by subtracting the sample mean. Continuous variables are further normalized by dividing by the sample standard deviation. Standard errors, corrected for clustering at the vacancy level, are in parentheses. When the fraction of foreign workers in the sector is included, 16 observations are dropped because neither the name of the firm nor its sector is given in eight vacancies posted by labor market intermediaries. See the Construction of Applications and Matching with Vacancies section for a definition of the level of education, the Variation in Occupational Characteristics section for a definition of the occupational characteristics, and The Average Callback Rate in the Experiment as an Alternative Measure of Tightness section for a definition of Overeducation and the Fraction of foreign workers in the sector. Boldface indicates key results.
Indicates significance at the 1% level; ** at the 5% level; * at the 10% level.
A concern is that the bottleneck status of a job may correlate with other determinants of discrimination, so that the observed correlation is not causal. Therefore, in the regressions whose results are presented in columns (2) to (7) of Tables 3 and A.5, we include additional interactions between Turkish-sounding name and a number of potential determinants of discrimination that may be correlated with the bottleneck status of an occupation. These variables are, except for the specifications in columns (6) and (7), also included without interaction.
First, we could expect that recruitment difficulties at the occupational level are related to the required level of education. Moreover, both theoretical 23 evidence and empirical 24 evidence show that discrimination decreases with the level of education, so our findings on labor market tightness could just reflect this relationship. We therefore included in all subsequent specifications an indicator identifying the high-educated applicants (i.e., those holding a bachelor’s degree in business administration).
Second, as previously discussed, the bottleneck status of the occupation may correlate with the extent of a mismatch between our fictitious job candidates and the jobs they applied for. Therefore, we added, from column (3) onward, two proxies of mismatch between the profiles of the fictitious job candidates and the requirements of the jobs for which they applied. The first was an indicator of overeducation that equals 1 if the educational level of the candidate strictly exceeded the minimal level required in the vacancy. This measure is very strongly negatively correlated with the indicator of education. This is why, after inclusion of this variable, the partial effect of higher education is no longer significantly different from 0. The second was a measure of female dominance in an occupation (defined in the Variation in Occupational Characteristics section). After we included these variables, the coefficient capturing the effect of bottleneck status on the callback rate for Flemish applicants increased. In the case of the broad callback measure (any positive reaction), it even became positive, albeit not significantly so. 25 This suggests that the opposite findings in Tables 2 and A.4 indeed reflect that the mismatch is higher in the bottleneck occupations and is partially accounted for by our indicators.
Third, from column (4) on, we included two additional well-known determinants of discrimination: an indicator of customer contact and the fraction of foreign workers in the sector. Customer-induced discrimination (Becker 1957) is expected to be higher in occupations with intensive customer contact. In addition, according to the social distance theory (Akerlof 1997) hiring discrimination should fall with the fraction of foreign workers in the firm (or sector). 26 Even if only weak empirical evidence exists for this theoretical prediction (Bursell 2007; Carlsson and Rooth 2007; Wood et al. 2009), we tried to capture this relationship by including a variable measuring the fraction of workers with a non-Western nationality in the sector of the firm as a proxy of the fraction of foreign workers in the firm itself. 27
Fourth, as mentioned earlier, our findings could reflect discrimination induced by occupational segregation. In this interpretation the absence of discrimination in bottleneck occupations would conceal lower wages and worse working conditions in these occupations than in nonbottleneck occupations. That is why we include from column (5) onward the interactions between Turkish name and both the average wage level in the occupation in 2010 and the job-quality measure defined in the Variation in Occupational Characteristics section.
As two last alternative specifications, and to saturate occupation controls further, in columns (6) and (7) we substitute occupational and vacancy-specific fixed effects for the occupational characteristics in column (5) that are not interacted with the indicator of ethnicity in the specification, and we estimate a linear probability model.
Tables 3 and A.5 reveal that the inclusion of the mentioned interaction variables and fixed effects hardly affects the estimated average partial effects for the main variables of interest—the interactions between a Turkish-sounding name and the bottleneck status of the occupation. Equality of the corresponding partial effects is, for all specifications, rejected at the 1% significance level. Furthermore, in line with the literature, column (2) reports evidence that more-educated candidates are less discriminated against than less-educated candidates. In the subsequent specification, this significance disappears because of the aforementioned correlation with the indicator of overeducation. In addition, in some specifications we get (weakly) significant evidence for more discrimination in female-dominated occupations. The coefficients of the interactions between Turkish-sounding name and measures for customer contact and the fraction of foreign workers in the sector are not significant. Last, in line with the interpretation of discrimination by occupational segregation, we find evidence of significantly more discrimination in better-paid occupations. This contrasts with the negative correlation that we find between our indicator of job quality and discrimination. The latter is, however, only marginally significant.
We also tried out a number of alternative specifications in which Turkish-sounding name is interacted with 1) indicators both of moderate and of intensive customer contact; 2) the fraction of Turkish (instead of non-Western) workers in the sector; and 3) other employer (or vacancy) characteristics (which we did not expect to be correlated with the bottleneck status of the occupation), such as the number of announced (similar) job positions by the vacancy, the province of the workplace, and the gender of the recruiter. Last, we also broke up our job-quality measure into its three submeasures (prospects, intrinsic job quality, and working-time quality). None of these alternative specifications 28 modifies our main conclusions in any way. We could not test whether recruiters belonging to an ethnic minority would discriminate differently because hardly any of the recruiters had a foreign-sounding name.
Sensitivity Analyses
In what follows we test the robustness of our results further. First, we investigate whether our finding of a negative cross-sectional relationship between the bottleneck status of an occupation and labor market discrimination holds for other measures of labor market tightness at the occupational level. Then, we control for ethnic group differences in the variance of unobservable determinants of positive callback.
We also attempted to exploit the time-series relationship between labor market tightness at the macro level and labor market discrimination. To this end, we interacted Turkish-sounding name with a measure of labor market tightness defined by the ratio of the number of vacancies reported by the PES to the number of registered unemployed job seekers in Flanders in the month the job application was sent out. 29 The estimated coefficient for the interaction between Turkish-sounding name and labor market tightness at the macro level, for most specifications, is, as expected, positive for the narrow callback measure (invitation to a job interview) but negative for the broad callback measure (any positive reaction). Because this macro variable shows limited variation (the experiment lasted only five months), none of these effects is significantly different from 0.
The Median Vacancy Duration in the Occupation as an Alternative Measure of Tightness
Here, we reproduce the results of Tables 3 and A.5 using an alternative variable capturing labor market tightness: the median vacancy duration in the occupation to which the individual applies. We normalized this variable by subtracting the sample average and, for comparability with our previous results, we divided the result by the difference between the average of this median duration in bottleneck occupations and the corresponding average in nonbottleneck occupations. Using this division, a unit increase in this variable corresponds to increasing the median vacancy duration of an average nonbottleneck occupation to that of an average bottleneck occupation, that is, increasing the median duration by approximately 13 days. Tables 4 and A.6 show that increasing the median vacancy duration in the occupation by this difference lowers discrimination by some value between 0.03 and 0.05 for the narrow callback measure (invitation to a job interview) and between 0.03 and 0.04 for the broad callback measure (any positive reaction). These magnitudes are smaller than the differences in discrimination between bottleneck and nonbottleneck occupations in Table 3 (which range from 0.10 to 0.11) and Table A.5 (which range from 0.13 to 0.15), which can be explained by the fact that some occupations with high median vacancy durations are not classified as bottleneck occupations (see Table A.1). Nevertheless, the values are highly significant, confirming that labor market discrimination is lower in occupations with high labor market tightness.
Probability of Invitation to a Job Interview: Median Vacancy Duration in the Occupation as an Alternative Measure of Tightness
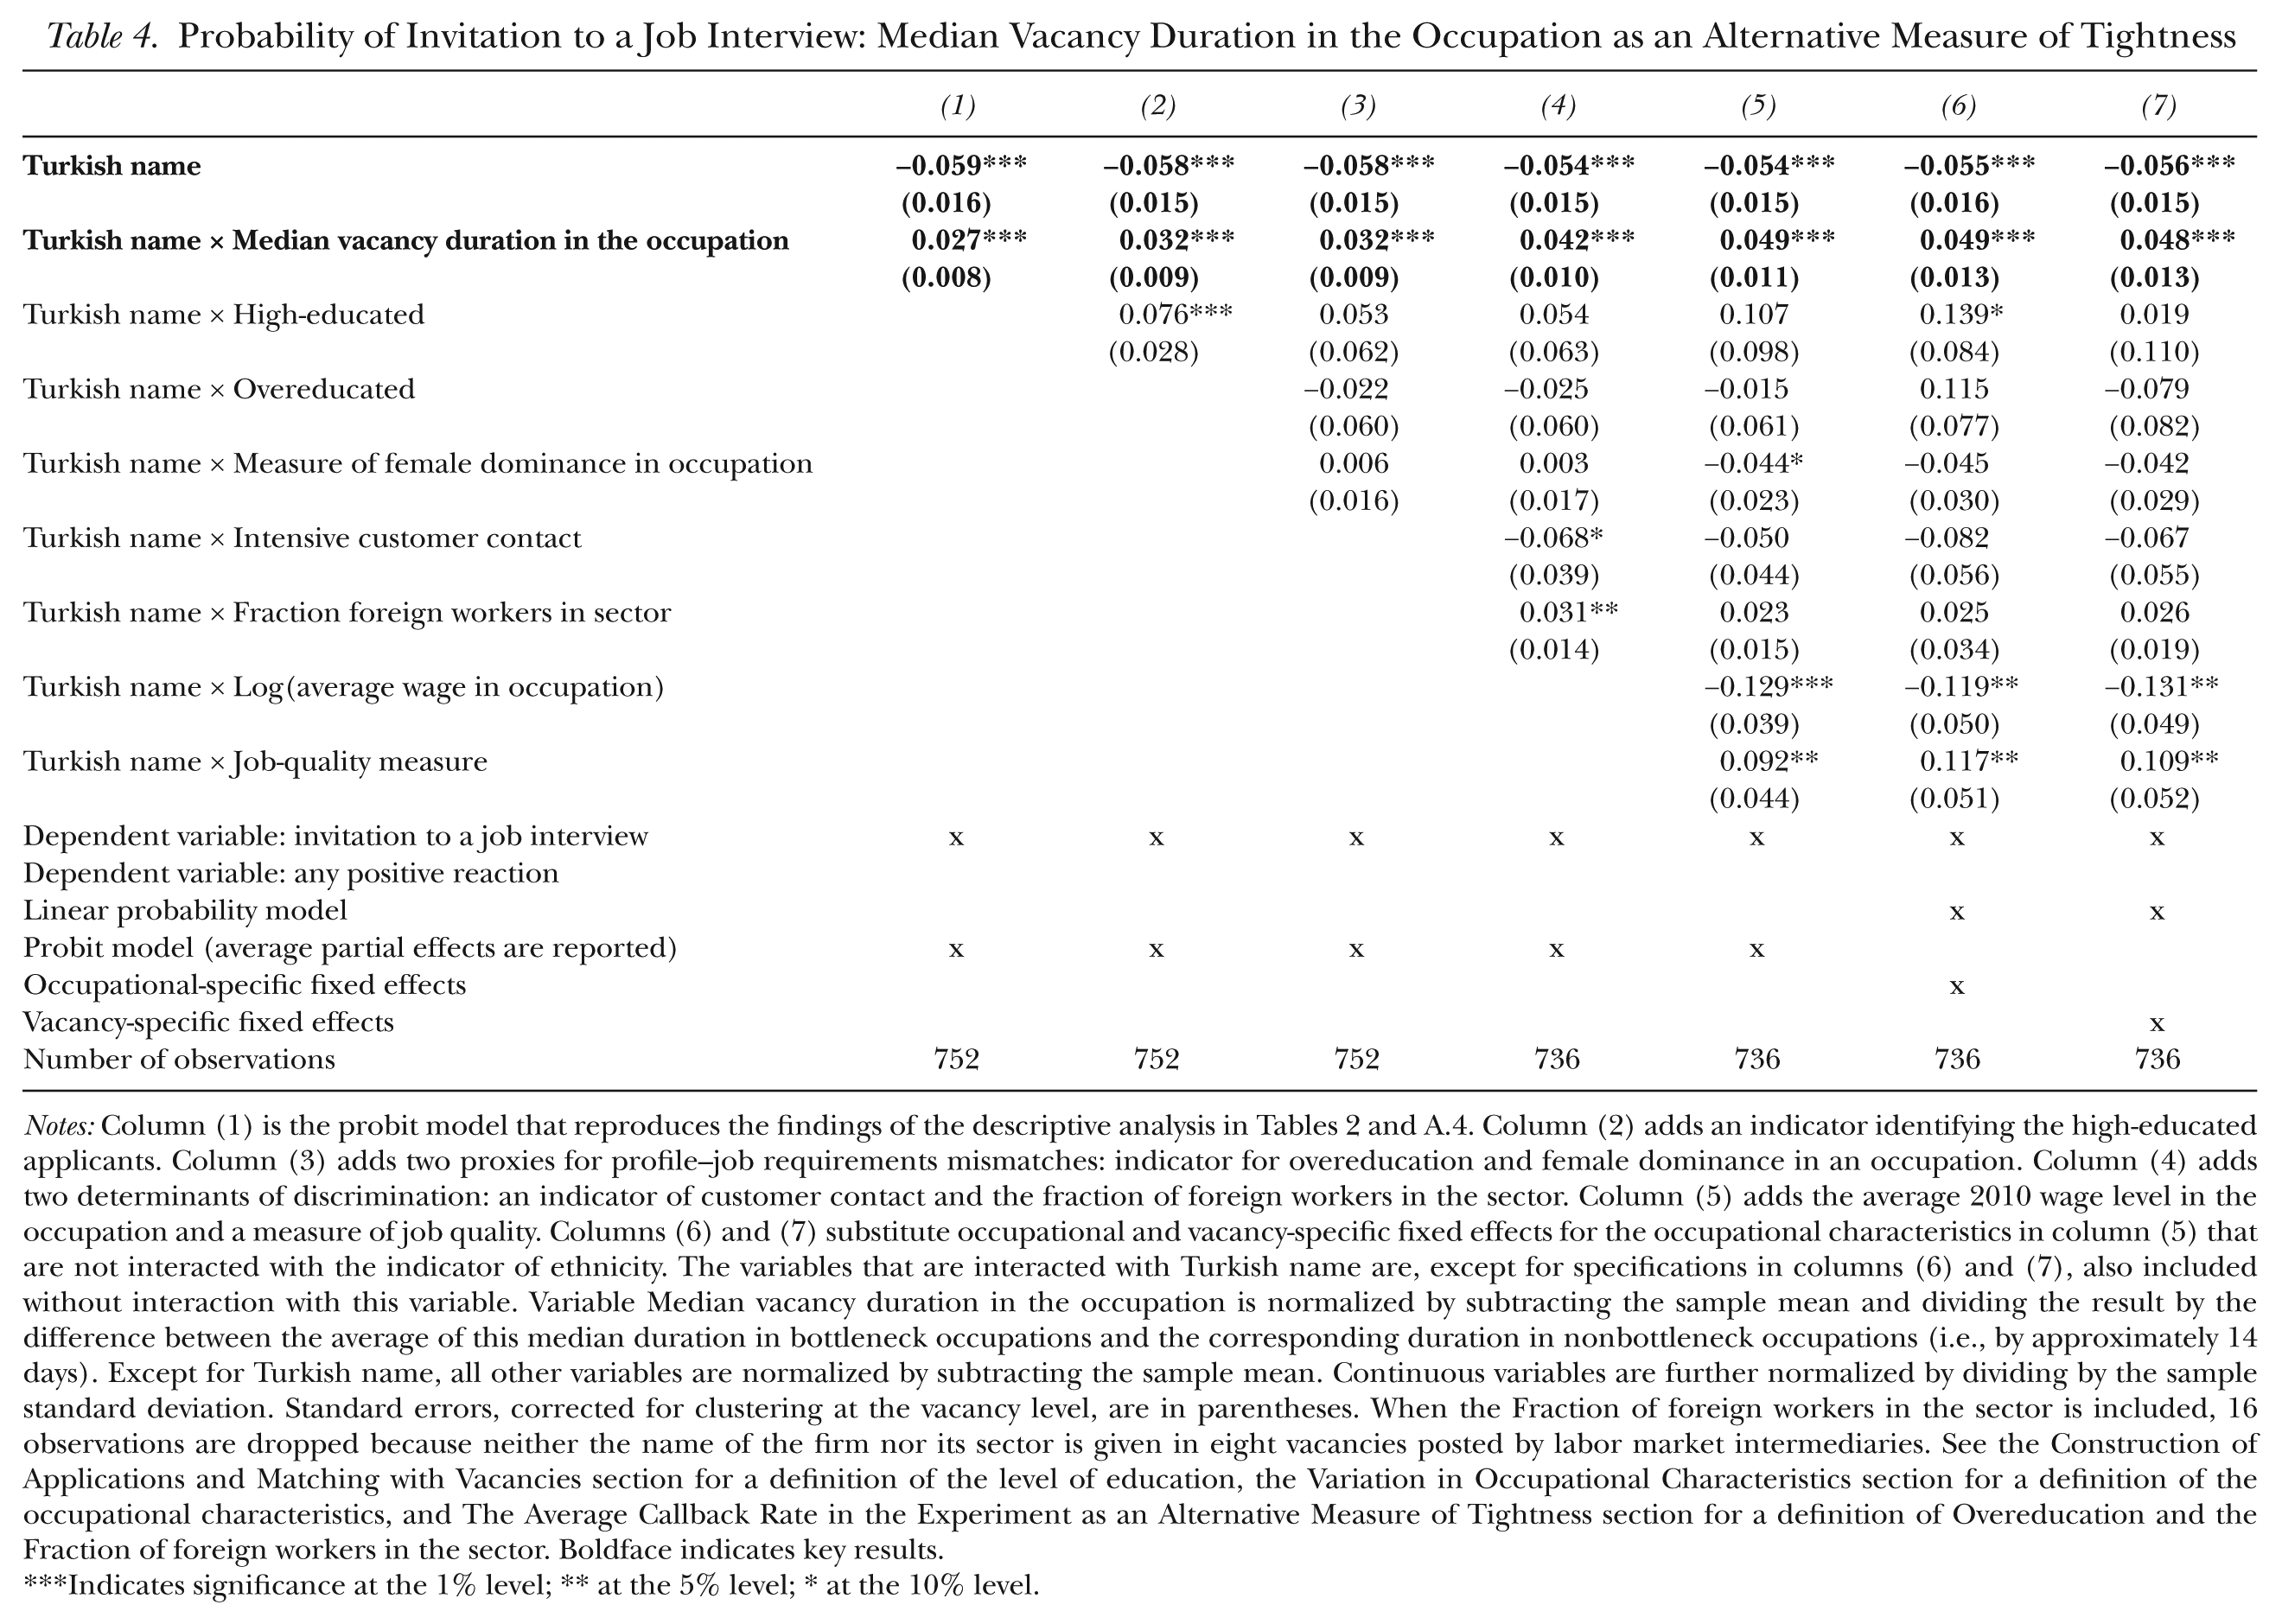
Notes: Column (1) is the probit model that reproduces the findings of the descriptive analysis in Tables 2 and A.4. Column (2) adds an indicator identifying the high-educated applicants. Column (3) adds two proxies for profile–job requirements mismatches: indicator for overeducation and female dominance in an occupation. Column (4) adds two determinants of discrimination: an indicator of customer contact and the fraction of foreign workers in the sector. Column (5) adds the average 2010 wage level in the occupation and a measure of job quality. Columns (6) and (7) substitute occupational and vacancy-specific fixed effects for the occupational characteristics in column (5) that are not interacted with the indicator of ethnicity. The variables that are interacted with Turkish name are, except for specifications in columns (6) and (7), also included without interaction with this variable. Variable Median vacancy duration in the occupation is normalized by subtracting the sample mean and dividing the result by the difference between the average of this median duration in bottleneck occupations and the corresponding duration in nonbottleneck occupations (i.e., by approximately 14 days). Except for Turkish name, all other variables are normalized by subtracting the sample mean. Continuous variables are further normalized by dividing by the sample standard deviation. Standard errors, corrected for clustering at the vacancy level, are in parentheses. When the Fraction of foreign workers in the sector is included, 16 observations are dropped because neither the name of the firm nor its sector is given in eight vacancies posted by labor market intermediaries. See the Construction of Applications and Matching with Vacancies section for a definition of the level of education, the Variation in Occupational Characteristics section for a definition of the occupational characteristics, and The Average Callback Rate in the Experiment as an Alternative Measure of Tightness section for a definition of Overeducation and the Fraction of foreign workers in the sector. Boldface indicates key results.
Indicates significance at the 1% level; ** at the 5% level; * at the 10% level.
The reader might be worried that higher vacancy durations correlate with higher uncertainty for employers about filling their vacancy. If so, the positive relationship between vacancy duration and the callback rate of Turkish candidates may reflect that employers invite minority candidates to an interview to avoid this uncertainty, not because the vacancy is on average difficult to fill. If we also include the standard deviation of the vacancy duration and its interaction with ethnicity in the probit model, however, our reported findings are hardly affected and the coefficients of these new variables are, for most of the alternative specifications, not significantly different from 0. 30
Another concern is that the coefficients of both measures of labor market tightness—the median vacancy duration and the bottleneck status—may be affected by a simultaneity bias. We cannot exclude that vacancy durations are longer because of discrimination. If this were the case, however, the finding of less discrimination for bottleneck occupations would be strengthened because we find a negative relationship, not a positive one, between vacancy duration and discrimination.
The Average Callback Rate in the Experiment as an Alternative Measure of Tightness
As a second robustness check, we follow Kroft, Lange, and Notowidigdo (2013) by using the average callback rate in the experiment by (group of) occupation(s) as an alternative measure of tightness. To that purpose, we estimated the following fixed-effect linear probability model: 31

where yi,o is the discrete indicator of callback for individual i in occupation o, DTi is equal to 1 if the individual i has a Turkish name and 0 otherwise, Xi is the vector of individual characteristics (i.e., the indicators of education and overeducation), Zo is the vector of occupational specific characteristics (which are the same as the ones reported in Table 3), and εi,o is the error term. The parameter
The occupational-group-specific fixed effect
The findings of this analysis are reported in Table 5. In the first row, we report the point estimate on DT
i
in a regression in which the fixed effects are included only in levels. This measures the average discrimination over occupations in the sample, assuming that this discrimination is constant over occupations. This reconfirms that applicants with Turkish-sounding names were very significantly discriminated against on average. The second row shows that we can reject that this discrimination is the same across the retained groups of occupations at a 6.1% level of significance for the narrow callback measure (invitation to a job interview) and at a 0.4% level for the broad callback measure (any positive reaction). The third row shows the bias-corrected estimate of the correlation between the estimates of
Probability of Positive Callback: Average Callback Rate in the Experiment as an Alternative Measure of Tightness
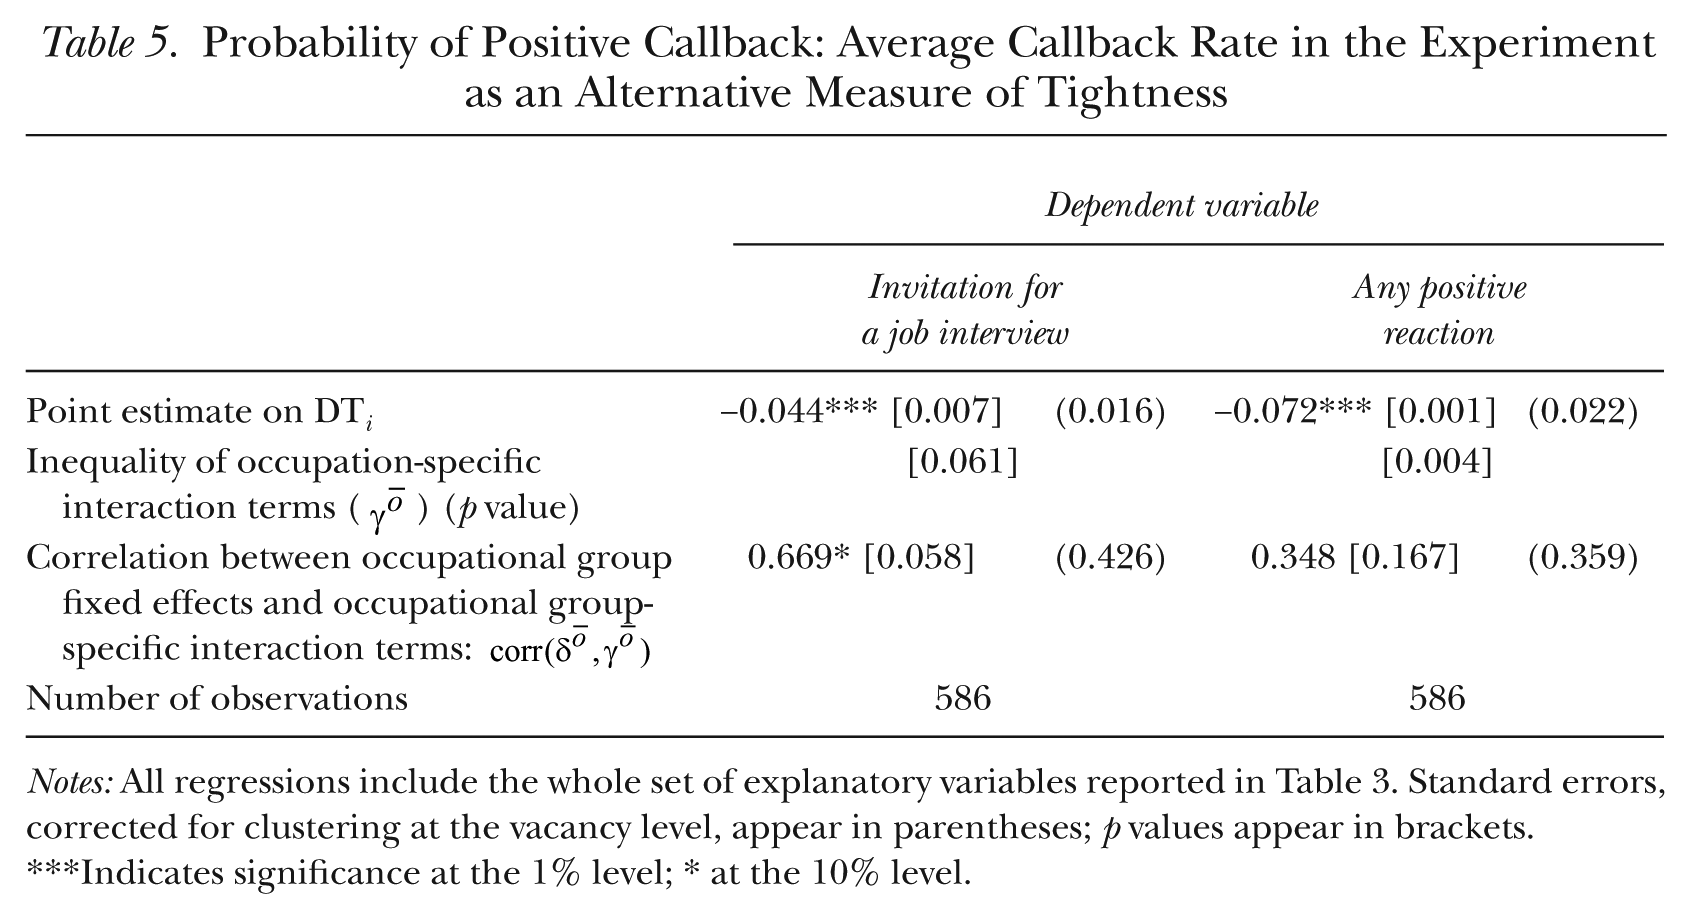
Notes: All regressions include the whole set of explanatory variables reported in Table 3. Standard errors, corrected for clustering at the vacancy level, appear in parentheses; p values appear in brackets.
Indicates significance at the 1% level; * at the 10% level.
Controlling for Ethnic-Group Differences in the Variance of Unobservable Job-Relevant Characteristics
Heckman and Siegelman (1993) showed that not controlling for group differences in the variance of unobservable job-relevant characteristics (and thereby of unobservable determinants of positive callback) can lead to spurious evidence of discrimination. To see this more clearly, assume that both the average observed and unobserved determinants of productivity were the same for Flemish and Turkish candidates for an unfilled vacancy but that the variance of the unobservable job-relevant characteristics was higher for Turkish than for Flemish youth. In addition, suppose that the employer considered the observed determinants of productivity, as inferred from the candidates’ CVs and motivation letters, to be relatively low compared to the job requirements. In that case, the rational employer should invite the Turkish and not the Flemish candidate to an interview because the variance of unobservable job-relevant characteristics is higher for the Turkish than for the Flemish candidates and, therefore, the sum of observed and unobserved productivity is more likely to be higher for the Turkish candidates. A correspondence test that detects discrimination against Turks could therefore underestimate the extent of discrimination. Nevertheless, with other assumptions the bias may be in the opposite direction. Neumark (2012) explicitly addressed this critique and provided a statistical procedure to recover unbiased estimates of discrimination. In what follows, we succinctly describe Neumark’s approach and then apply this method to check the extent to which our conclusions are sensitive to this critique.
As is well known, in a standard probit model only the ratio of the coefficients to the standard deviation of the unobserved residual is identified. In estimations, the standard deviation is usually arbitrarily set to 1. In our case, this means that the variance of unobservable job-relevant characteristics is implicitly assumed to be equal (to 1) for both ethnic groups, which for reasons mentioned before may bias the intensity of discrimination. Neumark (2012) showed, however, that, if researchers observe job-relevant characteristics that affect the native and migrant populations’ propensities to get a callback in the same way, they can identify the ratio of the standard deviation of the unobserved productivity components of these groups. The intuition is that, if in a standard probit the estimated coefficients of these job-relevant characteristics differ by ethnicity, then this must be a consequence of a differential standard deviation because, by assumption, the coefficient of these characteristics should be the same across ethnic groups (and because, as mentioned before, in a probit model only the ratio of the coefficients to the standard deviation is identified).
To implement this idea, we therefore estimated a heteroskedastic probit model in which the variance of the error term is allowed to vary with ethnicity. To identify the heteroskedastic probit model we assumed that 1) the distance between the candidates’ residence and the announced workplace and 2) the particular application profiles, beyond their education level (high- or middle-educated), influenced the callback rates in a similar way for Flemish and Turkish candidates. The hypothesis that the coefficients of these variables are equal across ethnic groups cannot be rejected on the basis of a likelihood ratio test (p-value 0.88 for the narrow callback measure [invitation to a job interview]; 0.87 for the broad callback measure [any positive reaction]).
Table 6 reports the estimation results. In line with Neumark (2012), we obtained a (nonsignificantly) higher estimated variance of the error term for the foreign candidates. The overall average partial effects of the interaction variables of interest are closely comparable to the effects outlined in Tables 3 and A.5. They can be decomposed into two parts: 1) in the partial effect of the variables of interest, holding the variance constant, and 2) in the effect of the variables of interest via their impact on the variances of the unobservables. By disentangling these components, we find that the partial effects on the probability of callback are somewhat larger in magnitude than the ones reported in Tables 3 and A.5. 32 Nevertheless, the differential discrimination rate between bottleneck and nonbottleneck occupations is hardly affected.
Probability of Positive Callback: Heteroskedastic Probit Estimates

Notes: Other controls: indicator of high educational attainment interacted with indicator of Turkish name, indicator of bottleneck occupation, indicator of high educational attainment, normalized variable capturing the distance (in minutes by car) between the announced workplace and the residence of the candidate, and six indicators for the eight application profiles, except one reference profile for both high and middle levels of education. Standard errors, corrected for clustering at the vacancy level and calculated using 500 bootstrap replications, are in parentheses.
ln (σT / σF) stands for the natural logarithm of the ratio between the standard deviation of unobservables for the Turkish and the Flemish subpopulations.
Indicates significance at the 1% level; ** at the 5% level.
Conclusion and Discussion
To the best of our knowledge, this is the first empirical study of the relationship between labor market discrimination and labor market tightness. Theory predicts that, if employers have difficulties in filling a vacancy, their refusing to hire a minority worker is extra-costly in terms of forgone output because they risk having the vacancy remain vacant for a long time. In the correspondence test that we conducted, applicants with Turkish-sounding names were no longer discriminated against when they applied for occupations that had recruitment difficulties. In contrast, when they applied for occupations for which plenty of candidates applied, they had to send out twice as many applications as candidates with Flemish-sounding names to be invited to a job interview. These results were found to be robust in a number of sensitivity analyses. They suggest that ethnic discrimination is a second-order motive. Employers discriminate against foreign minorities when this does not interfere with their first motive—profit maximization.
Notice that the arguments explaining why we should expect less discrimination in occupations for which recruitment is difficult are analogous to the ones used by Blanchard and Diamond (1994) in their ranking model to rationalize why long-term unemployed applicants are more likely than short-term unemployed applicants to be recruited in a tight labor market. In this model, the firm meets multiple workers and hires the one with the shortest unemployment duration. But because in a tight labor market employers have fewer candidates for each vacancy, long-term unemployed applicants face less competition from short-term unemployed applicants and have more chance of being offered a job. Similarly, employers may rank job applicants according to their minority status because they dislike minority workers (taste-based discrimination) or because they expect these workers to be less productive on average (statistical discrimination). In a tight labor market, then, minority workers are, by analogy with the long-term unemployed in Blanchard and Diamond (1994), more likely to be successful in their job search.
Other theoretical frameworks to which we can compare our results are screening models (Vishwanath 1989; Lockwood 1991). In these models, unemployment duration is used as a signal of the unobserved productivity of unemployed workers. When the labor market is tight, this signal is more informative than when it is not because the most productive workers are hired before they have a chance to become long-term unemployed. Hence, a long unemployment duration signals low quality. By contrast, in a downturn unemployment duration is less informative about the average quality of workers because then the more productive workers may also be long-term unemployed. Consequently, negative duration dependence in the job-finding rate is pro-cyclical. Kroft et al. (2013) provided empirical evidence for this hypothesis. As in case of the ranking model, researchers could be tempted to argue that a model of statistical discrimination, in which minority status instead of unemployment duration signals the average quality of applicants, is analogous to this screening model and therefore expect worse outcomes for ethnic minorities in occupations with recruitment problems. Following this analogy, statistical discrimination would predict the opposite relationship between discrimination and labor market tightness than the one we found. But this analogy is not valid. As previously explained, in case of unemployment duration the quality of the signal is affected by tightness. By contrast, the minority status is an immutable characteristic that does not depend on the state of the economy. When unemployment is high, productive workers are not more likely to have a minority status, in contrast to the likelihood of productive workers being long-term unemployed applicants.
The strong negative cross-sectional relationship between discrimination in hiring and recruitment difficulties that we found does not necessarily mean that tightness causes less discrimination. Labor market tightness might even reflect more discrimination in wages and working conditions by occupational segregation if vacancies are difficult to fill as a consequence of low wages and bad working conditions in these occupations. We acknowledge that this interpretation cannot be excluded, even though our findings are robust for the inclusion of indicators of wages and working conditions at the occupational level. This is because these indicators reflect averages within occupations that need not necessarily reflect the true wages and conditions in the jobs to which the fictitious candidates in our experiment applied.
These limitations call for further research. One option is to exploit geographical variation in labor market tightness, as Kroft et al. (2013) did, to study the cyclical sensitivity of the duration dependence in the job-finding rate. In this case, the challenge will be to prove that the geographical variation in tightness is not correlated with geographical variation in discriminatory attitudes of employers or that local tightness reflects concentrations of occupations with bad working conditions. Similar problems will show up if researchers try to exploit the time variation in labor market tightness. The identification of a causal effect clearly requires some exogenous variation in tightness, such as could be caused by variation in legal-training requirements in particular professions or by variations in labor demand or supply (e.g., as caused by the Mariel boatlift, a 1980 declaration by Fidel Castro allowing Cubans to temporarily freely emigrate to the United States, on the Miami labor market; Card 1990). Moreover, to identify the causal effects on discrimination in a difference-in-differences approach, correspondence tests targeting the relevant populations should already be set up before the exogenous shock comes about. This would clearly be difficult because exogenous shocks cannot, by definition, be anticipated.
Footnotes
Appendix A
Appendix B
Acknowledgements
We thank the editor and three anonymous referees for their constructive comments, which helped us to improve the quality of our manuscript. In addition, we are grateful to Michèle Belot, Bart Capéau, Sabien Dobbelaere, Steven Groenez, Daniel Hamermesh, Boris Hirsch, Jozef Konings, Arno Riedl, Koen Schoors, Walter Van Trier, Dieter Verhaest, Elsy Verhofstadt, and the seminar participants at Ghent University, Tilburg University, the European Network on Transitions in Youth Workshop 2012, the Institute for Employment Research (IAB) conference on Field Experiments in Policy Evaluation, and the Potsdam PhD Workshop in Empirical Economics 2013 for their insightful comments and suggestions, which have helped to improve this study considerably. In addition, we are grateful to the Public Employment Agency of Flanders (VDAB) and the Policy Research Centre Work and Social Economy for the provided statistics.
The present research was reviewed and approved by the Ethical Affairs Committee of the Faculty of Economics and Business Administration of Ghent University.
A data appendix with copies of the computer programs used to generate the results presented in the article is available from the first author at
1
![]() criticized this theory. She argued that it hinges on the assumptions “(1) that there are large numbers of people who are willing and able to openly violate social customs, which they themselves support and enjoy, for purposes of making money, (2) that violating customs does not entail costs that cancel out the advantage of cheap wages, and (3) that competition is intense enough to put out of business those who refrain from violating customs” (ibid.: 50).
criticized this theory. She argued that it hinges on the assumptions “(1) that there are large numbers of people who are willing and able to openly violate social customs, which they themselves support and enjoy, for purposes of making money, (2) that violating customs does not entail costs that cancel out the advantage of cheap wages, and (3) that competition is intense enough to put out of business those who refrain from violating customs” (ibid.: 50).
2
Also, in the case of coworker discrimination, competitive forces eliminate wage discrimination but lead at the same time to a completely segregated workforce. In this situation, workers belonging to the majority group feel an aversion for working with members of the minority group. Employers therefore need to compensate workers belonging to the majority group. In a perfectly competitive environment, this can be financed only by a lower wage for the minority workers. But under perfect competition, free entry of firms and perfect mobility of workers result in a completely segregated workforce in which both groups of workers are paid their marginal product (![]() : 261).
: 261).
3
Biddle and Hamermesh (2013) stated this result only in words, but it can be formally found by differentiating their Equation (9), modeling the degree of discrimination, with respect to their indicator for labor market tightness φ, the rate at which workers arrive at employers. We elaborate more on this differentiation in the online appendix, ![]() .
.
4
See, e.g., Ashenfelter and Hannan (1986); Peoples and Saunders (1993); Black and Strahan (2001); Hellerstein, Neumark, and Troske (2002); Black and Brainerd (2004); and, more recently, based on correspondence testing, ![]() .
.
5
6
Belgium is a federal state consisting of three regions: Flanders, Wallonia, and Brussels. In Flanders, the official language is Dutch; in Wallonia, it is French; and in Brussels, both languages are spoken.
7
Bergmann (1989) argued that women are extensively discriminated against by discrimination in wages and working conditions by occupational segregation. Bulow and Summers (1986) rationalized this type of wage discrimination through occupational segregation in a dual labor market model in which minority workers differ from the majority group in a dimension that is unrelated to productivity, such as a higher propensity to leave the job or liquidity constraints. Recently ![]() built and estimated an equilibrium search model allowing for firm-aside-worker heterogeneity. This enabled researchers to disentangle discrimination induced by segregation from discrimination induced by between-group differences in friction patterns.
built and estimated an equilibrium search model allowing for firm-aside-worker heterogeneity. This enabled researchers to disentangle discrimination induced by segregation from discrimination induced by between-group differences in friction patterns.
8
In 2007, just before the Great Depression, this gap was 11.7 percentage points. This evidence for Belgium is in line with higher relative unemployment rates among ethnic minorities in economic downturns as found by ![]() and at least superficially consistent with higher discrimination rates in loose labor markets.
and at least superficially consistent with higher discrimination rates in loose labor markets.
9
10
This degree is among the highest that migrants obtained in Flanders (Duquet, Glorieux, Laurijssen, and Van Dorsselaer 2006).
11
12
This choice was made to maximize the callback rate because interviews with human resources managers revealed that filled vacancies were not always immediately removed from the PES database.
13
Data from Eurostat.
14
Based on frequency data on first names and surnames, we chose “Thomas Mertens” and “Jonas Vermeulen” as the Flemish-sounding names and “Emre Sahin” and “Okan Demir” as the Turkish-sounding names. We checked that these names were not stereotypes. Assigning different pairs of names to the middle- and high-educated individuals allowed both categories of individuals to apply for vacancies listed by the same employer without risking detection.
15
Note that restricting the analysis to school-leavers has an advantage from a methodological point of view. Controlling for human capital is easier because we need not take labor market experience (beyond student work) into account.
16
To be as realistic as possible, we adapted the templates that the PES posts on its website as examples for job seekers.
17
This occupation classification is a at the five-digit level. The PES classifies occupations in bottleneck and nonbottleneck occupations at this level.
18
This measure is reported by the PES. It reports the share of women among all registered unemployed desiring this occupation in 2011.
19
Data from Directorate-General Statistics and Economic Information of Belgium. These averages are not measured for the occupational classification of the PES but for the International Standard Classification of Occupations (ISCO)-08 classification at three-digit level, which is closely related to the former classification. We used the 2010 statistics because those of later years are not yet available.
20
This measure was constructed on the basis of the 3,442 employed Belgians responding to the fifth European Working Conditions Survey conducted in 2010. Following ![]() , we combined the answers to a set of questions in this survey to three job-quality measures (with values between 0 and 1) at the ISCO-08 occupational classification three-digit level, capturing: 1) prospects, 2) intrinsic job quality, and 3) working-time quality. These measures were then aggregated into one measure by taking their mean.
, we combined the answers to a set of questions in this survey to three job-quality measures (with values between 0 and 1) at the ISCO-08 occupational classification three-digit level, capturing: 1) prospects, 2) intrinsic job quality, and 3) working-time quality. These measures were then aggregated into one measure by taking their mean.
21
We acknowledge that these mismatches are flaws in the design of our experiment.
22
We applied the following aggregation rule. Occupations with strictly more than 20 applicants were not grouped. The other occupations were grouped, keeping bottleneck and nonbottleneck occupations segregated, and not aggregating occupations that differed in the first two digits according to the PES occupational classification. Occupations for which this aggregation procedure did not yield more than 20 applicants were dropped from the analysis; 154 of the 752 observations were dropped for this reason.
23
Taubman and Wales (1974) argued that higher education can act as a prejudice-reducing screening device. In addition, if the level of education is reflected in the value of the worker’s product, we can use the model of ![]() to show that discrimination decreases with the level of education. Clearly from their Equation (9), c* increases and, hence, discrimination decreases with the worker’s product (i.e., with x). This is because the opportunity cost of an unfilled vacancy increases with x.
to show that discrimination decreases with the level of education. Clearly from their Equation (9), c* increases and, hence, discrimination decreases with the worker’s product (i.e., with x). This is because the opportunity cost of an unfilled vacancy increases with x.
24
See Bursell (2007); Carlsson and Rooth (2007); and ![]() .
.
25
These partial effects are not reported in the tables. They are equal to −0.017 (0.042) for the narrow callback measure (invitation to a job interview) and 0.014 (0.050) for the broad callback measure (any positive reaction).
26
27
To our knowledge, these data are not available at the firm level in Belgium. This variable was constructed by first identifying the sector of the employer that posted the vacancy. We did this by linking, on the basis of the online database of the Flemish business magazine Trends, the name of the employer to the sector. Then we merged this information with the fraction of workers with a non-Western nationality in the corresponding sector (two-digit level) in Flanders on December 31, 2009 (data from Datawarehouse of the Belgian federal public service of social security). Note that this proxy is also imperfect in the sense that all candidates in our empirical setting had Belgian nationality.