






Abstract
To monitor trends in alternative work arrangements, the authors conducted a version of the Contingent Worker Survey as part of the RAND American Life Panel in late 2015. Their findings point to a rise in the incidence of alternative work arrangements in the US economy from 1995 to 2015. The percentage of workers engaged in alternative work arrangements—defined as temporary help agency workers, on-call workers, contract workers, and independent contractors or freelancers—rose from 10.7% in February 2005 to possibly as high as 15.8% in late 2015. Workers who provide services through online intermediaries, such as Uber or TaskRabbit, accounted for 0.5% of all workers in 2015. Of the workers selling goods or services directly to customers, approximately twice as many reported finding customers through off-line intermediaries than through online intermediaries.
Keywords
Monitoring changes in the pace and nature of work relationships is crucial to understanding the forces affecting the US economy and the quality of life of American workers. Yet the U.S. Bureau of Labor Statistics (BLS) had been unable to conduct the Contingent Work Survey (henceforth, the CWS), its main survey instrument for tracking alternative (or nonstandard) work relationships in the United States since 2005, up to the time this project was started in 2015. And they had no plans at that time to carry out another CWS supplement to the Current Population Survey (CPS). To fill this void, we conducted the RAND-Princeton Contingent Worker Survey (RPCWS), a version of the CWS, as part of the RAND American Life Panel (ALP) in October and November of 2015. 1 This article provides an analysis of the data from the RPCWS. Our findings point to a possibly substantial rise in the incidence of alternative work arrangements for US workers from 2005 to 2015, with a particularly sharp increase in the share of workers being hired through contract firms.
Prior evidence has shown mixed signs of a major change in the nature of US employment relationships over the past decade or so. Bernhardt (2014: 15), for example, concluded that “it has been hard to find evidence of a strong, unambiguous shift toward nonstandard or contingent forms of work—especially in contrast to the dramatic increase in wage inequality.” The U.S. Government Accountability Office (2015) analyzed data from the General Social Survey (GSS) and CWS and found that an expansive definition of alternative work arrangements, which includes part-time employees, increased from 35.3 to 40.4% of employment from 2006 to 2010. Using a definition of alternative work more closely aligned to CWS and more years of GSS data, Abraham, Haltiwanger, Sandusky, and Spletzer (2017) found that alternative work rose from 19.2% of the workforce in 2002 to 20.4% in 2014, with little change in the share of independent contractors.
A comparison of our survey results from the 2015 RPCWS to the 2005 BLS CWS indicates that the percentage of workers engaged in alternative work arrangements—defined as temporary help agency workers, on-call workers, contract company workers, and independent contractors or freelancers—rose from 10.7% in February 2005 to somewhere in the 12.6 to 15.8% range in late 2015. The increase over the past decade is particularly noteworthy given that the BLS CWS showed a more modest rise in the percentage of workers engaged in alternative work arrangements from 1995 to 2005. Our survey results further show that about 0.5% of workers indicated in late 2015 that they were working through an online intermediary, such as Uber or TaskRabbit, consistent with estimates derived by Harris and Krueger (2015) from Google search data and by Farrell and Greig (2016a) from bank deposits. Thus, the online gig workforce is relatively small compared to other forms of alternative work arrangements, although it is growing very rapidly. 2
In this article we describe the survey we conducted through the RAND ALP in greater detail and document the changing nature of work relationships by demographic group and other characteristics of workers and jobs. We analyze the wages, weekly earnings, and work hours of those who are employed in alternative work arrangements in comparison to those in traditional employment relationships, as well as the reported preferences for type of work (e.g., regularly scheduled hours, permanent job) of those engaged in alternative work arrangements. We conclude with a discussion of the possible forces behind the recent rise in alternative work arrangements.
In an Addendum following our main text, we provide a comparison and reconciliation of our findings from the 2015 RAND survey with those from the 2017 CWS and provide an updated assessment of trends in US alternative work arrangements. As explained in the Addendum, a higher incidence of alternative work arrangements in the 2015 RPCWS than in the CWS can largely be accounted for by three factors: 1) cyclical conditions (i.e., a tighter labor market in 2017 than in 2015); 2) differences in survey methods (the use of self-responses only in the RPCWS versus half the responses being from proxy respondents in the CPS CWS); and 3) sampling issues with respect to the RAND web panel, which generated an apparent oversample of multiple jobholders in the RPCWS. After adjusting for these factors, the RPCWS suggests a 1 to 2 percentage point increase in the share of workers in alternative work from 2005 to 2015, instead of the 5 point upper-bound increase we report in this article.
The RAND-Princeton Contingent Work Survey
In the summer of 2015, we contracted with the RAND Institute to implement a stand-alone survey of alternative work arrangements to individuals in its American Life Panel on our behalf. The core of the questionnaire was based on the BLS’s CWS. The BLS’s CWS collects information about alternative work arrangements for each individual’s main job, and we sought to follow this practice. The CWS also imposes a hierarchical skip logic that we did not follow so that we could gather more complete information on work arrangements. (For example, in the CWS, if a worker is on a temporary help or on-call job, she is not asked whether she is a freelancer, whereas we asked workers on temporary help and on-call jobs if they were independent contractors or freelancers.) Nevertheless, we impose the BLS’s classification hierarchy in our analysis below to make the results as comparable as possible. 3 We augmented the survey to include questions on whether workers sold services or goods directly to customers, and, if so, whether they worked through an intermediary, such as Avon or Uber. A copy of the questionnaire is posted online and can be downloaded from https://alpdata.rand.org/index.php?page=data&p=showsurvey&syid=441.
The survey was conducted online between October 19, 2015, and November 4, 2015. A total of 6,028 subjects were invited to fill out the questionnaire, and a total of 3,850 completed the questionnaire, for a response rate of 63.9%. The ALP sample was recruited using a compilation of methods, including a group recruited for the University of Michigan Internet panel, a random-digit dial sample, and a snowball sample. 4 RAND developed and provided a set of survey weights to align the sample to the Current Population Survey (CPS) according to age, gender, race/ethnicity, education, and household income groups. 5 We further adjusted the weights to account for the over-representation of self-employed workers in the ALP.
One possible concern is that the BLS CWS was conducted in February of each year, and our RPCWS was conducted in October and November. We have examined historical CPS data, however, and found no evidence of systematic seasonality between February and October or November in the share of workers who are self-employed or multiple jobholders. Historical BLS establishment survey data indicate modestly greater seasonality in temporary help services employment than in total payroll employment. 6 The overall patterns suggest that seasonality is unlikely to noticeably distort the observed pattern in alternative work arrangements when we compare the CPS and RAND surveys. Another difference between the surveys we address below is that half of the respondents in past CPS CWS surveys were proxy respondents, whereas everyone in the RPCWS responded for themselves.
Table 1, column (1) reports descriptive statistics of workers based on the October 2015 CPS as a benchmark against which to assess the RAND ALP sample of workers. 7 Corresponding estimates from the RPCWS are presented in the next three columns. Column (2) provides unweighted estimates, column (3) provides estimates using the weights RAND provided, and column (4) (labeled Altwt) provides estimates for which we adjusted the RAND sample weights to down-weight the self-employed. Throughout the remainder of the article we emphasize results using the adjusted weights. In some cases, we also report results weighted by the original RAND sample weights for comparison.
Characteristics of Employed Workers (Those Who Worked in the Survey Week)
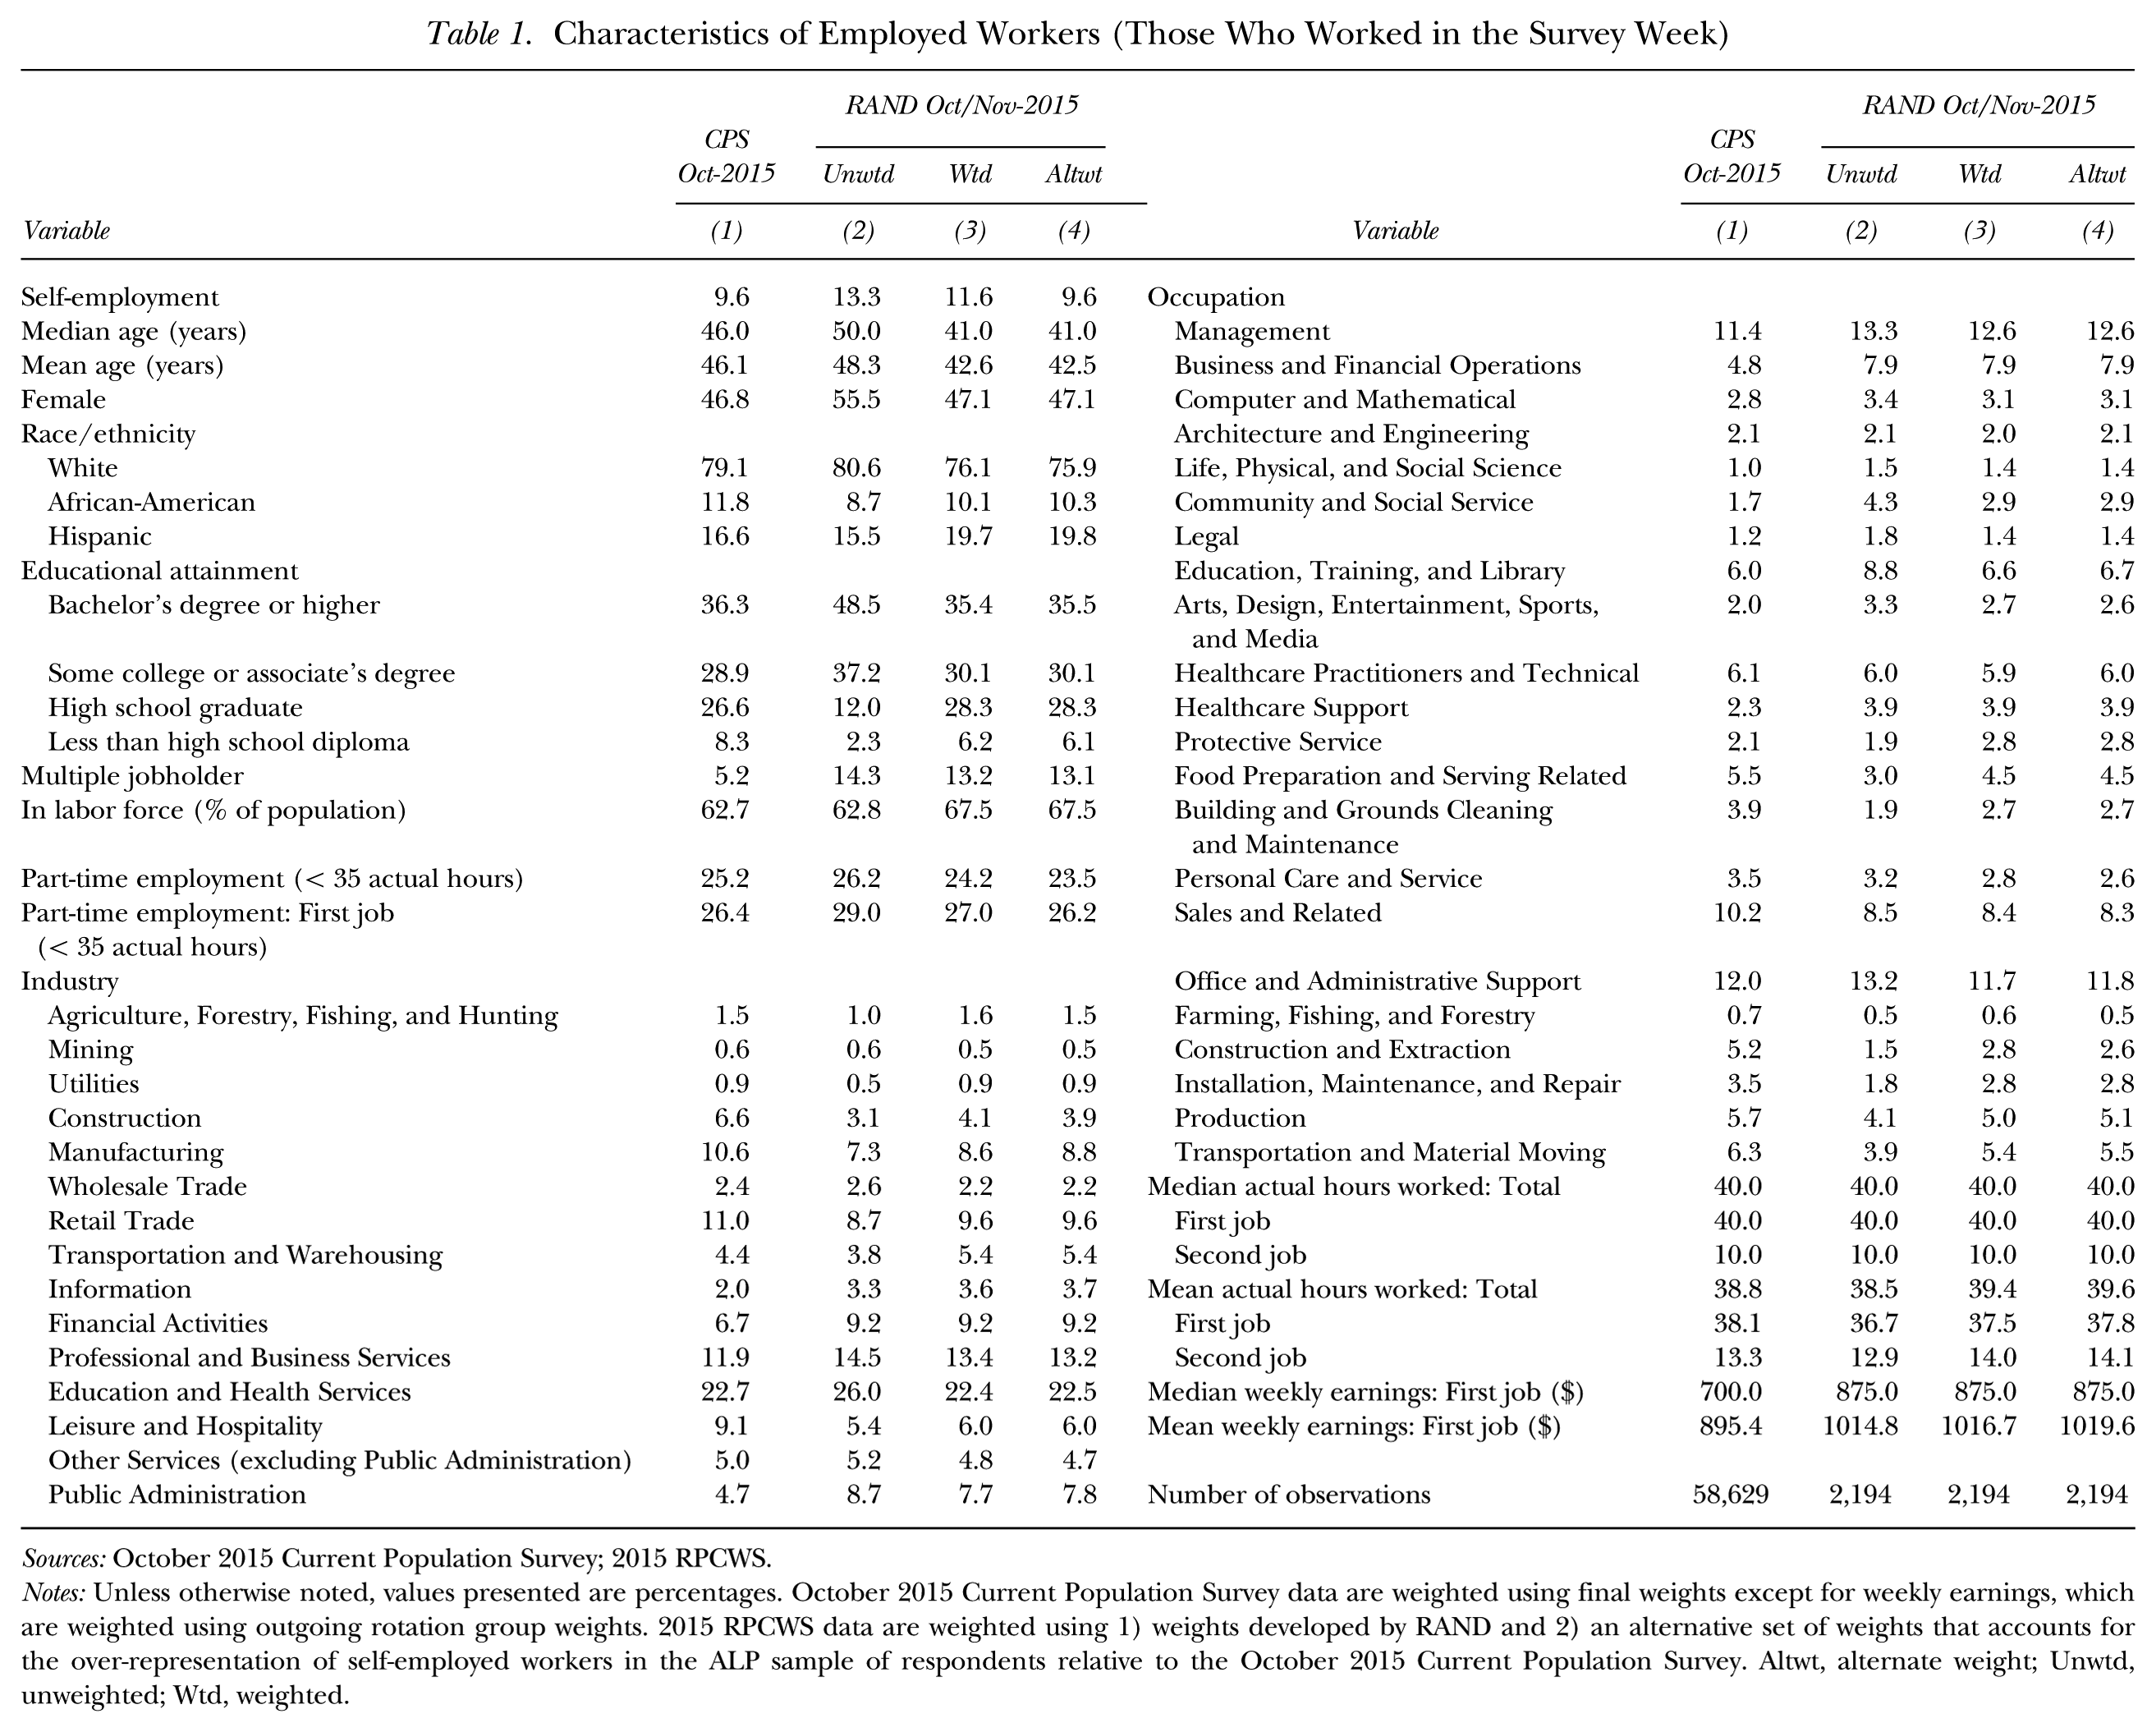
Sources: October 2015 Current Population Survey; 2015 RPCWS.
Notes: Unless otherwise noted, values presented are percentages. October 2015 Current Population Survey data are weighted using final weights except for weekly earnings, which are weighted using outgoing rotation group weights. 2015 RPCWS data are weighted using 1) weights developed by RAND and 2) an alternative set of weights that accounts for the over-representation of self-employed workers in the ALP sample of respondents relative to the October 2015 Current Population Survey. Altwt, alternate weight; Unwtd, unweighted; Wtd, weighted.
Although the weighted RPCWS sample is a bit younger, on average, it is broadly similar to the US workforce as represented by the October CPS. 8 The RPCWS sample is about equally likely to work part-time as the CPS sample but is approximately 8 percentage points more likely to hold more than one job (5.2% compared to 13.1%). The weighted industry and occupation distributions of the two samples are similar, however, even though these variables were not used in the construction of sample weights. Nevertheless, the RPCWS sample members reported considerably higher weekly earnings than did the CPS respondents.
The comparisons of the sample summary statistics for the RWCPS and October CPS raise potential concerns about the representativeness of the RWCPS respondents relative to the CPS. To probe the robustness of our conclusions, we take steps to ensure that the particular nature of the RAND ALP sample is not driving our main conclusions, such as checking the sensitivity of our findings to dropping multiple jobholders. In the Addendum, we explore the robustness of our findings to further adjusting the RAND sampling weights to also take into account the higher rate of multiple jobholding in the RWCPS than in the October CPS.
Basic Findings on the Incidence of Alternative Work Arrangements
Table 2 reports the percentage of individuals who were employed in an alternative work arrangement based on the 1995 and 2005 CPS CWS and our 2015 RAND survey. 9 (The sum of the alternative work categories does not necessarily equal the figure in the first row because of rounding and because a small number of individuals are both on-call and contract workers in the BLS CWS.) “Independent contractors” are individuals who report they obtain customers on their own to provide a product or service to as an independent contractor, independent consultant, or freelance worker. “On-call workers” report having certain days or hours in which they are not at work but are on standby until called to work. “Temporary help agency workers” are paid by a temporary help agency. “Workers provided by contract firms” are individuals who worked for a company that contracted out their services during the reference week. 10
Alternative Work Arrangements (Percentage of Employed Who Also Worked During Survey Week)
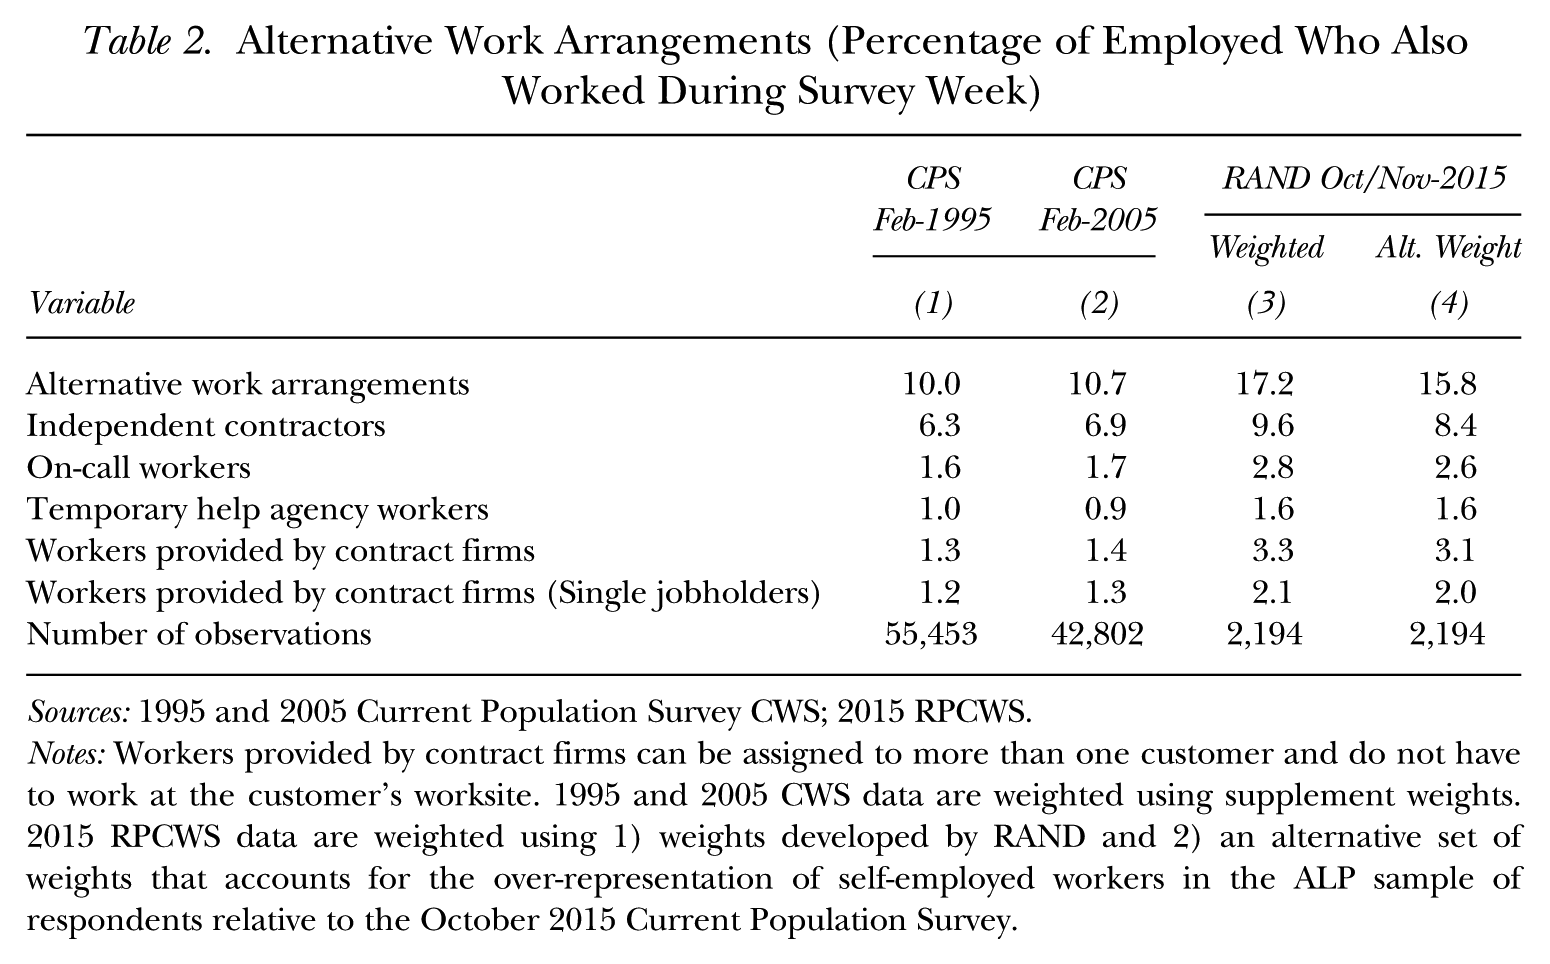
Sources: 1995 and 2005 Current Population Survey CWS; 2015 RPCWS.
Notes: Workers provided by contract firms can be assigned to more than one customer and do not have to work at the customer’s worksite. 1995 and 2005 CWS data are weighted using supplement weights. 2015 RPCWS data are weighted using 1) weights developed by RAND and 2) an alternative set of weights that accounts for the over-representation of self-employed workers in the ALP sample of respondents relative to the October 2015 Current Population Survey.
The CPS CWS values in Table 2 (and throughout the rest of the article) were computed to be as comparable as possible to the RPCWS sample. Of most importance, in both samples, we excluded the small number of day laborers from the alternative work category, and we imposed the sample restriction that individuals must have worked in the survey reference week. Nevertheless, our CPS CWS tabulations are close to the BLS published numbers for 1995 and 2005, and they match exactly if we do not impose these restrictions. 11
The RPCWS data indicate a significant rise in the incidence of alternative work arrangements from the 10.7% share in the CPS CWS in 2005. Using the weights that RAND provided, 17.2% of all workers were employed in alternative work arrangements in 2015, although that figure is probably overstated because of the over-representation of self-employed workers in the ALP sample. If we instead use the alternative weights, which down-weight the self-employed to match the October 2015 CPS, the figure is 15.8%, still a substantial rise (and, as expected, the share of independent contractors is most notably affected by the alternative weights). Thus, using the alternative weights, we conclude that the share of workers in alternative work arrangements in their main job increased by 5.1 percentage points (or by nearly 50%) from 2005 to 2015. In the Addendum, we show that if we further adjust the RPCWS sampling weights to account for the higher incidence of multiple jobholding than in the CPS, then we find the overall share of workers in alternative work arrangements to be 13.7% in October 2015, indicating a more modest increase of 2.9 percentage points (27%) from 2005 to 2015.
Table 2 further indicates that all four categories of nonstandard work increased from 2005 to 2015. Independent contractors continue to be the largest group (8.4% in 2015), but the share of workers in the three other categories nearly doubled, from 4.0% in 2005 to 7.3% in 2015. The fastest growing category of nonstandard work involves contracted workers. The percentage of workers who report that they worked for a company that contracted out their services in the preceding week rose from 1.4% in 2005 to 3.1% in 2015. 12 Because of the concern previously noted that the RAND sample over-represents multiple jobholders, who possibly could be more likely to report contract work, in the bottom of Table 2 we exclude multiple jobholders. Even in this restricted sample there was still a notable rise in the percentage of workers who were contracted out from 1.3% in 2005 to 2.0% in 2015. Alternatively, as shown in the Addendum, if we reweight the RPCWS to account for the higher rate of multiple jobholding, we similarly find a large rise in contracted-out workers from 1.4% in 2005 to 2.5% in 2015. The different adjustments for the over-representation of multiple jobholders in the RPCWS suggest that a sharp rise in contracted-out workers is a robust finding.
Approximately half of the respondents in the CPS CWS were proxy respondents (51.1% in 1995 and 50.1% in 2005), whereas all participants in the RPCWS responded on their own behalf. The difference in survey procedures could influence the comparison between CPS CWS and RPCWS. Proxy respondents were about 2 percentage points less likely to report being in an alternative work arrangement than were self-respondents in both the 1995 and 2005 CPS CWS surveys. It is not clear if the survey mode has a causal effect on responses, or if the differences between proxy respondents and self-responders in the CPS reflect selection with self-responders being more likely to be engaged in an alternative work arrangement (perhaps because they are more likely to work from home, and therefore to self-respond as self-employed when an interviewer visits their home or calls). The 2 percentage point differential persists when we control for respondents’ educational attainment, experience, race, and sex in a linear probability model. If the 2 percentage point differential is interpreted as a mode effect, then the fact that half of CPS respondents are proxy respondents could account for 1 percentage point of the 5 percentage point rise in the share of workers in alternative work between the 2005 CPS CWS and 2015 RPCWS, or 20% of the increase in alternative work over the past decade. This calculation is likely to provide an upper-bound estimate of the impact of survey mode since self-respondents may truly be more likely than proxy respondents to be engaged in alternative work.
A lower-bound estimate of the share of workers employed in alternative work arrangements in 2015 can be derived by combining the proposed upper-bound adjustment for survey mode of 1 percentage point with an adjustment for the greater seasonality of temporary help agency employment of 0.1 percentage point (7% of the 1.6 percentage point share in the 2015 RWCPS) and with a 2.1 percentage point adjustment from the Addendum for the over-sampling of multiple jobholders. The overall 3.2 percentage point downward adjustment of the RWCPS share to increase comparability with the CWS implies a lower-bound estimate of the growth in the alternative work arrangements share from 10.7% of all workers in 2005 to 12.6% in 2015.
Corroborating Evidence from the Internal Revenue Service
The rise in alternative work arrangements evident in Table 2, especially the increase in the share of workers who indicated they were “working or self-employed as an independent contractor, an independent consultant, or a freelance worker” from 6.9% in 2005 to 8.4% in 2015, is a stark contrast to the declining trend in the share of employees who indicate they are self-employed based on published CPS data. If self-employment were truly waning, one would not expect to find a rise in independent contractors, and that trend was even evident (although milder) in the 1995 and 2005 CWS as well.
Figure 1 provides some further evidence on this issue by utilizing Internal Revenue Service (IRS) data on the number of tax returns that were filed containing Schedule C (Form 1040), which is used to report income (or losses) individuals earn from operating a business or practicing a profession as a sole proprietor. In other words, individuals file Schedule C with the IRS to report income related to self-employment activities. Figure 1 reports the number of Schedule C filers relative to total employment from the CPS each year from 1979 through 2014 as well as the number of unincorporated self-employed individuals according to the CPS relative to total CPS employment, and the total number of self-employed individuals according to the CPS relative to total CPS employment since 2000. 13 (Incorporated self-employed individuals should file a corporate income tax form, not Schedule C.) The IRS and CPS data show divergent trends in the number of self-employed individuals. Although the proportion of employees who were self-employed was similar in the CPS and IRS data in 1979, the CPS data show a declining trend while the IRS data show a rising trend.
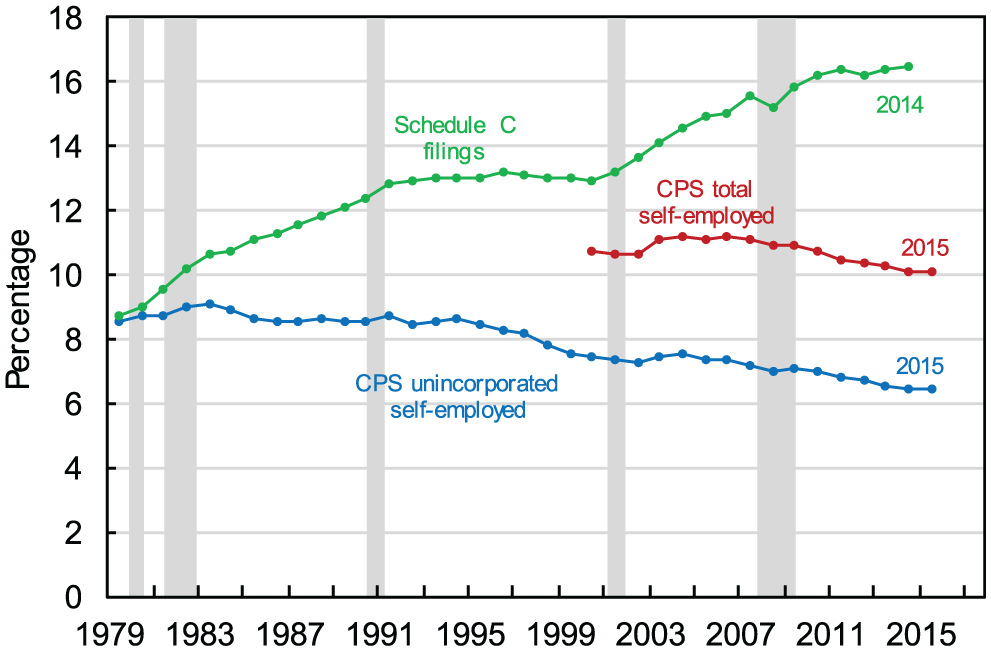
Trends in Self-Employment; Percentage of CPS Total Employed
An upward trend is also present in the number of tax returns that contain 1099-MISC income relative to total CPS employment, from 11.3% in 2000 to 12.5% in 2012, based on our tabulations of data from the U.S. Department of Treasury (2015) and BLS. Abraham, Haltiwanger, Sandusky, and Spletzer (2018) reported a rising trend since 2000 in several administrative measures of self-employment from tax and census data, including a steady secular increase in self-employed non-employers (individuals with more than $1,000 in business income but no employees) as a percentage of employment. And Jackson, Looney, and Ramnath’s (2017: 4) study of IRS data found that “essentially all of the increase in self-employment is due to increases in sole proprietors who have little or no business-related deductions, and who therefore appear to almost exclusively provide labor services (i.e. the contractors or misclassified workers).”
We interpret the IRS data as consistent with the upward trend from 1995 to 2015 in the share of workers who reported themselves as either working or being self-employed as an independent contractor, independent consultant, or freelancer in the BLS CWS and RPCWS. Understanding the reasons underlying the divergent trends between the IRS and CPS data on self-employment should be a priority for future research. 14
Characteristics of Those in Alternative Work Arrangements
Table 3 reports the characteristics of workers in alternative work arrangements in 1995, 2005, and 2015. Thus, the sample characteristics displayed in Table 3 are limited to employed respondents classified as a temporary help worker, on-call worker, contract company worker, or an independent contractor or freelancer in their main job.
Characteristics of Workers in Alternative Work Arrangements
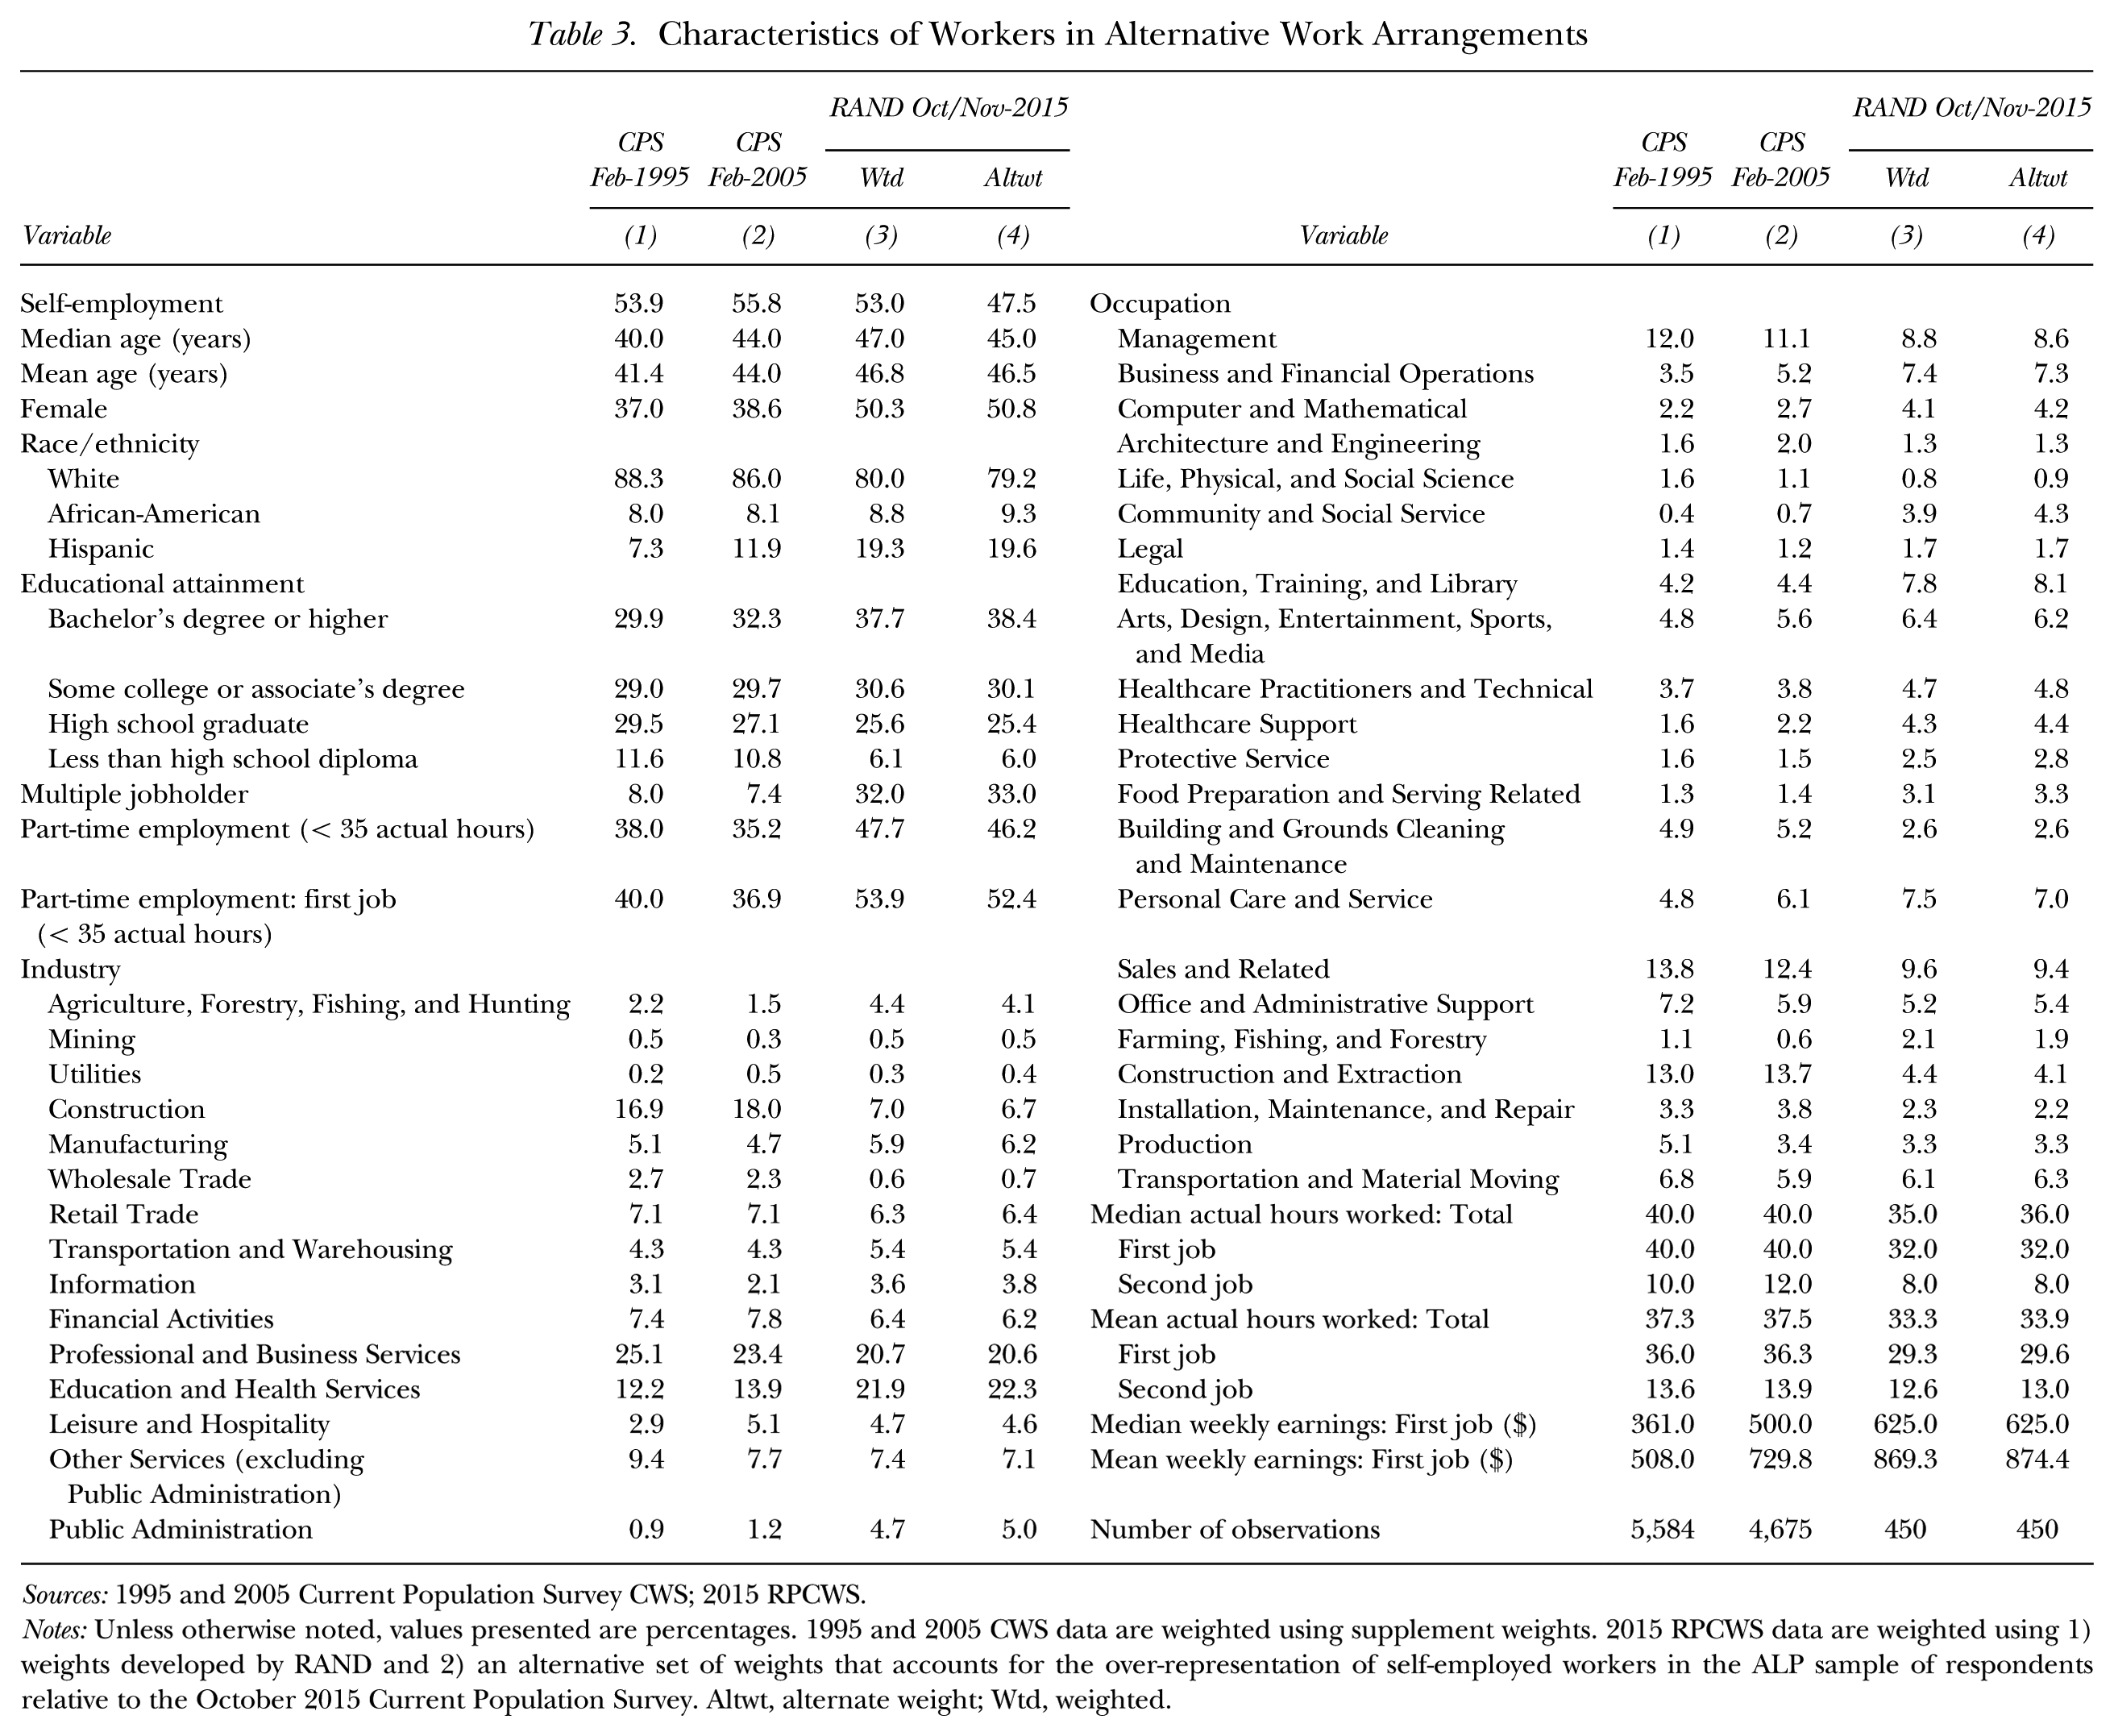
Sources: 1995 and 2005 Current Population Survey CWS; 2015 RPCWS.
Notes: Unless otherwise noted, values presented are percentages. 1995 and 2005 CWS data are weighted using supplement weights. 2015 RPCWS data are weighted using 1) weights developed by RAND and 2) an alternative set of weights that accounts for the over-representation of self-employed workers in the ALP sample of respondents relative to the October 2015 Current Population Survey. Altwt, alternate weight; Wtd, weighted.
The share of workers in alternative work arrangements who also report themselves as self-employed has declined from roughly 55% in 1995 and 2005 to less than half (48%) in 2015, reflecting the growth in the share of alternative workers employed by contract firms or temporary help firms. A notable rise in the share of workers in alternative work arrangements for women is also evident. Furthermore, the share of alternative workers who are college graduates, multiple jobholders, or Hispanics has increased.
Construction and professional/business services were the two most prevalent industry groups among those in alternative work in 1995 and 2005, but the education and health services industry has surpassed them over the past decade. More than one in five workers in an alternative work arrangement was working in education or health services in 2015. Together, professional and business services, education and health, and other services represented half of all of those engaged in an alternative work arrangement. Although the manufacturing sector has received much attention related to alternative work arrangements, it accounts for only 6.2% of all those engaged in alternative work, and just 2.6% of workers who are contracted out.
Workers in alternative work arrangements are spread throughout the occupational distribution, with sales being the largest group in 2015. The occupational mix of alternative workers has become more diffuse since 2005. And a comparison of column (4) in Tables 1 and 3 indicates that alternative workers work fewer hours, are more likely to work part-time, and have lower weekly earnings than do workers in traditional employment relationships.
Incidence of Alternative Work Arrangements
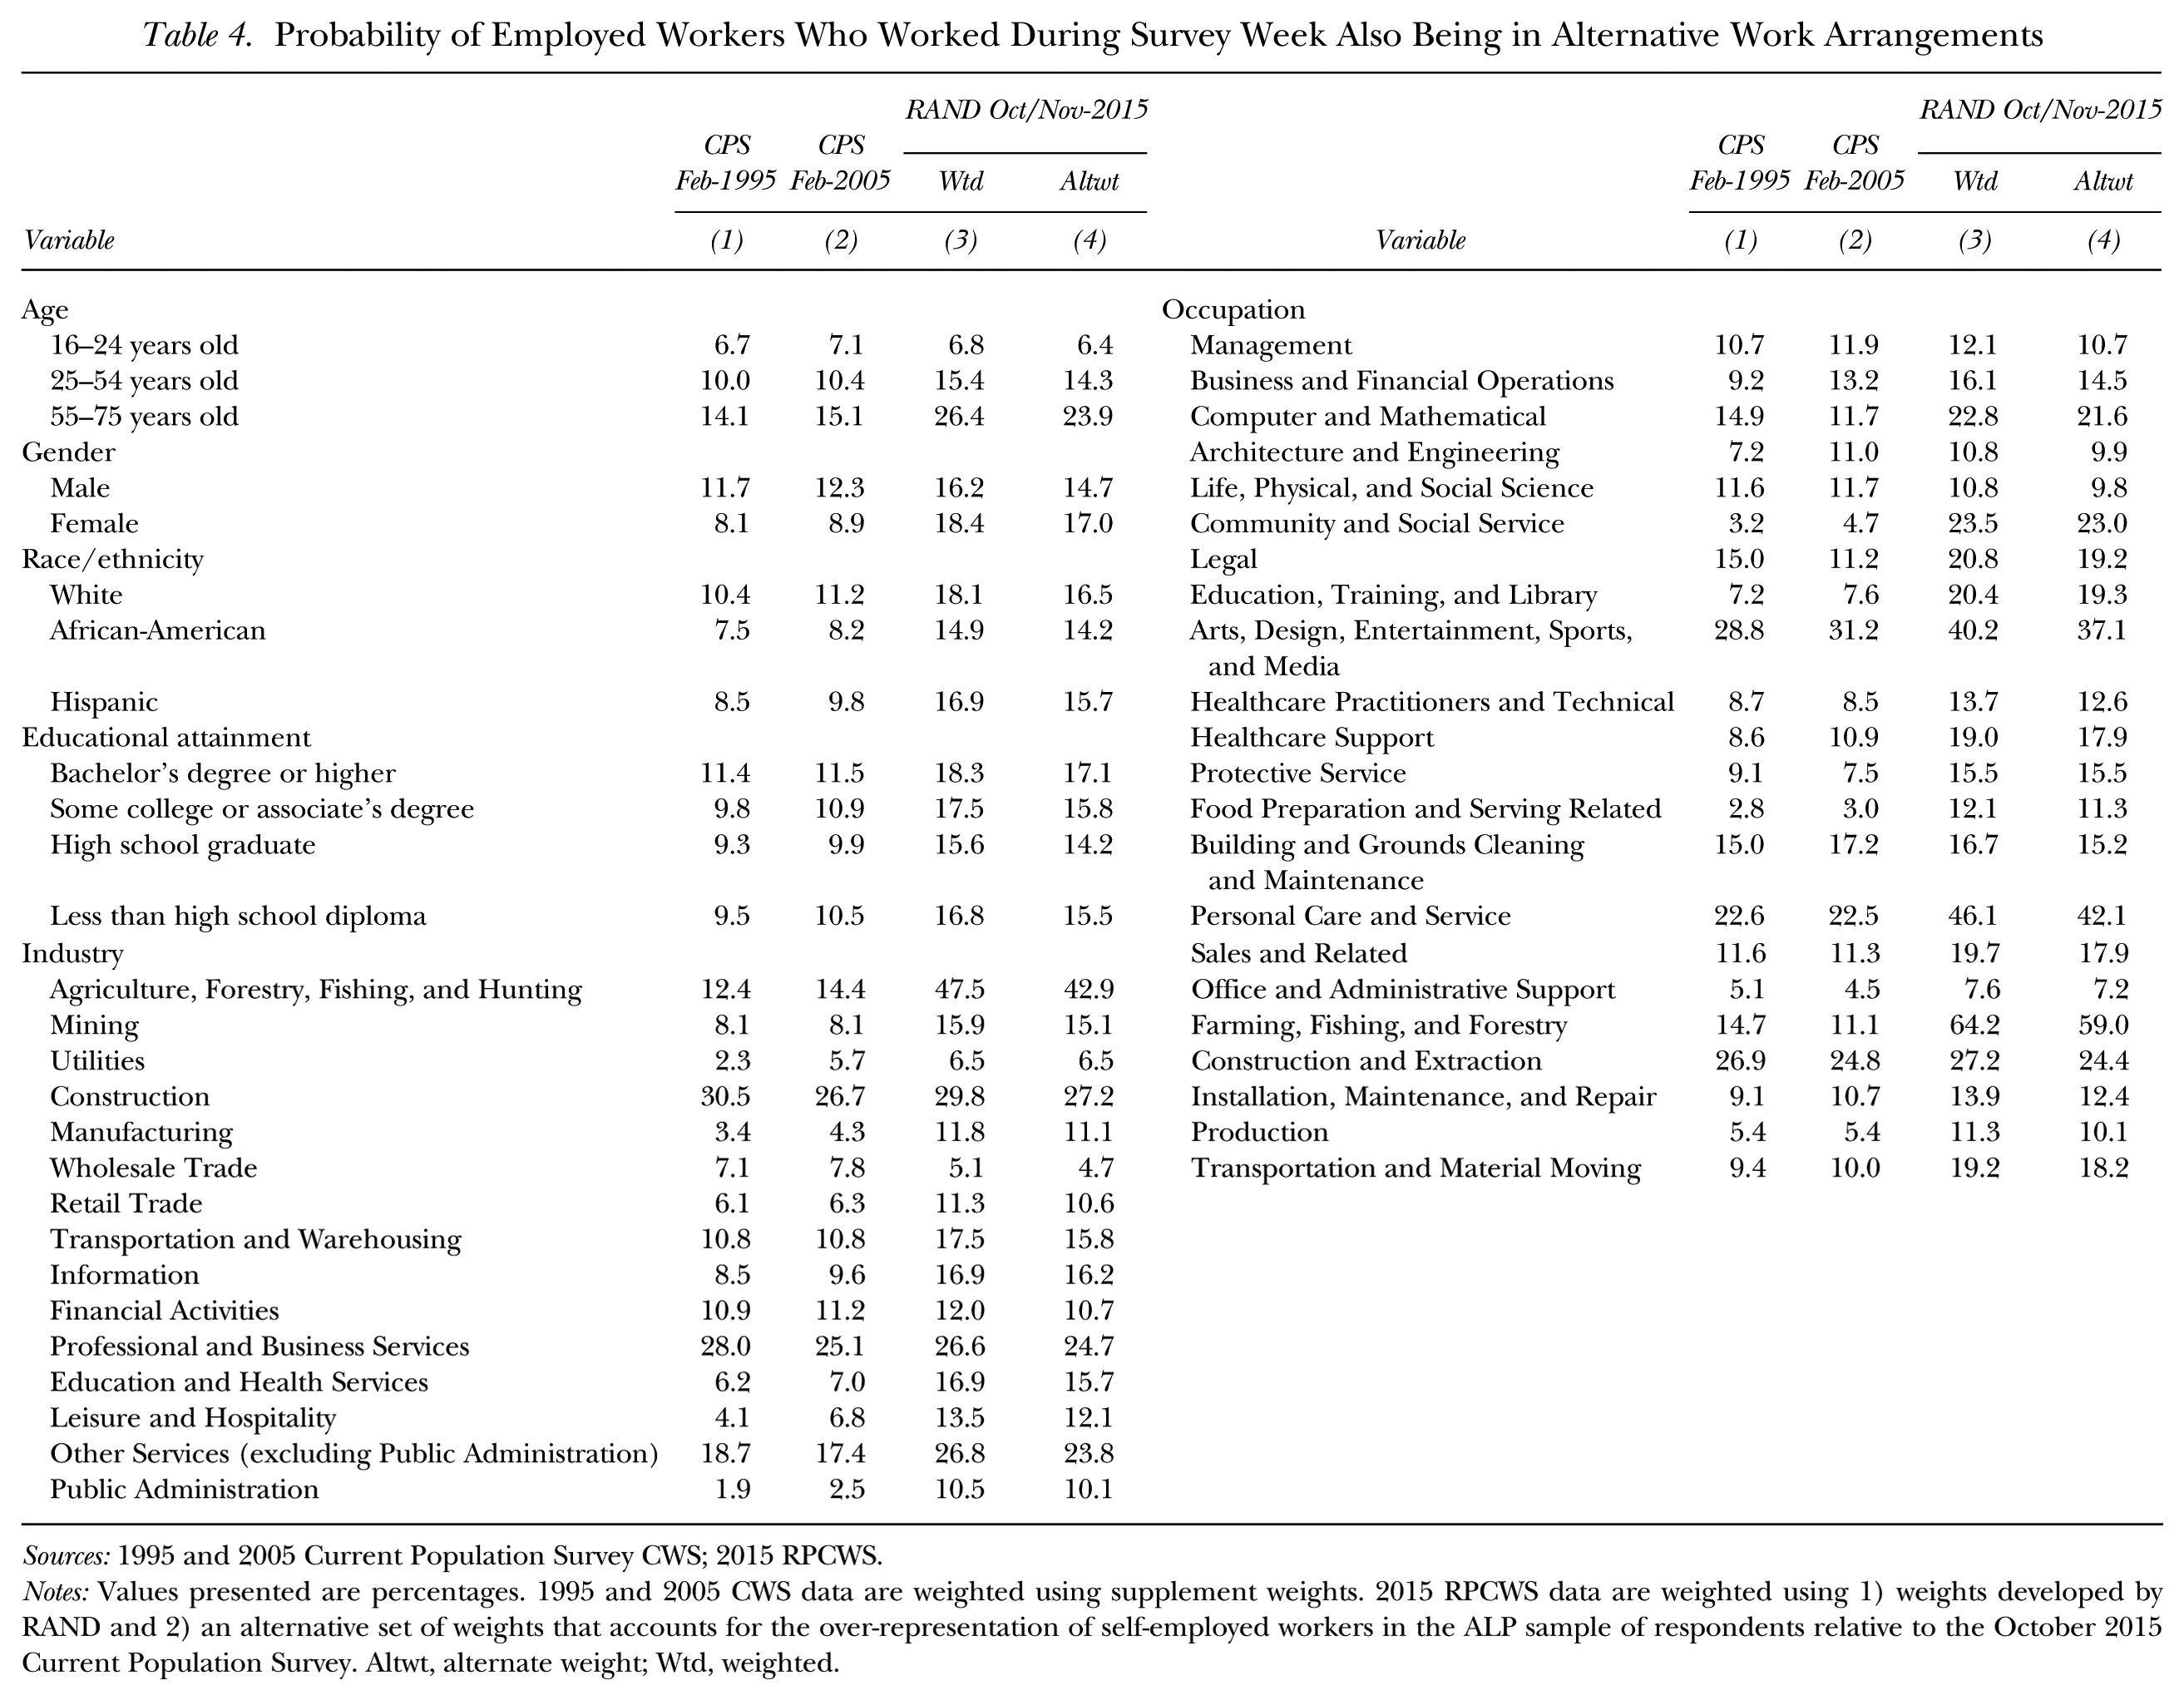
Table 4 reports the percentage of workers in various categories who are employed in alternative work arrangements in their main job. 15 For example, 6.4% of those aged 16 to 24 were employed in an alternative work arrangement in 2015, whereas 14.3% of those aged 25 to 54 and 23.9% of those aged 55 to 75 were employed in an alternative work arrangement. The 1995 and 2005 CWS also show a positive age gradient in the incidence of alternative work. Note that the rise in the incidence of alternative work has been sharpest for older workers (those 55 to 75 years old) and strong for prime age workers (those 25 to 54 years old) as well. But there was no change in the percentage of workers aged 16 to 24 who were employed in an alternative work arrangement in their main job from 2005 to 2015, despite the large growth for all workers. Thus, the positive age gradient in alternative work has become steeper.
Probability of Employed Workers Who Worked During Survey Week Also Being in Alternative Work Arrangements
Sources: 1995 and 2005 Current Population Survey CWS; 2015 RPCWS.
Notes: Values presented are percentages. 1995 and 2005 CWS data are weighted using supplement weights. 2015 RPCWS data are weighted using 1) weights developed by RAND and 2) an alternative set of weights that accounts for the over-representation of self-employed workers in the ALP sample of respondents relative to the October 2015 Current Population Survey. Altwt, alternate weight; Wtd, weighted.
Table 4 shows a notable rise in the likelihood of working in an alternative work arrangement for women. From 2005 to 2015, the percentage of women who were employed in an alternative work arrangement almost doubled, rising from 8.9% to 17.0%. The percentage increased by a more modest amount for men, from 12.3% to 14.7%. Women are now more likely than men to be employed in an alternative work arrangement. The contrasting trends were particularly stark for the independent contractor category.
Workers in all educational categories experienced a rise in the likelihood of working in an alternative work arrangement. Such arrangements were most prevalent in the construction and professional/business services industries in 2005, but the growth of alternative work arrangements has been greater in previously lagging sectors including transportation and warehousing, information and communications, education and health care, agriculture, and public administration. Figure 2 illustrates trends from 1995 to 2015 in the share of workers in alternative work arrangements by key industries. Occupations experiencing large increases in nonstandard work from 2005 to 2015 include computer and mathematical, community and social service, education, health care, legal, protective service, personal care, and transportation jobs.
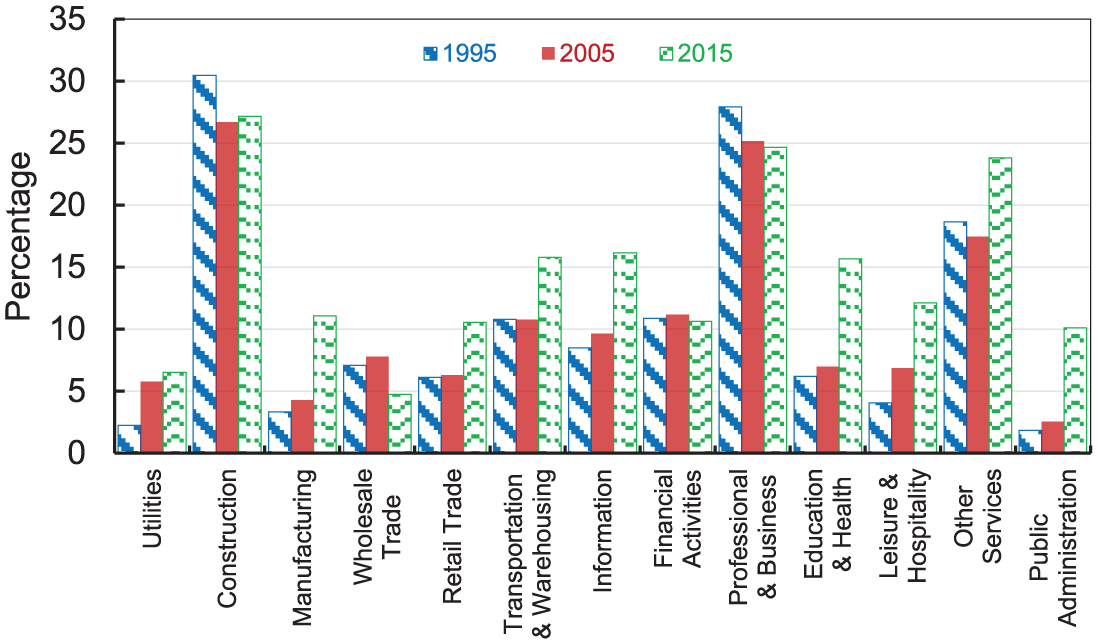
Probability of Alternative Work by Industry; Percentage of Total Employed Who Worked During Survey Week
Is Alternative Work Growing in High- or Low-Wage Sectors?
To assess whether alternative work is growing in higher or lower wage sectors of the labor market, we used a regression approach. We first used the 2005 CPS Merged Outgoing Rotation Groups (MORG) file to estimate a “kitchen sink Mincer regression” of the form:
where Y
i
is individual “i’s” log hourly wage rate,
We then predicted
To carry out this exercise, we made one further adjustment to the 2015 RAND sample weights. We adjusted the sample weights so that the fractions of workers and self-employed workers in each predicted quintile matched the fractions in each predicted quintile from the October 2015 CPS. This reweighting was necessary because the RPCWS data under-represented the proportion of workers and over-represented the proportion of self-employed workers predicted to be in the lower quintiles, even though the initial RAND weights did a reasonable job of approximating the distribution of average worker characteristics as shown in Table 1.
Figure 3 reports the results of this exercise. To make the patterns easier to detect, in addition to showing the percentage of workers in each predicted wage quintile who are employed in an alternative work arrangement, the figure also shows the OLS regression line through the five percentages each year. Figure 3 shows that the incidence of alternative work is greater among workers who are predicted to have higher wages. The rise in the incidence of alternative work arrangements from 1995 to 2015 is similar across the predicted wage distribution as indicated by the almost parallel upward shifts in the regression lines from 1995 to 2005 to 2015.
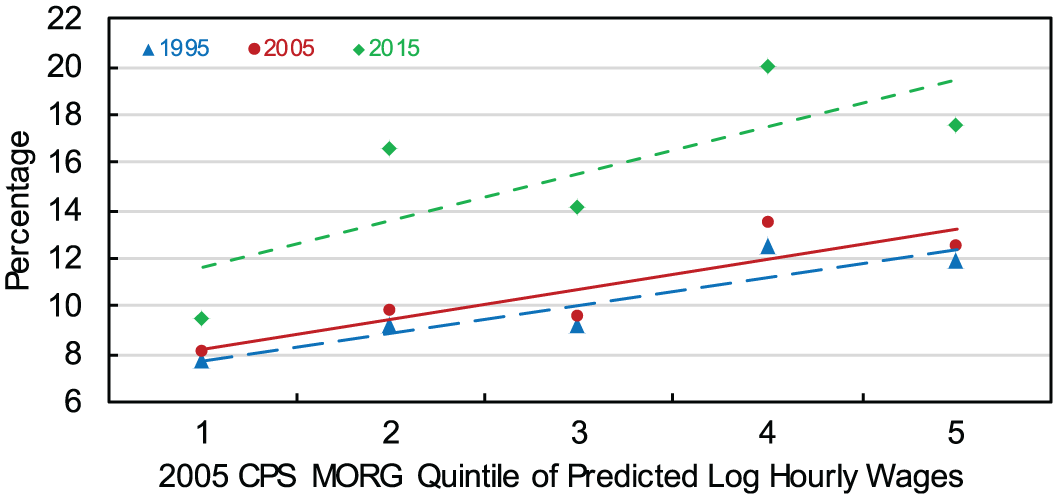
Probability of Being in Alternative Work Arrangements
Katz and Krueger (2016) presented the corresponding graphs for each category of alternative work arrangements, showing the percentage of independent contractors, on-call workers, temporary help agency workers, and contracted-out workers by predicted wage quintile, respectively. Three patterns are notable. First, the upward sloping relationships found in Figure 3 are primarily due to independent contractors. Second, and perhaps not surprising, the likelihood that workers are employed in temporary help agency jobs and on-call jobs is higher in the lower predicted-wage quintiles. Third, there was a rise in the likelihood of workers being contracted out to other firms for those in the highest predicted-wage quintiles, rendering a sharply upward sloping pattern by 2015. In 2015, workers with attributes and jobs associated with higher wages are the most likely to have their services contracted out. Indeed, the lowest predicted quintile-wage group did not experience a rise in contract work.
Online and Off-line Intermediated Work
A major goal of our questionnaire was to provide the first nationally representative survey-based estimates of the percentage of workers in what has been variously called the “gig economy,” the “sharing economy,” the “online platform economy,” or the “on-demand economy.” Our approach was to first ask workers: “On either your main job or a secondary job, do you do direct selling to customers?” We then followed up by asking about the nature of their direct selling activities. A total of 19.4% of US employees responded that they were engaged in direct selling to customers on their job. The direct selling of goods or services to customers is widespread among US workers, and it goes far beyond retail sales clerks.
Of those who engaged in direct selling, however, only 7% answered that they worked with an intermediary, such as Avon or Uber, in their direct selling activity. Among those workers who reported they worked with an intermediary, about one-third said that the intermediary is online, such as Uber or TaskRabbit, and two-thirds said that the intermediary is off-line. Thus, only about 0.5% of all workers identify customers through an online intermediary. This figure, which requires many caveats (such as the ambiguity of the term “direct selling” and the small sample size), is nonetheless remarkably close to Harris and Krueger’s (2015) estimate of 0.4% of the workforce based on the frequency of Google searches for terms related to online intermediaries and to Farrell and Greig’s (2016a) estimate of 0.6% of the working-age population (or approximately 0.4% of the workforce) based on the frequency of bank deposits from online work platforms. In addition, Jackson, Looney, and Ramnath (2017) estimated from tax data that 0.7% of workers earned income during 2014 through an online platform.
Wages and Hours
We can compare earnings and work hours of workers in alternative work arrangements with those in traditional employment. 16 The 2005 CWS collected earnings information from workers in contingent and alternative work arrangements in CPS rotation groups 1–3 and 5–7, and earnings of all employees in rotation groups 4 and 8. 17 Although we cannot distinguish between workers in alternative and traditional employment arrangements in rotation groups 4 and 8, because workers in alternative employment arrangements constituted only 10% of all workers in 2005, the vast majority of employees were in a traditional employment relationship. Thus, by assigning all employees in rotation groups 4 and 8 to the category of traditional employment and comparing them to workers identified in an alternative work arrangement in the other rotation groups, we attenuate differences in earnings or hours by only a small amount (approximately 10%). 18
Another limitation of the CPS is that earnings are available for only the main job. For the RPCWS data, however, we collected separate information on earnings in the main job and all other jobs combined.
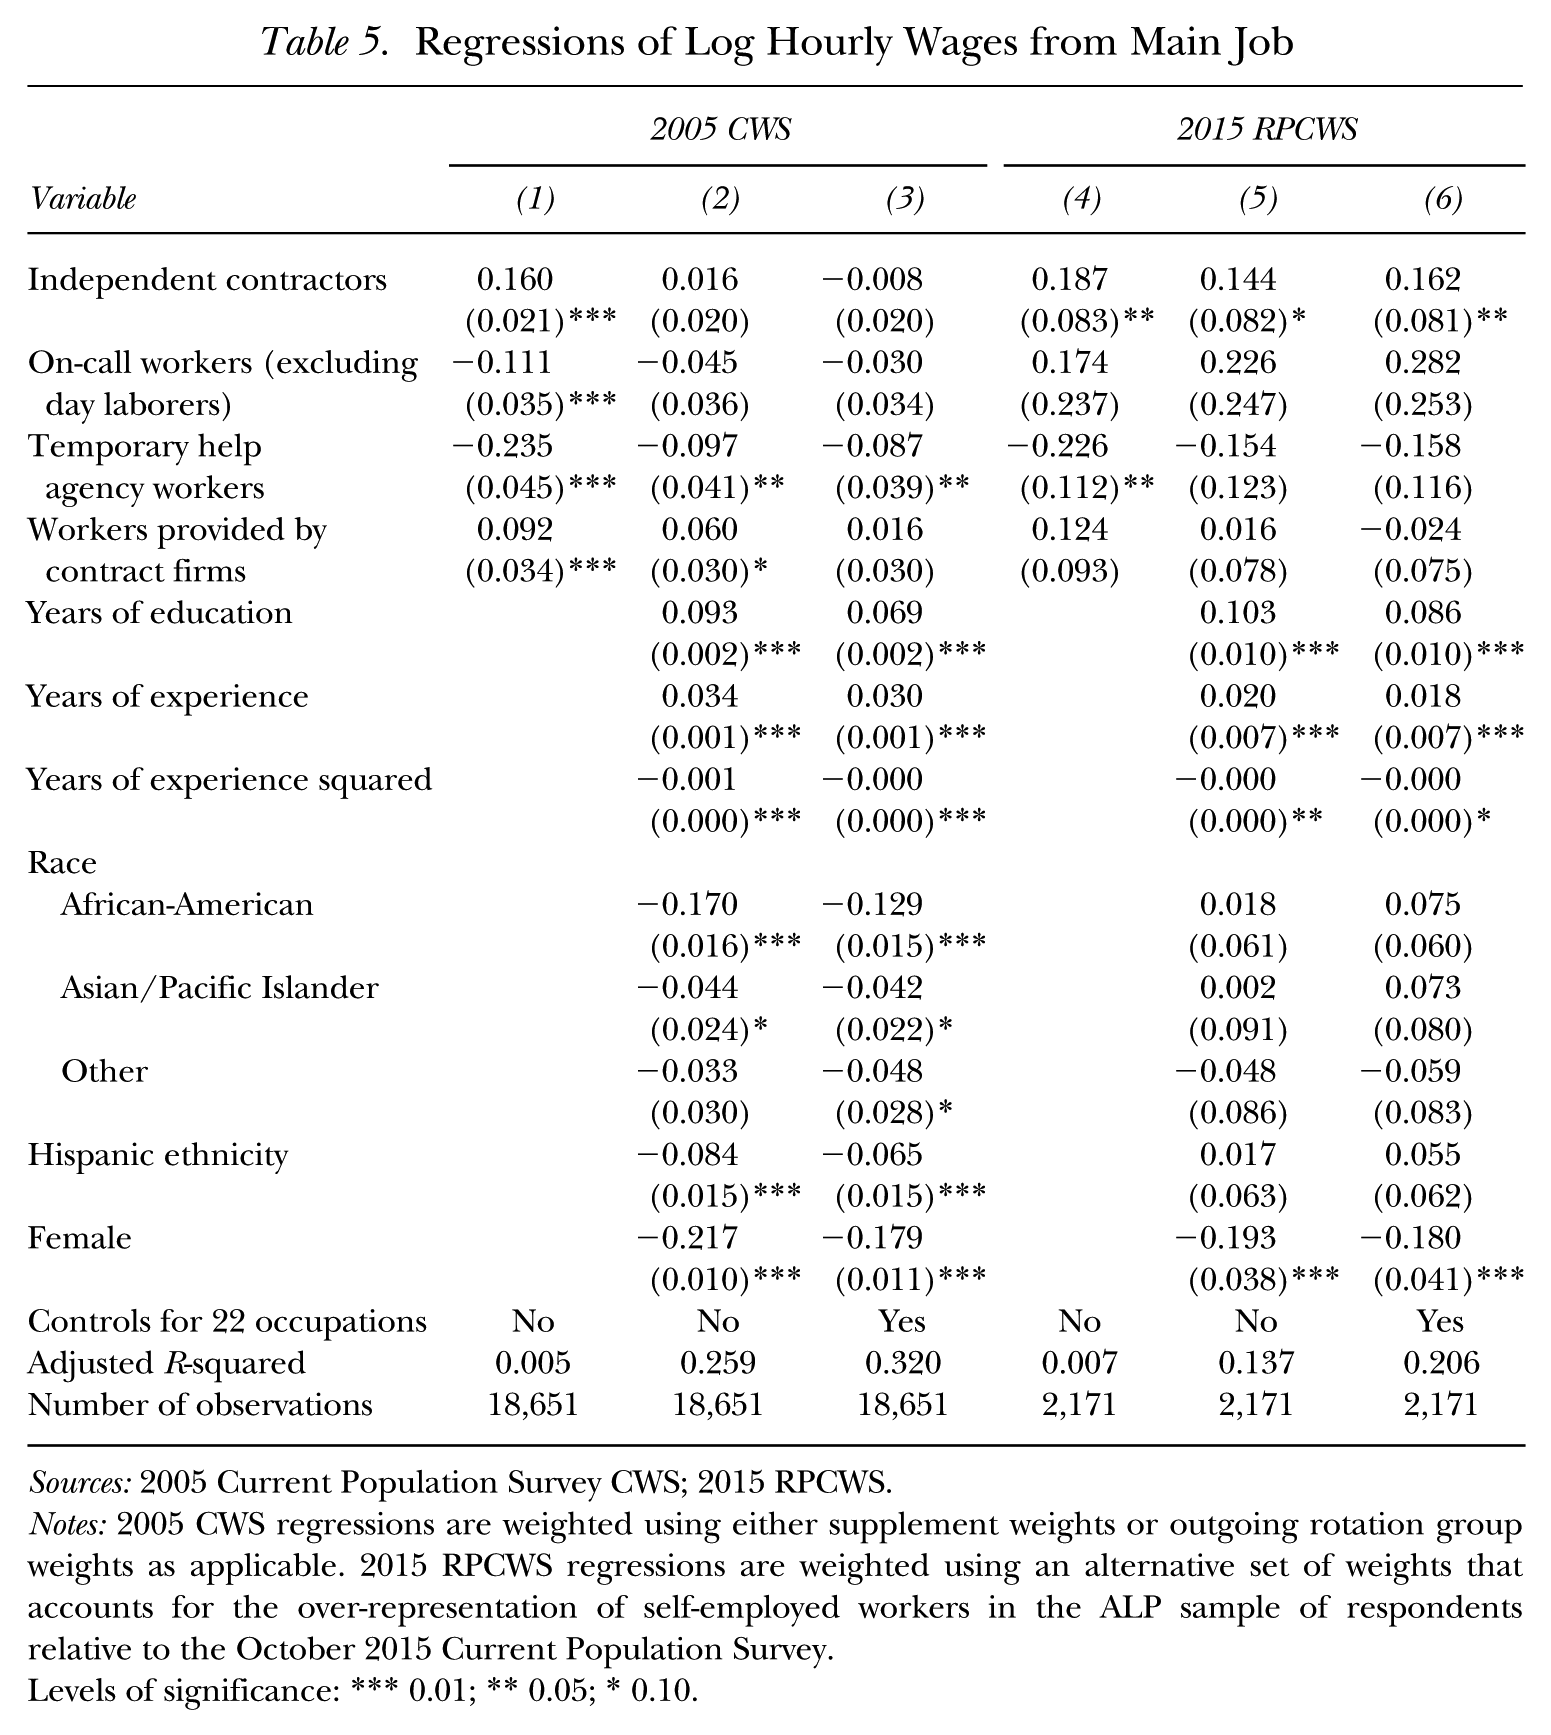
Table 5 presents wage regressions for which the dependent variable is the natural logarithm of hourly earnings on the main job. 19 Column (1) reports results for a regression with the 2005 CWS data that includes four dummy variables indicating each of the four categories of alternative work arrangements; the base group is all employees. Column (2) contains a standard Mincer wage regression (with controls for education, experience, race/ethnicity, and sex) augmented to include the alternative work arrangement dummies. Column (3) contains an augmented Mincer regression with the addition of 22 occupation dummy variables. Columns (4) to (6) present the corresponding regressions with the 2015 RPCWS data (although the base group consists exclusively of those in a traditional employment relationship).
Regressions of Log Hourly Wages from Main Job
Sources: 2005 Current Population Survey CWS; 2015 RPCWS.
Notes: 2005 CWS regressions are weighted using either supplement weights or outgoing rotation group weights as applicable. 2015 RPCWS regressions are weighted using an alternative set of weights that accounts for the over-representation of self-employed workers in the ALP sample of respondents relative to the October 2015 Current Population Survey.
Levels of significance: *** 0.01; ** 0.05; * 0.10.
Before conditioning on covariates, the 2005 and 2015 results are similar: Independent contractors are paid more per hour than traditional employees are paid, whereas temporary help and on-call workers are paid less. (We discount the positive but quite imprecise estimate for on-call workers in the RPCWS.) When we control for personal characteristics and occupation in the 2005 CWS, the penalty associated with working for a temporary help agency shrinks but remains significant, and the other differentials become small and statistically insignificant. In the RPCWS, the estimates are less precise, but independent contractors continue to earn a positive hourly wage premium even after conditioning on personal characteristics and occupation. A positive hourly wage premium for independent contractors could reflect a compensating differential for lower benefits and the need to pay self-employment taxes. Given the imprecision of the estimates, we recommend caution in interpreting the estimates from the RPCWS.
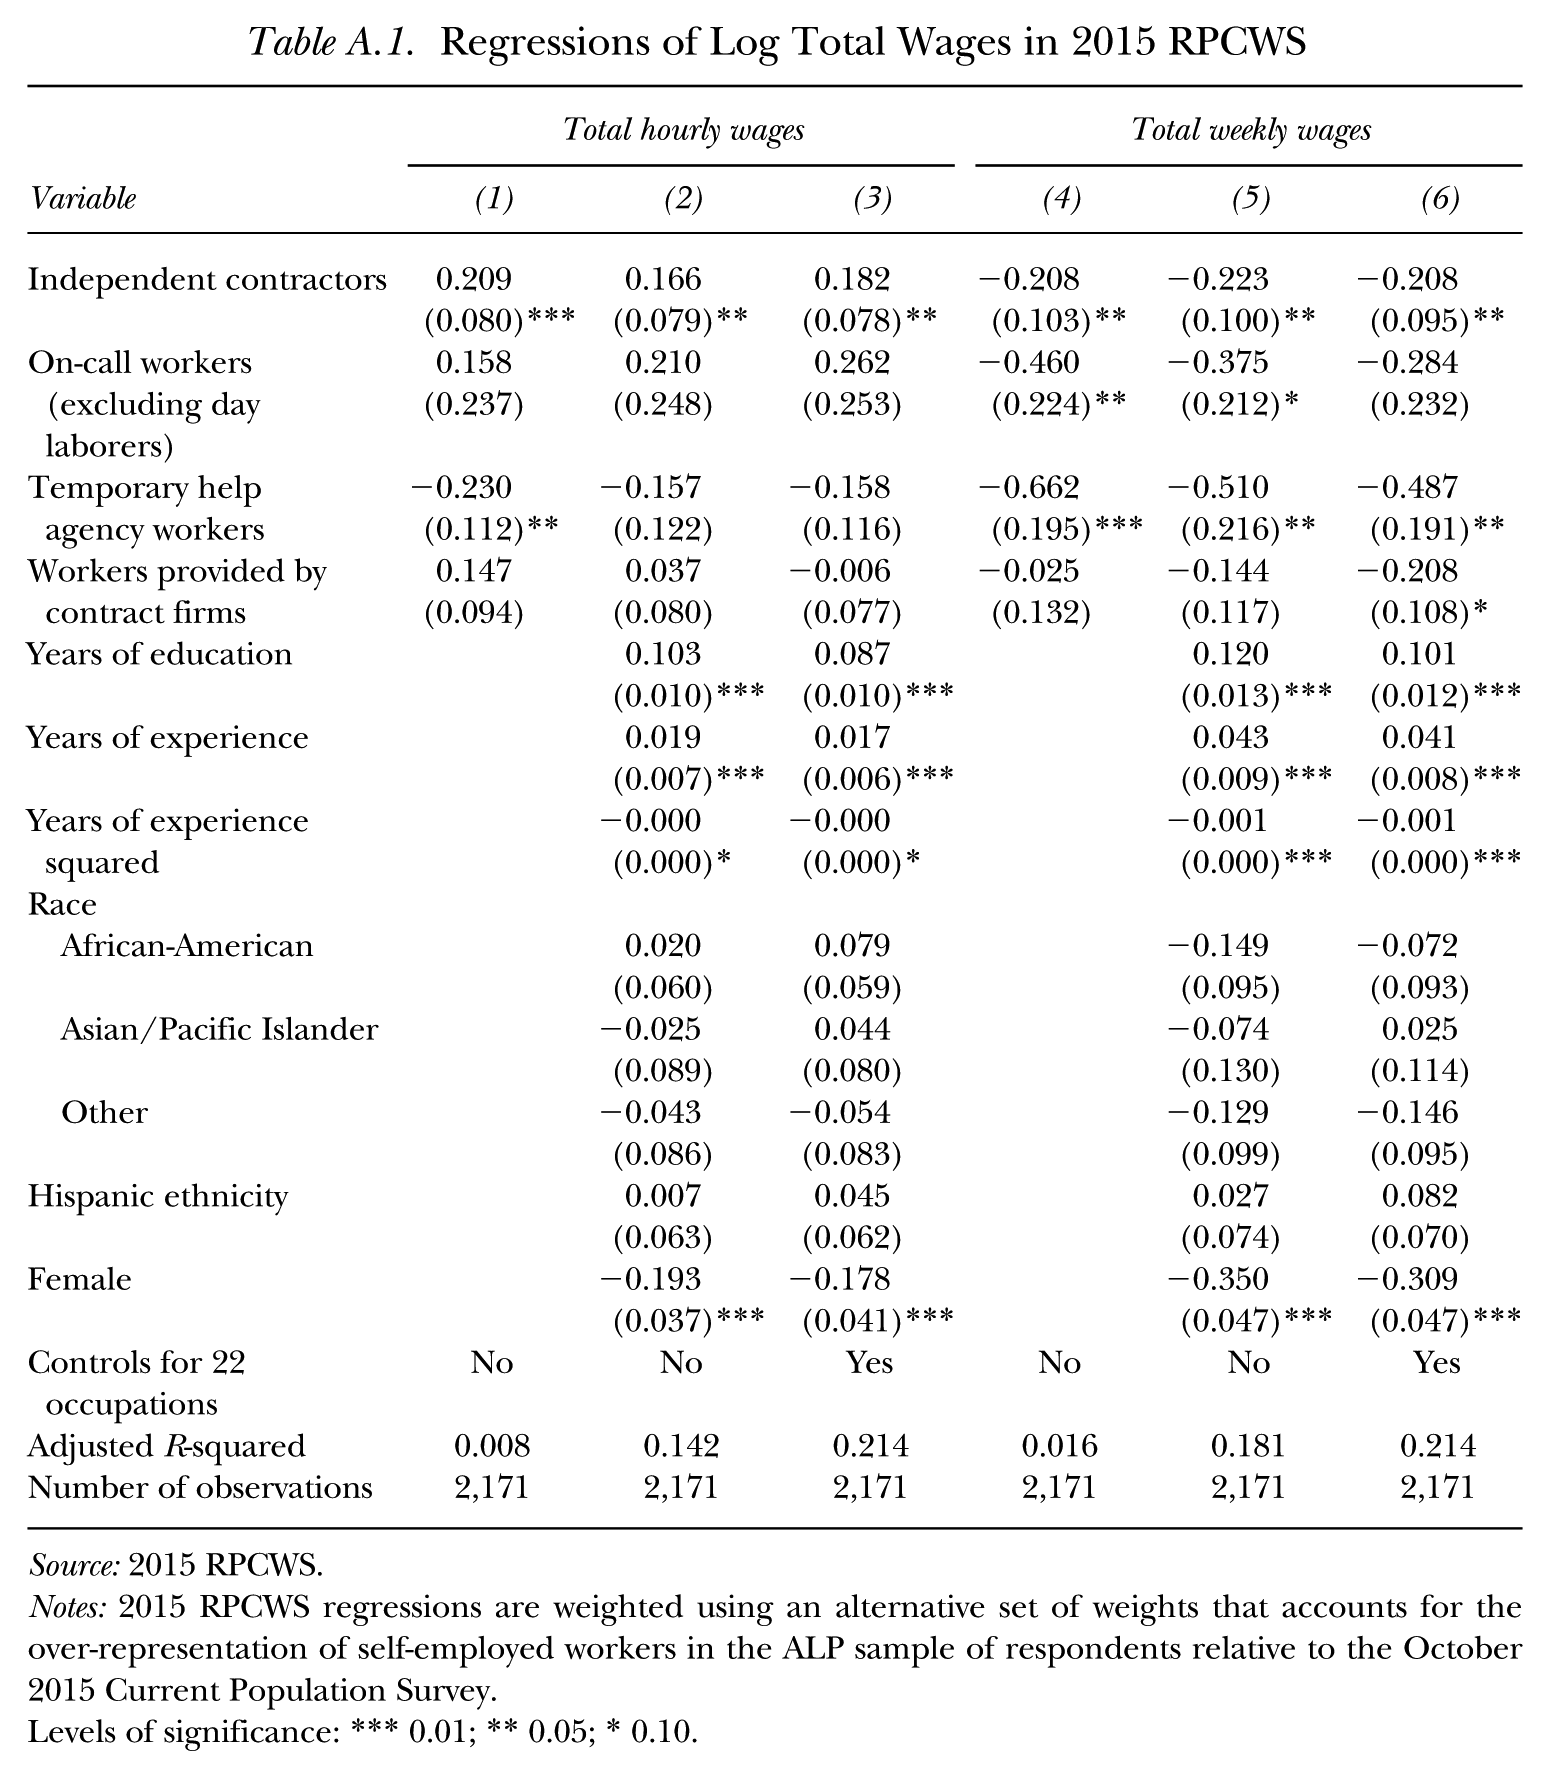
Table 6 contains analogous regression results for the log of weekly earnings, and the pattern of results is clearer after conditioning on covariates. In the CWS, all of the categories of alternative work exhibit a large negative weekly wage differential relative to all employees except contract workers, and in the RPCWS, all of the alternative work categories, including contract workers, are paid less per week than workers are paid in a traditional employment relationship conditional on the listed personal characteristics and occupation dummies. Independent contractors, for example, earn 33 log points less per week than do employees with similar characteristics, even though they earn 16 log points more per hour. Appendix Table A.1 presents regressions for the log of hourly and weekly wages combining earnings and hours on the main job and any secondary jobs for the RPCWS sample, with similar results to those for the main job shown in Tables 5 and 6. The contrast between the hourly and the weekly wage differentials in the main job for alternative versus traditional workers (mechanically) reflects lower weekly hours in the main job for those in alternative work arrangements.
Regressions of Log Weekly Wages from Main Job
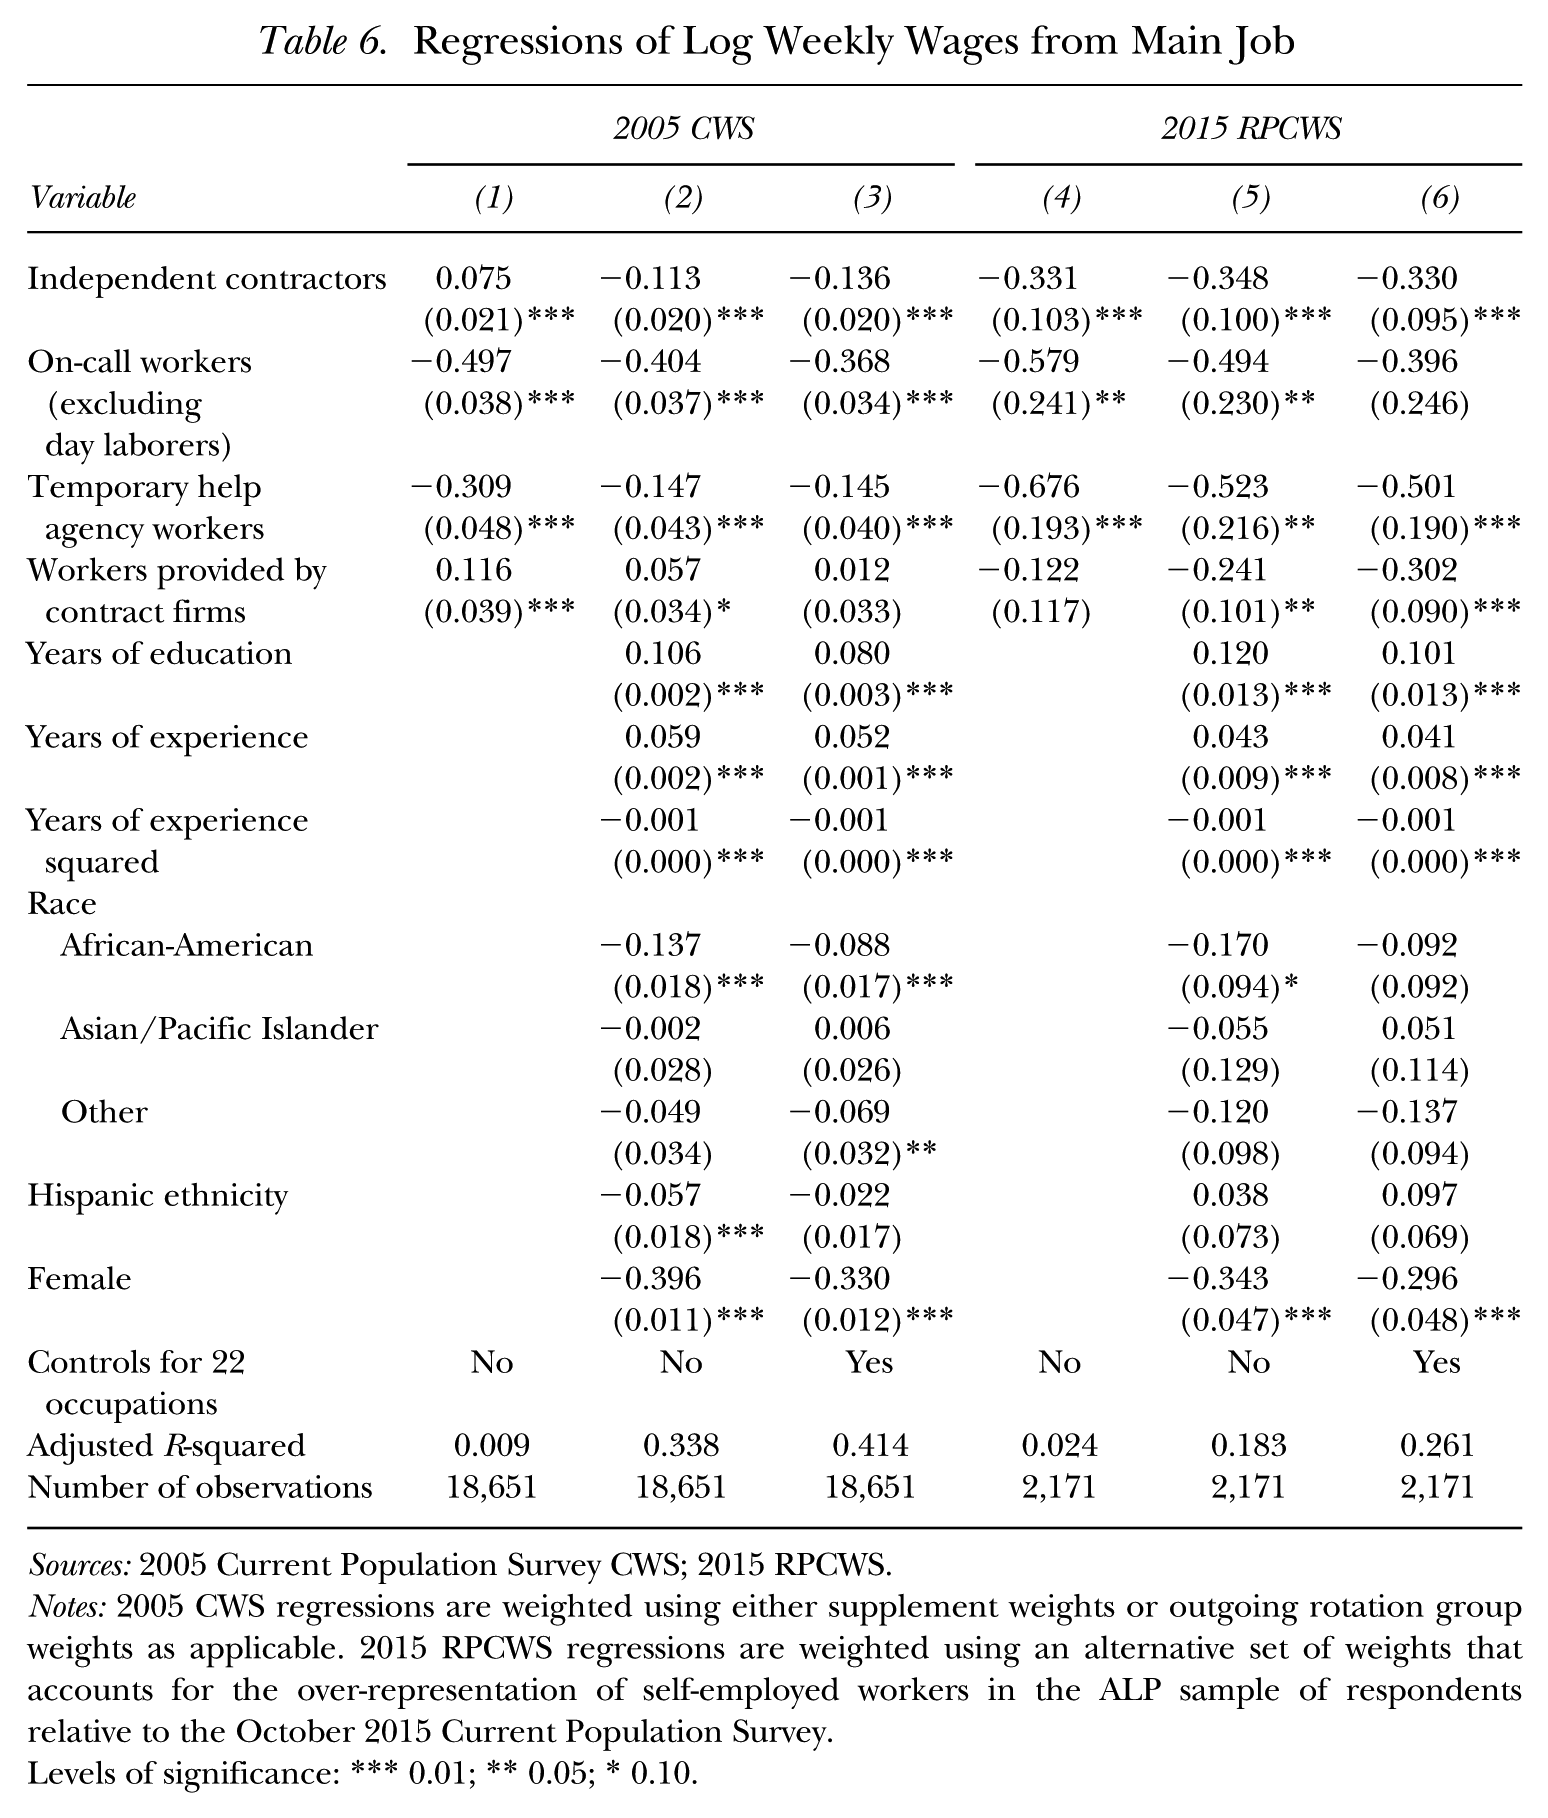
Sources: 2005 Current Population Survey CWS; 2015 RPCWS.
Notes: 2005 CWS regressions are weighted using either supplement weights or outgoing rotation group weights as applicable. 2015 RPCWS regressions are weighted using an alternative set of weights that accounts for the over-representation of self-employed workers in the ALP sample of respondents relative to the October 2015 Current Population Survey.
Levels of significance: *** 0.01; ** 0.05; * 0.10.
Table 7 reports regressions for which the dependent variable is the log of hours worked on all jobs. The results show a consistent pattern with workers in alternative work arrangements working considerably fewer hours per week than do traditional employees. 20 The gap in average work hours is largest for on-call workers and smallest for contract workers, although it appears to be a ubiquitous feature of working in an alternative employment arrangement.
Regressions of Log Actual Hours Worked on All Jobs
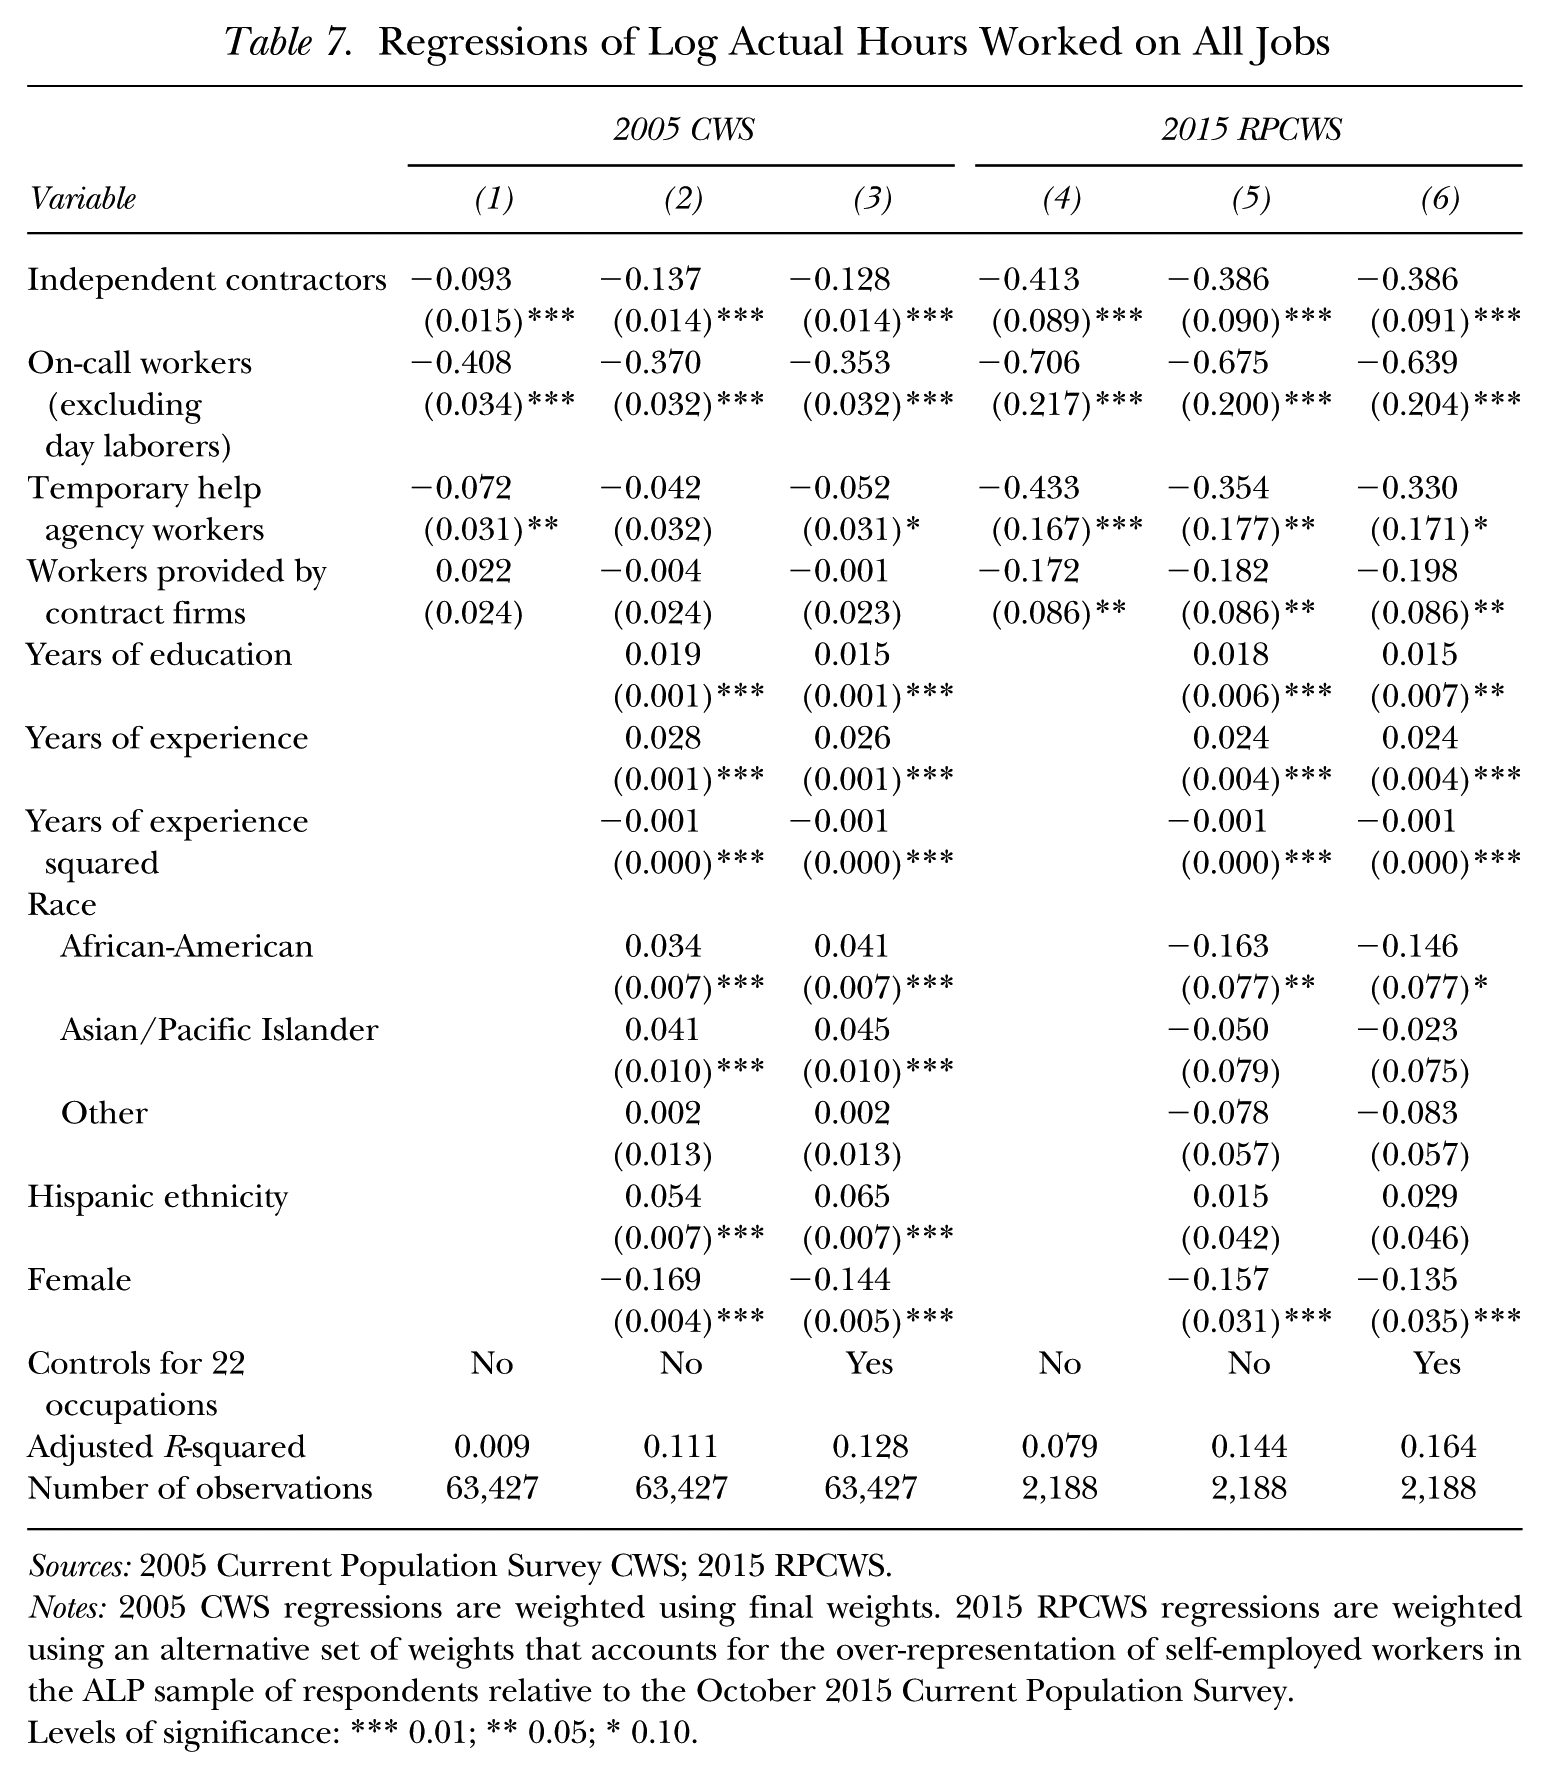
Sources: 2005 Current Population Survey CWS; 2015 RPCWS.
Notes: 2005 CWS regressions are weighted using final weights. 2015 RPCWS regressions are weighted using an alternative set of weights that accounts for the over-representation of self-employed workers in the ALP sample of respondents relative to the October 2015 Current Population Survey.
Levels of significance: *** 0.01; ** 0.05; * 0.10.
An important question to address is whether work hours are typically lower for workers in alternative work arrangements by choice, or because these workers often face “hours constraints” that limit their work hours. We can compare the frequency with which workers in alternative work arrangements and traditional jobs report they are working involuntarily part-time. We did not ask about part-time for economic reasons in the RPCWS, but the information is available from the 2005 CWS. Workers are classified as part-time for an economic reason if they worked less than 35 hours in the survey week in all jobs combined and cited a reason, such as slack work or unfavorable business conditions, inability to find full-time work, or seasonal declines in demand, for their part-time hours. Workers in alternative work arrangements are more than twice as likely as other workers to be classified as part-time for economic reasons (7.6% versus 3.3%). On-call and temporary help agency workers were the most likely to be classified as part-time for economic reasons (13.2% and 12.6%, respectively), while independent contractors and contracted-out workers were less likely to be so classified (6.0% and 6.5%, respectively), but all four alternative groups were more likely to be classified as part-time for economic reasons than were traditional employees.
Worker Satisfaction with Work Arrangements
The CWS asked workers who identified themselves as paid by a temporary help agency, on a temporary job, on-call workers, and independent contractors whether they would prefer a traditional employment arrangement over their current arrangement. The specific questions were tailored to the particular work arrangement. Temporary help agency employees were asked, “Would you prefer a job with a different type of employer?” All workers who reported they were on a temporary job—including those employed by a temporary help agency—were asked, “Would you prefer to have a job that is permanent rather than temporary?” 21 On-call workers were asked, “Would you prefer a job where you worked regularly scheduled hours?” And workers who were self-employed as an independent contractor or freelancer were asked, “Would you prefer to work for someone else rather than being an independent contractor?” (Workers who were contracted out to provide services to another company were not asked whether they would prefer to work directly for that other company.) The response set in each case was “no,”“yes,”“don’t know,”“refused,” and “depends.”
We asked a similar, though not identical, set of questions in the RPCWS. Temporary help agency workers on temporary jobs and on-call workers were asked the identical questions as in the CWS. Workers who were self-employed as an independent contractor or a freelancer were asked, “Would you prefer to work for someone else rather than being self-employed, an independent contractor or a freelance worker?” The response set was either “yes” or “no.”
Table 8 provides a comparison of the 1995 and 2005 CWS and the 2015 RPCWS data of workers’ preferences concerning their work arrangement. We restricted both samples to individuals who worked in the survey reference week. (We were able to exactly replicate the published CWS results without this restriction.) Because the questions and response set were close but not identical, and the sample sizes for the RPCWS were small, the results should be taken as suggestive. 22 The general pattern found in the earlier 1995 and 2005 CWS seems to hold. A large majority of temporary help agency employees on temporary jobs would prefer a permanent job, and almost half of on-call workers would prefer a job with regularly scheduled hours.
Employment Preferences of Workers in Alternative Work Arrangements
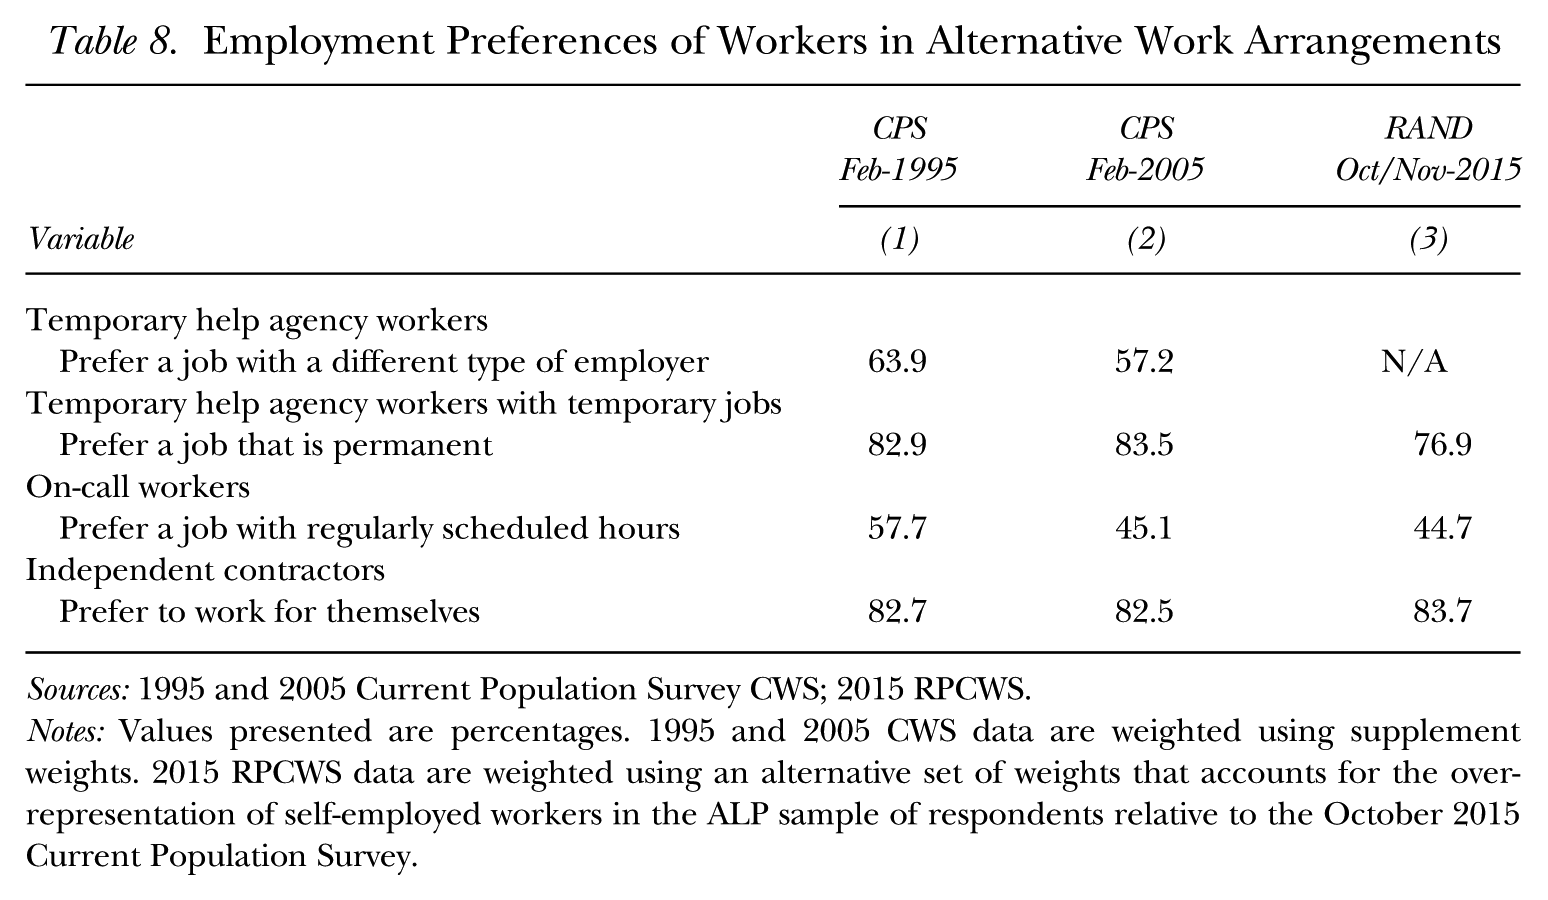
Sources: 1995 and 2005 Current Population Survey CWS; 2015 RPCWS.
Notes: Values presented are percentages. 1995 and 2005 CWS data are weighted using supplement weights. 2015 RPCWS data are weighted using an alternative set of weights that accounts for the over-representation of self-employed workers in the ALP sample of respondents relative to the October 2015 Current Population Survey.
The 1995 and 2005 CWS found that more than 80% of independent contractors and freelancers preferred their work arrangement to working for someone else, and a similar proportion responded likewise in the 2015 RPCWS. 23 It is possible that the CWS question prompts independent contractors and freelancers to reflect on the advantages of being their own boss, which elicits a favorable response, rather than the disadvantages of working fewer hours than workers in traditional employment relationships, which would elicit a less positive response. The results in Table 8 suggest substantial stability over time in workers’ stated preferences regarding their work arrangements, despite the significant growth in the share of workers in alternative work arrangements over the past decade. More than 80% of independent contractors and freelancers continue to indicate they prefer such an arrangement to being an employee. 24 By contrast, the vast majority of those employed by temporary help agencies on temporary jobs would prefer a permanent job, and almost half of on-call workers would rather have regularly scheduled hours. Thus, it appears that many workers who become independent contractors and freelancers are sorting into those work relationships based, in part, on their preference for being their own boss, whereas many (and possibly most) workers in on-call and temporary help jobs have a preference for more steady employment with regular hours.
Conclusion
Many possible factors could have contributed to the large increase in the incidence of alternative work arrangements for American workers from 2005 to 2015 we have documented in this article. Worker, or supply-side, factors include shifts in workforce composition to groups with a greater preference for alternative work arrangements or increased desire for workplace flexibility. Firm, or demand-side, factors include potential growing efficiency gains to contracting out and increased rent-shifting incentives. Although a fuller evaluation must await further research, we provide an initial evaluation of leading explanations.
The first explanation is that alternative work is more common among older workers and more highly educated workers, and the workforce has become older and more educated over time. A shift-share analysis, however, indicates that shifts in the age and education distribution of the workforce account for approximately only 10% of the increase in the percentage of workers employed in alternative work arrangements from 2005 to 2015. 25 Other supply-side factors, such as a possible increase in demand for flexible work hours (perhaps supported by the increased availability of health insurance as a result of the Affordable Care Act) and increased concerns about work–life balance may also have contributed (Mas and Pallais 2017). It is unlikely that supply-side factors account for the lion’s share of the rise in alternative work arrangements since the rise in employees who are hired out to other firms through contract firms or temporary help agencies accounts for roughly half of the overall rise in the share of employment in alternative work arrangements in the past decade.
Second, technological changes that lead to enhanced monitoring, standardized job tasks, and information on worker reputation being more widely available may be leading to greater disintermediation of job tasks. Coase’s (1937) classic explanation for the boundary of firms rested on the minimization of transaction costs within firm–employee relationships. Technological changes may be reducing the transaction costs associated with contracting out job tasks, however, and thus supporting the disintermediation of work. Furthermore, improvements in information technology and thicker markets for contractors increasingly mean large organizations may reap efficiency gains and cost savings from hiring specialized contractors for non-core activities (such as janitorial services, food services, information technology, accounting, and legal services) rather than managing such activities in-house.
Third, fairness norms and morale considerations often motivate firms to share rents with their employees and to create wage compression pressures within firm boundaries. And fairness considerations seem to apply much more to traditional incumbent employees than to new hires or contractors (Kahneman, Knetsch, and Thaler 1986). Market and other forces that lead to rising educational wage differentials and rising wage inequality increase the costs to firms of wage compression and of sharing rents with low-wage workers. Thus, rising wage inequality itself may have increased incentives to contract out low-wage workers and to split high- and low-wage workers into separate organizations. Abraham and Taylor (1996) argued that contracting out is often sought because firms seek to restrict the pool of workers with whom rents are shared, as well as to reduce the volatility of core employment. A rise in inter-firm variability in profitability is thus consistent with a greater desire for contracting out to reduce rent sharing (although increased contracting out could also have contributed to the rise in inter-firm variability in profits). Growing product market volatility can increase contracting out since layoffs of incumbent traditional employees who typically have an implicit promise of a long-term relationship appear to be costlier to a firm’s reputation as an employer than are changes in the use of contractors (Halonen-Akatwijuka and Hart 2017).
Relatedly, Weil (2014) argued that competitive pressures have increased firm demands for “flexibility” and are causing a “fissuring” of the workplace, with workers increasingly being misclassified as contract employees and work being redefined to make greater use of contract workers and independent contractors. Furthermore, Song et al. (forthcoming) found a rising correlation of firm wage premiums with worker skills and worker wage fixed effects (the permanent wage component that persists across employers). These patterns suggest high-rent firms are increasingly contracting out standardized and lower-wage work and restricting rent sharing to a smaller core of highly compensated workers.
Finally, it is plausible that the dislocation caused by the Great Recession in 2007 to 2009 may have caused many workers to seek alternative work arrangements when traditional employment was not available. To the extent this is the case, one might expect a return to a lower percentage of workers employed in alternative work arrangements over time, as the effects of the recession continue to fade. Katz and Krueger (2017) found that workers who suffer a spell of unemployment have a greatly elevated likelihood of transitioning to an alternative work arrangement but also found that cyclical labor market conditions are unlikely to explain most of the recent shift from traditional to alternative work arrangements.
Regardless of the explanation for the growth in alternative work, our findings indicate that workers in alternative work arrangements earn considerably less per week than do regular employees with similar characteristics and in similar occupations. The earnings gap derives more from workers in alternative work arrangements working fewer hours per week than from a gap in hourly earnings. A larger share of alternative workers are involuntary part-time workers compared with employees in traditional jobs, suggesting that many in alternative work arrangements may be “hours constrained.” Most temporary help agency workers and a near majority of on-call workers would prefer permanent employment with regularly scheduled hours to their current situation. A majority of workers who are independent contractors or freelancers, however, apparently value the flexibility and independence that comes with being their own boss and report they would prefer to work for themselves than for someone else.
Footnotes
Appendix
Regressions of Log Total Wages in 2015 RPCWS
| Total hourly wages |
Total weekly wages |
|||||
|---|---|---|---|---|---|---|
| Variable | (1) | (2) | (3) | (4) | (5) | (6) |
| Independent contractors | 0.209 | 0.166 | 0.182 | −0.208 | −0.223 | −0.208 |
| (0.080)*** | (0.079)** | (0.078)** | (0.103)** | (0.100)** | (0.095)** | |
| On-call workers (excluding day laborers) | 0.158 | 0.210 | 0.262 | −0.460 | −0.375 | −0.284 |
| (0.237) | (0.248) | (0.253) | (0.224)** | (0.212)* | (0.232) | |
| Temporary help agency workers | −0.230 | −0.157 | −0.158 | −0.662 | −0.510 | −0.487 |
| (0.112)** | (0.122) | (0.116) | (0.195)*** | (0.216)** | (0.191)** | |
| Workers provided by contract firms | 0.147 | 0.037 | −0.006 | −0.025 | −0.144 | −0.208 |
| (0.094) | (0.080) | (0.077) | (0.132) | (0.117) | (0.108)* | |
| Years of education | 0.103 | 0.087 | 0.120 | 0.101 | ||
| (0.010)*** | (0.010)*** | (0.013)*** | (0.012)*** | |||
| Years of experience | 0.019 | 0.017 | 0.043 | 0.041 | ||
| (0.007)*** | (0.006)*** | (0.009)*** | (0.008)*** | |||
| Years of experience squared | −0.000 | −0.000 | −0.001 | −0.001 | ||
| (0.000)* | (0.000)* | (0.000)*** | (0.000)*** | |||
| Race | ||||||
| African-American | 0.020 | 0.079 | −0.149 | −0.072 | ||
| (0.060) | (0.059) | (0.095) | (0.093) | |||
| Asian/Pacific Islander | −0.025 | 0.044 | −0.074 | 0.025 | ||
| (0.089) | (0.080) | (0.130) | (0.114) | |||
| Other | −0.043 | −0.054 | −0.129 | −0.146 | ||
| (0.086) | (0.083) | (0.099) | (0.095) | |||
| Hispanic ethnicity | 0.007 | 0.045 | 0.027 | 0.082 | ||
| (0.063) | (0.062) | (0.074) | (0.070) | |||
| Female | −0.193 | −0.178 | −0.350 | −0.309 | ||
| (0.037)*** | (0.041)*** | (0.047)*** | (0.047)*** | |||
| Controls for 22 occupations | No | No | Yes | No | No | Yes |
| Adjusted R-squared | 0.008 | 0.142 | 0.214 | 0.016 | 0.181 | 0.214 |
| Number of observations | 2,171 | 2,171 | 2,171 | 2,171 | 2,171 | 2,171 |
Source: 2015 RPCWS.
Notes: 2015 RPCWS regressions are weighted using an alternative set of weights that accounts for the over-representation of self-employed workers in the ALP sample of respondents relative to the October 2015 Current Population Survey.
Levels of significance: *** 0.01; ** 0.05; * 0.10.
Acknowledgements
We thank David Cho, Lance Liu, and Jonathan Roth for excellent research assistance; Ed Freeland for help designing our questionnaire; Adam Looney for advice on tax data; and Mathew Baird, Karen Edwards, and Diana Malouf of RAND for help with the survey. The Princeton University Industrial Relations Section provided funding to conduct the RAND Survey. Katharine Abraham, Henry Farber, Anne Polivka, and seminar participants at LERA, MIT, NBER, Princeton, the Russell Sage Foundation, the New York Federal Reserve Bank, and the U.S. Department of Labor provided helpful comments. We are responsible for any errors. The U.S. Bureau of Labor Statistics conducted a new Contingent Work Survey (CWS) in May 2017 following the completion and acceptance for publication of our paper. The May 2017 CWS findings were not released until June 2018 (BLS 2018) and the microdata were not made public until September 2018. We include an Addendum to the article that attempts to reconcile our 2015 RAND survey findings with the 2017 CWS results.
For information regarding the data and/or computer programs used for this study, please address correspondence to