
Abstract
Using tract-level US Census data and triple-difference estimators, the authors test whether firms increase their use of part-time workers when faced with capped wage subsidies. By limiting the maximum subsidy per worker, such subsidies create incentives for firms to increase the share of their payroll that is eligible for the subsidy by increasing use of part-time or low-wage workers. Results suggest that firms located in federal Empowerment Zones in the United States responded to the program’s capped wage subsidies by expanding their use of part-time workers, particularly in locations where the subsidy cap is likely to bind. Results also show a shift toward hiring lower-skill workers.
One set of tools that governments have for intervening in labor markets is subsidies or credits given to employers to hire workers. Such programs could theoretically be used to encourage hiring of disadvantaged workers, spur hiring during economic downturns, or encourage hiring in impoverished areas. We study the effect of a common feature of these policies: a limit on the amount of money provided to firms per eligible worker. Our primary question is straightforward: Do caps on wage subsidies induce firms to change their labor decisions? Such capped wage subsidies create an incentive for firms to keep workers’ earnings at or below the cap in order to claim more credits for the same total labor hours. For example, firms may hire additional workers only at low hours, or they may choose to hire more low-wage workers. Furthermore, the degree to which the cap binds varies with market wages. At higher market wages, the wage credit cap binds at less than full-time work, and firms have stronger incentives to adjust their hiring.
To test whether firms respond to these incentives, we look at the federal Empowerment Zone (EZ) program in the United States. Enacted by legislation in 1993, this program provided benefits to a limited number of disadvantaged neighborhoods, called EZs. One benefit for firms located in an EZ is a 20% wage credit, up to $3,000 annually, for each employee who is an EZ resident. These tax credits are available for both new and existing employees and are available for the length of the program, making these tax credits more generous than most job tax credits.
We test whether EZ firms increased their use of part-time and low-wage workers, using tract-level US Census data and estimation strategies that compare the changes from 1990 to 2000 in EZ areas to the changes in a set of counterfactual areas. Differencing methods are commonly used to analyze the effects of wage credits, and the specific empirical strategies we employ are common in the related literature that evaluates the effectiveness of the federal EZ program as a local economic development program (Neumark and Simpson 2015). We also investigate how market wages affect these decisions. The results provide information about how caps on subsidy payments, imposed to limit the cost of the program, may affect program outcomes.
Literature Review
Academic interest in studying employer subsidy programs has been lively for decades (see Kaldor 1936; literature reviews in Katz 1998 and Neumark 2013). The existing evidence, however, does not provide strong support for the effectiveness of such programs, at least in terms of job creation. While some authors found evidence of job creation in certain programs, or for specific populations, or in the short term (for example, Katz 1998; Faulk 2002; Hamersma 2008; Jaenichen and Stephan 2011; Boockmann, Zwick, Ammermuller, and Maier 2012), others found little evidence of employment increases, particularly in the long run (for example, Burtless 1985; Hamersma 2008). Researchers have discussed and investigated when these programs could be successful, for example, during recessions (for example, Neumark 2013; Neumark and Grijalva 2017), or how they can be designed and implemented in alternative ways to achieve their goals (for example, Bartik and Bishop 2009; Almeida, Orr, and Robalino 2014).
The literature has identified a variety of reasons why this policy may not be effective at improving labor market conditions for workers. Evidence shows that targeted workers may be negatively affected because of stigma effects (Burtless 1985). These programs often suffer from low take-up rates by firms (for example, the Targeted Jobs Tax Credit [Bishop and Montgomery 1993] and the Work Opportunity Tax Credit [WOTC] and Welfare-to-Work Tax Credit [WtW] [Hamersma 2011]). This could be attributable to a lack of awareness of the programs or to the administrative costs of identifying eligible workers. Using a survey, Hamersma and Heinrich (2008) found that a large sample of firms were aware of the WOTC program, yet it did not influence their hiring. And Hamersma (2011) found evidence that there appear to be fixed costs of firms’ participation in the WOTC/WtW programs, possibly because of minimum job duration requirements.
We are unaware of research that has studied the incentives created by capped wage subsidies for firms to substitute toward part-time and low-wage work. 1 Neumark (2013) noted that targeting credits at employment could create incentives to hire at low hours. Hamersma (2011) noted that few workers in the WOTC/WtW are near the credit cap, so she could not investigate firms’ responses to the cap. Some prior research has tested for rent-seeking behavior by firms. For example, Lorenz (1995) discussed problems in the design and implementation of the Targeted Jobs Tax Credit program that allowed rent-seeking. Hamersma (2011) found no evidence that firms attempt to maximize their credits in their hiring decisions, possibly because it was administratively difficult to identify the subsidized workers or because the WOTC/WtW programs had minimum job tenure requirements that may be less easy to manipulate than weekly hours. Hamersma (2011) did find that firms with a higher potential exposure to the wage credit, having a higher proportion of workers with job tenures exceeding the minimum thresholds, were more likely to claim the credits. (Similarly, we argue that some firms are more likely to respond to the wage subsidy cap based on whether market wages cause the cap to bind.) Ajilore (2012) studied the WOTC program and found no evidence of a decrease in employment among workers whom he argued are close substitutes for targeted workers. A report by the US Government Accountability Office (USGAO 2001) found no evidence that firms fired workers to claim credits on new hires in the WOTC program.
Federal Empowerment Zone Program
To test whether firms facing capped wage subsidies adjust hours worked, we look at Round I of the federal EZ program in the United States. 2 Created as part of the 1993 Omnibus Budget Reconciliation Act (OBRA 1993, P.L. 103–66), the program aims to incentivize firms to locate in and to hire workers living in specified distressed areas. State and local governments were encouraged to submit applications for EZs that met two criteria: At least 20% of the population had to live below the poverty line and the area had to have an unemployment rate of at least 6.3% (USGAO 2004). The areas did not have to be compact (see Supplemental Online Appendix Figure A.1 for example maps). (Hereafter, numbering for Online Appendix material is prefaced with an “A.”) A part of the program focused on rural areas, but our analysis focuses exclusively on urban areas. A total of 78 (Wallace 2004) urban applications were received for Round I of the program and six areas were selected within cities (located in Atlanta, Baltimore, Chicago, Detroit, Philadelphia/Camden, New York). Sixty-five areas were designated Enterprise Communities, which received less generous benefits than the EZs. As we discuss later in the methodology section, the six EZ areas form our treatment group and 59 of the 65 Enterprise Communities provide our counterfactual group.
EZ areas received several benefits from the program. The most generous and utilized benefit (Hanson 2011) was a capped, refundable wage credit to businesses for operating in the EZ areas and hiring residents of the areas. 3 Starting with 1995 tax returns, a business located in the EZ area would be allowed to claim a wage tax credit of 20% on the first $15,000 in wages paid to a qualified worker. A qualified worker was someone who lived in the EZ, performed the majority of their work in the EZ, and was employed by the firm for at least 90 days. The wage credit was available to firms already operating in the EZ areas, as well as to new firms and any existing firms that relocated to the EZ area. Unlike many wage tax credit programs that restrict the benefit to only new hires, the EZ program allowed firms to apply the wage credit to both new and existing employees. The program allowed firms to collect the credit for at least 10 years, with the possibility for more years if the program was renewed (the EZ program was renewed through 2019).
These features make the EZ wage tax credit generous on a per-qualified-worker basis relative to most other wage tax credits that have been studied, which typically apply for 18 months or less after hire date and cover only new hires. The generosity of the EZ wage tax credit makes it more likely that the benefits of claiming the credit outweigh any administrative or fixed costs of firm participation in the program. Additionally, as noted previously in the literature (see, for example, Katz 1996), location-based targeting of credits could avoid some of the negative stigma problems that can occur with individual-targeted credits (Burtless 1985).
The fact that the federal EZ program covers qualified existing workers may increase take-up rates, but it also means that firms could claim the credit without expanding employment. While targeting job creation is typically desired in wage subsidy policies to avoid rent-capture by firms, the EZ program was designed as a local economic development tool. In that case, while new job creation would be good, wage increases, additional hours, or firm relocation could all be beneficial outcomes. A wide literature has used the EZ program to investigate the effectiveness of place-based economic development programs, including a broad range of outcomes such as firm movement, property values, and resident outcomes (for example, earnings, employment, and poverty). Neumark and Simpson (2015) reviewed this literature and generally found that place-based policies led to increases in local property values, while the evidence on resident outcomes is somewhat mixed.
Labor Demand Responses to Capped Wage Subsidies
Our study is motivated by the observation that firms can maximize the benefits they receive from a capped wage subsidy by keeping workers’ pay close to the subsidy cap. We focus on two mechanisms firms can use: limiting workers’ hours and substituting toward workers with low wages.
For discussion purposes, assume that firms eligible for a capped wage subsidy employ a production function
A wage subsidy changes the marginal expense to the firm of employing an hour of work. Assuming that the worker is hired for 52 weeks a year,
4
the marginal cost of employing an eligible employee for an additional hour of work will be
How firms respond will depend on the level of the annual salary cap of the subsidy and the level of the wage that the firm must pay. We expect that the weekly hours chosen by the firm will decrease as market wages increase, since firms will reach the maximum wage credit at lower levels of hours worked. Consider the capped wage subsidy offered to firms that are located in EZ areas, where
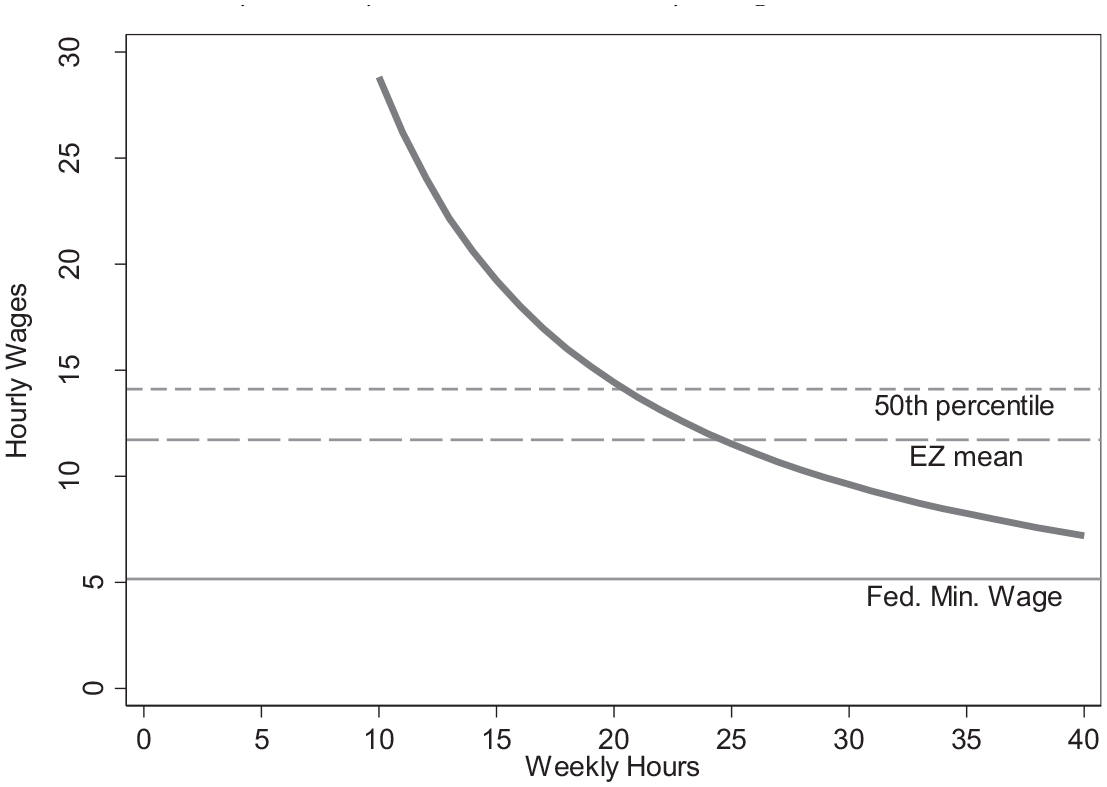
Earnings Cap of the Federal Empowerment Zone Wage Credit by Weekly Hours and Hourly Wage, 2000
Firms facing such a subsidy have an incentive to employ a higher proportion of workers in a part-time capacity. Since labor demand elasticities tend to be larger for the extensive margin than for the intensive margin, we might expect that wage credits have a larger effect on hiring than on hours (Neumark 2013). However, if firms pay wages above
The higher the market wage, the greater the incentive to spread hours across multiple workers because it takes fewer hours for a worker to hit the subsidy cap. This reasoning points to another way that a firm can maximize its wage subsidy: substitute low-wage workers for high-wage workers to increase the share of workers with annual earnings at or below the subsidy cap. The higher the rate of the wage subsidy (
While we have discussed this in terms of individual firm responses, it is also possible that the firms that benefit the most from the wage subsidies expand more than other firms. Since firms with more part-time workers benefit more from the subsidy, these firms’ share of employment in the EZs could grow in response to the incentives. This mechanism is another way in which the capped wage subsidy could induce an increase in part-time share. We interpret either a composition change or establishment-level changes as evidence that capped wage subsidies encourage part-time work.
Potential Limitations and Complications
While the structure of the wage subsidy and the predominant wages in EZ areas would appear to incentivize firms to shift to more part-time work, we recognize reasons why such a shift may not occur. For example, effects could be muted if firms have large administrative costs associated with using the tax credit, as discussed by Hamersma (2011) regarding the WOTC/WtW program. However, the extent to which the credit has been claimed and the long life of the credit suggest that this is a not a major factor. We may also see muted responses if firms face fixed costs for employment, adjustment costs from new hires, or indivisible labor. But these theoretical possibilities may not be important in our context. For example, it seems unlikely that employment fixed costs are high enough to prevent firms from responding to the wage credit, especially since part-time workers often do not receive benefits, reducing their compensation costs. Furthermore, we will be investigating worker outcomes six years after the EZ program was created, allowing substantial time for firms to adjust their workforces. And while it may be difficult to substitute workers and hours in some occupations and industries, it may be easier in lower-skill occupations. We show later in the article that such occupations expand in response to the EZ program.
Another reason for a muted response is that firms may respond on the intensive margin by increasing the hours of current workers. Under our assumption of permanent, full-year employment, the wage credit takes a form of a kink in the marginal cost of an hour of work. A similar kink in the cost of labor is caused by overtime rules, which firms respond to on the intensive margin (Costa 2000; Hamermesh and Trejo 2000). Again, we might not expect as much of a response of hours compared to the extensive margin, given differences in the elasticity of labor demand (Neumark 2013). Furthermore, an intensive margin effect would be more likely in the face of adjustment or hiring costs, which we have argued are unlikely to be prevalent in our application. Finally, while some firms may raise the hours of their employees, this effect is unlikely to cause an increase in full-time work because the earnings cap is achieved below 40 hours for any wage above $7.21. Again, only firms paying wages significantly lower than the EZ area average are likely to respond by increasing hours of current workers to full-time status.
Another reason that we may not find a shift toward part-time work is that firms will respond by hiring at low wage levels, rather than at low hours. Assuming that the firms cannot pay below market wages for a particular job, this would mean that they hire more positions at the bottom of the wage scale, presumably lower-skill workers. If firms respond on this margin, we would expect to see a relative increase in the proportion of less-skilled workers in these areas. We test for this outcome as well.
The discussion so far has assumed that the wage subsidy has had no effect on market wages. A wage subsidy in a market can distort market wages, with the incidence dependent on the relative elasticity of the labor supply and demand. Recent evidence from outside of the United States has found that cuts in payroll taxes in Sweden (Saez, Schoefer, and Seim 2019) and hiring credits in France (Cahuc, Carcillo, and Le Barbanchon 2018) had little effect on market wages, but clear effects on employment. Hamersma (2008) provided evidence that approximately 38% of the wage credit in the WOTC/WtW programs is passed through to workers in the form of higher wages. The wage subsidy in the EZ program, however, could have less of an effect on market wages. First, the wage subsidy applies only to firms operating within a limited geographic area, not an entire labor market. Second, the distressed nature of the EZ areas makes it likely that an excess supply of labor is initially available, reducing the likelihood that wages are bid up. Finally, if wages do rise in response to the subsidy, this would further increase the likelihood of an overall shift toward part-time work, since the earnings cap is achieved at lower hours of work as the wage rises.
Outcome Data
We use Decennial Census data aggregated to the Census tract level—the same unit of geography used for EZ applications. Much of the existing literature on the EZ program uses Summary File tabulations of residential population and housing characteristics within Census tracts from the Decennial Censuses. These tabulations were also used in the application process for the EZ program. Our interest is in the response of firms that employ individuals in these areas. While we use some Summary File data on residents from 1980 and 1990 to control for tract characteristics and trends, we construct our outcome measures from the 1990 and 2000 Census Transportation Planning Packages (CTPP). 6 The CTPP provides counts of workers by place-of-work for a variety of traits, such as hours worked, annual earnings, occupation, industry, and demographic characteristics. This data source is the only publicly available resource for the attributes of workers by place-of-work tract, and it enables us to investigate changes in the characteristics of workers who work in the designated EZ areas. Tract boundaries can change over time. We use a Graphical Information System (GIS) procedure to generate consistent geographies across 1980, 1990, and 2000.
In our primary analysis, we use the information on hours worked to investigate whether a shift occurs toward more part-time work. The share of tract workers with weekly hours less than 35 hours a week will be our primary outcome of interest throughout our analysis. Research on the federal EZ program, however, has often found positive effects on total employment (for example, Hanson 2009; Busso, Gregory, and Kline 2013), although these results are sensitive to specification (Neumark and Young 2019). 7 Therefore, we also consider the log of total, part-time, and full-time workers (we add 1 to these numbers to account for tracts with no workers of a given type). We also use information on occupational mix to investigate changes in the skill mix of workers that might arise in response to the capped wage subsidy.
Although the CTPP allows us to investigate place-of-work data, we encountered important limitations. Most important, data are available for only one pretreatment period (1990), which has implications for our empirical approach. Furthermore, two limitations of the CTPP data tend to cause our estimates to attenuate toward zero. First, the CTPP does not allow us to separately identify information about zone employees who live in the EZ area and those zone employees who do not. Because the wage tax credit applies only to zone employees who reside in the zone, it would be ideal to be able to study their hours and earnings separately. The CTPP Flows tables do allow us to calculate the share of workers in a tract who live in the EZ area. Combining this information with the CTTP place-of-work data and the Census Summary File place-of-residence data suggests that approximately 13% of workers in 1990 in the EZ areas also live in the area. Conversely, about 19% of 1990 EZ residents worked in the EZ area. These numbers are broadly similar to those simulated from IRS data on wage credit claims (Hanson 2011). As we will discuss later, we tend to find larger effects when we weight the regressions by the share of workers in each tract who are zone residents, suggesting the attenuation problem exists.
The second limitation is that we observe only total (usual) hours of work across all jobs for workers. If firms respond to the subsidy cap by showing a preference for part-time work, workers may respond by getting a second job. Because we do not observe hours at a particular job, some workers who work multiple part-time jobs will be counted as working full-time because their total hours worked are at least 35 hours per week. Because of these two limitations, our results may underestimate the true effect of changes in part-time work among the workers actually eligible for the subsidy.
Methodology
Our methodology compares worker outcomes in EZ areas to a set of counterfactual areas before and after the availability of the capped wage subsidy in 1995. We construct counterfactual areas from the federal Enterprise Community (EC) program, which are drawn from areas that applied to and qualified for the EZ program but were not chosen. 8 The use of these areas as counterfactuals is common in the EZ evaluation literature (for example, Hanson 2009; Busso et al. 2013; Reynolds and Rohlin 2015). 9
EC areas are used to construct counterfactuals for a number of reasons. First, EC areas received some of the benefits provided to EZ areas, but they did not receive the EZ wage subsidy. We treat ECs and Enhanced ECs (which received larger block grants) as equivalent for our analysis. Comparing EZ areas to locations that were not entitled to any of the program’s benefits would only further confound our identification of the wage subsidy effect. For example, residents of both EZ and EC areas who were ages 18 to 24 qualified for the WOTC program. Our methodology should eliminate any confounding effects from this feature of the WOTC program. Second, using counterfactual areas that applied to the program but did not receive the subsidy removes application bias. Third, EC areas are not located in the same cities as the areas that received EZ status, which is important because it has been shown that the EZ program had spillover effects within cities in which the EZ areas were designated (Hanson and Rohlin 2013).
While the EC and EZ areas all met the minimum qualifications for Empowerment Zone consideration, the EZ areas were more distressed, as has been documented previously (for example, Hanson 2009; Busso et al. 2013; Reynolds and Rohlin 2014). Table 1 presents summary statistics on characteristics of EZ and EC areas using data from 1980 and 1990 Summary Files. Whereas both EZ and EC areas had high rates of poverty and unemployment in 1990, the EZ areas exceed the EC areas in both categories in both 1980 and 1990. EZ areas also have lower median incomes, higher rates of receiving welfare, lower homeownership rates, and lower home values than EC areas. Thus, we need to account for these differences in our methodological approach.
Summary Statistics
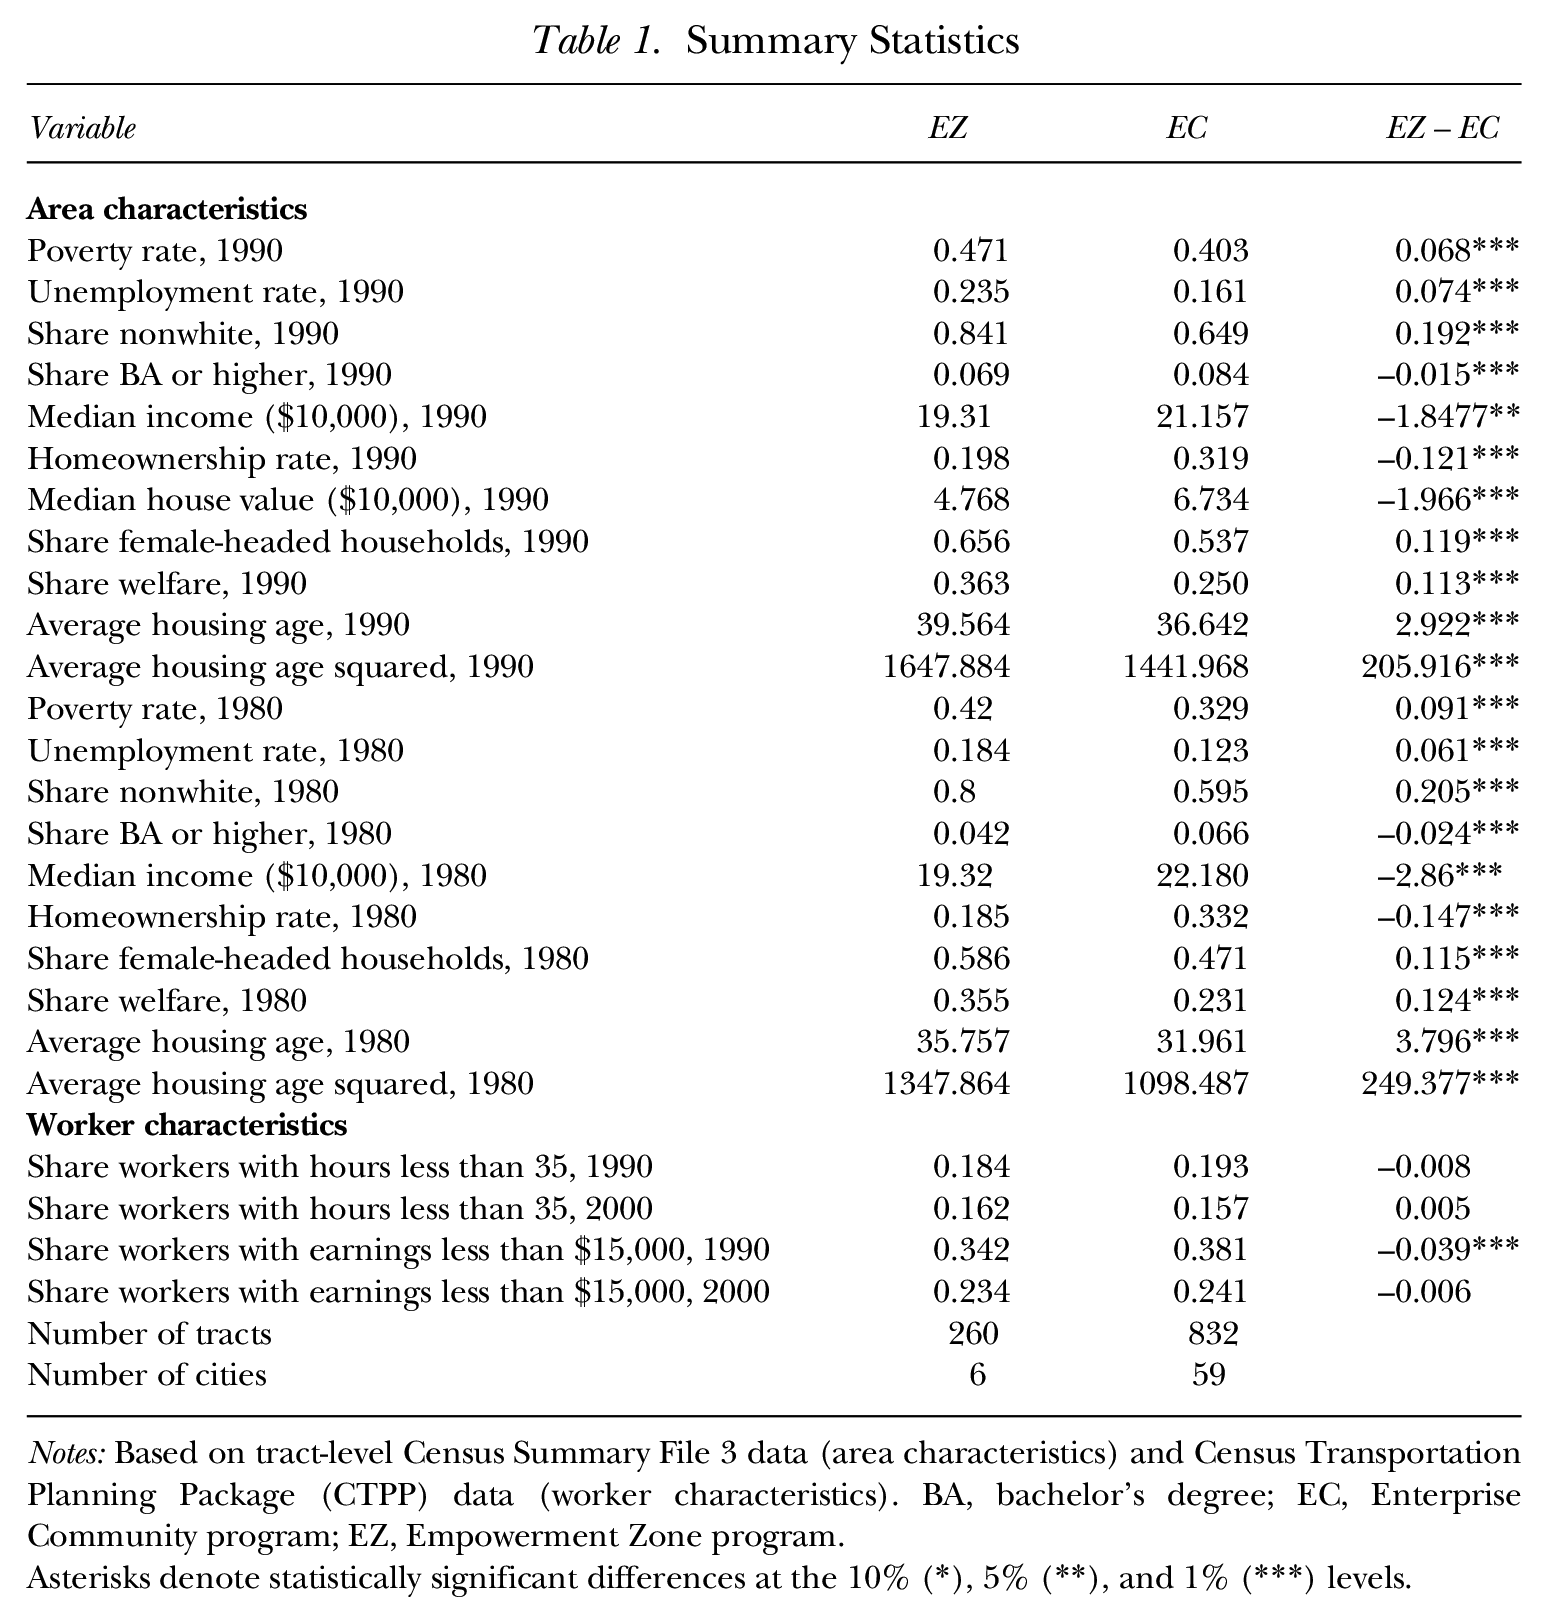
Notes: Based on tract-level Census Summary File 3 data (area characteristics) and Census Transportation Planning Package (CTPP) data (worker characteristics). BA, bachelor’s degree; EC, Enterprise Community program; EZ, Empowerment Zone program.
Asterisks denote statistically significant differences at the 10% (*), 5% (**), and 1% (***) levels.
Since the CTPP data provides outcomes only in 1990 and 2000, we cannot use a panel approach to our difference-in-difference strategy. Instead, we adapt estimation strategies that are commonly used in the EZ literature that also help us control for differences between EZ and EC areas. The simplest version of our identification strategy is a difference-in-difference strategy that compares the change from 1990 to 2000 in outcomes in EZ areas (6 cities, 260 tracts) with changes in EC areas (59 cities, 832 tracts). Thus, for each outcome we construct
The estimating equation we use is

where EZ represents a dummy variable for whether the EZ wage subsidy is provided (meaning 1 if the Census tract is in an EZ area and 0 if it is in an EC area). The vector X includes the 1990 and 1980 variables commonly used in the EZ literature, including some that are likely correlated with part-time work status (tract poverty rate, unemployment rate, percent minority, age distribution, percent with a bachelor’s degree or higher, median household income, percent female-headed household, percent households receiving welfare, occupation and industry distribution), and others that the EZ literature has found to be important differences in economic conditions perhaps related to EZ selection (homeownership rate, age of housing unit, and median house value). See Table A.1 for a complete list of characteristics. Including the levels of X in both periods, instead of the change between them, is used to capture the differences in tract characteristics observed when the EZ areas were selected as well as the trends in those variables between EZ and EC areas. Note that our specification nests the first-difference specification, but is more general. All regressions are estimated with standard errors clustered at the city level.
To further refine our estimates, we employ propensity score methods, which are a common approach used in the place-based policy literature to address potential endogeneity concerns (Busso et al. 2013; Reynolds and Rohlin 2015; Neumark and Young 2019). Propensity score matching is a technique for balancing the distributions of observable covariates through the use of propensity scores (Rosenbaum and Rubin 1983). We first use this method to create a matched sample of EZ and EC tracts that have similar 1980 and 1990 characteristics, solving the problem of EZ areas being more impoverished (see Appendix for details). We then estimate our regressions on this matched sample of 216 EZ and 272 EC tracts with similar 1980 and 1990 characteristics (see Table A.1).
Our preferred approach, however, is a triple-difference that compares relative outcomes between EZ areas and the rest of their cities, with EC areas and the rest of their cities, and before and after program implementation. This approach accounts for any citywide trends (observable or unobservable in data) that may also be affecting the EZ and EC areas in each city. To do this, we take each city in our data, select all of the tracts that are outside of the EZ or EC area in that city, and then calculate the average outcome

where
To refine our triple-difference estimates, we use propensity score methods a second way—to identify tracts of each city that have similar characteristics to the EZ/EC tracts in the same city. We then use only those matching tracts to calculate
Results
Part-Time versus Full-Time Employment
Table 2 presents the baseline results testing the hypothesis that the subsidy cap will encourage part-time work. Each cell represents the results of a specific estimation strategy defined by an outcome, the sample (all EZ/EC tracts or only matched EZ/EC tracts), and by the type of differencing (double-difference, citywide triple-difference, or matched sub-city triple-difference).
Effect of Capped Wage Subsidies on Employment Levels and Share Part-Time
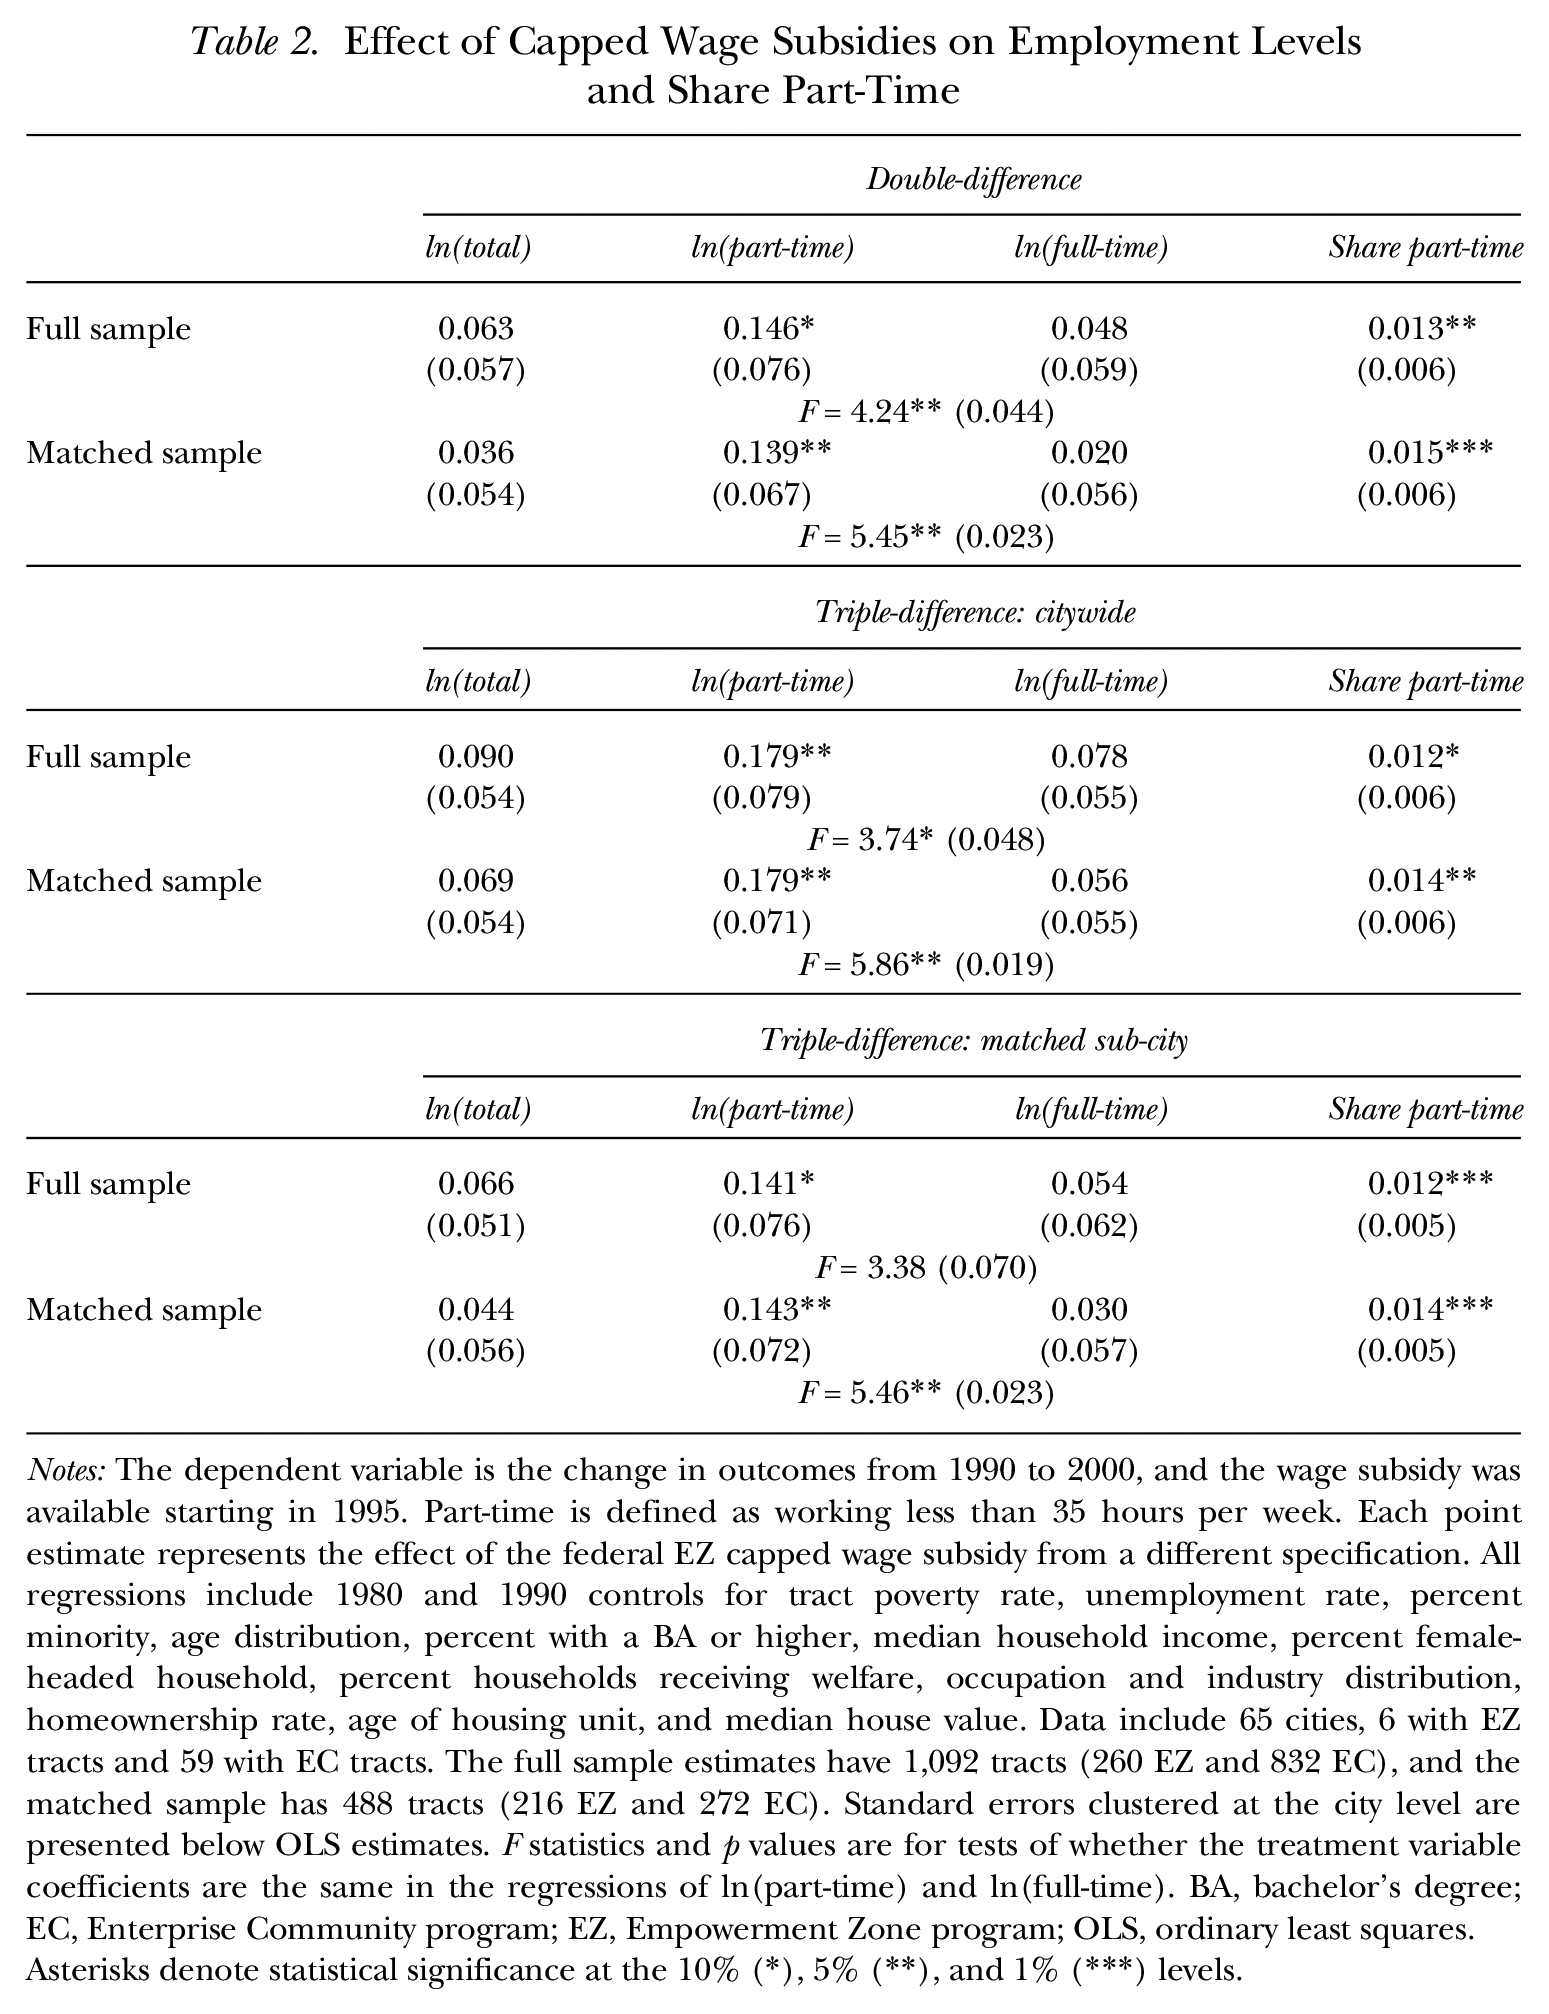
Notes: The dependent variable is the change in outcomes from 1990 to 2000, and the wage subsidy was available starting in 1995. Part-time is defined as working less than 35 hours per week. Each point estimate represents the effect of the federal EZ capped wage subsidy from a different specification. All regressions include 1980 and 1990 controls for tract poverty rate, unemployment rate, percent minority, age distribution, percent with a BA or higher, median household income, percent female-headed household, percent households receiving welfare, occupation and industry distribution, homeownership rate, age of housing unit, and median house value. Data include 65 cities, 6 with EZ tracts and 59 with EC tracts. The full sample estimates have 1,092 tracts (260 EZ and 832 EC), and the matched sample has 488 tracts (216 EZ and 272 EC). Standard errors clustered at the city level are presented below OLS estimates. F statistics and p values are for tests of whether the treatment variable coefficients are the same in the regressions of ln(part-time) and ln(full-time). BA, bachelor’s degree; EC, Enterprise Community program; EZ, Empowerment Zone program; OLS, ordinary least squares.
Asterisks denote statistical significance at the 10% (*), 5% (**), and 1% (***) levels.
The estimates in the first row of Table 2 use the full sample and the difference-in-difference strategy. 10 Estimates suggest that EZ areas experience a 0.063 increase in the log of total employment relative to EC areas. While statistically insignificant, the magnitude of this estimate is broadly consistent with the prior literature, even though the data set we use is novel to this literature. The increase is larger for part-time employees, with a relative increase of 0.146 log points for part-time employment compared to a statistically insignificant 0.048 log points estimate for full-time employment. The difference between these estimates is statistically significant (F = 4.24, p = 0.044). Thus, the overall percentage of part-time work in EZ tracts increased by 1.3 percentage points relative to EC tracts. This increase is statistically significant at the 5% level.
The estimates in the second row use the matched EZ/EC sample and, although the overall pattern is the same, the magnitudes differ somewhat. The results on this balanced sample suggest a 0.139 log point increase in part-time work, compared to a statistically insignificant 0.020 log point effect for full-time workers. Consequently, we measure a statistically significant 1.5 percentage point increase in the percentage of part-time work in EZ tracts relative to observationally equivalent EC tracts.
Both the full and matched sample estimates on part-time share suggest significant changes relative to the baseline part-time rate in EZ areas. In 1990, approximately 18% of workers in EZ areas worked part-time. Thus, the relative increase in part-time share in the full sample represents a 7.2% increase relative to that baseline (
The middle panel shows the results of the specification that removes citywide trends and the bottom panel shows the results of the specification removing trends of observationally similar tracts in each city. In general, these triple-difference estimates show a similar pattern of statistically significant increases in part-time employment and share part-time, and insignificant increases in total and full-time employment. The estimated effect of the EZ program on part-time share from these triple-difference models ranges from 1.2 percentage points to 1.4 percentage points.
To the best of our knowledge, this article is the first to show that the increases in part-time employment associated with EZs were greater than the increases in full-time employment. These results are robust to a variety of additional considerations. Although the data are unavailable for us to control for pre-trends in place-of-work part-time share, we can conduct a placebo test on pre-trends using place-of-residence data. The dependent variable in these placebo regressions is the change in part-time share between 1980 and 1990 for employed EZ/EC residents. The double-difference and citywide triple-difference results in Table A.6 show that EZ residents had less increase than the EC residents in part-time share, meaning that the pre-trend is opposite of the trend we find between 1990 and 2000. The matched sub-city triple-difference results find no differential trends in resident part-time share between 1980 and 1990.
Consistent with the placebo test results, directly including 1980 and 1990 place-of-residence part-time share as a covariate in our main estimations has no substantive effect on our estimates (column (1) of Table A.7). As previously discussed, our results could be attenuated because our outcomes potentially include both subsidy-eligible and -ineligible workers. We find some evidence for this when we weight tracts by the proportion of workers in each tract that live in EZ/EC areas. Though weighting has little effect on the magnitudes of estimates for the full sample, for the matched sample the magnitudes of the weighted estimates are larger than the baseline estimates (columns (2) and (3) of Table A.7). For example, with weighting the estimated effect on part-time share is 2.2 percentage points from the matched sample and the matched sub-city triple-difference results.
All results to this point have been about employment in EZs. If the increase in part-time share in these place-of-work results is attributable to the capped wage subsidy, then it should also affect EZ resident part-time share because only EZ residents are eligible for the subsidy. To cross-check our place-of-work estimates, we use the part-time share of workers living in EZ/EC tracts as an outcome measure (columns (4) and (5) of Table A.7). While most of these place-of-residence estimates are statistically insignificant, the point estimates are all positive and within the 95% confidence interval of the corresponding place-of-work estimates. Since residents of these tracts can work outside the EZ, and evidence points to in-migration of high-income households (Reynolds and Rohlin 2015), we feel that the place-of-work estimates better capture the decisions of EZ firms than do the place-of-residence estimates.
Results by Subsidy Cap Constraint
We argued previously that the incentives to increase the use of part-time work should increase with the wages firms face having to pay. To test this, we put tracts into three categories based on the proportion of workers in 1990 earning at least $15,000: less than 50% of workers, 50 to 75% of workers, or more than 75% of workers. Call these low-wage, mid-wage, and high-wage tracts, respectively. Our cut points put most tracts in the middle category: approximately 12% of tracts are categorized as least constrained, 74% of tracts are in the middle category, and 14% of tracts are in the most constrained category. We then include dummy variables for these categories, and their interaction with the EZ dummy variable, in our regression framework. Our omitted category is low-wage tracts.
Table 3 presents the results from the triple-differencing strategies for the full and matched samples. For both samples, the main effects of the dummies for share of workers above cap suggest that, on average, the increase in part-time between 1990 and 2000 was larger in mid- and high-wage tracts than in low-wage tracts, regardless of EZ status. 11 The coefficient on the EZ dummy variable without interaction represents the effect in low-wage EZ tracts and shows that the percent part-time rose less in the low-wage EZ tracts than in low-wage EC tracts. The estimated effect in low-wage EZ tracts ranges from −2.6 to −3.3 percentage points, depending on sample and type of triple-difference, and is either statistically insignificant or significant at the 10% level.
Estimates of the Effect of Capped Wage Subsidy on the Share of Part-Time Workers by Portion of Tract Workers in 1990 Earning at Least the Annual Earnings Cap ($15,000)
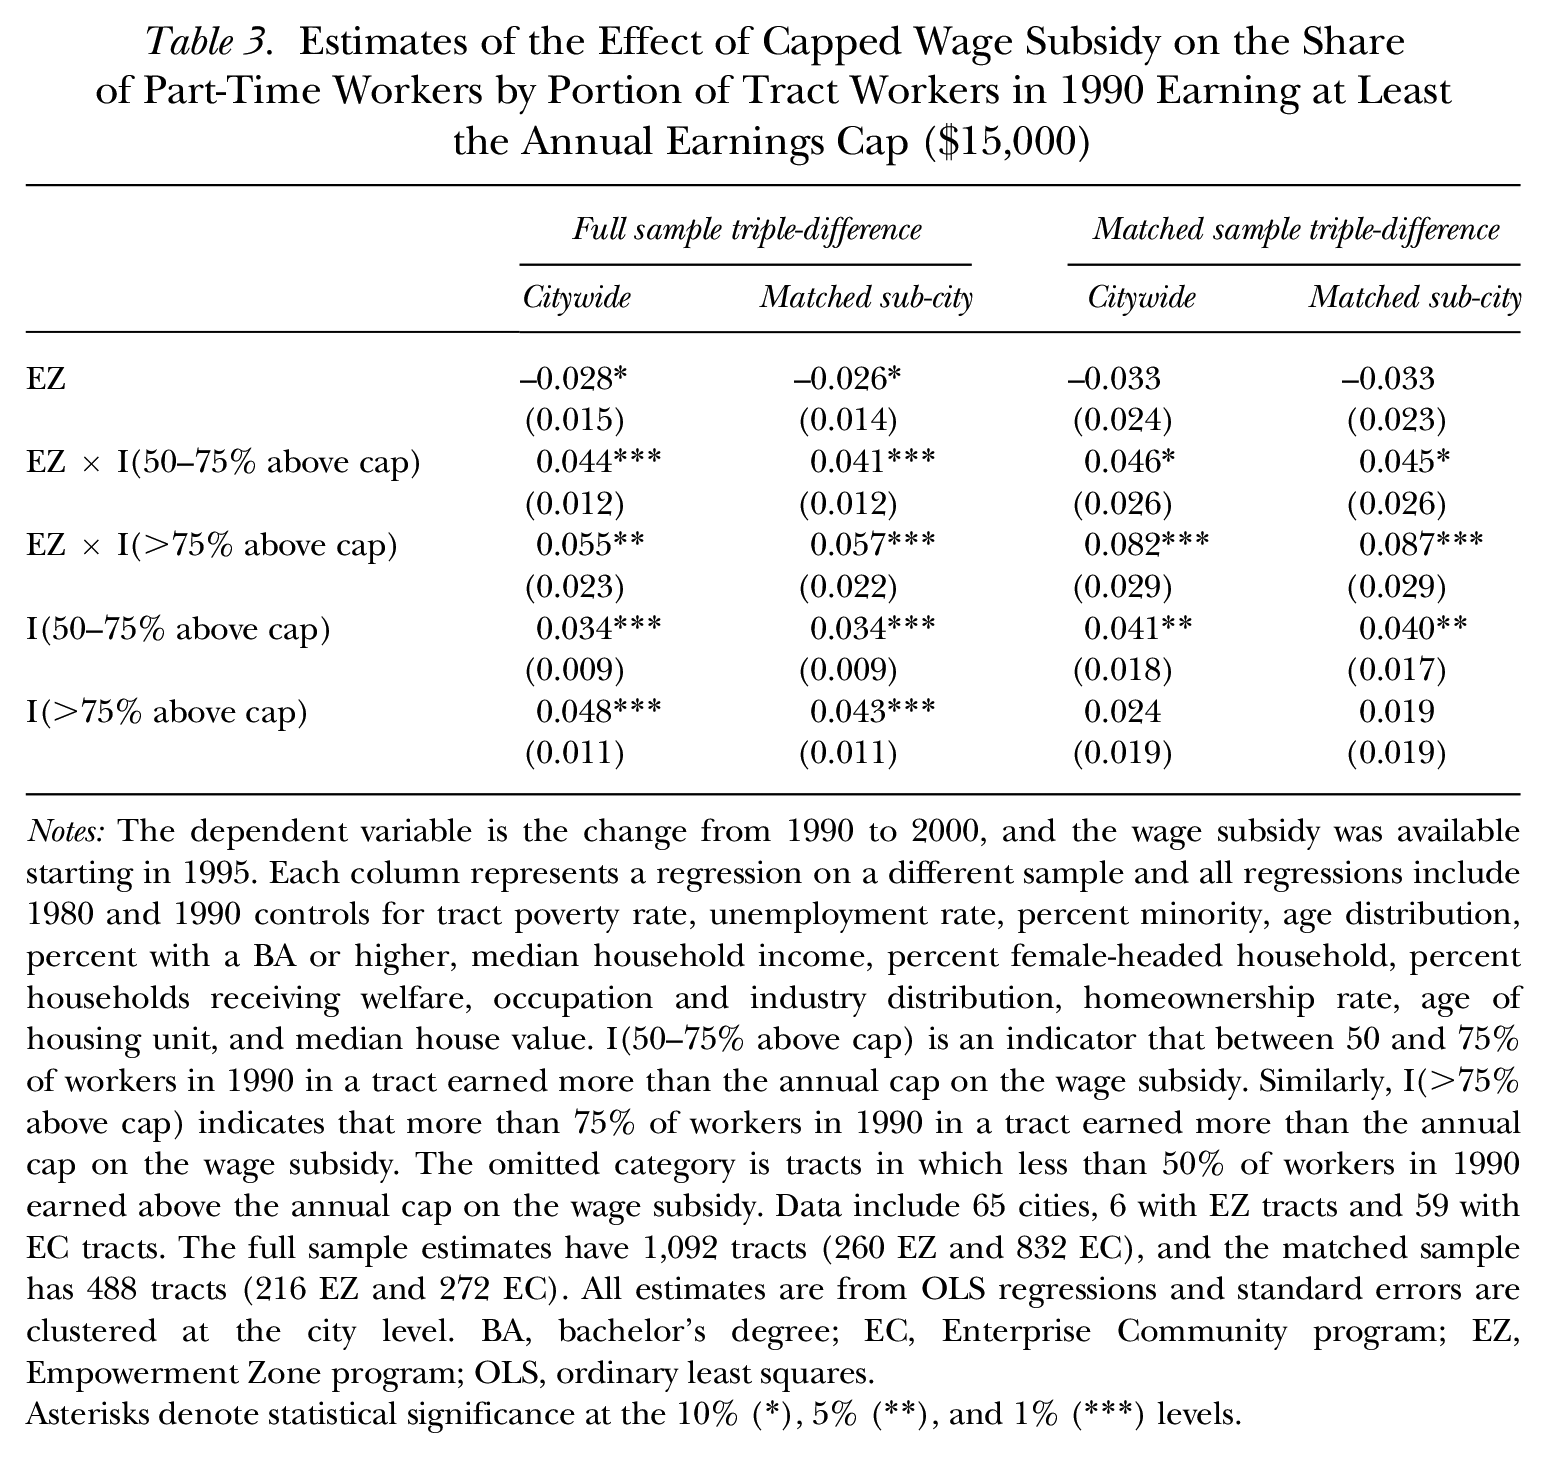
Notes: The dependent variable is the change from 1990 to 2000, and the wage subsidy was available starting in 1995. Each column represents a regression on a different sample and all regressions include 1980 and 1990 controls for tract poverty rate, unemployment rate, percent minority, age distribution, percent with a BA or higher, median household income, percent female-headed household, percent households receiving welfare, occupation and industry distribution, homeownership rate, age of housing unit, and median house value. I(50–75% above cap) is an indicator that between 50 and 75% of workers in 1990 in a tract earned more than the annual cap on the wage subsidy. Similarly, I(>75% above cap) indicates that more than 75% of workers in 1990 in a tract earned more than the annual cap on the wage subsidy. The omitted category is tracts in which less than 50% of workers in 1990 earned above the annual cap on the wage subsidy. Data include 65 cities, 6 with EZ tracts and 59 with EC tracts. The full sample estimates have 1,092 tracts (260 EZ and 832 EC), and the matched sample has 488 tracts (216 EZ and 272 EC). All estimates are from OLS regressions and standard errors are clustered at the city level. BA, bachelor’s degree; EC, Enterprise Community program; EZ, Empowerment Zone program; OLS, ordinary least squares.
Asterisks denote statistical significance at the 10% (*), 5% (**), and 1% (***) levels.
The interaction terms suggest that as the earnings cap in the EZ areas begins to bind more, the share of workers who are part-time increases. Percent part-time rose 4.1 to 4.6 percentage points more in mid-wage EZ tracts than in low-wage EZ tracts. The estimated increase in high-wage tracts is even higher, with the percentage of part-time rising 5.5 to 8.7 percentage points more than in low-wage EZ tracts. Overall, these results show a larger increase in part-time share in higher wage EZ tracts than in lower wage EZ tracts, which is what we would expect to find if the increase in part-time share is a response to the capped wage subsidy.
Occupation and Skill Mix of Workers
As discussed previously, firms could also respond to the subsidy cap by hiring more low-wage/low-skill workers. If this occurred, the share of lower-skill and less-educated workers employed in the area would correspondingly increase. 12 The CTPP data do not provide education information, but they do provide the occupational mix of the area. Given differences in skill requirements and wages paid across occupations, we can investigate changes in occupational mix to infer information about firm responses across skill and wage. For simplicity, we group occupations into approximate terciles based on the percentage of workers in those occupations with a bachelor’s degree (calculated from 1990 and 2000 IPUMS Census data). The top tercile consists of professional, management, and technician occupations—60.3% of this group of workers have a bachelor’s degree. The middle tercile is sales and clerical occupations, and the bottom tercile is craft, production, and transportation occupations. Of the middle group, 20.8% have a bachelor’s degree, compared with 6.5% of the bottom group.
Table 4 presents triple-difference estimates of the effects of EZ on the employment share of these groups. Results show an increase in the employment share of the low-education group of occupations and a decrease in the employment share of the high-education group of occupations. Specifically, estimates suggest an increase of between 1.7 and 6.8 percentage points in the employment share of the low-education group, depending on specification and sample. By contrast, the employment share of the high-education group decreases between 1.5 and 5.0 percentage points. Results by specific occupation show decreases in professional occupations and increases in production and transportation occupations (Table A.9).
Estimates of the Effect of Capped Wage Subsidies on the Proportion of Workers in Occupations Grouped by Education
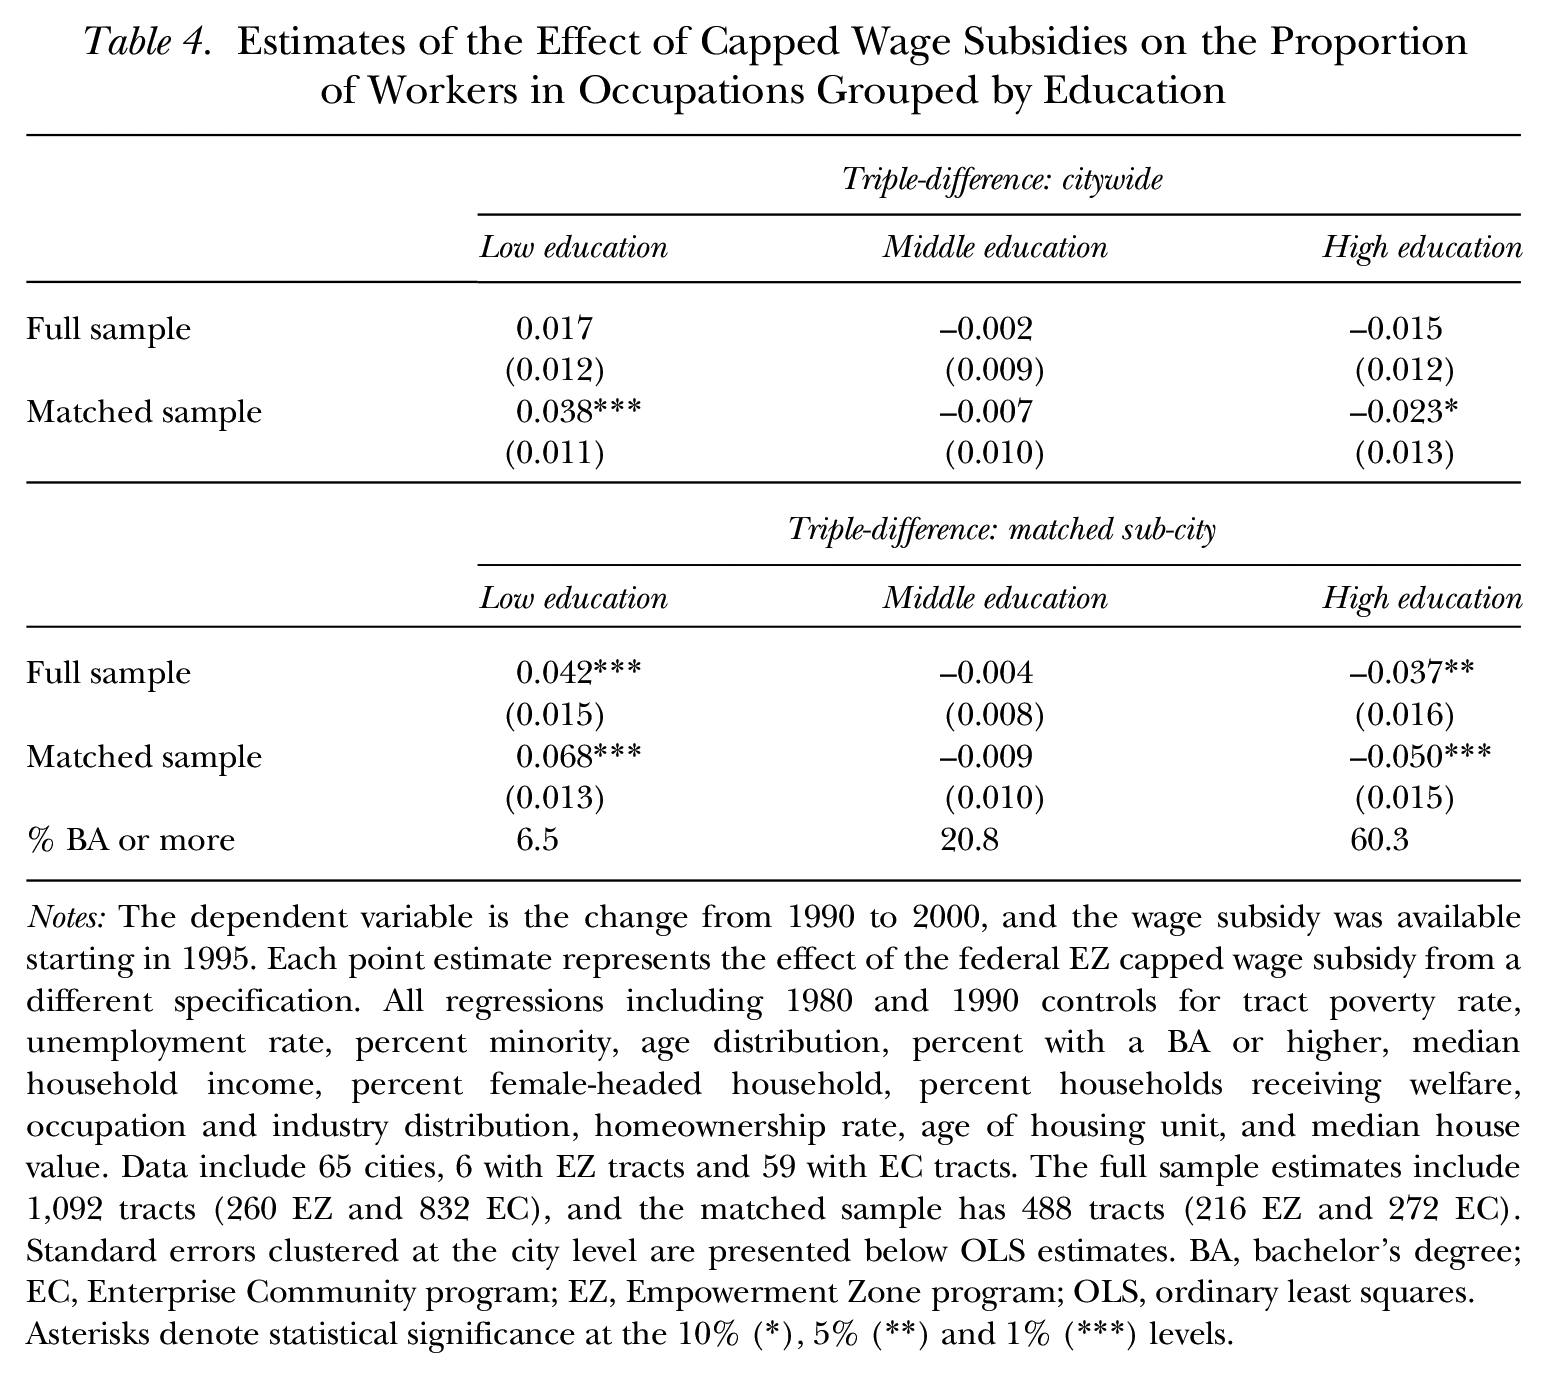
Notes: The dependent variable is the change from 1990 to 2000, and the wage subsidy was available starting in 1995. Each point estimate represents the effect of the federal EZ capped wage subsidy from a different specification. All regressions including 1980 and 1990 controls for tract poverty rate, unemployment rate, percent minority, age distribution, percent with a BA or higher, median household income, percent female-headed household, percent households receiving welfare, occupation and industry distribution, homeownership rate, age of housing unit, and median house value. Data include 65 cities, 6 with EZ tracts and 59 with EC tracts. The full sample estimates include 1,092 tracts (260 EZ and 832 EC), and the matched sample has 488 tracts (216 EZ and 272 EC). Standard errors clustered at the city level are presented below OLS estimates. BA, bachelor’s degree; EC, Enterprise Community program; EZ, Empowerment Zone program; OLS, ordinary least squares.
Asterisks denote statistical significance at the 10% (*), 5% (**) and 1% (***) levels.
Conclusion
We discuss how a capped wage subsidy creates an incentive for firms to use part-time or low-wage workers to obtain the maximum subsidy possible. We then use federal Empowerment Zones (EZs) to test whether firms increase their use of part-time workers in response to a capped 20% wage tax credit. EZs are a good way to test this because the EZ wage credit is relatively large, long-lived, and less prone to stigma effects than other hiring tax credits. In addition, the combination of rejected applicant areas and the literature evaluating the EZ program allow us to construct relevant comparisons for the EZ tracts. As far as we know, this article is the first to test the economic incentives of the wage subsidy in the EZ program, as the existing EZ literature has focused on evaluating the program as a tool for local economic development.
We find evidence of modest increases in the use of part-time workers in EZ areas from 1990 to 2000, approximately equal to 1.2 to 1.5 percentage points, or a 7 to 8% increase relative to the baseline. However, that average effect masks important heterogeneity. We find that EZ tracts where the $15,000 annual earnings cap is more likely to bind have a larger increase in the prevalence of part-time work. From this we conclude that, at least for the EZ program, the capped wage subsidy led to a shift to more part-time employment. Complementary results show that firms in EZs shift toward lower-skill workers—another way to stay under the earnings cap and maximize the subsidy received.
Although inducing firms to shift to using part-time workers is an economic distortion from the capped wage subsidy, it is unclear how policymakers would view this distortion. Distributing the employment benefits over a larger number of workers may be in line with policy goals, even if it means fewer hours per employed worker. Encouraging firms to hire lower-skill workers, who often have more limited job prospects than higher-skill workers may have, may also be consistent with policymakers’ goals.
If policymakers want to avoid inducing firms to shift to part-time workers, they could cap a wage credit by hourly wage instead of by total earnings. If structured this way, the credit would be the same for each marginal hour of employment, eliminating the incentive to use part-time workers. The incentive to use lower-wage workers would remain, however, because wages beyond the hourly wage cap would not increase the amount of wage subsidy received. To give a specific example, suppose that a 20% wage credit is applied to the first $10 of each eligible worker’s hourly wage. Then the credit would be 20% for all wages up to $10 per hour and less than 20% for all wages beyond $10 per hour. In this way, the credit could be targeted to lower-wage workers without inducing part-time employment.
Supplemental Material
sj-pdf-1-ilr-10.1177_00197939221102865 – Supplemental material for Employer Wage Subsidy Caps and Part-Time Work
Supplemental material, sj-pdf-1-ilr-10.1177_00197939221102865 for Employer Wage Subsidy Caps and Part-Time Work by Joel A. Elvery, C. Lockwood Reynolds and Shawn M. Rohlin in ILR Review
Footnotes
The views stated herein are those of the authors and are not necessarily those of the Federal Reserve Bank of Cleveland or the Board of Governors of the Federal Reserve System.
For information regarding the data and/or computer programs used for this study, please address correspondence to
1
2
3
The other incentives associated with EZ designation in urban areas were a one-time $100 million Social Service Block Grant (SSBG) and a set of relatively small capital incentives. Neither of these portions of the program should induce the labor demand changes that we document in this article. The SSBGs were spent in different ways in each city on a variety of projects such as transportation and consulting. The capital incentives included the ability to exclude capital gains on the sale of certain assets and increasing the amount of property that can be immediately expensed. For a complete description of the EZ incentives, see ![]() .
.
4
Two features of the EZ program we study help justify this assumption: Firms could claim the credit for multiple years and only for workers employed at least 90 days.
5
6
We stop our analysis in 2000 because in Round III of the program many of the benefits that the EZ areas received were extended to many of the Enterprise Community (EC) areas.
7
Studying French enterprise zones, Briant, Lafourcade, and Schmutz (2015) found that employment effects also depend on how spatially integrated the zone area is with the surrounding city.
8
Of the 78 Round I urban EZ applications, six were designated EZs and 65 were designated ECs. The HUD data we use to define EZ and EC tracts are missing information for three of the first-round ECs (New Orleans, Tacoma, and Ouachita Parish).
9
Following much of the existing literature on the EZ program, we remove Cleveland, Los Angeles, and Washington DC from the set of Round I EC areas, leaving 59 EC areas in our sample. Cleveland and Los Angeles received enhanced EC status and were made EZs early in the 2000s and Washington DC, while an EC, was granted the EZ wage subsidy. However, all results are robust to inclusion of these cities in our set of counterfactuals.
10
Complete estimates for all results in Table 2, with and without covariates, are presented in Tables A.2 to ![]() .
.
11
This pattern could be caused by higher-wage areas expanding more in part-time work because they face higher labor costs in general or because of the industrial mix in these areas. Estimates show that these tracts have a higher proportion of service and retail jobs, which are two sectors more likely to employ part-time workers (part-time workers are approximately 42% for retail workers, 31% for service workers, and 14% for all other workers, based on authors’ calculations from the 1990 and 2000 Census).
12
In theory, we could also test for an increase in workers making earnings below $15,000. However, as previously discussed, we cannot identify earnings at a particular job and workers can respond by taking on multiple jobs. The results of this test, presented in ![]() , show some evidence of an increase in workers earning less than $15,000 but the results are somewhat sensitive to estimation strategy.
, show some evidence of an increase in workers earning less than $15,000 but the results are somewhat sensitive to estimation strategy.
References
Supplementary Material
Please find the following supplemental material available below.
For Open Access articles published under a Creative Commons License, all supplemental material carries the same license as the article it is associated with.
For non-Open Access articles published, all supplemental material carries a non-exclusive license, and permission requests for re-use of supplemental material or any part of supplemental material shall be sent directly to the copyright owner as specified in the copyright notice associated with the article.