
Abstract
In response to the pandemic recession, the 2020 CARES Act expanded eligibility and payments for Unemployment Insurance (UI). UI and the CARES Act may be more salient for people with disabilities than for those without disabilities, given their higher rates of job loss, lower personal and family incomes, and greater obstacles in finding jobs. Using March 2009–2023 CPS data, the authors find that relative to people without disabilities: 1) people with disabilities had higher UI receipt and UI values as a percentage of personal and family incomes; 2) the CARES UI supplement had especially favorable effects on incomes and poverty status for workers with disabilities in 2020; and 3) workers with disabilities who received UI were more likely to be employed the following March, an effect that may have been magnified by the CARES UI supplement. The results suggest that UI may play a salutary role in maintaining the health and job readiness of workers with disabilities.
The low employment and income levels of people with disabilities are a well-recognized and pressing policy concern. The employment rate of working-age people with disabilities is only half that of people without disabilities (37.4% compared to 74.9% in 2024) and their unemployment rate is more than twice as high (8.1% compared to 3.9%) (U.S. BLS 2025), likely due to greater obstacles in job finding (Ameri et al. 2018; Baert 2018; Lippens, Vermeiren, and Baert 2023). Even when employed, people with disabilities earn, on average, significantly less per year than those without disabilities (Kruse, Schur, Rogers, and Ameri 2018). As a result, people with disabilities are more than twice as likely as those without disabilities to live in poverty (Shrider and Creamer 2023).
One part of the social safety net that may be especially important for people with disabilities is Unemployment Insurance (UI). This income support may play a larger role among people with disabilities due to their higher rates of layoff and unemployment (Mitra and Kruse 2016) and their generally lower incomes. UI may decrease unemployment duration by providing workers with disabilities added resources to overcome obstacles and find a job quickly (e.g., by securing accessible transportation needed for a new job, upgrading technology for job search, or interacting with social networks to find a job), or it may extend unemployment duration by affording them extra time to negotiate employment obstacles (e.g., by providing a financial cushion to hold out for jobs that match their accommodation needs). UI may also improve job match quality for people with disabilities by helping them maintain health and labor market readiness (Renahy et al. 2018).
The 2020 Coronavirus Aid, Relief, and Economic Security Act (CARES Act) expanded eligibility and payments for UI in response to the pandemic recession, creating variation in UI receipt that we use to test the relative importance of UI for people with disabilities compared to those without. In analyzing this period, we are mindful of the especially strong increase in disability employment following the pandemic, which was tied to employment growth in “teleworkable” occupations (Ne’eman and Maestas 2023; Bloom, Dahl, and Rooth 2024). While the pandemic was a severe blow to workers both with and without disabilities, the 2020 CARES expansion of UI may have come at an especially opportune time for people with disabilities, providing income support to maintain health and labor market readiness just as the pandemic substantially expanded employment opportunities for home-based work that meet the needs of many people with disabilities (Ameri et al. 2023).
We use data from the 2009–2023 Current Population Survey Annual Social and Economic Supplements to explore two research questions:
What was the impact of the 2020 CARES expansion of UI on the personal and family incomes of workers with disabilities, both absolutely and relative to those without disabilities?
What was the impact of the 2020 CARES expansion of UI on the likelihood of finding a job among people with disabilities, relative to pre-pandemic patterns and to people without disabilities?
Background and Literature Review
The U.S. Unemployment Insurance program was established in the Social Security Act of 1935 and provides income to workers who have lost their jobs and have an earnings record. Payments are tied to prior earnings but are typically capped, so that the UI “replacement rate”—the share of prior earnings represented by UI payments—is generally higher for lower-earning workers. Payments are typically limited to 26 weeks, although this is often extended in recessions. In addition to providing economic relief at the individual and family level, the program is also seen as an automatic stabilizer that helps maintain consumer purchasing power to reduce the severity and duration of recessions. The 2020 CARES Act, an economic stimulus bill passed in response to the pandemic recession, temporarily expanded both the generosity and duration of UI benefits: Beginning on March 27, 2020, CARES allowed UI claimants to receive an additional $600 per week through July 31, 2020, and extended their benefits by 13 weeks (from the standard 26 weeks) through December 31, 2020. The expanded benefits were subsequently extended at reduced levels through September 6, 2021, although many states terminated participation early.
A rich literature on UI clearly indicates that UI generosity, including both the amount and duration of benefits, decreases the intensity of job search and extends unemployment spells (Katz and Meyer 1990; Krueger and Mueller 2010; Rothstein 2011; Valletta 2014; Card et al. 2015; Farber and Valletta 2015; Hagedorn, Manovskii, and Mitman 2015; Schmieder and Von Wachter 2016; Johnston and Mas 2018; Rotar and Krsnik 2020; Lechthaler and Ring 2021; Mousavi 2023). Ending the extra UI benefits during the pandemic increased the flow into employment and decreased the unemployment rate (Holzer, Hubbard, and Strain 2024).
The extended unemployment duration due to UI may help to improve job match quality by allowing workers to search longer, improve their health, and obtain a better job (Nekoei and Weber 2017). UI generosity is especially linked to higher match quality for those who are liquidity-constrained, including women, minorities, and those with less education (Farooq, Kugler, and Muratori 2020), and high match quality could be manifested in higher wages or increased likelihood of remaining employed. Effects of UI on worker health occur through decreased food insecurity (Raifman, Bor, and Venkataramani 2020; Fu, Huang, and Liu 2023; Dhakal, Luo, Wang, and Zhen 2024) and maintenance of health insurance coverage, allowing workers to take preventive measures and meet their medical care needs (Renahy et al. 2018; Ahammer and Packham 2020; Karpman and Acs 2020; Kuka 2020; Carey et al. 2021).
UI benefits also help to reduce poverty, as found by studies both before the pandemic (Gabe and Whittaker 2012; O’Campo et al. 2015; Rothstein and Valletta 2017; Renahy et al. 2018) and during the pandemic (Han, Meyer, and Sullivan 2020; Martin, Markhvida, Hallegatte, and Walsh 2020). Related to poverty, UI has been found to reduce home foreclosures (Hsu, Matsa, and Melzer 2018), difficulty in paying utility bills (Karpman and Acs 2020), housing insecurity (Carey et al. 2021), and financial fragility (Schneider, Tufano, and Lusardi 2020). The UI expansion in the pandemic reversed the increase in inequality that would otherwise have occurred during 2020 and 2021, with only limited disincentive effects on job search (Valletta and Yilma 2024).
The above results have several implications for people with disabilities. First, people with disabilities may be more likely than others in the workforce to use UI because of their higher layoff rates (Mitra and Kruse 2016) and greater job search difficulties (Ameri et al. 2018; Baert 2018; Lippens et al. 2023). Second, UI likely makes up a higher portion of personal and family incomes, and is more likely to reduce the poverty rate, for people with disabilities than for those without due to their higher use of UI, lower average incomes, and the dollar cap on UI payments that creates a higher average replacement rate (UI/prior earnings) for low-earning workers. Third, UI may have especially salutary effects on the health of people with disabilities, given their greater likelihood of facing health problems and higher number of doctor and hospital visits (Kruse 1998). These positive health effects could lead to more favorable impacts of UI on job finding and job match quality for people with disabilities than for those without. Fourth, regarding job search difficulties, UI could either lengthen unemployment spells for workers with disabilities by giving them additional time to navigate employment barriers and secure a suitable job or shorten unemployment durations by providing resources to overcome these obstacles quickly. UI may also affect unemployment durations through the decision to apply for Social Security Disability Insurance (SSDI) benefits. Although some evidence suggests that higher UI benefits reduce SSDI applications (Lindner 2016), other evidence indicates that the expiration of UI benefits is unrelated to SSDI (Mueller, Rothstein, and Von Wachter 2016).
While there has been useful research on the relationship between UI and disability income, there has been none on the relative effectiveness of UI for the income security, job search, and job match quality of workers with and without disabilities. We explore these relationships, with the expectation based on the above points that UI will 1) play an especially large role in the personal and family incomes of workers with disabilities, 2) lead to longer unemployment duration for workers with disabilities by permitting longer searches in the face of difficulties attracting employer interest, and 3) improve the ultimate job match quality for workers with disabilities so they are more likely to be employed in the year following UI receipt.
Data
Our analysis is based on the March Annual Social and Economic (ASEC) Supplement of the Current Population Survey (CPS) for the survey years 2009–2023, starting when the March CPS first asked the full 6-question set of disability questions in 2009. 1 Since the survey questions in March refer to the calendar year leading up to it, we refer to our time period as being calendar years 2008–2022. We restrict almost all analyses to working-age people (age 18–64) with any labor force participation in the past year (i.e., any weeks spent employed or unemployed). Our sample sizes for those with any labor force participation range from 66,384 to 101,157 across these years. In most analyses we further restrict to only those who report any weeks of unemployment in the past calendar year, to ensure we are analyzing the effects of UI only among those who experienced unemployment. We use CPS supplied weights in all analyses.
Our key variables of interest for the first research question on the relationship between UI and worker incomes are
1. total UI income in the past calendar year, as a percentage of both personal and family income; and
2. disability status, both overall using the 6-question set and broken down by type of disability.
Our key variables of interest for the second research question, regarding the effects of UI on job finding, are
3. weeks spent unemployed in the previous calendar year;
4. any receipt of UI in the previous calendar year across survey years 2009–2023;
5. the UI replacement rate in 2019–2020, calculated based on prior year earnings applied to state UI rules using the formula in Ganong, Noel, and Vavra (2020);
6. employment as of the March ASEC survey date; and
7. disability status using the 6-question set, including disability reported a) as of the March ASEC survey date, b) both in the current year’s and previous year’s March ASEC, and c) in the previous year’s March ASEC.
We present descriptive statistics in Table A1 (Tables A1–A28, designated by an “A,” may be found in the Online Appendix).
UI recipiency and total benefits appear to have been substantially understated by CPS respondents in 2020, based on comparisons of CPS and IRS data (Larrimore, Mortenson, and Splinter 2023). Table A2 provides a comparison of the CPS figures to the adjusted figures for the 2019–2021 period, based on imputations provided by Larrimore et al. (we do not have data to make equivalent imputations by disability status before 2019). The ratio of adjusted to reported recipiency was similar in 2019 for people with and without disabilities (1.11 and 1.12, respectively), but jumped up somewhat more for people with disabilities in 2020 (to 1.35 and 1.20, respectively). 2 Among those who receive UI, the ratio of adjusted to reported benefits changed by an identical 0.14 percentage points between 2019 and 2020 for people without disabilities (0.97 to 1.11) and people with disabilities (1.02 to 1.16). We account for any potential influence of UI underreporting on our results by making comparisons of reported and adjusted estimates throughout the analysis.
An additional concern in our data is that there may have been significant compositional changes among those who received UI; for example, the much larger pool of UI recipients in 2020 may have contained a larger proportion who were easily able to regain employment. Since we are comparing people with and without disabilities, this presents a problem for our analysis only if the compositional changes differed between these two groups. We explore any differential changes in the composition of UI and non-UI recipients using regressions predicting UI recipiency just among the unemployed, separately examining the large inflow into UI from 2019 to 2020, and the smaller outflow from 2020 to 2021. Our predictors include disability types and demographic characteristics (sex, age, race/ethnicity, education, and marital status) fully interacted with year and disability status. As reported in Table A3, there are no strongly significant interactions indicating differential changes in characteristics between people with and without disabilities between 2019 and 2020 (only one weakly significant interaction with difficulty dressing or bathing), and only a few significant interactions indicating differential changes between 2020 and 2021 (one with difficulty dressing or bathing, one weakly significant interaction with age, and three weakly significant interactions with marital status). Notably, education is commonly associated with employability, and we see no significant differences by disability status in the change in the educational distribution. Although we remain mindful of unobservable compositional changes, these figures do not point to bias in our estimates from differential compositional changes.
Empirical Strategy
We use a double interaction specification for our first research question to study the effects of UI on the incomes of people with and without disabilities before and after the pandemic. We estimate the following regression:
for individual i in state s and year t. The outcome variable (
For our second research question regarding job finding, we build on this equation and add a third interaction term, receipt of UI, to examine whether UI has differential effects on job finding depending on whether someone has a disability, and whether the UI was received during 2020 when the CARES Act was enacted. We estimate the following regressions:
Equation (2) is a Cox model predicting the hazard of ending an unemployment spell in a given week, while Equation (3) is an ordinary least squares (OLS) regression estimating the effects on employment status in March of the following year. Calendar year t refers to the year leading up to the survey in March of year t+1. In this analysis, in addition to
We first use the full 2008–2022 data set to analyze the effects of the CARES Act by focusing on the year 2020 dummy, its interaction with disability, and its interaction with disability and the receipt of UI (supplemented by the CARES act). We focus on 2020 because the expansion of UI was concentrated in this year, although scaled-back benefits were extended into 2021. We also tested specifications with a 2021 dummy and its interactions with UI and disability status (results available on request).
Next, we run similar specifications limited to 2019–2020 in which we replace the
To test the effects of UI on the number of weeks of unemployment in the prior year we use a Cox survival model with censoring at 52 weeks. An issue with our survival model analysis is that the CPS measure of total weeks unemployed in the previous year may include more than one spell, but any bias this may cause should affect people with and without disabilities in a similar way. Although analyses of UI generally analyze the length of single spells, our results should be interpreted as indicating the effects of UI on the accumulated duration of unemployment during a year, with natural censoring at 52 weeks.
Results
Basic Disability and Unemployment Numbers
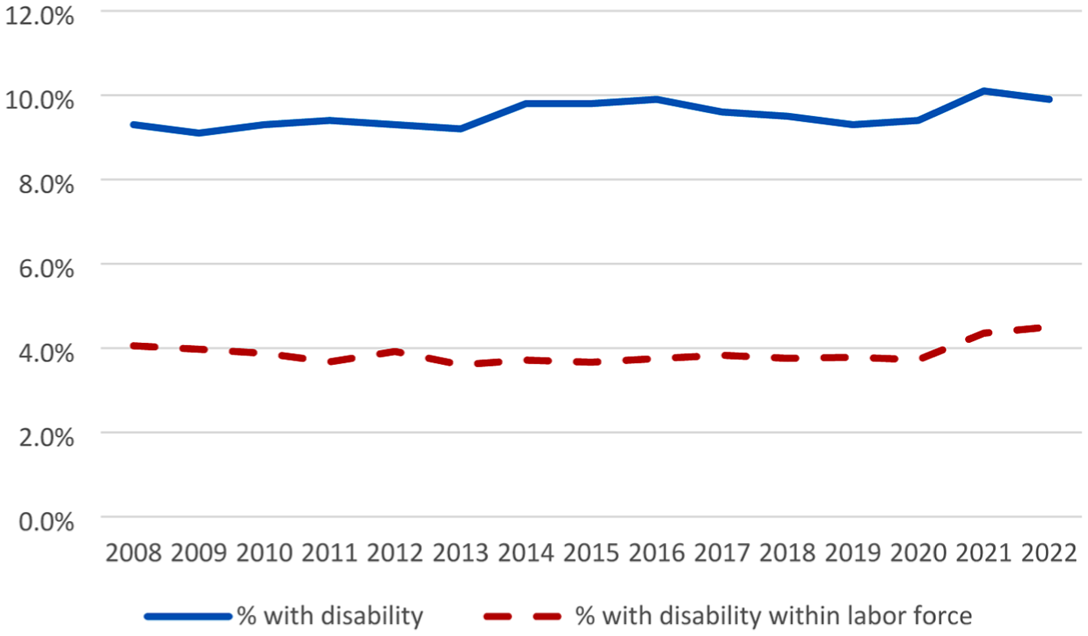
As a context for our analysis, we first present data on disability and unemployment trends over the 2008–2022 period. All figures are based on data presented in tables in the Online Appendix. Figure 1 (drawn from Table A4) shows that 9–10% of working-age people reported disabilities over the 2008–2022 period, with a slight uptick in 2021 and 2022 that may reflect the effects of long COVID following the pandemic (Ne’eman and Maestas 2023; Cohen and Rodgers 2024). Looking within the labor force only, the percentage of people who have disabilities is fairly stable around 4%, again with a slight uptick in 2021 and 2022. As shown in Table A4, the total number of working-age people with disabilities ranged between 5.4 and 7.0 million over this period.
Disability Prevalence among Working-age People and Labor Force
Table A4 also provides data on labor force participation during this period, showing an increase over 2014–2019 of 4.3 percentage points among people with disabilities (36.2% to 40.7%), followed by a 1.4 percentage point drop to 39.3% in 2020 but a strong increase to 44.3% in 2022. The 2014–2019 increase was more modest among people without disabilities (1.8 percentage points, from 80.4% to 82.2%), followed by a 0.8 percentage point drop in 2020 (81.4%), with no increase through 2022 (81.3%). These decreases should be viewed in the context of the lower labor force participation (LFP) rate of people with disabilities: On a percentage basis, the 1.4 point drop in 2019–2020 represents a 3.4% decline in the LFP rate for people with disabilities, compared to a 1.0% decline for people without disabilities.
Table A5 provides results by disability type. One noteworthy result is that people with mobility impairments had the highest LFP rates at the beginning of the period in 2008, while those with cognitive impairments had the highest rate at the end in 2022. The strong increase in cognitive impairments in 2021 and 2022 likely reflects the increase in the prevalence of long COVID (Cohen and Rodgers 2024).
People with disabilities tend to have higher unemployment rates than people without disabilities, as noted earlier. Figure 2 (drawn from Table A6) shows a higher likelihood of experiencing unemployment during a year among people with disabilities over the entire period, dropping from approximately 25% in 2010–2012 to 15% in 2019 before jumping back up in the pandemic in 2020. The improvement after 2012 is consistent with findings from Bengali, Daly, Lofton, and Valletta (2021) that the expansion following the 2008–2010 recession especially bolstered the labor market engagement and well-being of people with disabilities. Tables A7 and A8 provide breakdowns on unemployment and average weeks unemployed by disability type.
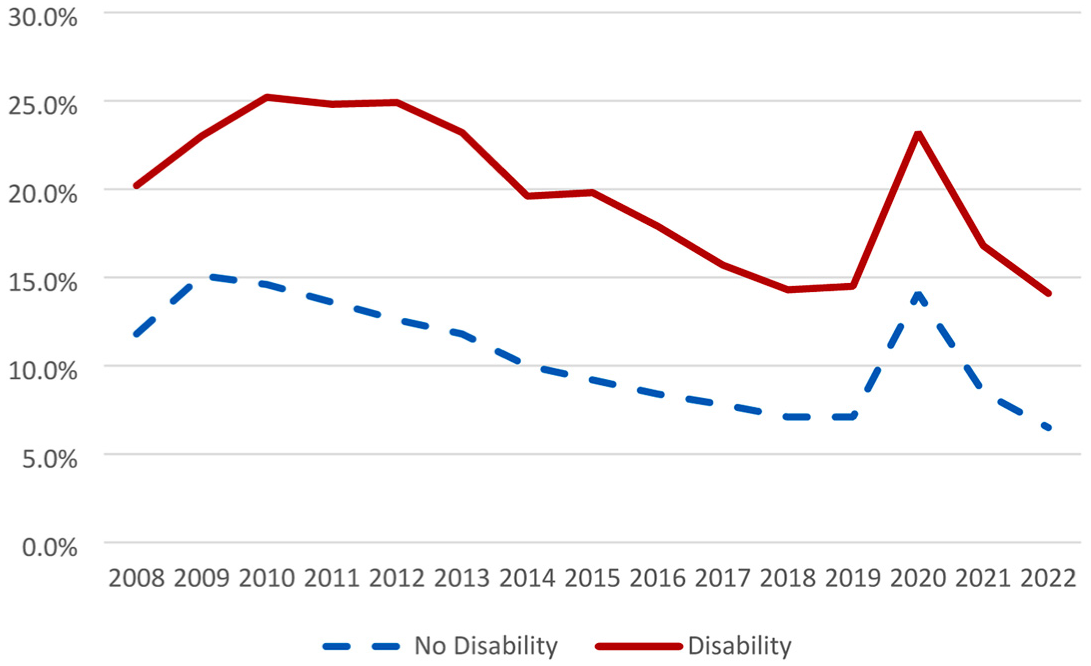
Percentage of Labor Force with Any Unemployment
UI Incidence and Value for People with Disabilities
Turning to our key interest in UI, Figure 3 (drawn from Table A9) shows that among those in the labor force, the percentage of people with disabilities receiving any UI declined from approximately 11% in 2009 to less than 3% in 2019. This figure jumped to 17.6% in 2020 when considering the CPS reports only, and to 30.8% when using the underreporting adjustment. We observe a similar proportionate jump in 2020 among people without disabilities, to 13.3% using the CPS reports and 23.1% using the underreporting adjustment. Figure 4 shows a very similar pattern when confined to people who reported unemployment. Tables A10 and A11 show that when broken down by disability type, UI receipt does not differ substantially by disability status, either among the entire labor force or among only those who report unemployment.
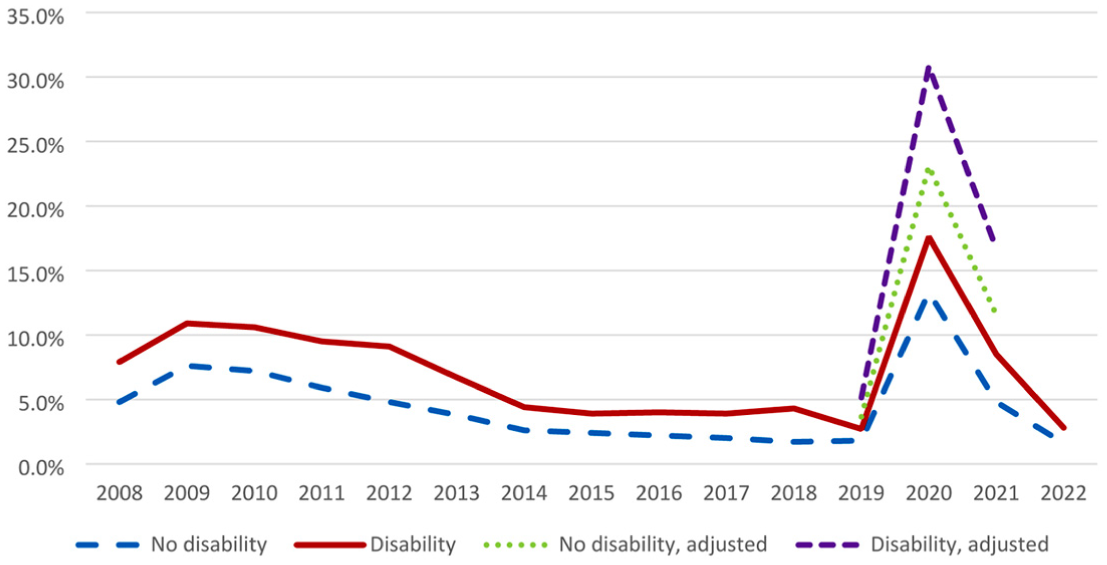
Percentage Receiving UI among Labor Force
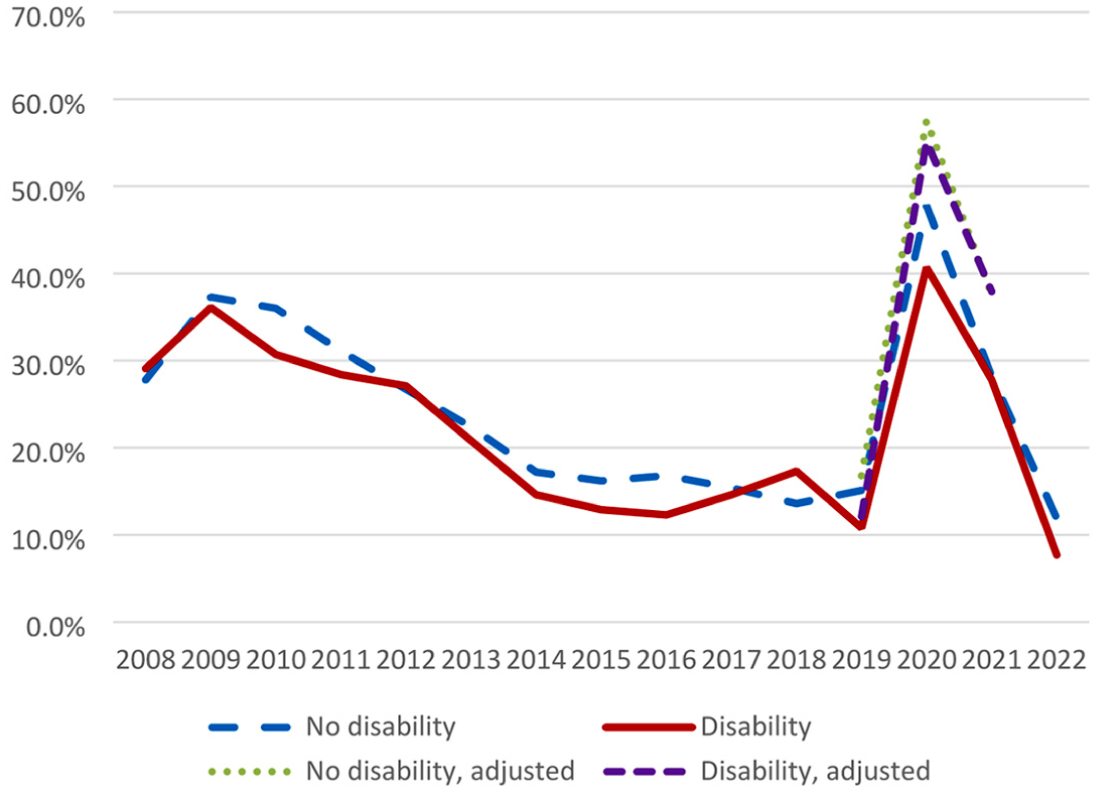
Percentage Receiving UI among Unemployed
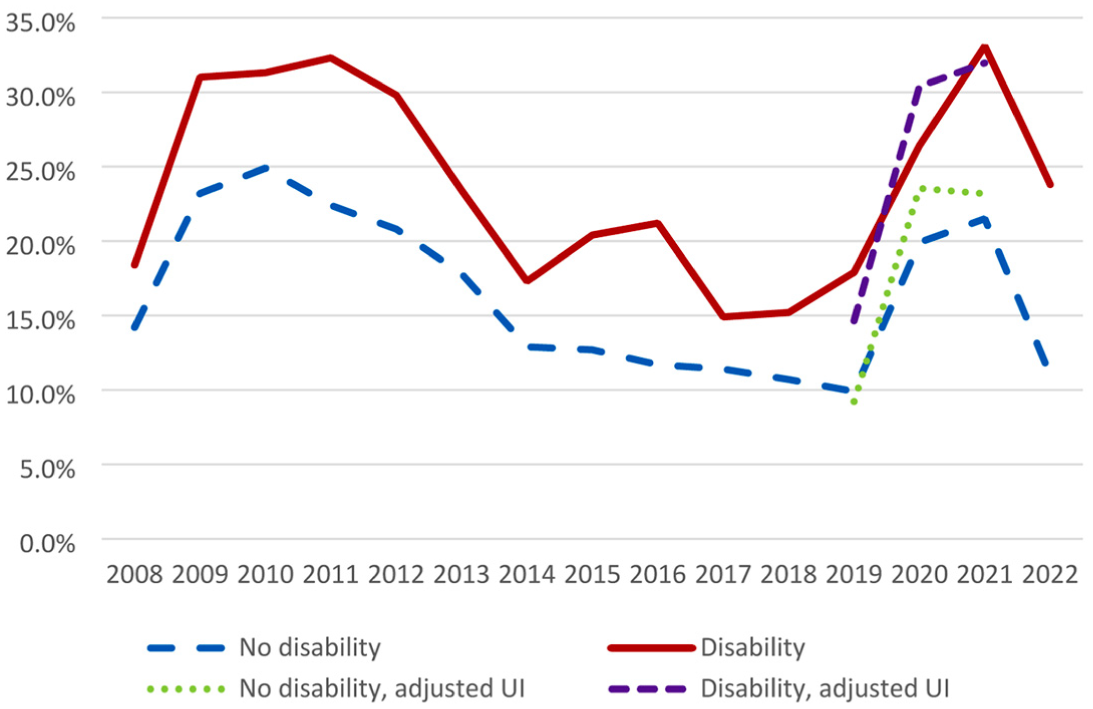
We also explore the importance of UI in the incomes of people with disabilities. Figures 5 and 6 (drawn from Table A12) show that UI is a larger share of personal and family income (respectively) for people with disabilities than for those without disabilities. Over the 2008–2022 period, UI as a percentage of personal income ranged from 20.3% to 46.8% among workers with disabilities, and as a percentage of family income from 14.9% to 33.1%. The yearly figures for people with disabilities are all higher than among workers without disabilities. The increases from 2019 to 2020, however, are similar between people with disabilities (25.6% to 39.5% for personal income, or +13.9 percentage points) and those without disabilities (17.3% to 33.1%, or +15.9 percentage points). As shown in Figures 5 and 6, adjusting for UI underreporting in 2019–2021 makes little difference in these figures for either people with or without disabilities. Tables A13 and A14 provide breakdowns of UI as a percentage of personal and family income by disability type.
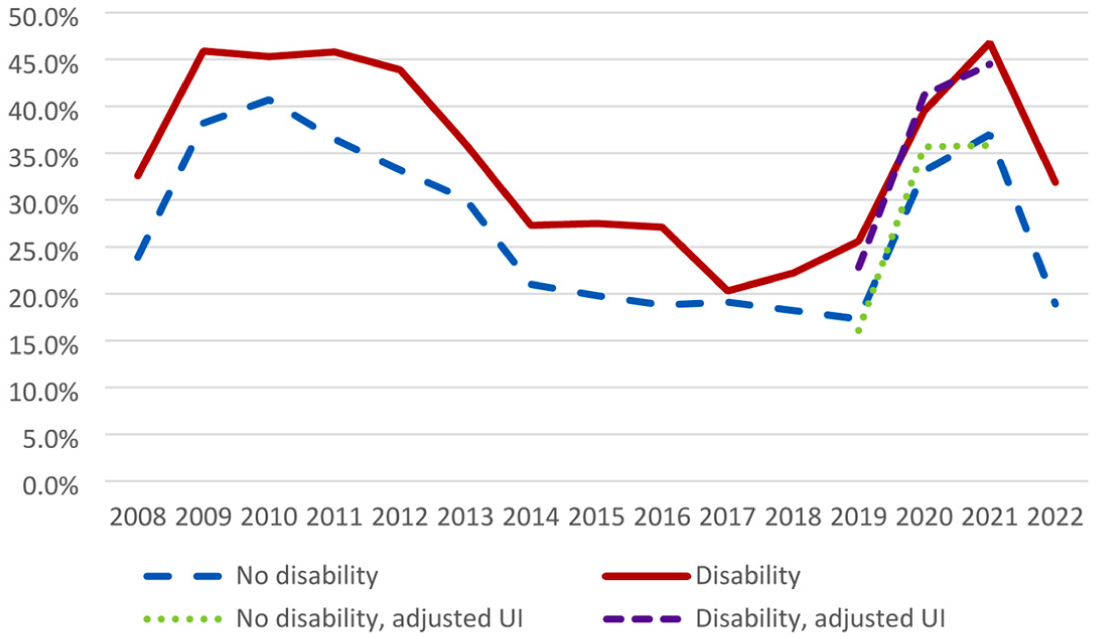
UI as Percentage of Personal Income among Recipients
UI as Percentage of Family Income among Recipients
For a closer examination of the relationship of disability to UI income, in Table 1 we run regressions predicting UI as a percentage of personal or family income, based on Equation (1) above. Table 1 indicates that disability is linked to higher values of UI as a percentage of personal or family income, both among all labor market participants (columns (1) and (2)) and among only those experiencing unemployment (columns (3) and (4)). Perhaps not surprisingly, the extra UI funding in the CARES Act led to generally higher UI as a percentage of personal and family income for both groups. The interaction, however, shows that personal and family income rose more for people with disabilities in 2020 only when considering all labor force participants (columns (1) and (2)), and not when confined just to those experiencing unemployment (columns (3) and (4)). The increases for people with disabilities in 2020 in columns (1) and (2) are larger than the increases in prior years with extended UI benefits available (2009–2013). Table A15 presents consistent results for 2019–2021 when using the underreporting adjustment for those years, showing that the adjustment slightly increases the share of UI income in personal and family incomes in 2020 among labor force participants with disabilities, but not among UI recipients.
Predicting Unemployment Insurance (UI) as a Percentage of Income
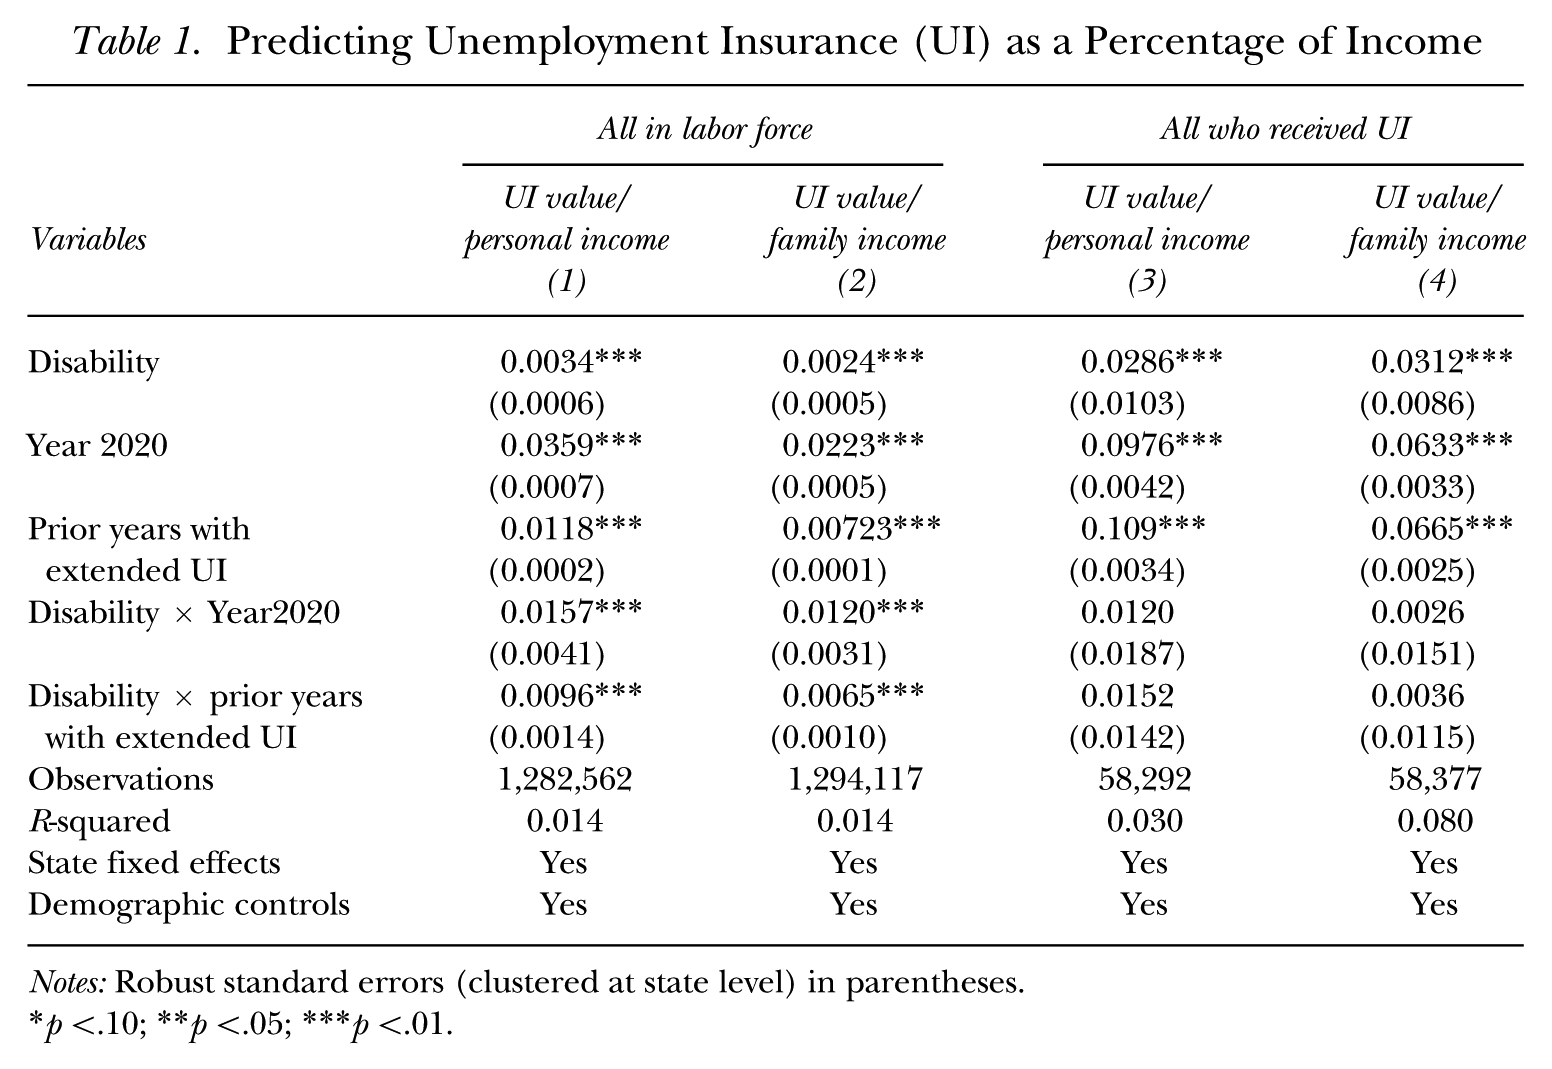
Notes: Robust standard errors (clustered at state level) in parentheses.
p <.10; **p <.05; ***p <.01.
To help interpret these numbers, results from columns (1) and (2) of Table 1 indicate that among the full labor force the baseline predicted UI as a percentage of personal (family) income is 1.1% (0.7%) for people without disabilities and 1.8% (1.2%) for people with disabilities. In 2020 these predicted figures more than tripled for both groups, rising to 4.1% (2.6%) for people without disabilities and 6.0% (4.0%) for people with disabilities.
We explore the relationship between UI and poverty status in Figure 7 (drawn from Table A16), which shows that poverty is consistently higher among UI recipients compared to non-UI recipients, including when using the underreporting adjustment in 2019–2021. For our purposes we are particularly interested in the effects of the 2020 CARES Act. Using either set of figures, the poverty rate dropped sharply among UI recipients with disabilities from 2019 to 2020. Because of this large drop, the 2020 difference in poverty rates between UI recipients with and without disabilities (7.1% and 5.4%, respectively, using adjusted data) is not statistically significant. This decrease is clearly related to CARES Act funding: Figure 7 provides extra lines using the adjusted data for 2019–2021 showing that without the extra CARES Act funding, the poverty rate would have jumped from 7.1% to 15.5% (an 8.4 percentage point increase) for UI recipients with disabilities, compared to a 5.4% to 11.3% jump (a 5.9 percentage point increase) for those without disabilities. Note that this is just a statistical accounting that does not account for possible behavioral effects if CARES had not been in place.
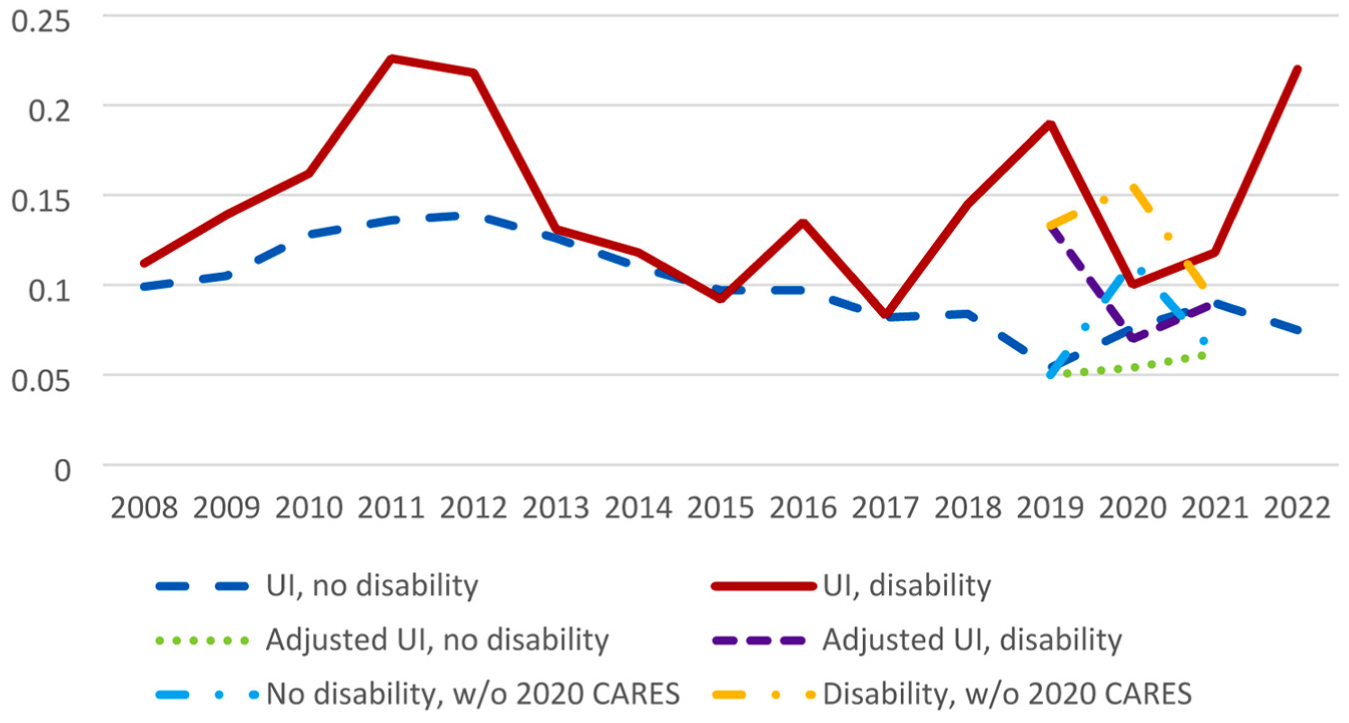
Poverty Status and Disability
Effect of UI on Finding a Job
We have seen so far that UI receipt tends to be more common among labor market participants with disabilities, and UI is generally a larger portion of personal and family incomes for workers with disabilities than for workers without disabilities. Does the larger role of UI in the incomes of people with disabilities make a difference in their job search and finding? We measure job search outcomes in two ways: 1) length of time unemployed during a year (accounting for censoring), and 2) whether one is employed the following March. We illustrate the overall trends in the second outcome in Figure 8, showing the expected drop among those who experienced unemployment in 2019 (reflecting low employment in March 2020 as the pandemic began), with a modest increase among those who experienced unemployment in 2020 and a strong increase in 2021. Tables A17 and A18 provide simple breakdowns of both outcomes across the period.
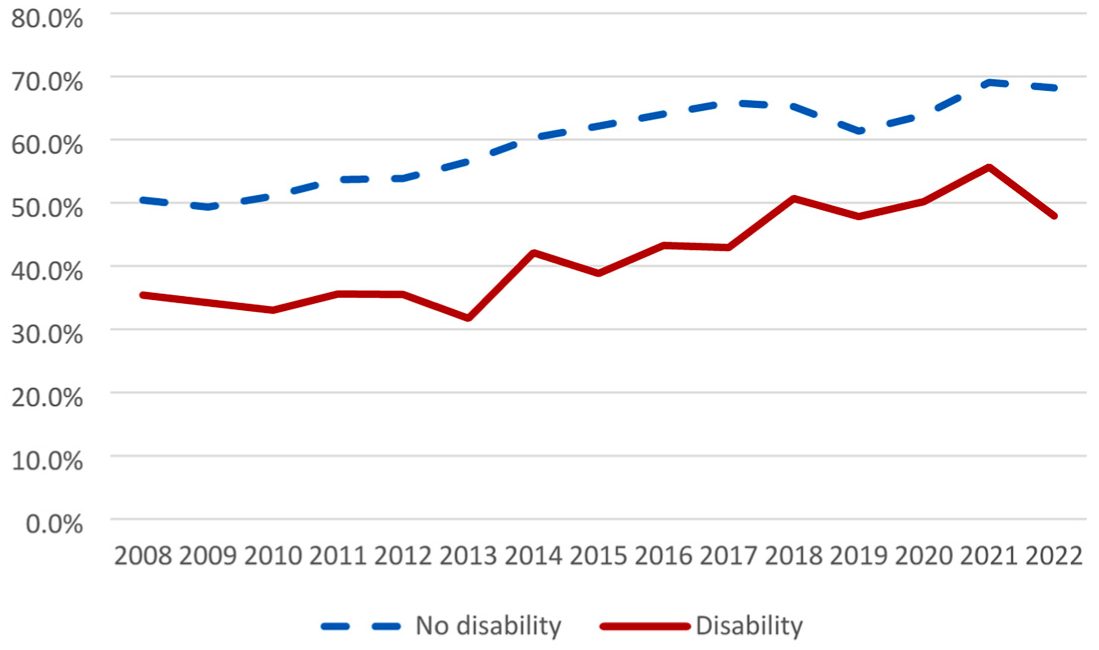
Employed in Following March, by Disability Status
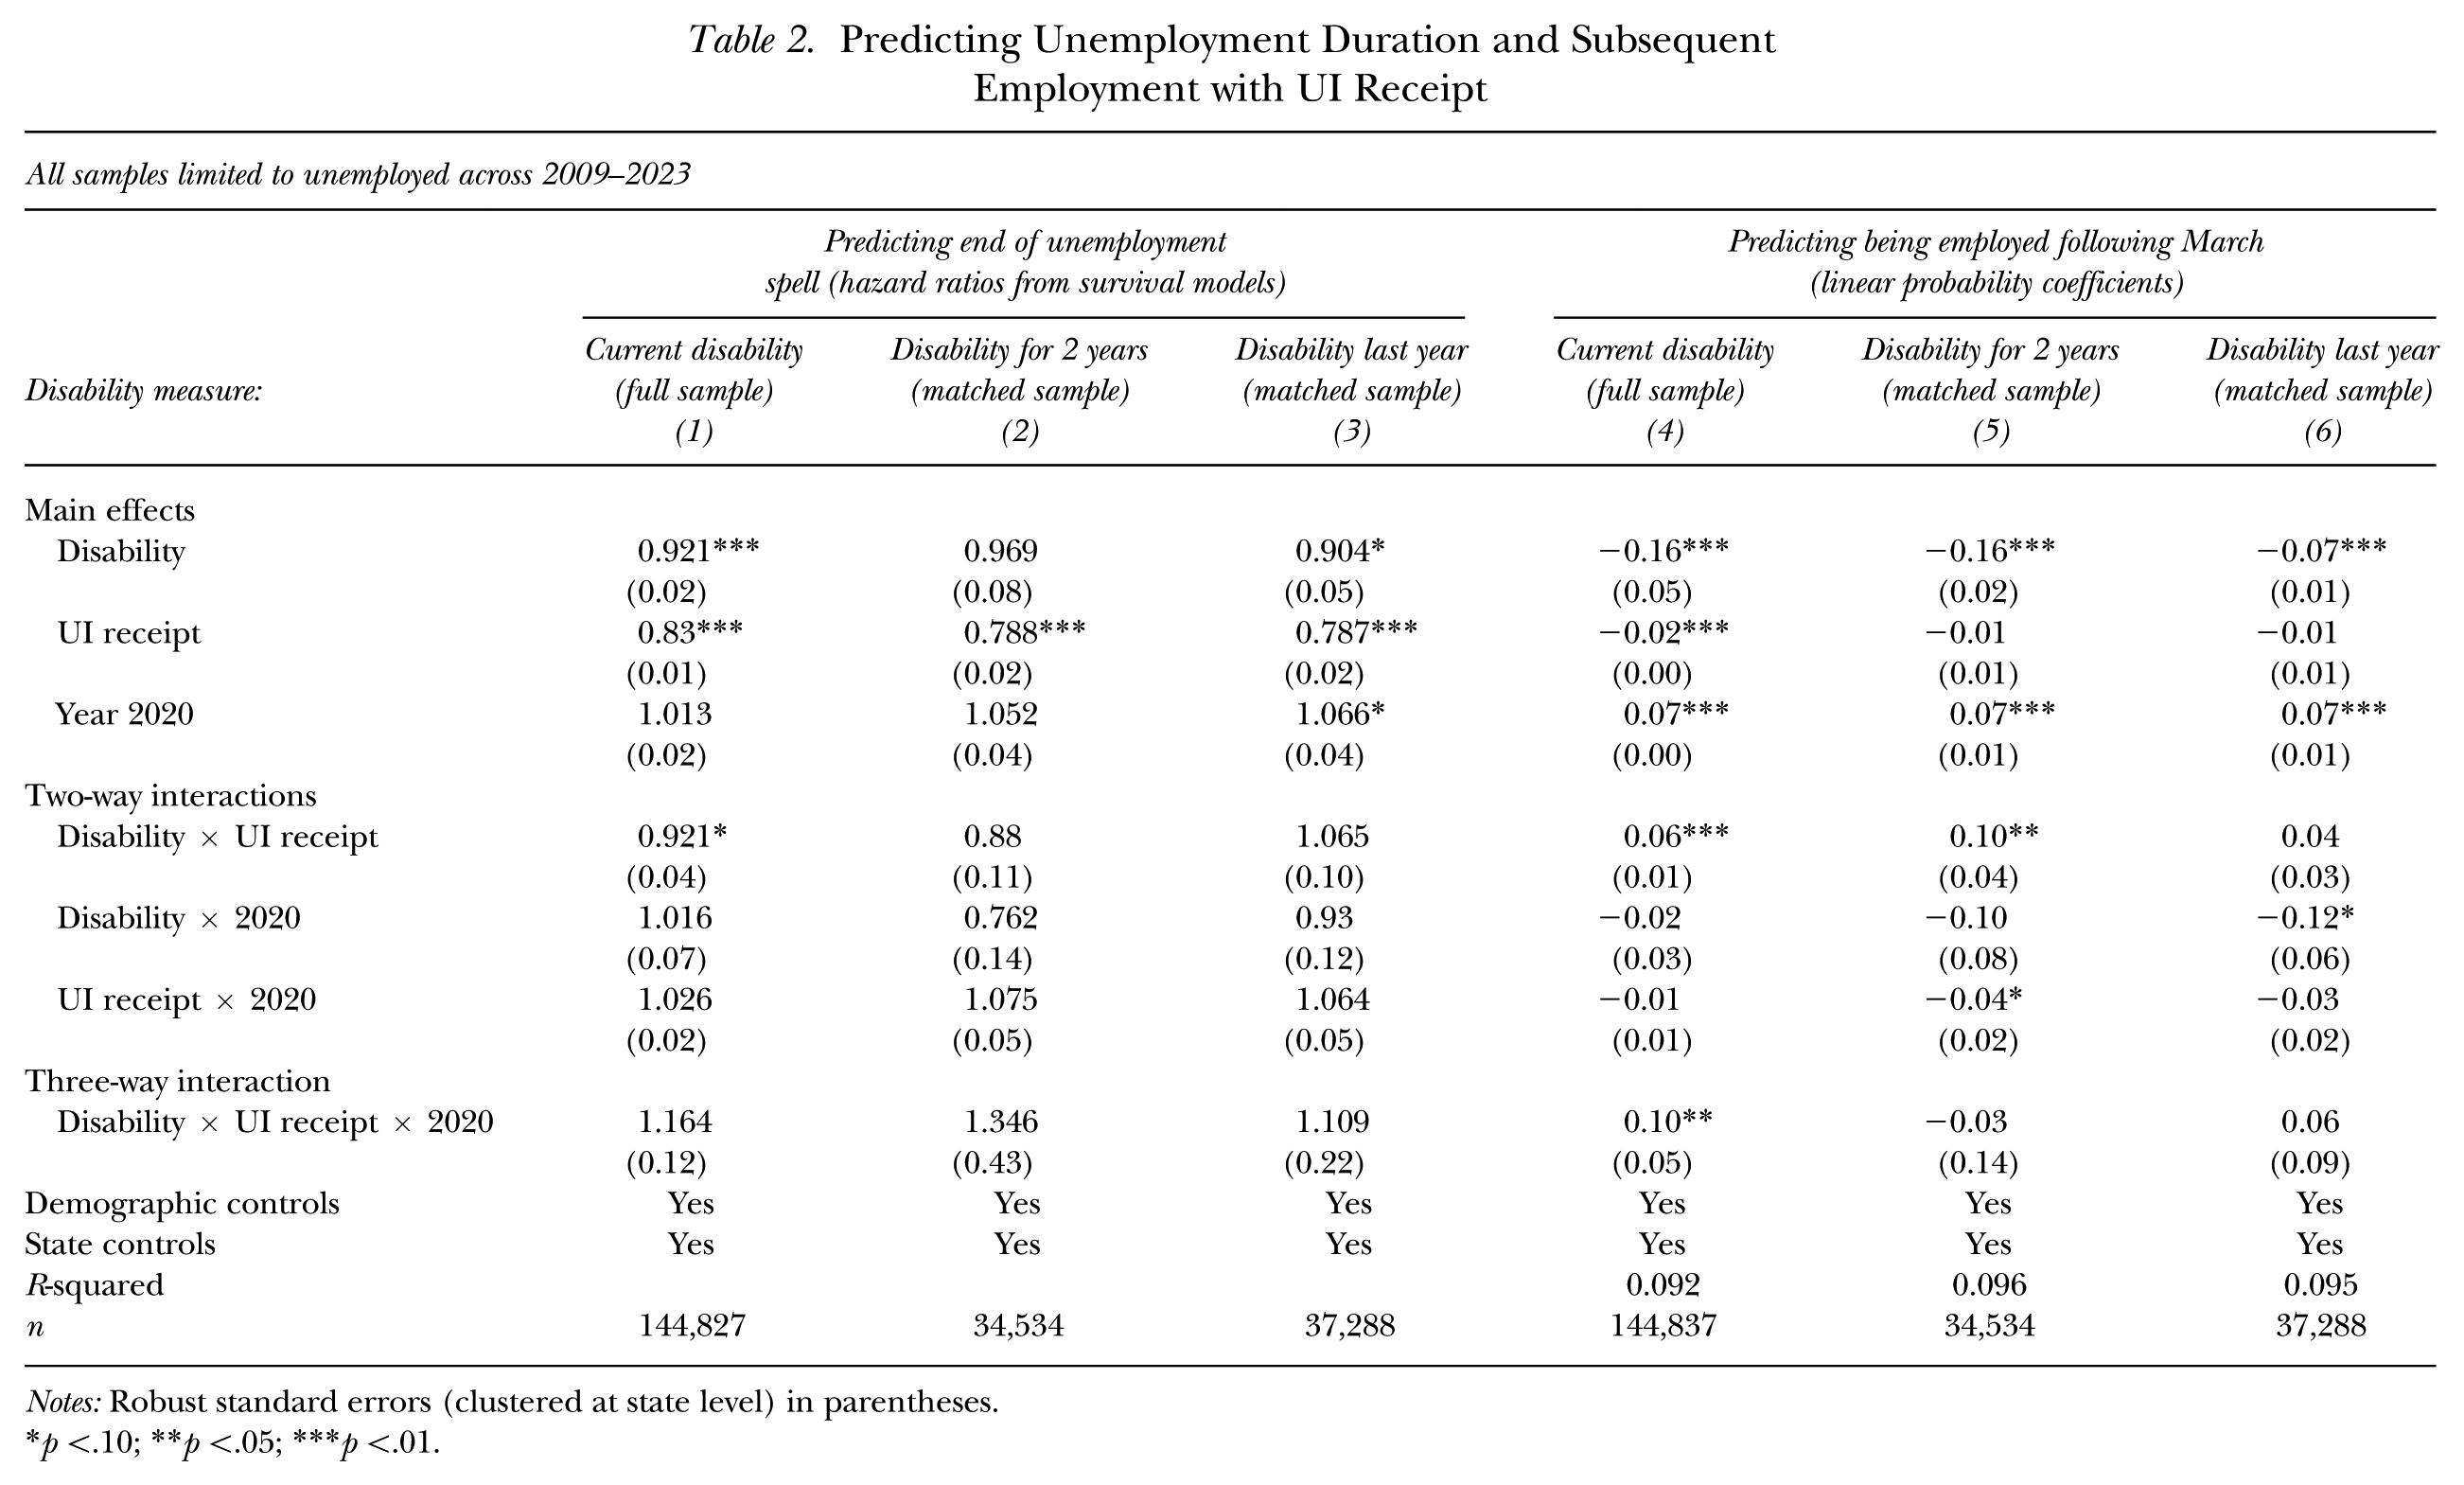
We examine the relationship between UI and job search outcomes in Tables 2 to 4. In each table, columns (1) to (3) present the results of survival models predicting weeks of unemployment in a year, with censoring at 52 weeks. These columns present hazard ratios, with values above 1 indicating that the variable is linked to a higher likelihood of ending unemployment in a given week, reflecting a greater likelihood of either finding a job or otherwise ending the search. For example, a hazard ratio of 1.0 means no change in the likelihood of ending unemployment, and a hazard ratio of 1.1 means a 10% increase in the likelihood and therefore a shorter unemployment duration. Columns (4) to (6) present linear probability coefficients from predictions of being employed the following March, in which coefficients represent the estimated probability effect of a particular variable. In each table, disability is measured as disability status reported in the following March in columns (1) and (4), as disability reported in March in both the current and following year in columns (2) and (5), and as disability reported just in the current year (i.e., the year in which UI is measured) in columns (3) and (6). Columns (2), (3), (5), and (6) use matched March samples to obtain disability status for both the current and following year, which restricts the number of available observations. All estimates are confined to people who experienced unemployment at some point during the year.
Predicting Unemployment Duration and Subsequent Employment with UI Receipt
Notes: Robust standard errors (clustered at state level) in parentheses.
p <.10; **p <.05; ***p <.01.
Predicting Unemployment Duration and Subsequent Employment with UI Replacement Rate
Notes: Robust standard errors (clustered at state level) in parentheses. 2019 replacement rate cannot be calculated for matched sample, so columns (2), (3), (5), and (6) are based on 2020 data.
p < .10; **p < .05; ***p < .01.
Breaking UI Replacement Rate into CARES and Non-CARES Components
Notes: 2019 replacement rate cannot be calculated for matched sample, so columns (2), (3), (5), and (6) are based on 2020 data. Robust standard errors (clustered at state level) in parentheses.
p < .10; **p < .05; ***p < .01.
Table 2 shows that across all columns, disability is linked to a lower likelihood of reducing unemployment duration and of being employed the following March. The main effect on UI receipt indicates that it is linked to a lower likelihood of ending unemployment (i.e., more weeks unemployed) (columns (1) to (3)), which is consistent with substantial prior evidence. UI receipt is linked to a slightly lower likelihood of being employed the following March, but the coefficient is only significant in the full sample (column (4)).
Disability appears to interact significantly with UI receipt in predicting employment the following March, although not in predicting weeks of unemployment. The two-way interaction is positive and significant in both columns (4) and (5) of Table 2, indicating UI receipt is linked to 6–10 percentage point higher probabilities of being employed the following March among workers with disabilities. This finding is consistent with the idea that UI can help workers with disabilities maintain health and job readiness during unemployment, as discussed earlier. The 2020 CARES Act may have enhanced this effect, as the three-way interaction in column (4) shows an additional 10 percentage point higher likelihood of employment among workers with disabilities who received UI in 2020 (i.e., they were 10 percentage points more likely to be employed in March 2021 relative to the typical disability UI effect found across other years). This significant three-way effect exists, however, only when using disability measured in the following March (column (4)), and not when using the other two disability measures (columns (5) and (6)).
To help interpret these numbers, the adjusted employment level for unemployed non-recipients with disabilities in March 2021 is 46.7%, and the 10 percentage point disability-UI recipiency effect in column (4) raises this figure to 56.7%, or roughly a 21% increase in the likelihood of employment. Among people with disabilities across the rest of the period, employment in the following March rises less than 2 percentage points with UI recipiency (from 41.4% to 43.1%), while among people without disabilities future employment is 6 percentage points lower with UI recipiency in 2020 (from 65.8% to 59.7%), and 4 percentage points lower across the rest of the period (from 58.8% to 54.6%). These figures point to a positive role of UI in future employment of people with disabilities, especially in the 2020 pandemic year. To compare the effects of disability and UI in 2020 to the average effects across other years, our reported results include a year interaction with disability and UI just for 2020, although we have also run specifications with a full set of year interactions with similar results.
While the survival models in columns (1) to (3) do not show significant three-way interactions, the coefficients are consistent with relatively favorable effects of UI on weeks unemployed for people with disabilities in 2020. The coefficients imply that UI receipt would raise average weeks unemployed among workers without disabilities by 20.5% in non-2020 years and by 17.4% in 2020 (from an average 20.6 to 24.2 weeks in 2020), whereas among people with disabilities UI receipt would raise average weeks unemployed by 27.5% in non-2020 years but by only 9.5% in 2020 (from an average 22.3 to 24.4 weeks). 3 The smaller effect of UI on weeks unemployed for people with disabilities in 2020 is consistent with the column (4) result of relatively improved job finding for UI recipients with disabilities in 2020.
The CARES Act expansion of UI was extended into 2021, although at a less generous level (Spadafora 2023). We also include a 2021 dummy variable and interact it with UI and disability status and report results in Table A19. Both the UI and disability interactions with 2021 are positive and statistically significant, while the three-way interaction is negative and statistically insignificant. This may suggest that the positive effects of UI on the health and labor market readiness of people with disabilities occurred primarily in the first 10 months after pandemic onset, when workers faced especially large health risks due to COVID and the UI expansions were especially needed by people with disabilities. It may also reflect that employment prospects for people with disabilities greatly improved by March of 2022, fueled by the increased acceptance and use of work-at-home policies, as shown by the research of Ne’eman and Maestas (2023) and by the disability × 2021 coefficient in Table A19, column (4). This finding may result in the ameliorative effects of UI being greatly reduced, since people with disabilities have relatively easy access to jobs regardless of UI. As shown in Table A20, including a linear term, a squared term, or a full set of dummies for the weeks unemployed does not largely affect the main results on the effects on employment next March. The three-way interaction of UI, disability, and the 2020 dummy becomes slightly larger and more significant when using the full set of week dummies (columns (3) and (6)).
To take advantage of data over the full period, Table 2’s results do not use the CPS underreporting adjustment that is confined to 2019–2021 data. Table A21 provides a comparison of results with and without the adjustment, limited to 2019–2021 when the adjustment is available. The pattern of results is very consistent with Table 2, with coefficients on the three-way interaction that remain significant and are slightly larger than in Table 2. We also probe these results in Table A22 by separating out prior years in which extended UI benefits were available (2009–2013) by including base and interaction effects with a dummy variable representing the prior years. We find that the general likelihood of ending unemployment and of being employed the following March were lower in those prior years of extended benefits than in 2020, while the negative effects of UI receipt were similar to those in 2020. We continue to see a positive interaction of disability with UI receipt in 2020, but not in prior extended benefit years, indicating that the extra compensation in the 2020 CARES Act had a different effect on people with disabilities than did prior extensions of UI.
Reverse causation bias might affect our results, as those who find it easier to obtain employment and do not anticipate long job spells may be less likely to apply for UI, biasing the UI coefficient in a negative direction when predicting employment outcomes. To help control for this, we re-ran the regression with our strongest UI results (column (4)) successively eliminating those with short spells (< 2, < 5, < 10, < 15, and < 27 weeks) and found that the positive coefficients on disability-UI interactions with UI remain as strong or stronger than in Table 2.
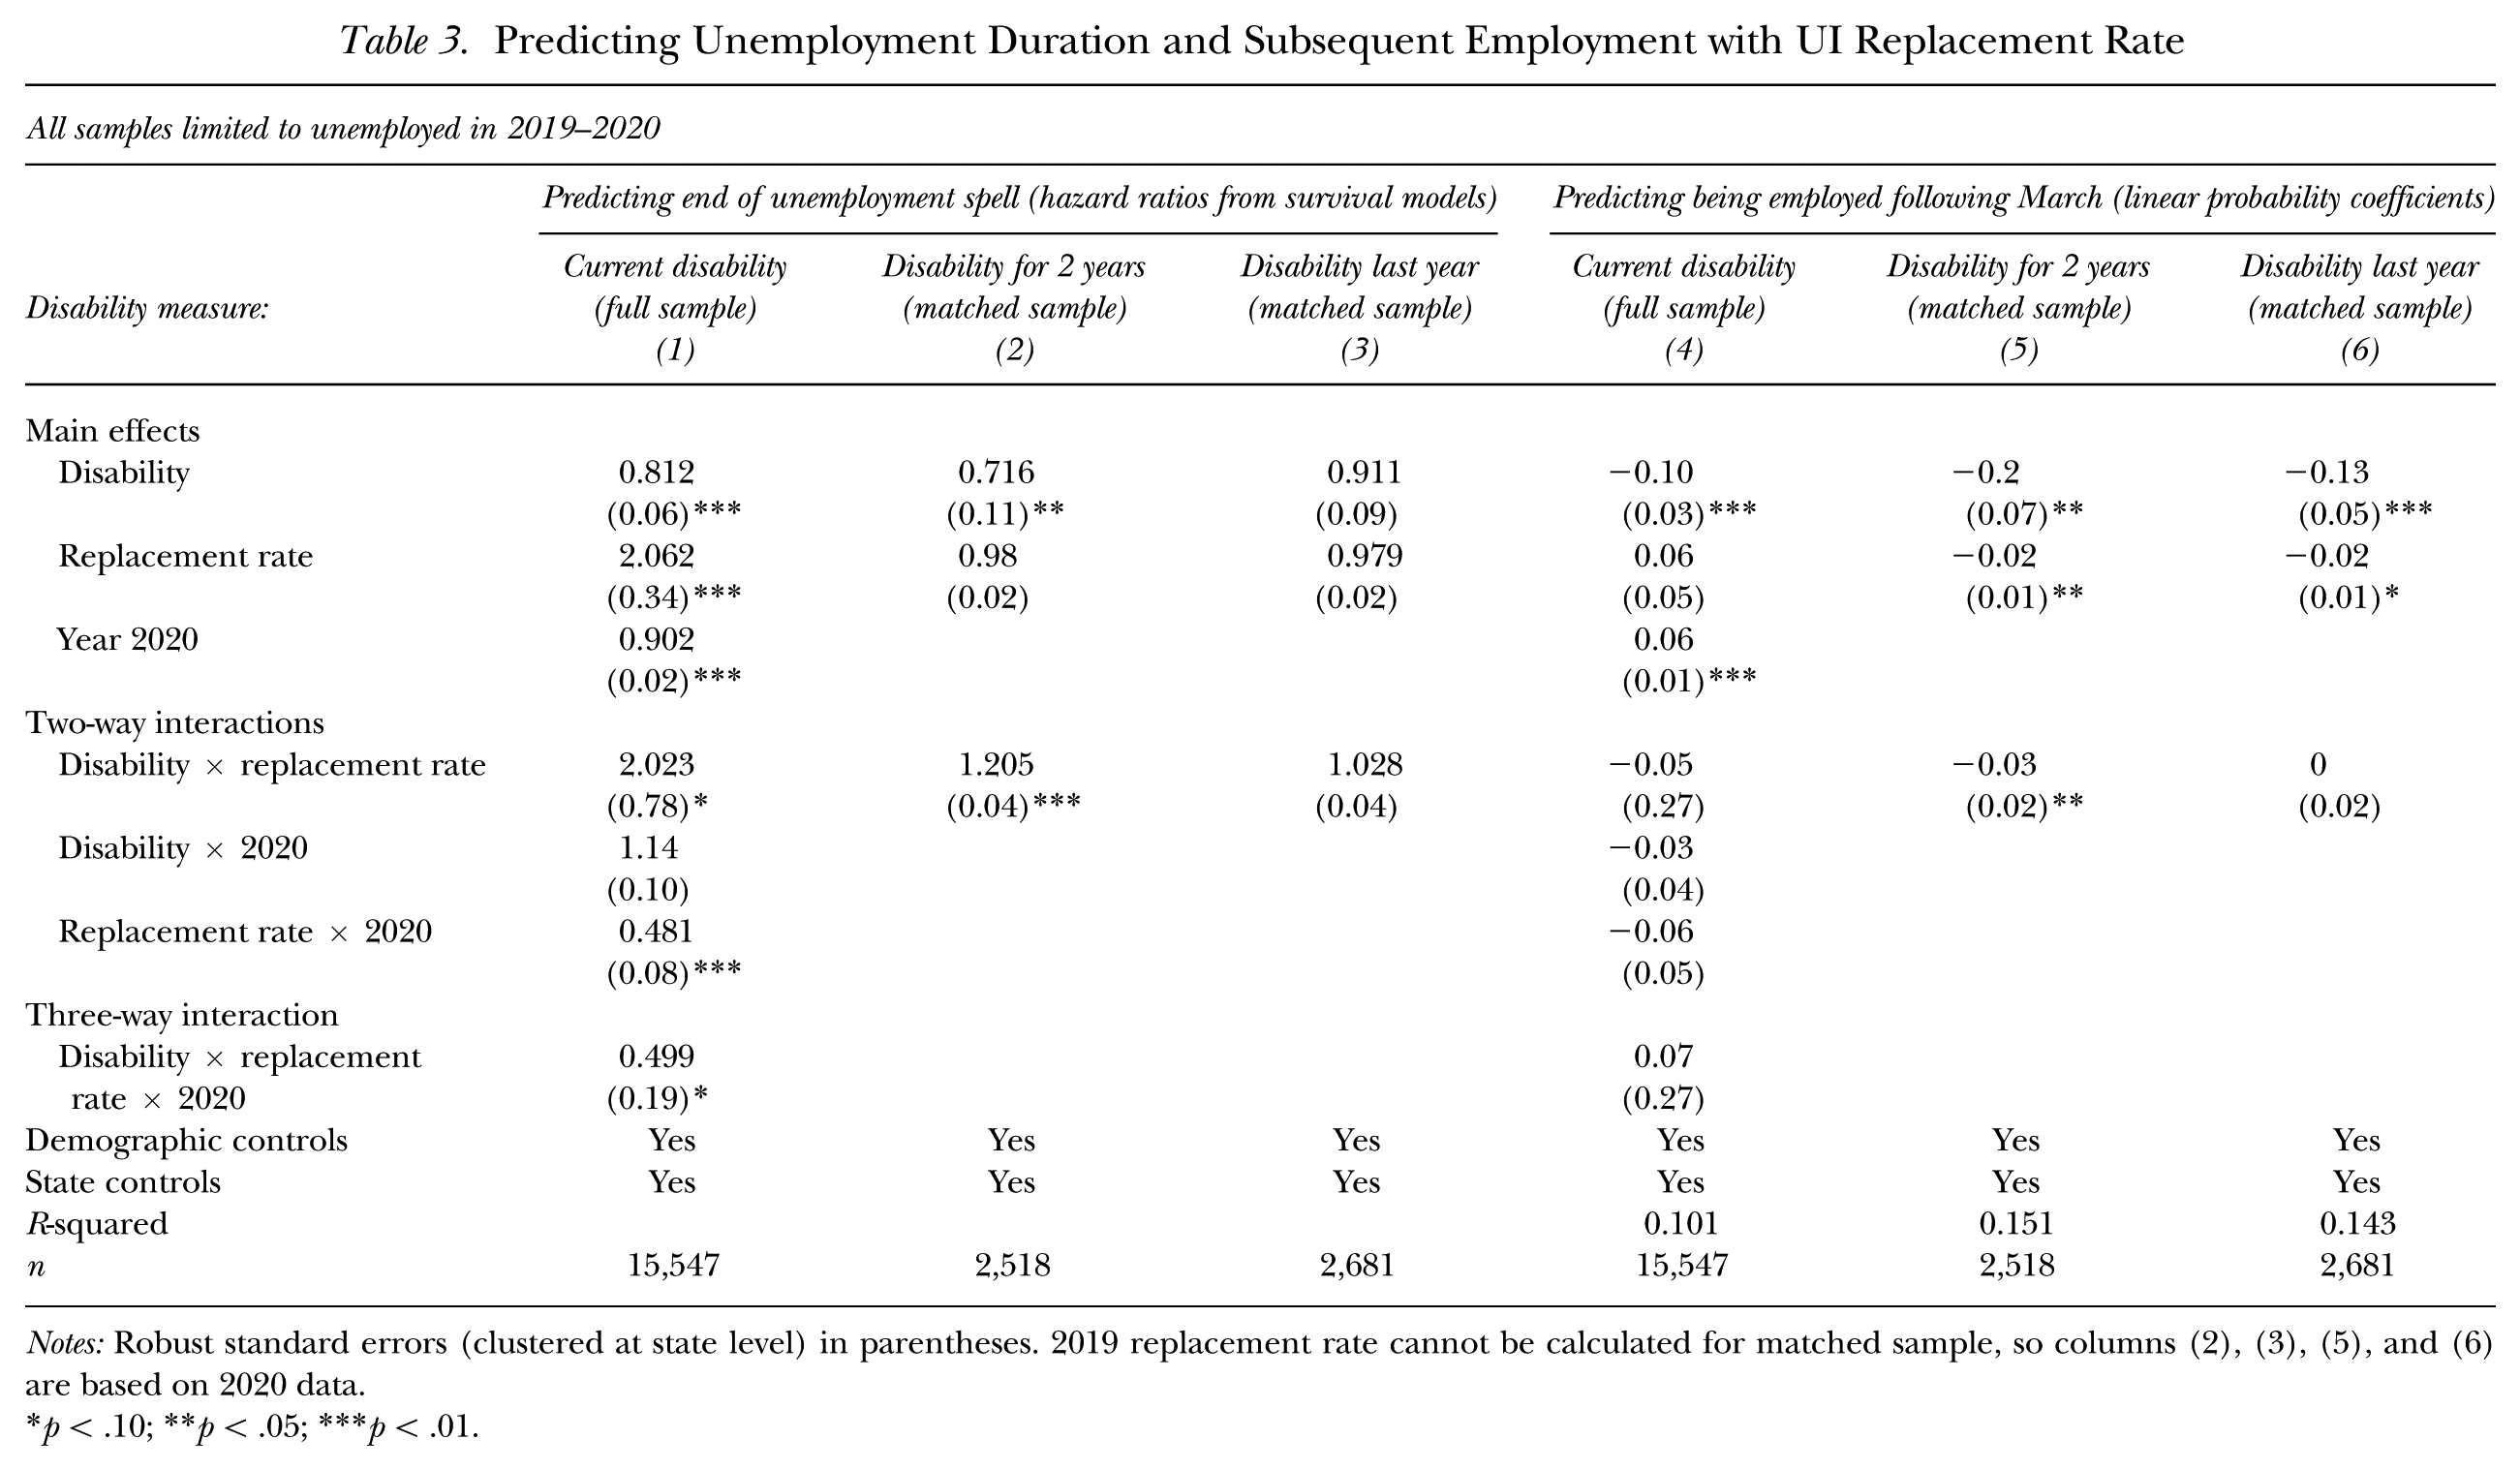
Table 3 turns from any UI receipt to the UI replacement rate during 2019 and 2020 as the main variable of interest (using the methods of Ganong et al. 2020, which are based on earnings data and are not affected by underreporting of UI income). As in Table 2, disability is linked to a lower likelihood both of ending unemployment and of being employed the following March. The significant hazard rate on the base replacement rate variable (2.062 in column (1)) indicates that those with a higher replacement rate had a lower unemployment duration in 2019, likely reflecting the especially positive effects of the 2019 tight labor market for low earners (who have higher replacement rates). This relationship, however, became much weaker in 2020 as indicated by the 0.481 hazard rate on the two-way interaction of the replacement rate and year 2020. The weaker relationship is confirmed in columns (2) and (3), which are restricted to 2020 data due to the construction of the matched sample; the UI replacement rate is not associated with a significantly higher or lower unemployment duration in 2020.
Table 3 also shows that disability interacts positively with the UI replacement rate in 2019 as indicated by the weakly significant 2.023 hazard rate on the interaction of disability and replacement rate, but the effect (if it exists) disappears in 2020 due to the weakly significant 0.499 hazard ratio on the three-way interaction of disability, replacement rate, and year 2020. However, there may still be a relationship between disability and the replacement rate in 2020, as shown by the significant hazard ratio of 1.205 on the two-way interaction of disability and replacement rate in column (2) (for those who reported a disability in both years). While column (2) indicates that workers with disabilities who have higher replacement rates have a higher likelihood of ending their unemployment, the same sample in column (5) indicates a lower likelihood of being employed in the following March; this suggests that this group may have ended their unemployment more quickly due to simply stopping their job searches rather than finding jobs.
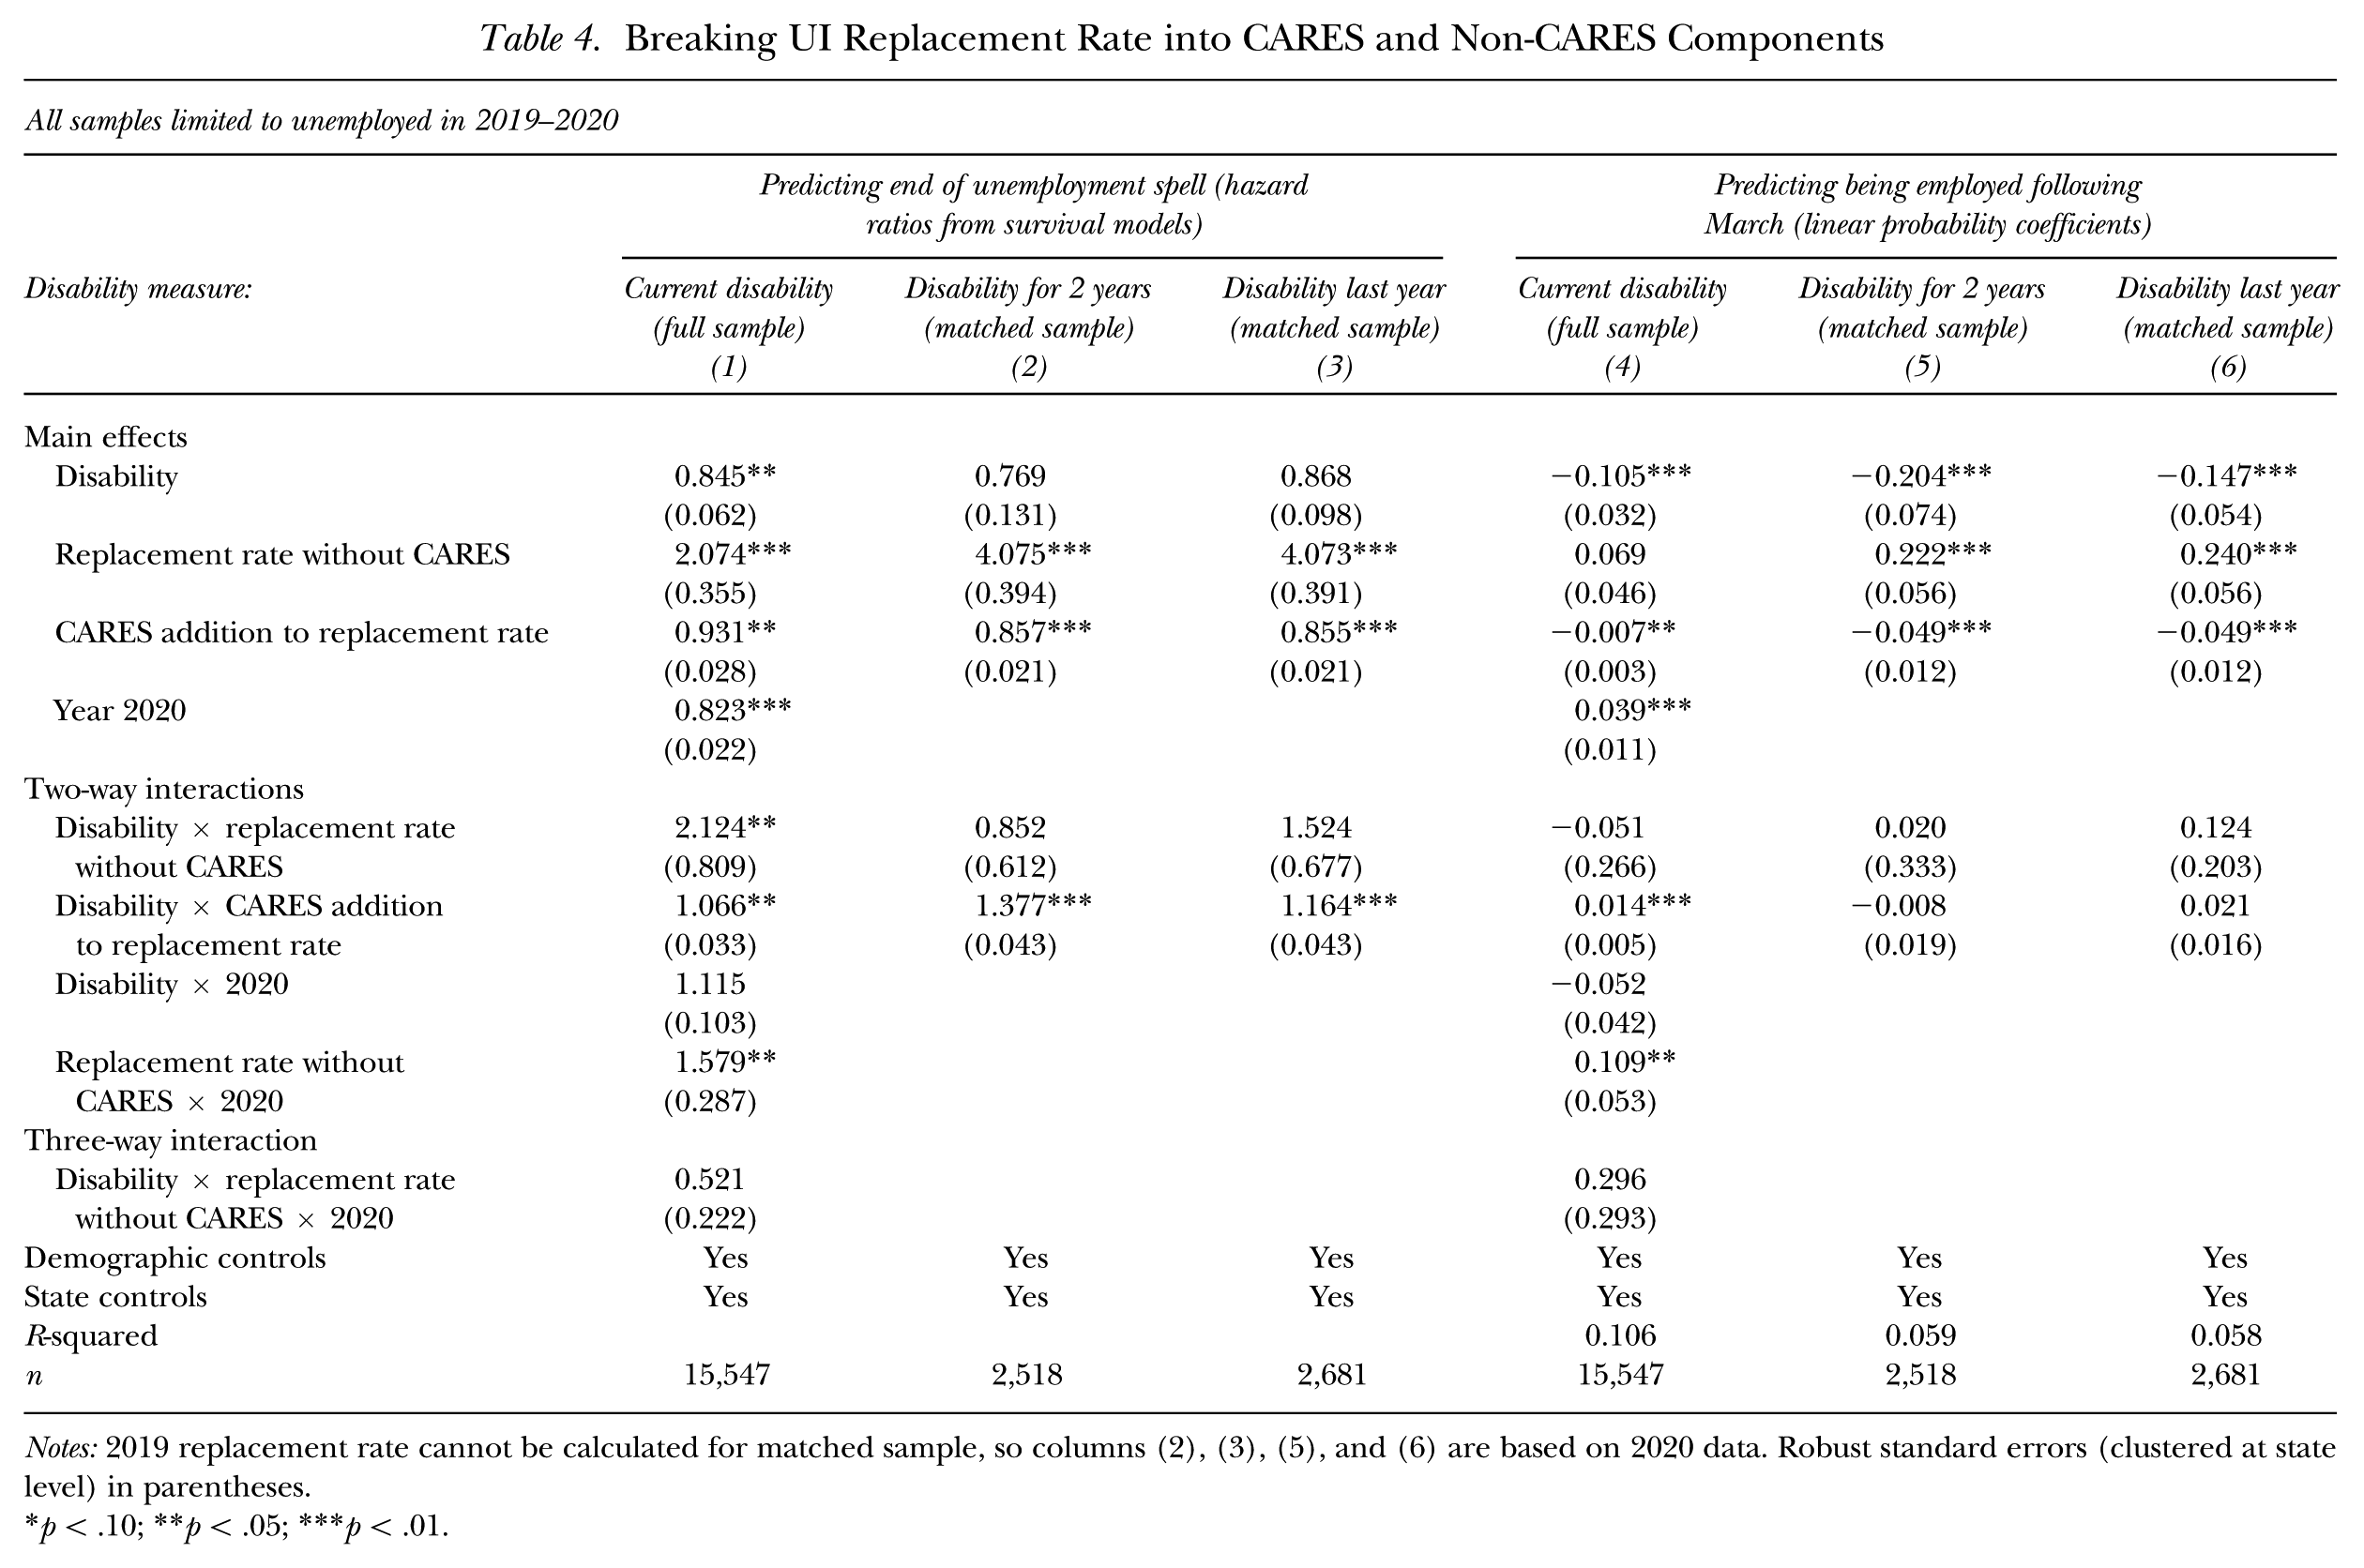
To look more closely at the effects of the CARES Act, Table 4 breaks the UI replacement rate into the standard replacement rate that would have existed without CARES, and the extra value of the replacement rate due to CARES. 4 As shown in Table 4, the main effect of the CARES addition to the replacement rate shows that it was linked with a lower probability of exiting unemployment (columns (1) to (3)), and a lower likelihood of being employed the following March (columns (4) to (6)). This result is consistent with Petrosky-Nadeau and Valletta’s (2021) finding of some disincentive effects on job finding rates.
The effects of the CARES supplement appear, however, to differ for workers with disabilities. The interaction of disability with the CARES supplement is positive and significant across columns (1) to (4) of Table 4, indicating reduced unemployment duration and a higher likelihood of being employed the following March. Note, though, that the disability interaction essentially nullifies the main effect of the CARES supplement for workers with disabilities: The hazard ratio for the CARES addition for workers without disabilities in column (1) is 0.931 (significantly less than 1), and after accounting for the disability interaction, the estimated hazard ratio associated with the CARES supplement for workers with disabilities is 0.931 × 1.066 = 0.992 (not significantly different than 1). In other words, any disincentive effect of the CARES supplement was much less, or nonexistent, among workers with disabilities. As suggested above, this may reflect the role of UI in especially helping workers with disabilities maintain health and job readiness.
This finding is broadly consistent with the findings from Valletta and Yilma (2024) that UI effects are stronger for people in lower income terciles, given that disability is generally associated with lower earnings (Kruse et al. 2018).
We have made several tests of possible nonlinear effects of the UI replacement rate, with no qualitative change in the pattern of results or conclusions. Tables A23 to A26 provide results by which we explore whether the effects of UI vary by disability type using the full sample regressions in Tables 2 and 3. Table A23 indicates few differences by disability type in the effects of UI receipt on unemployment duration (with the exception that people with vision impairments had less of an effect from UI receipt in general, but an enhanced effect in 2020). Looking at the effects of the UI replacement rate by disability type, Table A24 shows that both the two-way effects of disability and replacement rate, and the three-way effects of disability, replacement rate, and year 2020, are similar across all disability types.
There are greater differences by disability type when predicting employment in the following March. A striking result from Table A25 is that Table 2’s finding of a positive effect of the three-way interaction between disability, UI receipt, and the year 2020 is most pronounced for those with mobility impairments and difficulty going outside the home (columns (4) and (6)). These two groups (which strongly overlap) are the ones that probably benefited the most from the strong increase in home-based work during the pandemic. These results suggest that UI may have helped maintain the health and job readiness of these two groups so that they were ready to take advantage of the increased prevalence of home-based jobs during the pandemic recovery. These results are consistent for those with mobility impairments in Table A26, in which the three-way interaction of disability, UI replacement rate, and year 2020 shows a positive coefficient only for those with mobility impairments (column (4)), nullifying the negative two-way interaction of disability and UI replacement rate in other years. The extra UI in 2020 seems to have helped people with mobility impairments the most in obtaining employment, possibly because of the particular advantages of home-based work for this group.
To further investigate home-based work, we used the 2023 March ASEC data to examine the relationship between UI receipt in 2022 and employment in home-based work in March 2023 (earlier ASEC samples could not be matched to home-based work). Our results confirm that UI receipt is linked to later home-based employment: Among those who experienced unemployment in 2022 but were employed in March 2023, those who received UI in 2022 were about twice as likely as non-recipients to be in a home-based job (24.1% compared to 10.7% among people with disabilities, and 21.0% compared to 13.7% among people without disabilities). This positive link at least partly reflects the higher education levels of UI recipients compared to unemployed non-recipients (Table A3), since education is associated with a greater likelihood of white-collar jobs that are generally more amenable than blue-collar and service jobs to home-based work (Ameri et al. 2023).
Caveats
As in any observational study, selection issues may be affecting our results. There may be differential selection effects by disability status from the extra obstacles to employment that people with disabilities often face—for example, in transportation, the need for flexible schedules, or overcoming bias and employer reluctance to hire. These obstacles may cause many people with disabilities to stay out of the labor market altogether, so only those who face the lowest obstacles obtain jobs. Thus, people with disabilities who are successful in finding jobs may be more likely to be “super” workers (with high earnings power) relative both to other people with disabilities, and also to workers without disabilities who do not face extra obstacles. In this case, the employment disparities that people with disabilities face relative to those without may be understated by the selection effect. The average disability employment outcome would be lower if those with greater obstacles were able to enter the labor force, because they likely also have lower earnings power.
Although this selection effect is plausible, it is unlikely to interact with UI, which is available to almost all laid off workers—it is very unlikely that “super” workers with disabilities would apply for UI while other workers with disabilities would not. In this case, the selection effects would be unlikely to affect our coefficients of interest (disability-UI interactions). One selection effect that may interact with UI is that workers who face the most job market obstacles may decide to apply for and receive UI as long as they can, without great hope of overcoming the obstacles and finding a job (leading to discouragement and dropping out of the labor market when UI is exhausted). This effect could attenuate the UI coefficient in predicting employment next year: UI may play a strong positive role in future employment but have its effects masked if UI recipients face greater job market obstacles than do non-recipients. This selection effect may also occur for workers without disabilities, but could be stronger among workers with disabilities due to their greater obstacles. Employers may be especially worried about the abilities and performance of an unemployed worker with a disability who has not been recently employed. This would not, however, appear to explain the apparent differential effects of the CARES and non-CARES portions of the UI replacement rate, since the CARES portion was available to all UI recipients.
We have not addressed the possible role of disability income in our analysis, primarily because we are focused on labor market participants who would not be eligible for the federal SSDI and Supplemental Security Income (SSI) programs that require a demonstration of inability to work. Across all years only 0.13% (an n of 80) of the labor market participants with disabilities in our sample reported receiving any federal disability income in the prior year. It is nonetheless possible that some of the unemployed people with disabilities in our sample ended their job search with the intention of establishing eligibility for SSDI or SSI. As noted earlier, prior research is split on the relation between UI and disability income: One study found that higher UI benefits reduce SSDI applications (Lindner 2016), while another found that the expiration of UI benefits is not linked to SSDI applications (Mueller et al. 2016). Maestas and Mullen (2024) found that unlike in prior recessions, the SSDI application rate did not increase in the first two years of the pandemic (through May 2022) and suggested a partial explanation that “unprecedented unemployment insurance expansions and stimulus payments may have helped mitigate the impact of the COVID recession” (p. 216). In further work, we will use the ASEC data to explore whether the receipt of UI was related to the receipt of SSDI income or SSI in the following year.
Finally, as discussed earlier, there may have been compositional changes among those who received UI as the pandemic began and receded. Our Table A3 presents regressions showing that there were very few compositional changes in the UI population by disability type, or in the interactions of disability with demographic characteristics, between 2019 and 2020 when the pandemic hit or between 2020 and 2021 as the recovery began. In particular, education is commonly associated with higher employment and earnings, and there were no significant disability differentials in compositional changes by education. Our regressions account for observable compositional changes by controlling for demographic characteristics. While it is always possible that there were unobservable compositional changes, we have no reason to believe that such changes are likely to affect our results.
Summary and Conclusions
Overall, our results indicate that both the incidence and effects of UI appear to differ for workers with disabilities, particularly in the pandemic year of 2020 when the CARES Act was implemented. With regard to the effects of UI on incomes, we find first that workers with disabilities are generally more likely than those without disabilities to receive UI due to their higher likelihood of involuntary job loss. Second, as the pandemic hit in 2020, the likelihood of UI receipt among labor market participants increased more among workers with disabilities than among those without disabilities. Third, UI is generally a larger portion of personal and family incomes for workers with disabilities than for workers without disabilities. Fourth, as the pandemic hit in 2020, UI as a percentage of personal and family incomes increased more across all workers with disabilities than those without disabilities, although the increase was similar when confined to UI recipients. Fifth, the 2020 CARES expansion of UI played a larger role in bringing workers with disabilities out of poverty status compared to workers without disabilities.
With regard to the role of UI in job finding, we find first that UI recipients with disabilities have a higher likelihood than non-recipients of being employed the following March according to two of the three disability measures, although unemployment duration is not affected. Second, the positive relationship of UI receipt for workers with disabilities with being employed the following March was magnified in 2020 according to one of the disability measures, indicating an extra 10 percentage point likelihood of such employment—raising the likelihood of employment from 46.7% to 57.0%, while among UI recipients without disabilities the employment rate was lower than among comparable non-recipients. This positive disability effect was concentrated among those with mobility impairments and difficulty going outside alone, possibly because of the extra advantages of remote work among these workers (supported by evidence that remote work is more common among re-employed UI recipients than among non-recipients). This especially positive effect in 2020, but not in 2021, may result from the greater availability of UI during 2020 and the increased importance of UI for the health and labor market readiness of people with disabilities in the first 10 months after pandemic onset, when health risks were especially high and financial resources were especially strained. Third, the effects of a higher UI replacement rate in 2019–2020 are mixed with regard to disability: Among those with any disability in both years, a higher replacement rate in 2020 was associated with lower unemployment duration but a lower likelihood of being employed the following March. When breaking out the CARES and non-CARES components, however, the CARES-related portion of the replacement rate is linked to lower unemployment duration across all disability measures, and a higher likelihood of being employed the following March for the current disability measure.
The results confirm our expectation that UI generally plays a more important role in the incomes of workers with disabilities and also provides some support for our expectation that UI receipt and a higher replacement rate especially help people with disabilities to be employed in the following year. The results do not confirm our expectation that UI receipt could lead to especially longer unemployment duration for people with disabilities by providing them more time to negotiate obstacles in job finding.
Our best interpretation of the positive effect of UI on the likelihood of workers with disabilities being employed the following March is related to health, as described earlier. People with disabilities generally face greater health problems, and prior research shows positive effects of UI on health outcomes. It is therefore possible that UI plays an especially salutary role for people with disabilities in helping maintain health by avoiding food insecurity and enabling preventive health measures such as doctor’s visits and covering insurance costs. By better maintaining their health, workers with disabilities can be more ready for job opportunities when they arise. This interpretation would be especially likely during a health crisis such as the first year of the pandemic in 2020, when we found especially positive effects of the CARES-related increase in the UI replacement rate on the subsequent employment of people with disabilities. As noted earlier, the timing may be significant, since the 2020 CARES expansion of UI may have had especially positive effects for people with disabilities by providing extra income support to support health and labor market readiness just as the pandemic was expanding remote work opportunities that meet the needs of many people with disabilities (Ameri et al. 2023). This is consistent with our finding that employment was especially high for people with disabilities in 2021 but there was not an especially positive effect of UI: In such a situation of high demand, the ameliorative effects of UI may be greatly reduced, since people with disabilities have relatively easy access to jobs whether or not they are receiving UI.
Future work might explore the role of UI and Medicaid or unemployment-related health insurance for people with disabilities. Future work may also estimate whether UI affects the quality of the subsequent jobs of people with disabilities by asking the following questions: If UI increases someone’s likelihood of employment in the future, how well-paying is the next job, compared to the previous job? Has the rise in remote work opportunities increased average income for people with disabilities, or improved match quality in other ways? These topics (and more) are important subjects of future research, as people with disabilities make up a substantial yet under-researched portion of our labor force.
Supplemental Material
sj-pdf-1-ilr-10.1177_00197939261448499 – Supplemental material for Does Unemployment Insurance Matter More for Workers with Disabilities? A Study of the 2020 CARES Expansion
Supplemental material, sj-pdf-1-ilr-10.1177_00197939261448499 for Does Unemployment Insurance Matter More for Workers with Disabilities? A Study of the 2020 CARES Expansion by Shailee Manandhar, Roisin O’Neill and Douglas Kruse in ILR Review
Footnotes
Appendix A
Questions used by Census Bureau to identify disability status on Current Population Survey:
Acknowledgements
We appreciate useful comments from Robert Valletta, Ira Gang, and participants at Eastern Economics Association and Labor and Employment Relations conferences.
This study is funded by a grant from the National Institute on Disability, Independent Living, and Rehabilitation Research (NIDILRR) for the Rehabilitation Research & Training on Employment Policy: Center for Disability-Inclusive Employment Policy Research Grant #90RTEM0006-01–00, Peter Blanck, PI. The views provided herein do not necessarily reflect the official policies of NSF or NIDILRR, nor do they imply endorsement by the Federal Government.
For general questions as well as for information regarding the data and/or computer programs, contact the corresponding author at
2
Whereas ![]() found that total UI income was understated by approximately half during the pandemic, our figures indicate less understatement when limited to those who reported positive weeks of job search (excluding those who lost jobs and received UI but did not engage in job search due to the lack of available jobs).
found that total UI income was understated by approximately half during the pandemic, our figures indicate less understatement when limited to those who reported positive weeks of job search (excluding those who lost jobs and received UI but did not engage in job search due to the lack of available jobs).
3
The non-disability UI effects are calculated by dividing average weeks unemployed for non-recipients without disabilities (Table A17) first by the base UI coefficient and then by the product of the base UI and UI × 2020 coefficients in ![]() , column (1). The disability UI effect is calculated by dividing average weeks unemployed for non-recipients with disabilities (Table A17) by the product of the base UI, UI × 2020, Disability × UI, and Disability × UI × 2020 coefficients in Table 2, column (1).
, column (1). The disability UI effect is calculated by dividing average weeks unemployed for non-recipients with disabilities (Table A17) by the product of the base UI, UI × 2020, Disability × UI, and Disability × UI × 2020 coefficients in Table 2, column (1).
4
Timing issues affect this calculation, as the CARES supplement expired on July 31, 2020, so it would not have been in effect during weeks of unemployment experienced after that time. This measurement error will decrease the magnitudes of our estimates.
References
Supplementary Material
Please find the following supplemental material available below.
For Open Access articles published under a Creative Commons License, all supplemental material carries the same license as the article it is associated with.
For non-Open Access articles published, all supplemental material carries a non-exclusive license, and permission requests for re-use of supplemental material or any part of supplemental material shall be sent directly to the copyright owner as specified in the copyright notice associated with the article.