






Abstract
This meta-analysis employs 3,574 estimates from 82 studies to assess how working from home (WFH) affected employee productivity before and after the start of the COVID-19 pandemic. The authors find a small but positive average effect, driven by gains in hourly productivity and increased hours worked. Pre-pandemic, benefits were concentrated among hybrid workers, while during the pandemic, both hybrid and remote workers benefited. The effect varies by sex, parental status, and global region. The authors detect publication bias in both pre-pandemic studies and those employing data from the pandemic. Using Bayesian model averaging, they correct for publication bias, heterogeneity in research design, data quality, and estimation method, to produce more reliable estimates of the impact of WFH on productivity. Findings suggest WFH can modestly enhance productivity, but outcomes are context dependent. The authors identify key evidence gaps to guide future research and recommend that managers and policymakers adopt flexible, evidence-informed telework strategies.
Working from home (WFH), also called telework or teleworking, has grown steadily since the 1980s. Some employees work entirely from home (“remote workers”), while others combine home-based and on-site work (“hybrid workers”). The COVID-19 pandemic caused a dramatic increase in WFH, especially fully remote work, in response to mobility restrictions. As lockdowns lifted, managers faced difficult choices about whether to maintain remote work options, given employee preferences for flexibility and autonomy. Yet, concerns about reduced collaboration, weakened mentoring, and employee isolation have motivated firms to reassess the benefits of hybrid or on-site work.
For firms, WFH can reduce real estate and utility costs. However, if telework reduces productivity—due to shirking, communication barriers, or limited team coordination—then the cost savings may be negated by output losses. Conversely, WFH reduces commute time, leaving employees more energized, and enhances job autonomy; it may therefore boost both work effort and hourly productivity. Overall, the net productivity effect remains theoretically ambiguous, but is an important concern for managers who must choose between on-site, hybrid, and remote work arrangements.
This ambiguity is reflected in the empirical literature. Some studies have reported productivity gains from WFH (e.g., Labrado Antolín, Rodríguez-Ruiz, and Fernandez Menendez 2024), while others found declines (e.g., Giménez-Nadal, Molina, and Velilla 2020) or no significant effect (e.g., Kawaguchi, Kitao, and Nose 2022). Differences in research design, including reliance on observational versus quasi-experimental or experimental methods, variation in how productivity is measured, and the absence of adequate controls to address omitted variable bias may explain the lack of consensus.
Moreover, productivity effects likely vary across types of workers and contexts. Evidence is mixed on whether remote or hybrid arrangements are more effective, and whether effects differ by sex or parental status. The importance of occupation-level teleworkability, including task interdependence and need for team coordination, has been noted, yet few studies systematically address this issue. Country-level variation, shaped by institutional context and digital infrastructure, and sectoral differences, particularly during the pandemic, remain under-explored.
When the literature fails to reach a consensus, meta-analysis can be used to gauge the size and direction of an economic effect. Meta-analysis is a powerful statistical technique that 1) consolidates the empirical results of prior research to estimate the true population effect, and 2) permits an investigation of how methodological differences across studies contribute to the lack of prior consensus.
This meta-analysis addresses these gaps. Drawing on 3,574 estimates from 82 studies, we pursue four objectives. First, we assess whether WFH raises or lowers employee productivity. Second, we examine whether the effect differs between hybrid and fully remote workers. Third, we test whether effects vary across demographic and contextual subgroups: by sex, parental status, sector, and country. Fourth, we investigate how methodological differences, including estimation technique, data quality, and identification strategy, influence reported outcomes. Our first three objectives provide actionable insights for managers and policymakers. Our fourth informs best practices for future empirical research.
Literature Review
Working from Home and Productivity
A large literature has examined the impacts of working from home (WFH) on employees. Teleworking can improve employee well-being by reducing stress, increasing happiness, and enhancing job satisfaction (Shamir and Salomon 1985; Anderson, Kaplan, and Vega 2015; Kazekami 2020), making it an increasingly desirable option in modern labor markets (He, Neumark, and Weng 2021). From the employee’s perspective, WFH often fosters a stronger sense of autonomy (Diab-Bahman and Al-Enzi 2020) and reduces turnover intention (Choi 2020; Tsen, Gu, Tan, and Goh 2021).
However, while many employees welcome WFH opportunities, the arrangement is not without challenges. Critics point to psychosocial downsides, such as reduced informal interaction with colleagues, which can lead to loneliness (Walz, Kensbock, De Jong, and Kunze 2024). WFH can also increase domestic tensions. For instance, overlapping demands from children or other family members may create stress that undermines the benefits of WFH autonomy (Xu et al. 2022). WFH can also lead to a decline in mentoring and professional development opportunities, especially for early-career workers (Yarberry and Sims 2021) and can reduce the likelihood of promotion and impair career advancement (Bloom, Liang, Roberts, and Ying 2015). More broadly, research indicates that blurred boundaries between work and home responsibilities can have detrimental effects on life satisfaction and mental health (Senik et al. 2024; Bertoni, Cavapozzi, Pasini, and Pavese 2025).
WFH participation was increasing even before the pandemic, with growing uptake observed across European economies (Brenke 2014; Vilhelmson and Thulin 2016) and in the United States (Lister and Harnish 2011). However, the onset of COVID-19 created a dramatic inflection point when millions of workers worldwide were asked, or required, to perform their jobs from home (see, e.g., Garcia 2022; Scheibe, De Bloom, and Modderman 2022). Unlike pre-pandemic adoption, this transition was often involuntary and universal, creating what some scholars have called a forced experiment in remote work. It disrupted long-held assumptions about workplace presence and fueled global debates about the future of work.
Post-pandemic, WFH has become a permanent feature of the employment landscape in many countries. While some firms have encouraged or mandated a return to the office, others have embraced hybrid or fully remote models. According to Parker, Horowitz, and Minkin (2022), a large share of employees favor continuing some form of WFH, citing improved work–life balance and reduced commuting costs. In addition, Emanuel and Harrington (2024) noted that workers have made both physical and human capital investment when setting up a home office and adapting to remote work that they may be unwilling to abandon. Meanwhile, employers are engaged in active discussions about how much flexibility to retain (Dennison 2024), especially in light of uneven productivity outcomes during the pandemic years.
From an organizational standpoint, teleworking offers tangible operational benefits. Reducing physical office space can lower rent, utilities, and maintenance expenditures (Morgan 2004; El Hajal 2022). Remote work policies also enable firms to access broader talent pools, allowing firms to recruit candidates from faraway regions when the local labor market does not offer a requisite skill set (Choudhury 2022). This decoupling of employment from geography has major implications for global hiring practices and wage convergence across locations. Nonetheless, telework also introduces managerial and coordination challenges. Informal knowledge-sharing—the hallway conversation or impromptu brainstorming session—becomes rarer, and some firms report declines in innovation speed or team cohesion (Taskin and Bridoux 2010).
Trust and oversight also emerge as key managerial concerns. Parker, Knight, and Keller (2020) noted that the shift to WFH has required new norms for accountability and evaluation. In traditional settings, performance could be inferred through visibility and interaction; remote contexts demand alternative performance metrics. The lack of physical oversight raises fears of shirking, though empirical evidence on this issue remains mixed.
Ultimately, the viability of WFH hinges on its effect on productivity. If productivity increases or remains stable, then the cost savings and recruitment advantages should lead to net gains for firms. But if output declines due to coordination delays, communication inefficiencies, or employee disengagement, then the model becomes financially and strategically questionable. For this reason, scholars have sought to empirically assess whether WFH enhances or hinders productivity. The results, however, remain inconclusive.
Several studies have proposed psychological and logistical channels through which remote work may enhance performance. Remote workers frequently report greater intrinsic motivation and job satisfaction (Bailey and Kurland 2002; Giménez-Nadal, Molina, and Velilla 2018), and these affective states have been linked to higher productivity (Oswald, Proto, and Sgroi 2015). WFH arrangements often afford employees the opportunity to work during peak energy times, avoid workplace distractions, and manage tasks in a sequence that best suits them. Kazekami (2020) and Metselaar, den Dulk, and Vermeeren (2023) argued that task autonomy and flexible scheduling reduce stress and increase output. Furthermore, avoiding daily commutes saves time and energy, which can then be redirected to core job functions (Arntz, Ben Yahmed, and Berlingieri 2022). These mechanisms are particularly salient in urban settings with long commuting times or unreliable transit.
Still, there are countervailing channels that may suppress productivity. The most frequently cited is reduced monitoring. Classic organizational theory posits that in the absence of supervision, workers may shirk (Causer and Jones 1996; Pyöriä 2011). While technology now enables some degree of monitoring (e.g., keystroke tracking or virtual check-ins), such practices can erode trust and trigger resistance. In parallel, household distractions, from children, pets, or shared spaces, can hinder focus and task completion (Mann and Holdsworth 2003; Delanoeije, Verbruggen, and Germeys 2019; Yang, Kelly, Kubzansky, and Berkman 2023). These issues are particularly relevant in multigenerational households or smaller living quarters.
Reduced in-person collaboration can also lead to communication lags and weaker problem-solving capabilities. Complex projects requiring real-time feedback or creative brainstorming may suffer in remote-only environments (Fonner and Roloff 2010; Sarker, Sarker, Xiao, and Ahuja 2012). Baruch (2000) highlighted the erosion of informal mentoring and team identity when work becomes distributed. This concern is echoed in studies of younger workers, who often rely more heavily on informal learning and feedback loops than their more experienced peers.
Empirically Assessing WFH and Productivity
Because WFH introduces both productivity-enabling and productivity-constraining mechanisms, its overall impact remains theoretically ambiguous. Consequently, researchers have pursued both qualitative and quantitative approaches to assess the net effect. Some rely on interviews, reflective surveys, or case studies (Bosua, Kurnia, Gloet, and Mendoza 2017; Korkeakunnas, Heiden, Lohela-Karlsson, and Rambaree 2023), while others estimate empirical models of the form:

where productivity differences among employees (i) are modeled as a function of WFH status, other observable factors affecting productivity (
These discrepancies may reflect differences in research design. Observational studies often use ordinary least squares (OLS) regression to estimate WFH impacts (e.g., Pabilonia and Vernon 2022). Some researchers argue that selection into telework is endogenous (Emanuel and Harrington 2024) and therefore attempt to correct for selection bias using quasi-experimental techniques such as instrumental variables or propensity score matching (Pigini and Staffolani 2019; Braun, Cyronek, and Rupert 2021; Kawaguchi et al. 2022). More recently, a few studies have employed randomized controlled trials (RCTs) in which workers are randomly assigned to either WFH or on-site arrangements (Atkin, Schoar, and Shinde 2023; Choudhury, Khanna, Makridis, and Schirmann 2024). These studies provide cleaner identification but face practical and generalizability limitations because they each take place within a single firm, so it is not clear to what extent the outcomes may be driven by unique management, corporate culture, or other structural characteristics of the specific organization. Our meta-analysis will evaluate various research designs and investigate whether estimates differ systematically across them.
Another potential cause of the lack of consensus may be that many studies assume a homogeneous productivity effect across all types of workers. Research suggests, however, that the WFH–productivity relationship is moderated by several factors. First, productivity may depend on the intensity of telework. Hybrid workers often show better outcomes than fully remote workers (Kazekami 2018; Giménez-Nadal and Velilla 2024), perhaps because they benefit from both autonomy and team interaction.
Second, effects may vary by sex or family status. Pabilonia and Vernon (2022) reported larger productivity gains for males than females, while Angelici and Profeta (2020) found that parents, especially those with young children, gain more from teleworking. These differences may reflect variations in caregiving roles, work–life conflict, or household support structures.
Third, effects may depend on sector and occupation. Most studies pool sectors, but some focus on information and communications technology (ICT) (Gibbs et al. 2023), manufacturing (Kitagawa, Kuroda, Okudaira, and Owan 2021b), services (Aksoy et al. 2025), or public employment (Choudhury, Foroughi, and Larson 2021). WFH may be more productive in knowledge-intensive or digital roles and less suitable in client-facing or manufacturing settings (Kazekami 2018; Rupietta and Beckmann 2018). However, few studies conduct cross-sectoral comparisons. The nature of the job also plays a role. Some occupations have lower teleworkability due to physical labor or high interdependence among workers; others (e.g., software engineering, writing, data analysis) can more easily be performed at home. Unfortunately, most studies fail to consider teleworkability, making it difficult to generalize findings with respect to occupations.
Fourth, national context may matter. Most studies analyze a single country, such as France (Bergeaud et al. 2023), Germany (Arntz et al. 2022), Italy (Neirotti et al. 2012), Japan (Kawaguchi and Motegi 2021), the United Kingdom (Deole, Deter, and Huang 2023), or the United States (Gibbs et al. 2023). Baseline productivity levels, digital infrastructure, and institutional settings vary widely across countries (Bernard and Jones 1996; Naor, Linderman, and Schroeder 2010). If such differences moderate the WFH–productivity relationship, that may account for some of the heterogeneity observed across study outcomes. A few studies pool data across countries (e.g., Ono and Mori 2021; Barczyk, Spychała, Urbanowicz, and Ziomek 2022), but none to date have attempted to make comparisons across countries.
Methodological Differences across Studies
The empirical literature examining the impact of WFH on productivity has employed a range of methods. Productivity measurement is inconsistent across studies and may account for some of the variation in observed results.
Some studies measure objective task output in a specific organization (Choudhury et al. 2021; Ko and Baek 2025), which accurately reflects the employee’s true production, but limits generalizability since productivity outcomes may reflect unique institutional or managerial factors, and tasks vary across occupations and firms.
Others use revenue (Monteiro, Straume, and Valente 2021; Kawaguchi et al. 2022), which is easy to observe and comparable for employees across many firms. However, revenue analyses rely on an assumption that the price of output remains constant and is the same across firms so that differences in revenue reflect differences in output only; the studies generally do not have data on prices to confirm the validity of this assumption.
Alternatively, many scholars have instead used either hourly earnings (e.g., Pabilonia and Vernon 2022; Birch and Preston 2025;) or total income (Kawaguchi and Motegi 2021; Deole et al. 2023). Measuring productivity using income is justified using the neo-classical assumption that employees are paid based on their marginal product. It has a major advantage in that data are often available from large representative surveys conducted by national statistics agencies and is easily comparable across jobs and industries. However, there are multiple disadvantages to measuring productivity using income. First, income can reflect market conditions and employee bargaining power, so is not a perfect proxy for output. Second, with respect to hourly earnings specifically, this measure does not account for the fact that teleworkers may work a different number of hours than non-teleworkers (see, e.g., Rupietta and Beckman 2018; Lyttelton, Zang, and Musick 2022) so that differences in hourly earnings may not fully represent differences in overall output between teleworkers and non-teleworkers. The use of total income should correct for this problem because it captures both hourly differences and differences in hours worked in a single measure; however, it obscures whether an earnings difference results from hourly productivity, working hours, or both.
Therefore, some scholars simply examine the change in total working hours as an indicator of productivity (e.g., Giménez-Nadal et al. 2020; Pabilonia and Vernon 2022). This measure requires the assumption that productivity per hour is either unchanged or at least changes in a way that leads to greater overall output when hours of work increase. Given the negative productivity channels described above, however, it is possible that an increase in hours worked could simply be a response to lower productivity per hour when teleworking, so that employees’ actual output is unchanged or possibly lower despite the extra working time, something this measurement method does not capture, and leads back to the importance of also considering hourly earnings and total income as alternative measures.
Last, many studies use a Likert scale (Kitigawa et al. 2021a; Chen et al. 2023; Deole et al. 2023), asking respondents to rate their productivity. This method has two advantages. First, it is a holistic measure that avoids all the specific disadvantages of the other methods listed above. Second, several national statistics agencies have adopted this measure in their surveys so it is available for large representative samples; the recent adoption by national statistics agencies also explains why it is commonly employed in the most recent works on this topic. However, it has its own disadvantages in that it provides a less exact measure of productivity changes and may suffer from measurement error if respondents perceive productivity differently from each other. Overall, the literature has used many distinct measures of productivity, each with its own advantages and disadvantages; we will investigate whether the measurement method affects the estimation of the WFH–productivity relationship.
Measurement of WFH itself also varies. A common approach is to use a binary indicator for participation (e.g., Pigini and Staffolani 2019), but this approach fails to capture variation in WFH frequency or duration. A better alternative is to measure the proportion of time spent teleworking (Kazekami 2020), which allows researchers to estimate the marginal effect of WFH intensity. Our meta-analysis compares results across both binary and continuous WFH measures.
Finally, model specification, that is, which control variables are included, may also matter. Some studies control for a worker’s commute distance (e.g., Gibbs, Mengel, and Siemroth 2021), arguing that productivity gains from avoiding commuting should be greater for workers with longer commutes. However, others do not include commute distance (e.g., Pigini and Staffolani 2019; Monteiro et al. 2021). Some control for firm size (e.g., Rupietta and Beckmann 2018; Arntz et al. 2022) since firm size is often related to employee productivity and employees in larger firms are more likely to participate in WFH (Morikawa 2021); however, others do not account for firm size (e.g., Angelici and Profeta 2020; Giménez-Nadal et al. 2020). Some include employees’ education level (e.g., Pigini and Staffolani 2019; Kazekami 2020), since productivity can differ by educational attainment; however, others do not consider an employee’s education level (e.g., Choudhury et al. 2021). Last, some control for whether the employee has time flexibility in their job (e.g., van der Lippe and Lippényi 2020; Okubo, Inoue, and Sekijima 2021), that is, the ability to perform tasks at a time best for them rather than being forced to work a fixed schedule; those with time flexibility should be more productive because they can optimize the timing of their work. However, other studies do not control for whether an employee has time flexibility (e.g., Arntz et al. 2022; Deole et al. 2023). If any of these factors moderates the productivity effect of telework, their exclusion from the model specification would bias the estimate of the WFH–productivity relationship and could account for differences in results across studies. We will evaluate the potential for omitted variable bias below.
In summary, the WFH–productivity literature is broad and diverse with respect to sampled populations, study methodologies, and, ultimately, results. We therefore undertake a meta-analysis to provide a clearer picture of when, where, and for whom WFH improves or diminishes productivity.
Data Collection and Standardization
We use EconLit, Google Scholar, and Web of Science to gather studies that estimate Equation (1). To identify these studies, we employ key terms such as “productivity,”“income,” and “output,” and pair each with terms such as “work from home,”“remote work,” and “telework.” Figure A.1 in the Online Appendix presents a PRISMA (preferred reporting items for systematic reviews and meta-analyses) diagram that describes the literature search process. We include all studies that employ one of the productivity measures described in the previous section. We include only studies that measure the productivity of employees performing their work duties in their place of residence, that is, their “home.” Some studies that investigate “remote work” or “telework” observe satellite offices or traveling workers; we exclude such studies. We include only studies that provide enough information (i.e., coefficients, standard errors, sample size) to determine the t-statistic and degrees of freedom for the estimate of

where

where
Because studies utilize various measures of the outcome and explanatory variables as described in the literature review, we must standardize each estimate for comparability. Following recent meta-studies (i.e., Doucouliagos and Ulubaşoğlu 2008; Cazachevici et al. 2020), we employ the partial correlation coefficient (PCC). The PCC provides a standardized measure of the direction and strength of the relationship between two variables, holding other factors constant. The PCC lies between –1 and +1, where –1 (+1) represents perfect negative (positive) association. We use the PCC values of 0.048, 0.112, 0.234 proposed by Doucouliagos (2011) to define small, medium, and large effect sizes. The partial correlation coefficient is preferrable to other common standardization measures such as Cohen’s d or Fisher’s z-transformation because, unlike other measures, the PCC controls for the presence of confounding variables that influence WFH and productivity. The PCC for the kth estimate can be calculated directly from the regression outputs reported in the primary studies using Equation (4) (see Reed 2020):

with standard error

where
We separate studies into two distinct samples: those using data collected before the COVID pandemic (up until the year 2019) and those using data collected during and after the COVID pandemic (2020 onward) for two reasons. Prior to the COVID pandemic, many employees in teleworkable jobs were not actually engaged in WFH because their employers did not offer the opportunity. However, government-imposed pandemic restrictions caused an exogenous compositional change in the population of employees working from home as many employees who would not previously have been offered a WFH opportunity were forced into one. Second, teleconferencing technology (i.e., Zoom, MS Teams, and so on) advanced rapidly in features and quality, and a wider array of employees and managers became more accustomed to using it. Given the compositional and technological changes affecting the population of employees working from home, we hypothesize that the relationship would differ between the pre-pandemic and pandemic periods. The end of government-imposed lockdowns provided employers with the option to be more selective in who they offered WFH opportunities to, which raises the concern that productivity might differ between the pandemic (2020–21) and post-pandemic (2022–onward) periods if employers selectively recall less-productive teleworkers back to their physical premises. We test for a difference in the average PCC between the pandemic and post-pandemic periods but do not find a statistical difference (PCCpandemic = 0.040; PCCpost = 0.036; t = 0.72, p-value 0.238). Given that the small number of post-pandemic estimates (47) is insufficient to conduct a separate analysis of that time period, and given that we do not observe a statistical difference in PCCs between the pandemic and post-pandemic periods, we combine estimates from both periods for the analysis. We therefore identify 46 studies (2,228 estimates) that employ data collected pre-pandemic (1988 to 2019) and 43 studies (1,346 estimates) that employ data collected since 2020; as 7 studies provide separate estimates for the pre-pandemic and (post-)pandemic periods, that leaves us with 82 studies in total.
Figure 1 shows the distribution of the PCCs for each included primary study; estimates vary significantly across studies. As described in the literature review above, primary studies differ in their sampled populations, measurement methods, and empirical modeling. We investigate the contributions of each of these characteristics to the variability displayed in Figure 1 in the following section.
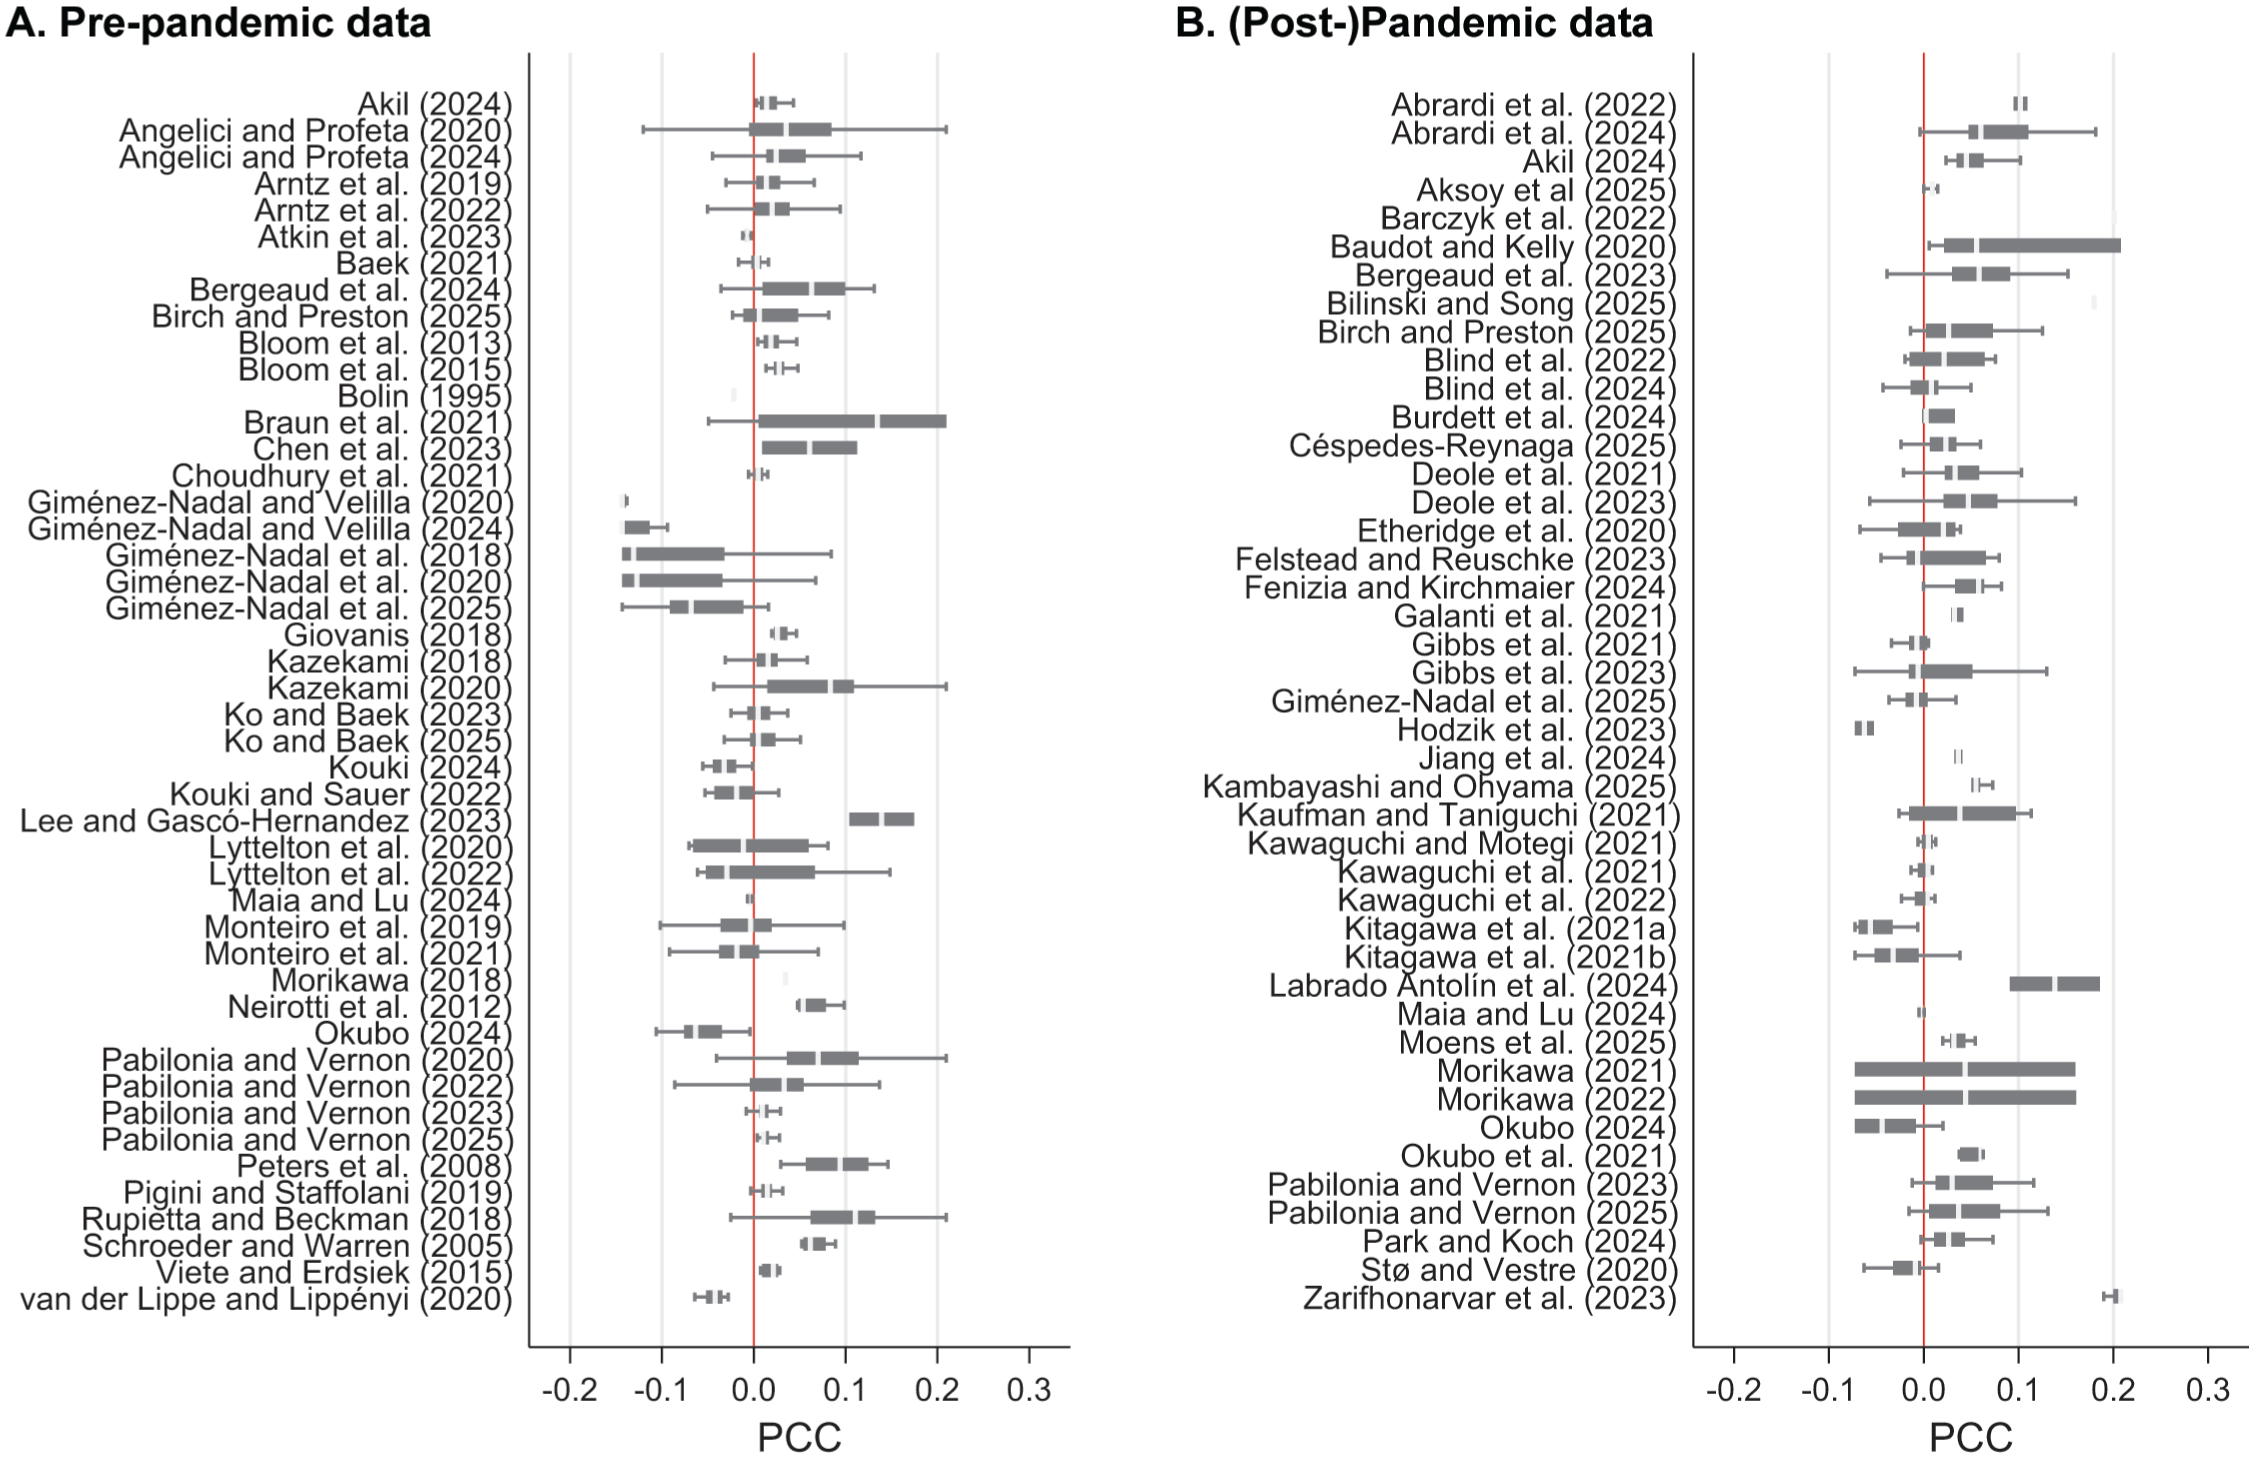
Box Plot of Partial Correlation Coefficients (PCC) by Study
We calculate the average PCC score for each sample and report the results in Table 1 with pre-pandemic data shown in panel A and (post-)pandemic data shown in panel B. We provide an unweighted average that gives each collected estimate the same weight in the calculation. We also provide a weighted average for which the number of estimates collected from each study is used as a weight thus giving each study the same weight in the calculation. The average effects are small in all cases; however, the overall effect of WFH on productivity as shown in the first line of each panel is positive. Given the heterogeneity in the literature shown in Figure 1, the standard errors of the estimates are quite large and the confidence intervals are wide relative to the size of the point estimates. Many of the confidence intervals for specific subpopulations (WFH frequency, sex, parental status, sector, country) overlap with zero and we cannot draw firm conclusions at this stage. In the next section, we employ advanced meta-analysis techniques to address the issue of heterogeneity and derive more precise estimates of the WFH–productivity relationship.
Unconditional Averages
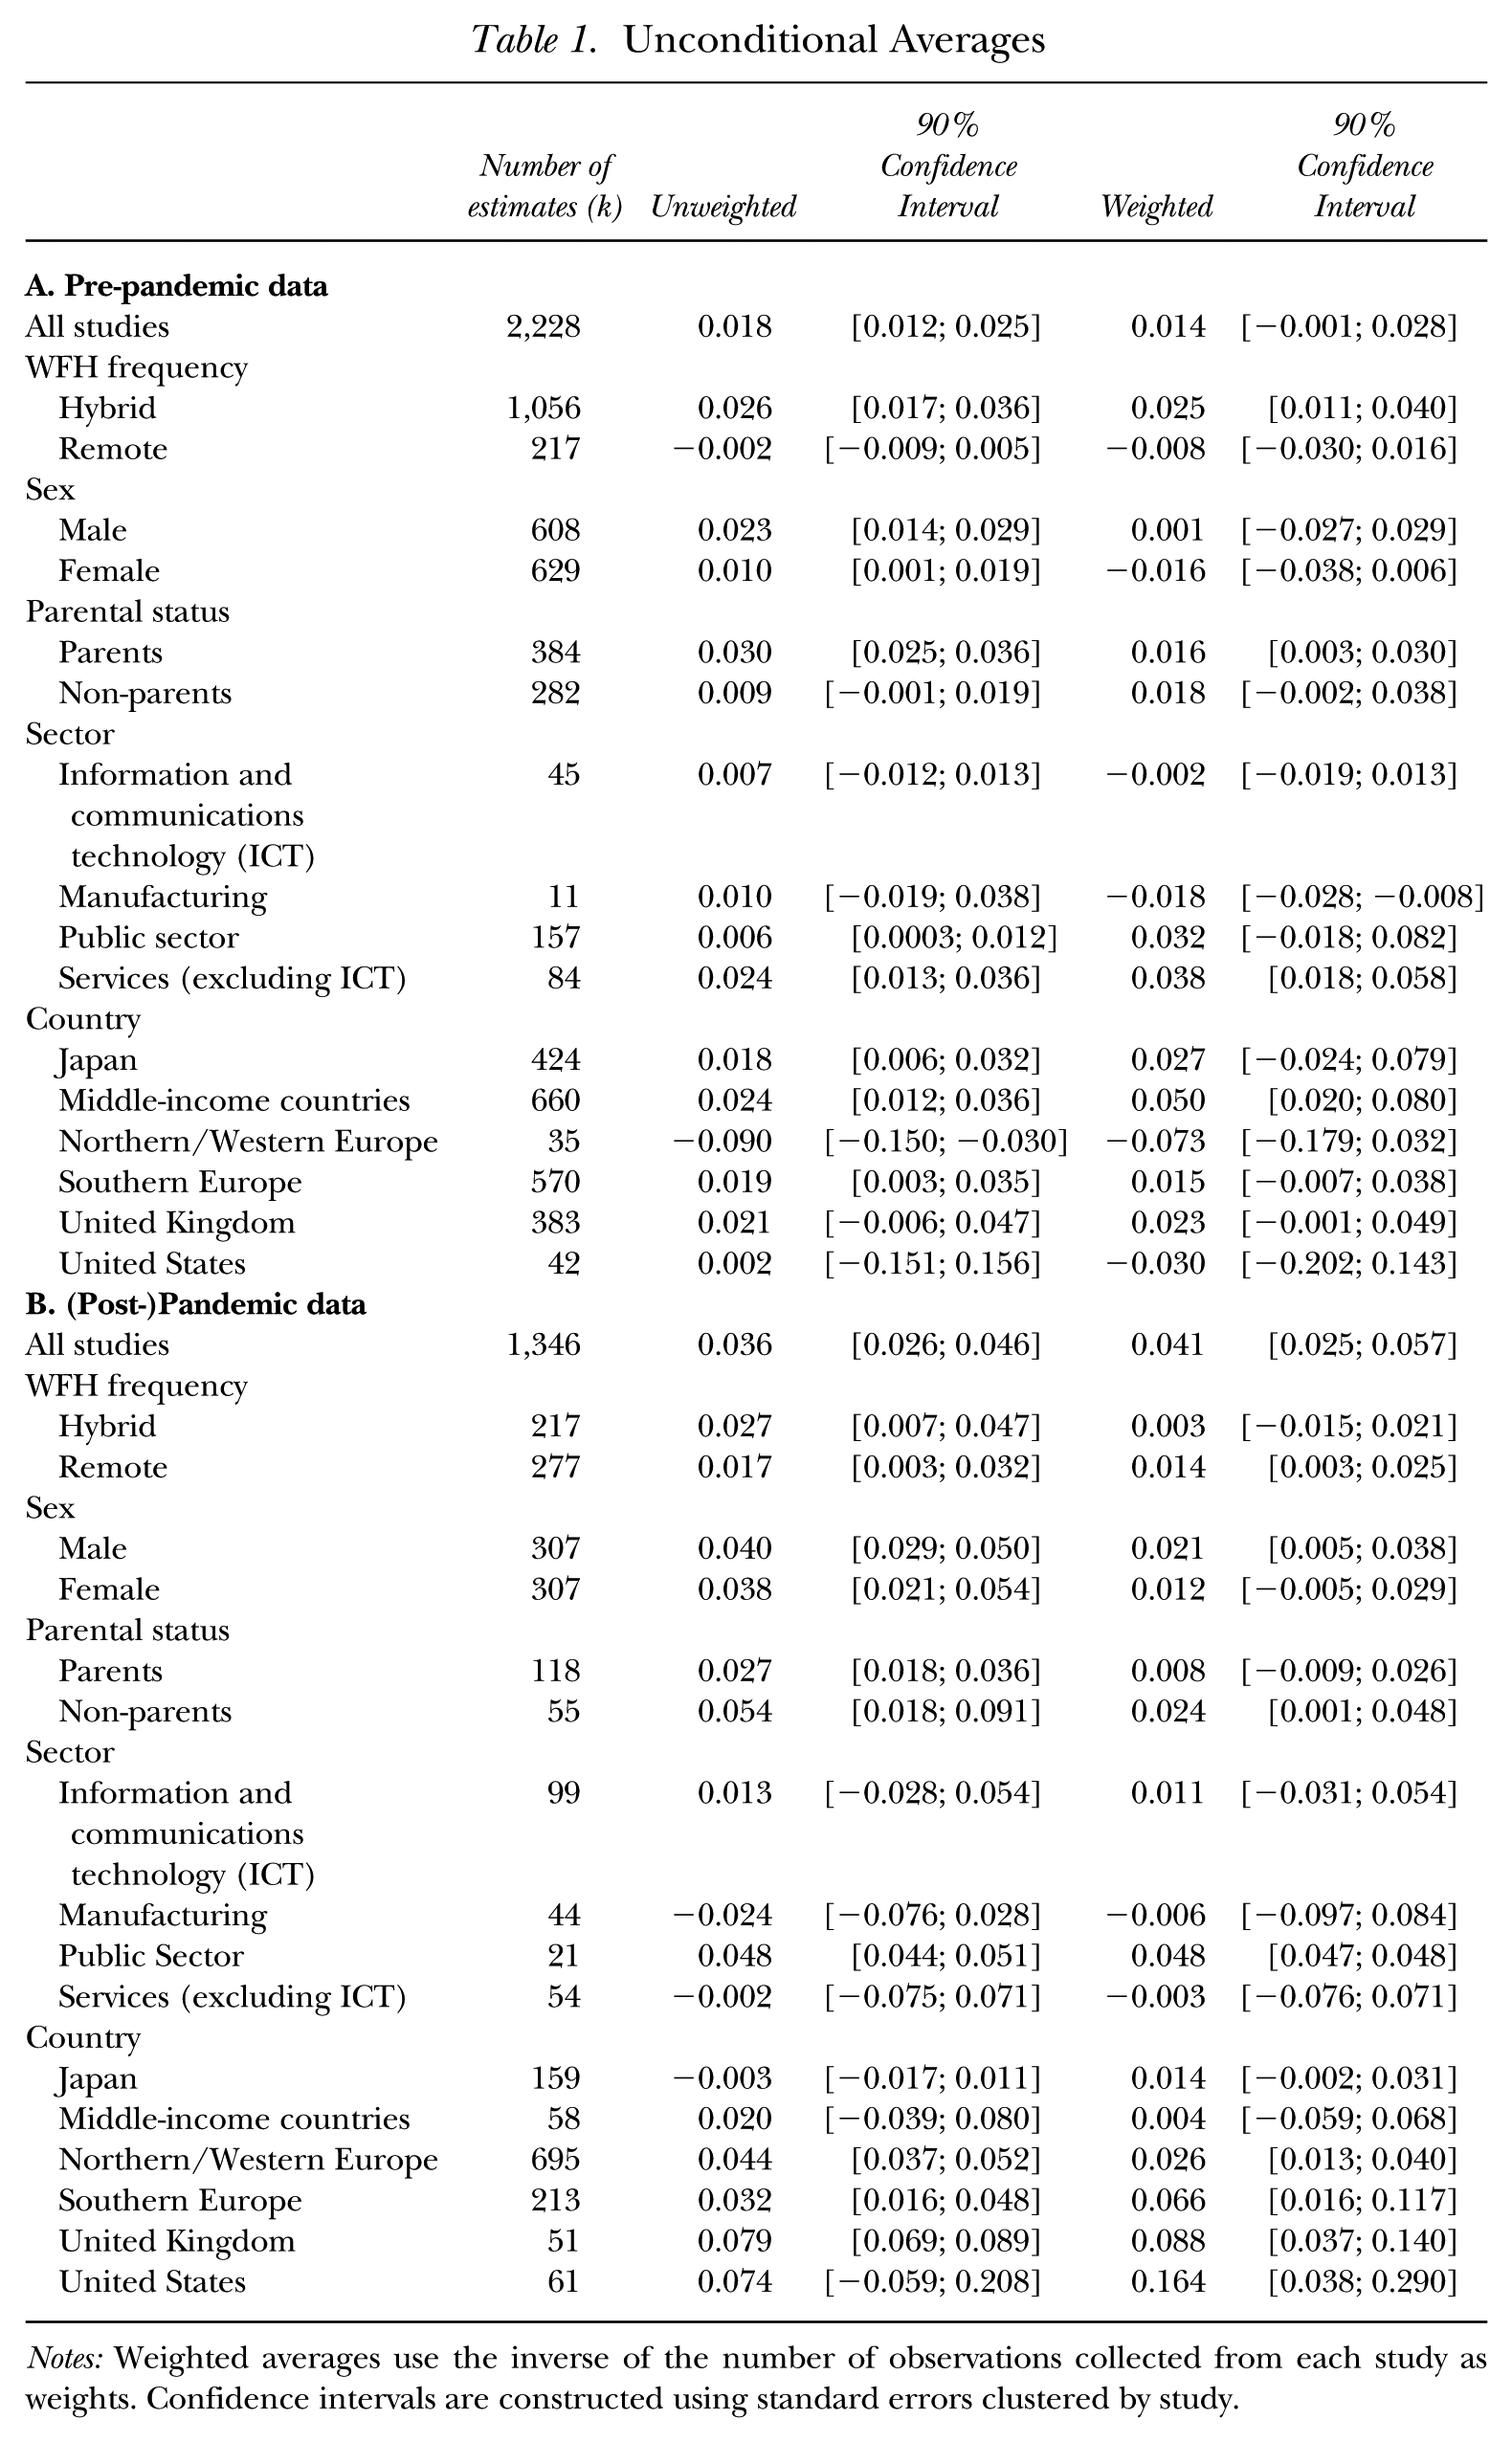
Notes: Weighted averages use the inverse of the number of observations collected from each study as weights. Confidence intervals are constructed using standard errors clustered by study.
Analysis of the Work-from-Home–Productivity Relationship
Publication Bias
Because a meta-analysis relies on observing the results of other scholars’ work to calculate an average effect, when researchers choose not to report findings containing statistically insignificant results, it can lead to a problem known as publication bias. In that case, our inability to observe some estimates could lead to a bias in the calculation of the averages reported in the previous section. In particular, if scholars suppress many negative but insignificant results, it will inflate the average observed value of the relationship. Conversely, suppressing many positive but insignificant results could result in either an underestimation or overestimation of the relationship depending on the magnitude of the effect sizes being excluded.
Publication bias is often assessed using a funnel plot, in which the PCC for each of the k = 1, 2, . . ., K collected estimates is shown on the x-axis and its precision (1/SE) on the y-axis. By the property of a normally distributed sampling distribution, the individual estimates should be clustered around the true population effect. At high levels of precision, that is, low standard errors, the estimates should be tightly clustered. As the precision level drops, that is, the standard error gets larger, the range of the observed estimates should expand. In the absence of publication bias, the plot should therefore appear as a symmetrical inverted funnel, hence the name “funnel plot.” When publication bias is present, though, some observations will be missing and so the plot would appear asymmetric; in particular, observations with small values but high standard errors are more likely to be missing as they would be statistically insignificant and therefore more likely to be suppressed by primary researchers. Figure 2 shows the funnel plot for the pre-pandemic and (post-)pandemic samples. A visual inspection finds each to be slightly asymmetric.
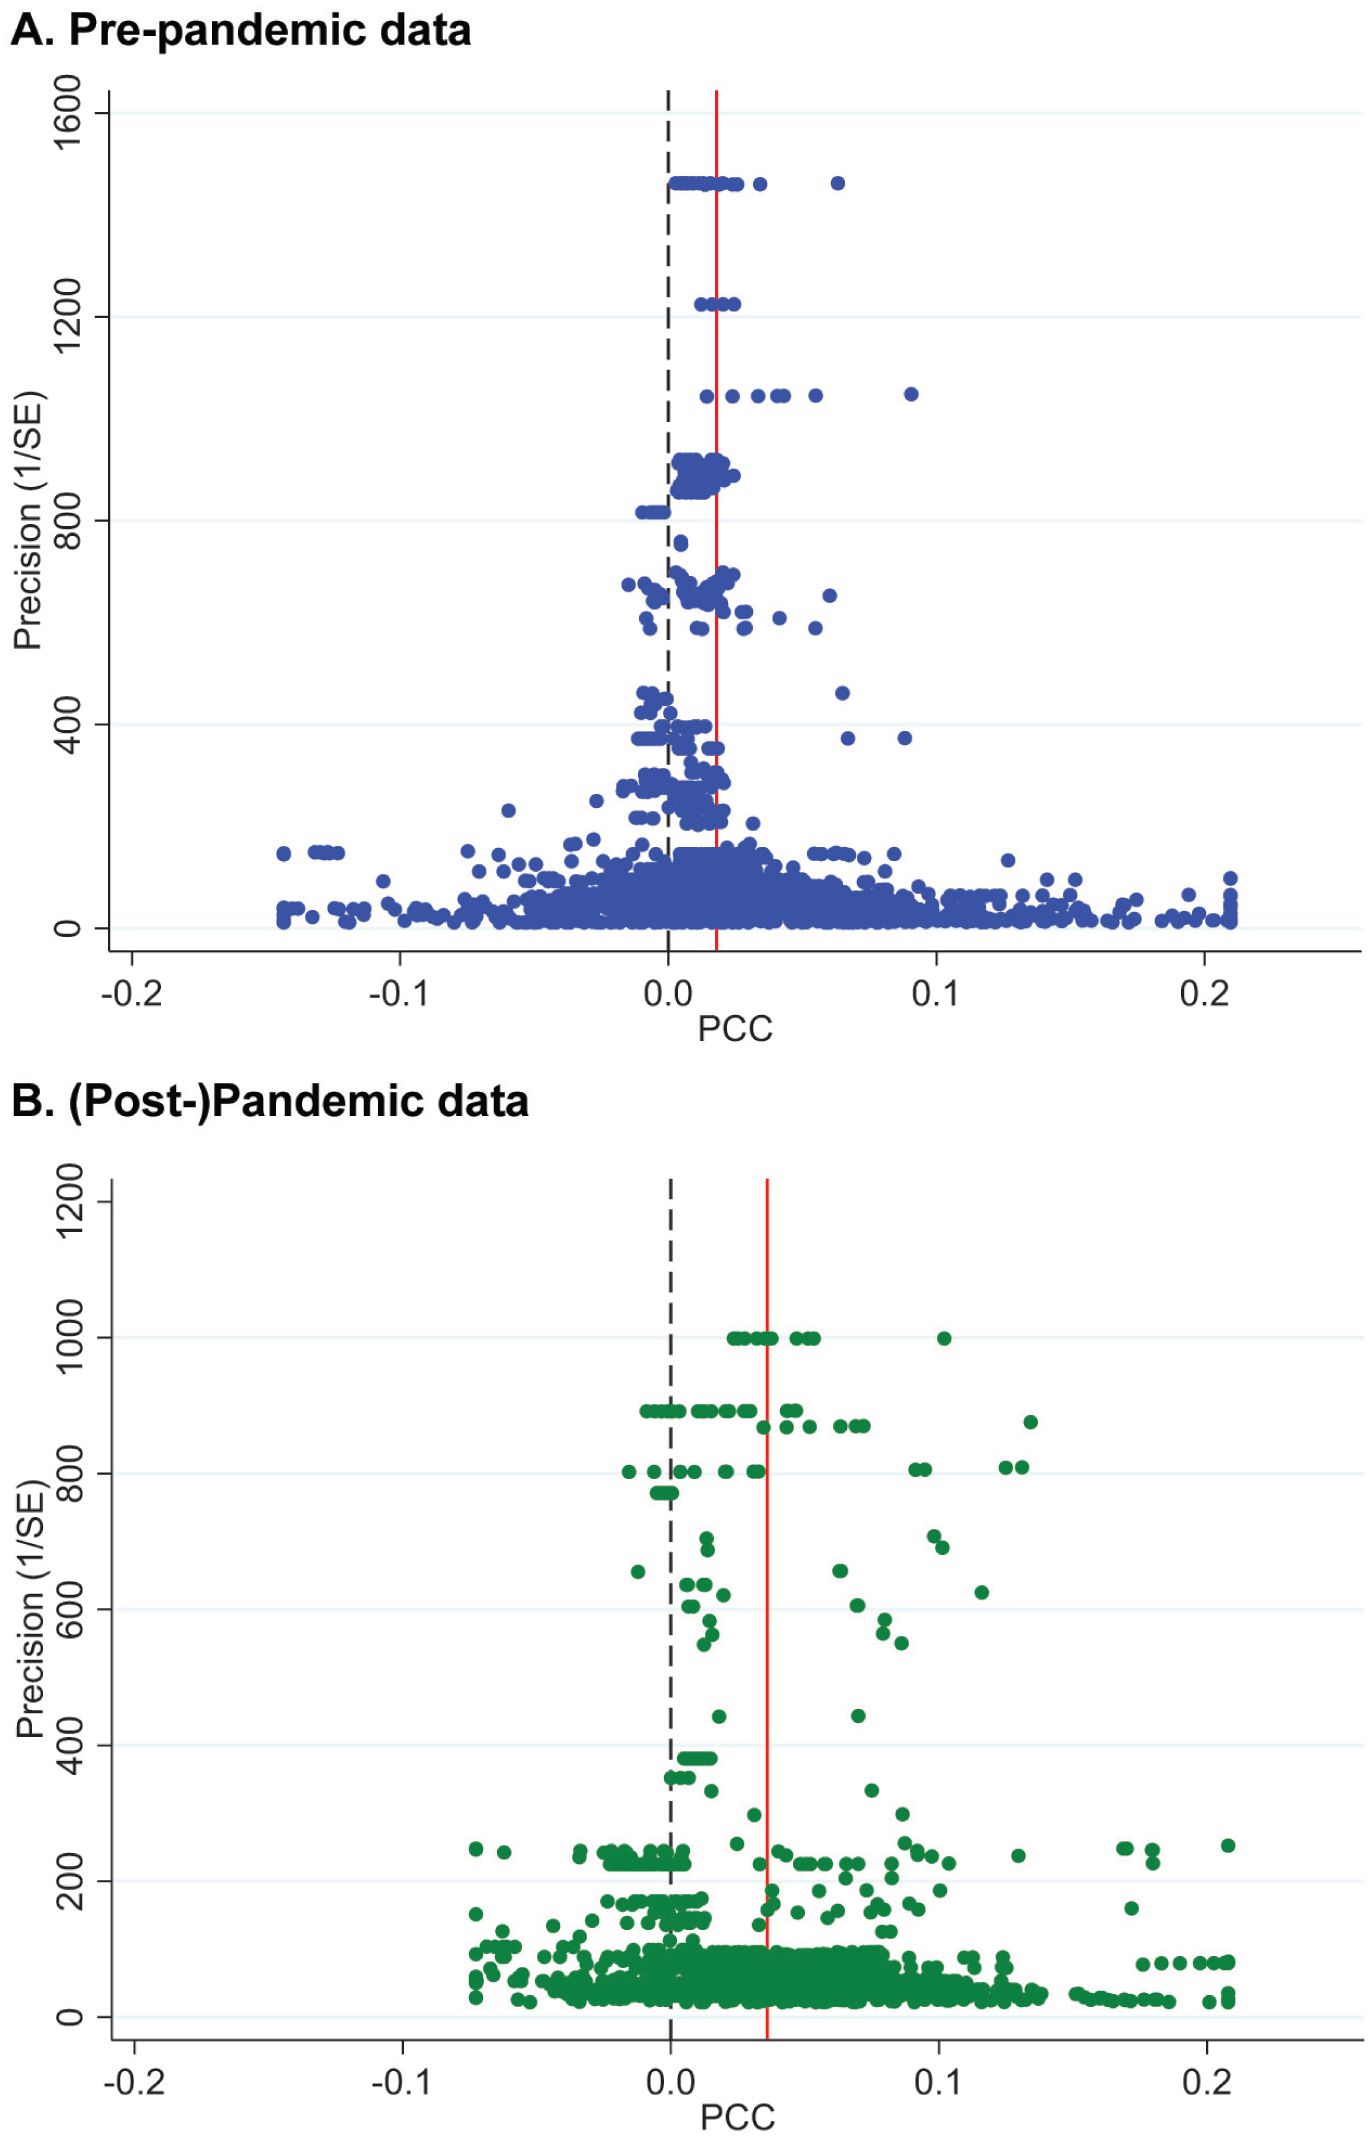
Funnel Plot of Partial Correlation Coefficients (PCC)
We can empirically test for publication bias using the funnel asymmetry test (FAT) (see Stanley and Doucouliagos 2014):

The FAT is the statistical test of the slope coefficient
Equation (6) can also be used to perform the precision effect test (PET). The PET is the statistical test of the intercept term. When the intercept is statistically significant, we can conclude that the WFH–productivity relationship is non-zero. The estimated coefficient for

One issue of concern is the impact of the COVID pandemic on researchers’ interest in the topic of WFH and productivity. It is possible that researchers, referees, and editors in the (post-)pandemic period may have become less selective given the increased desire from the scholarly community for any information on this topic. This concern is not relevant to studies employing (post-)pandemic data since, by definition, they must have been published in the (post-)pandemic period. However, some studies employing pre-pandemic data were published pre-pandemic while others employing pre-pandemic data have been published more recently. Stanley and Doucouliagos (2014) demonstrated that it is possible that a subset of estimates may be subject to a different level of selectivity and publication bias, so we therefore employ Equation (8) to test for a difference in publication bias within the pre-pandemic data based on date of publication:

where the square of the standard error is interacted with an indicator variable identifying studies published in 2020 or later years. A statistically significant
We estimate Equations (7) and (8) using four estimators. First, we employ pooled OLS. Second, we add study fixed-effects which account for any unique characteristics of each study that may affect all estimates drawn from that study; however, a drawback to the fixed-effects estimator is that both the slope and intercept are calculated by demeaning the observations by study, which can lead to an inflated estimate of the publication-bias-adjusted effect. Therefore, third, we employ a between-effects estimator to compare the average from each study rather than the individual estimates from each study. While the fixed-effects estimator controls for each study’s unique characteristics but otherwise gives each collected estimate the same weight in the regression, the between-effects estimator gives each study the same weight in the regression, meaning that primary studies providing larger numbers of observations will not more heavily influence the results of the analysis; the between-effects estimator also does not inflate the publication-bias-adjusted estimate in the way the fixed-effects estimator does. Fourth, we employ the more recently developed meta-analysis instrumental variables estimator (MAIVE) (see Irsova, Bom, Havranek, and Rachinger 2023), which uses the inverse of the square-root of the number of observations from the primary study as an instrument for the standard error of PCC. The MAIVE estimator is designed to reduce the likelihood of spurious results that may occur because precision is estimated within the primary studies and can be affected by the modeling choices of the researchers. By addressing this issue, the MAIVE can provide a less biased estimate of
Estimates of Equation (7) for the pre-pandemic and (post-)pandemic data sets are shown in Table 2, panels A and C, respectively. Estimates of Equation (8) for the pre-pandemic data set are shown in panel B. In all models, standard errors for the coefficients are clustered by study. Three of the four estimators indicate the presence of publication bias in the pre-pandemic data; however, we do not find sufficient evidence to conclude that publication bias differs based on whether the studies themselves were published before or during/after the pandemic. All estimators indicate publication bias in the (post-)pandemic data. Overall, we find that the publication-bias-corrected estimates of the WFH–productivity relationship are positive and statistically significant, but small for both data sets.
Analysis of Publication Bias (PB)
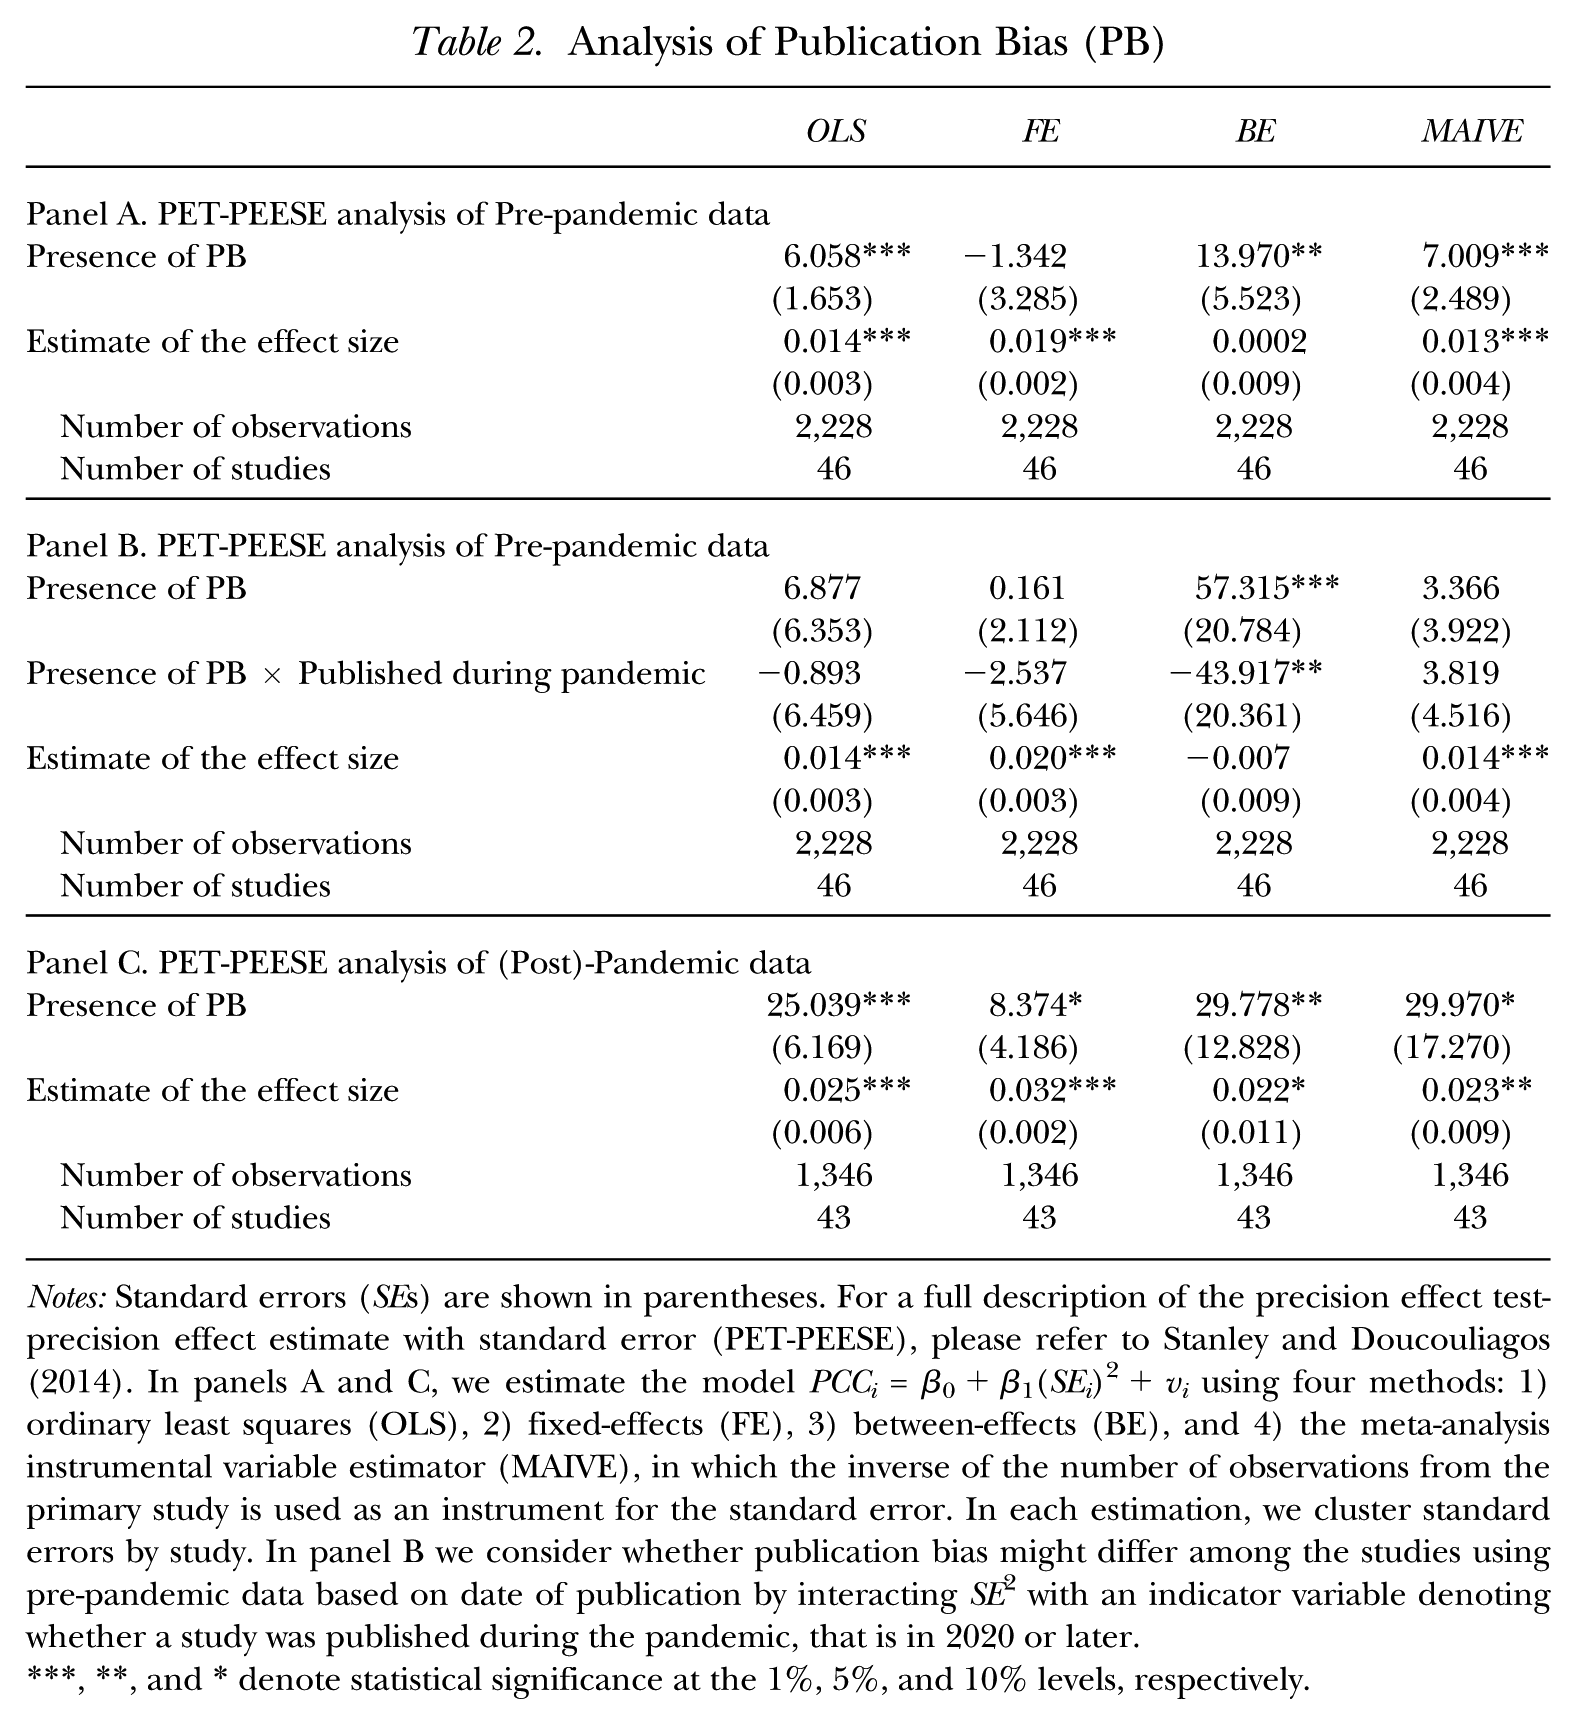
Notes: Standard errors (SEs) are shown in parentheses. For a full description of the precision effect test- precision effect estimate with standard error (PET-PEESE), please refer to Stanley and Doucouliagos (2014). In panels A and C, we estimate the model PCCi = β0+β1(SEi)2+vi using four methods: 1) ordinary least squares (OLS), 2) fixed-effects (FE), 3) between-effects (BE), and 4) the meta-analysis instrumental variable estimator (MAIVE), in which the inverse of the number of observations from the primary study is used as an instrument for the standard error. In each estimation, we cluster standard errors by study. In panel B we consider whether publication bias might differ among the studies using pre-pandemic data based on date of publication by interacting SE2 with an indicator variable denoting whether a study was published during the pandemic, that is in 2020 or later.
, **, and * denote statistical significance at the 1%, 5%, and 10% levels, respectively.
The analysis presented in this section assumes that publication bias can be modeled as a continuous function of the standard error; however, that may not necessarily be the most appropriate specification. In Online Appendix C, we therefore consider alternative methods for estimating a publication-bias-adjusted WFH–productivity relationship under various assumptions about the nature of the bias. The results for these alternative estimates are similar to our main estimates for the pre-pandemic period, and slightly stronger than our main estimates for the (post-)pandemic period. While the techniques reported in this section and in Appendix C adjust for publication bias, they do not account for heterogeneity in study methods, which may also affect the estimation of the relationship. We therefore employ meta-regression analysis to produce estimates of the WFH–productivity relationship that are adjusted for both publication bias and methodological differences.
Meta-Regression Analysis
Although the results of the previous section control for the presence of publication bias, they do not address heterogeneity resulting from differences in study methods. We therefore employ meta-regression analysis (MRA), which is commonly used to identify systematic differences among collected estimates. To address methodological differences across studies, we can modify Equation (8) to include additional factors (Z) that may affect the estimation of the WFH–productivity relationship, as shown in Equation (9):

The inclusion of
A common problem in meta-analysis is that we face uncertainty with respect to the factors that should be included in Z. Simply including all potential factors can lead to multicollinearity problems and does not necessarily produce estimates that are superior to parsimonious specifications. General-to-specific (e.g., Minviel and Latruffe 2016; Bijlsma, Kool, and Non 2018) and alternative-specification strategies (e.g., Neisser 2021) that use trial-and-error to identify an effective model specification have been used to address the model uncertainty problem; however, these strategies may exclude an important variable at some stage. Instead, we employ Bayesian model averaging (BMA) to estimate Equation (9) (see Online Appendix E for a technical description of BMA). Rather than relying on a single model for statistical inference, BMA involves estimating multiple candidate models using various combinations of potential explanatory variables. Each candidate model is assigned a posterior model probability (PMP) indicating the likelihood that it represents the true structural relationship. The PMPs are used as weights to construct a weighted average—or posterior mean—of the estimated coefficients for each variable. The PMPs from each model in which a variable appears are also summed to produce a posterior inclusion probability (PIP) for that variable. A PIP greater than 0.5 indicates that the variable likely belongs in the true structural model.
The derivation of PMPs and corresponding PIPs requires prior assumptions about the distribution of the parameters and candidate models. For the parameters, we employ the commonly used unit-information g-prior (UIP) (see Eicher, Papageorgiou, and Raftery 2011) that offers the prior the same weight as one observation of the data (Kass and Wasserman 1995; Raftery 1995). A commonly used prior assumption for the distribution of the models is the uniform prior, a naïve assumption that all potential models have equal likelihood of being the correct one. We test the uniform assumption in Appendix E, but, for the main results presented below, we adopt a more advanced prior assumption, the dilution prior, that better addresses potential collinearity among the variables, which can lead to model space redundancy in which there are too many similar models composed of correlated variables. Unlike the uniform prior that gives all potential models equal weight, the dilution prior re-weights the PMPs proportionately to the determinant of the correlation matrix of the included variables (George 2010). For candidate models with little collinearity among included variables, the determinant is near 1 and the PMP changes very little. However, for candidate models with high collinearity, the determinant is closer to 0 and the individual model is down weighted. Because the calculation of the PMPs and corresponding PIPs is influenced by our chosen prior assumptions, we present robustness checks employing different priors in Appendix E.
To correct for publication bias, we include the square of the standard error of the PCC in all candidate models. In addition, we consider 33 candidate variables (34 including the SE–publication date interaction for the pre-pandemic data) that may affect the WFH–productivity relationship. These include differences in sampled populations such as frequency of working from home, sex, parental status, sector, and country; and methodological differences such as the measures of productivity and WFH, study design, and characteristics of the data collection process. We also include the logarithm of the h-index of the publication in which the study appears to assess whether results differ between high-quality outlets, low-quality outlets, and working papers, and thus whether referees and editors at higher ranked journals are more selective. Finally, we include the year the study’s data were collected to examine whether the relationship has been strengthening over time as WFH technology has improved. Table A.3 in Online Appendix D provides definitions and summary statistics for each of the variables considered. We have 233 = 8.6 billion possible model combinations to consider. To simplify the calculations, we use a Markov chain Monte Carlo (MCMC) algorithm to identify the best candidate models, as in Bajzik, Havranek, Irsova, and Scharz (2020) and Zigraiova, Havranek, Irsova, and Novak (2021). We calculate 5 million potential models and use the best 10,000 to construct averages for each variable’s coefficient and PIP.
Figure 3 provides an overview of the model space employed in BMA. Panel A presents results for the pre-pandemic data and panel B presents results for the (post-)pandemic data. Each column represents one candidate model ordered by PMP. We show
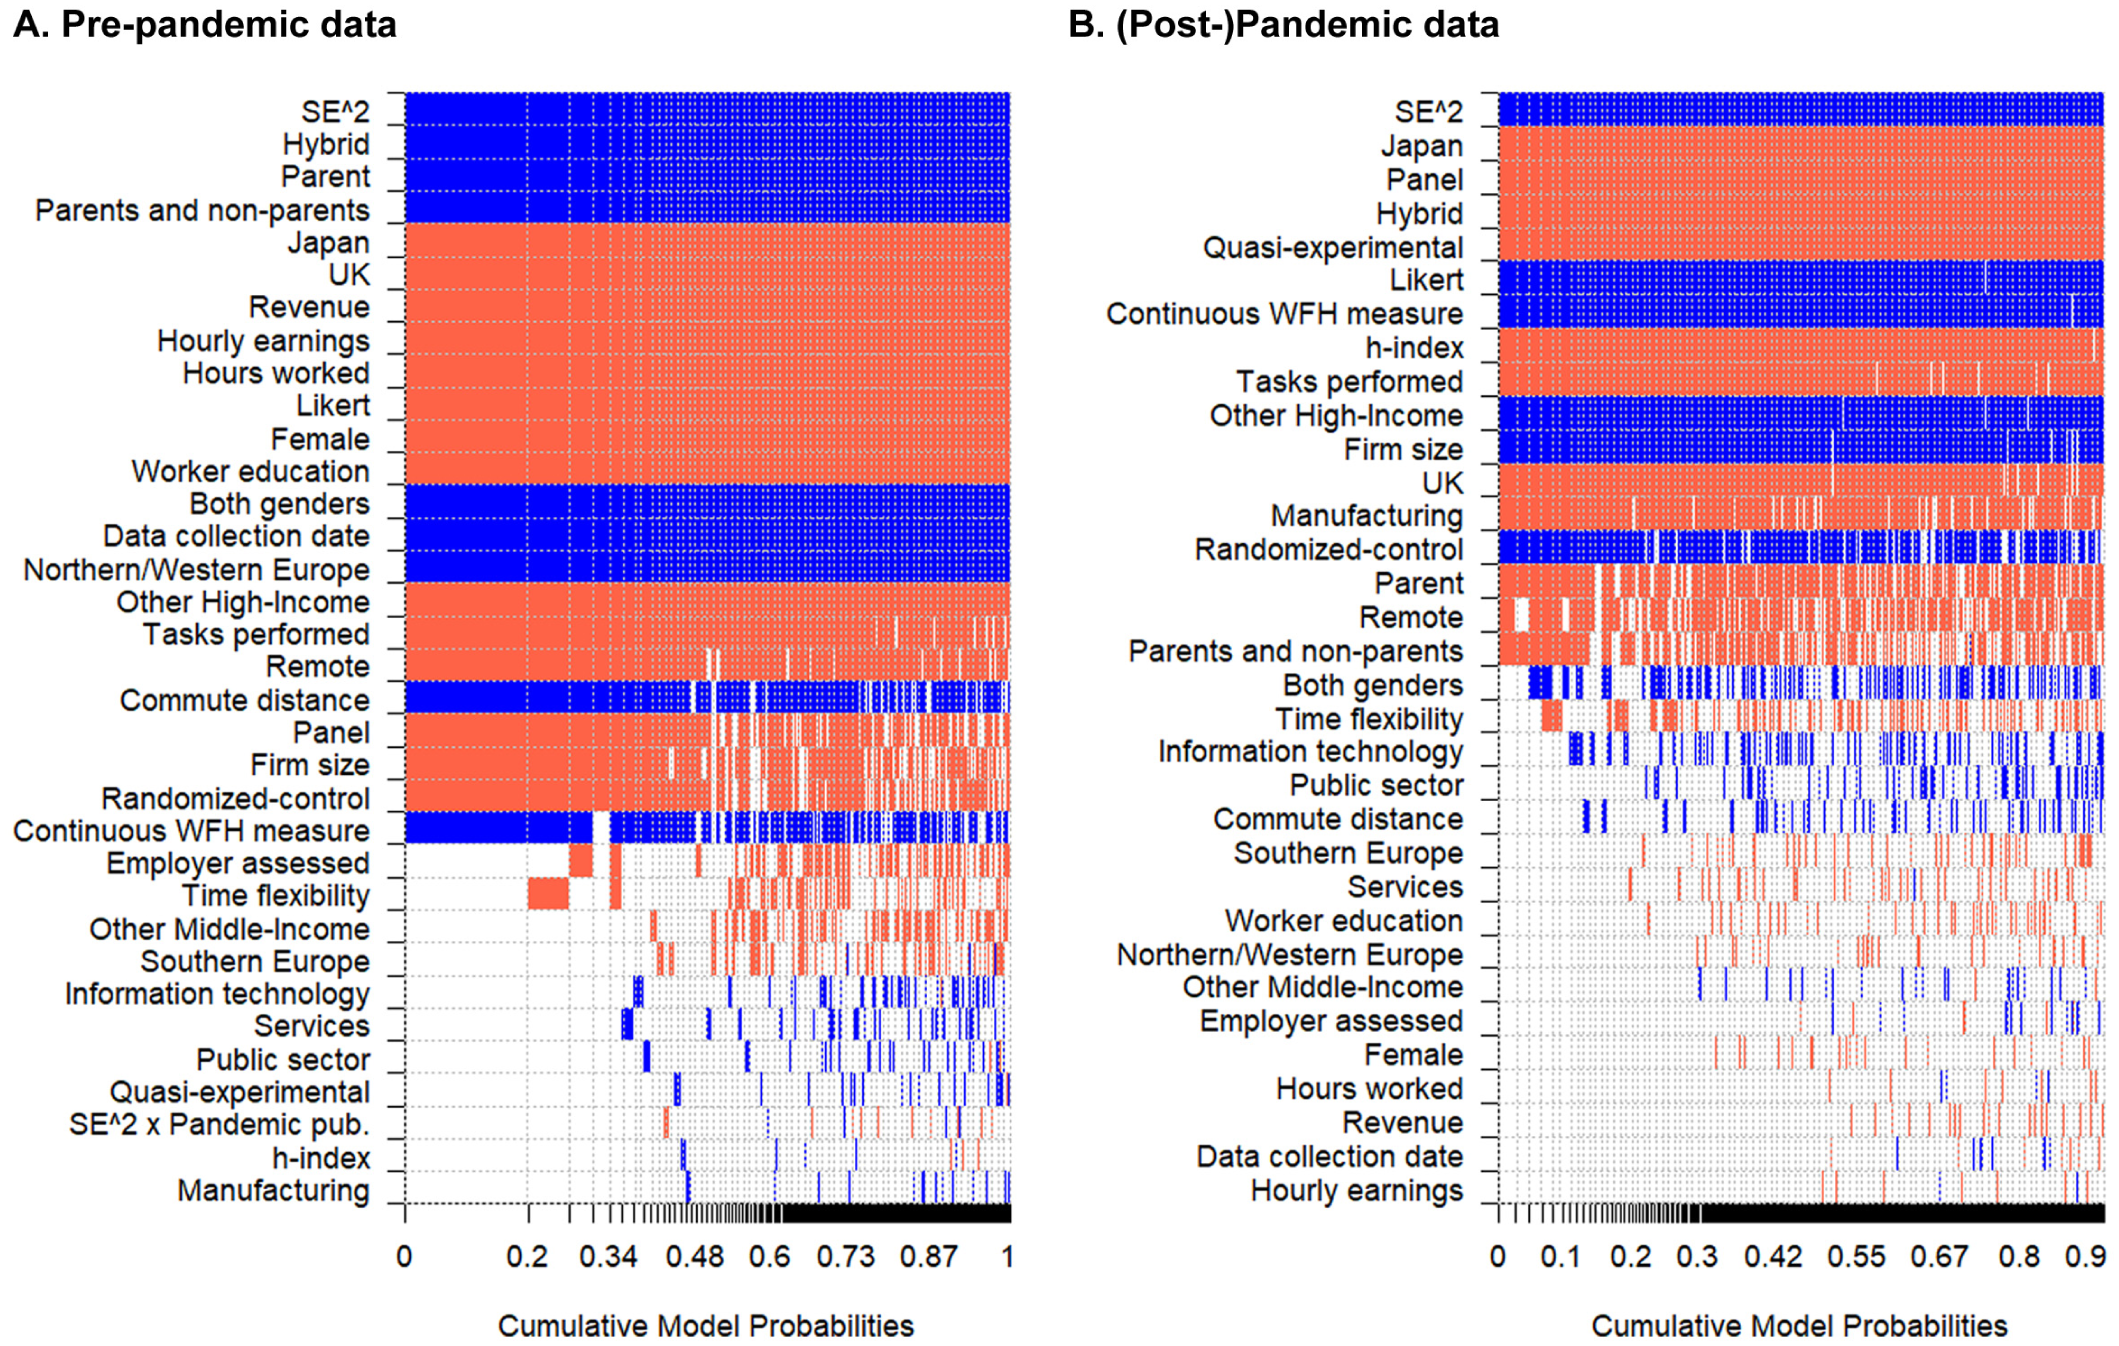
Model Inclusion in Bayesian Model Averaging for the WFH–Productivity Relationship
The BMA results are reported in Table 3 with panel A displaying results for the pre-pandemic data and panel B displaying results for the (post-)pandemic data. The first, second, and third columns of each panel show the posterior mean, posterior standard deviation, and PIP values, respectively. For the pre-pandemic data, BMA identifies 22 of the candidate variables as having PIPs greater than 0.5. We therefore construct a single model containing
Analysis of Working from Home (WFH) and Productivity
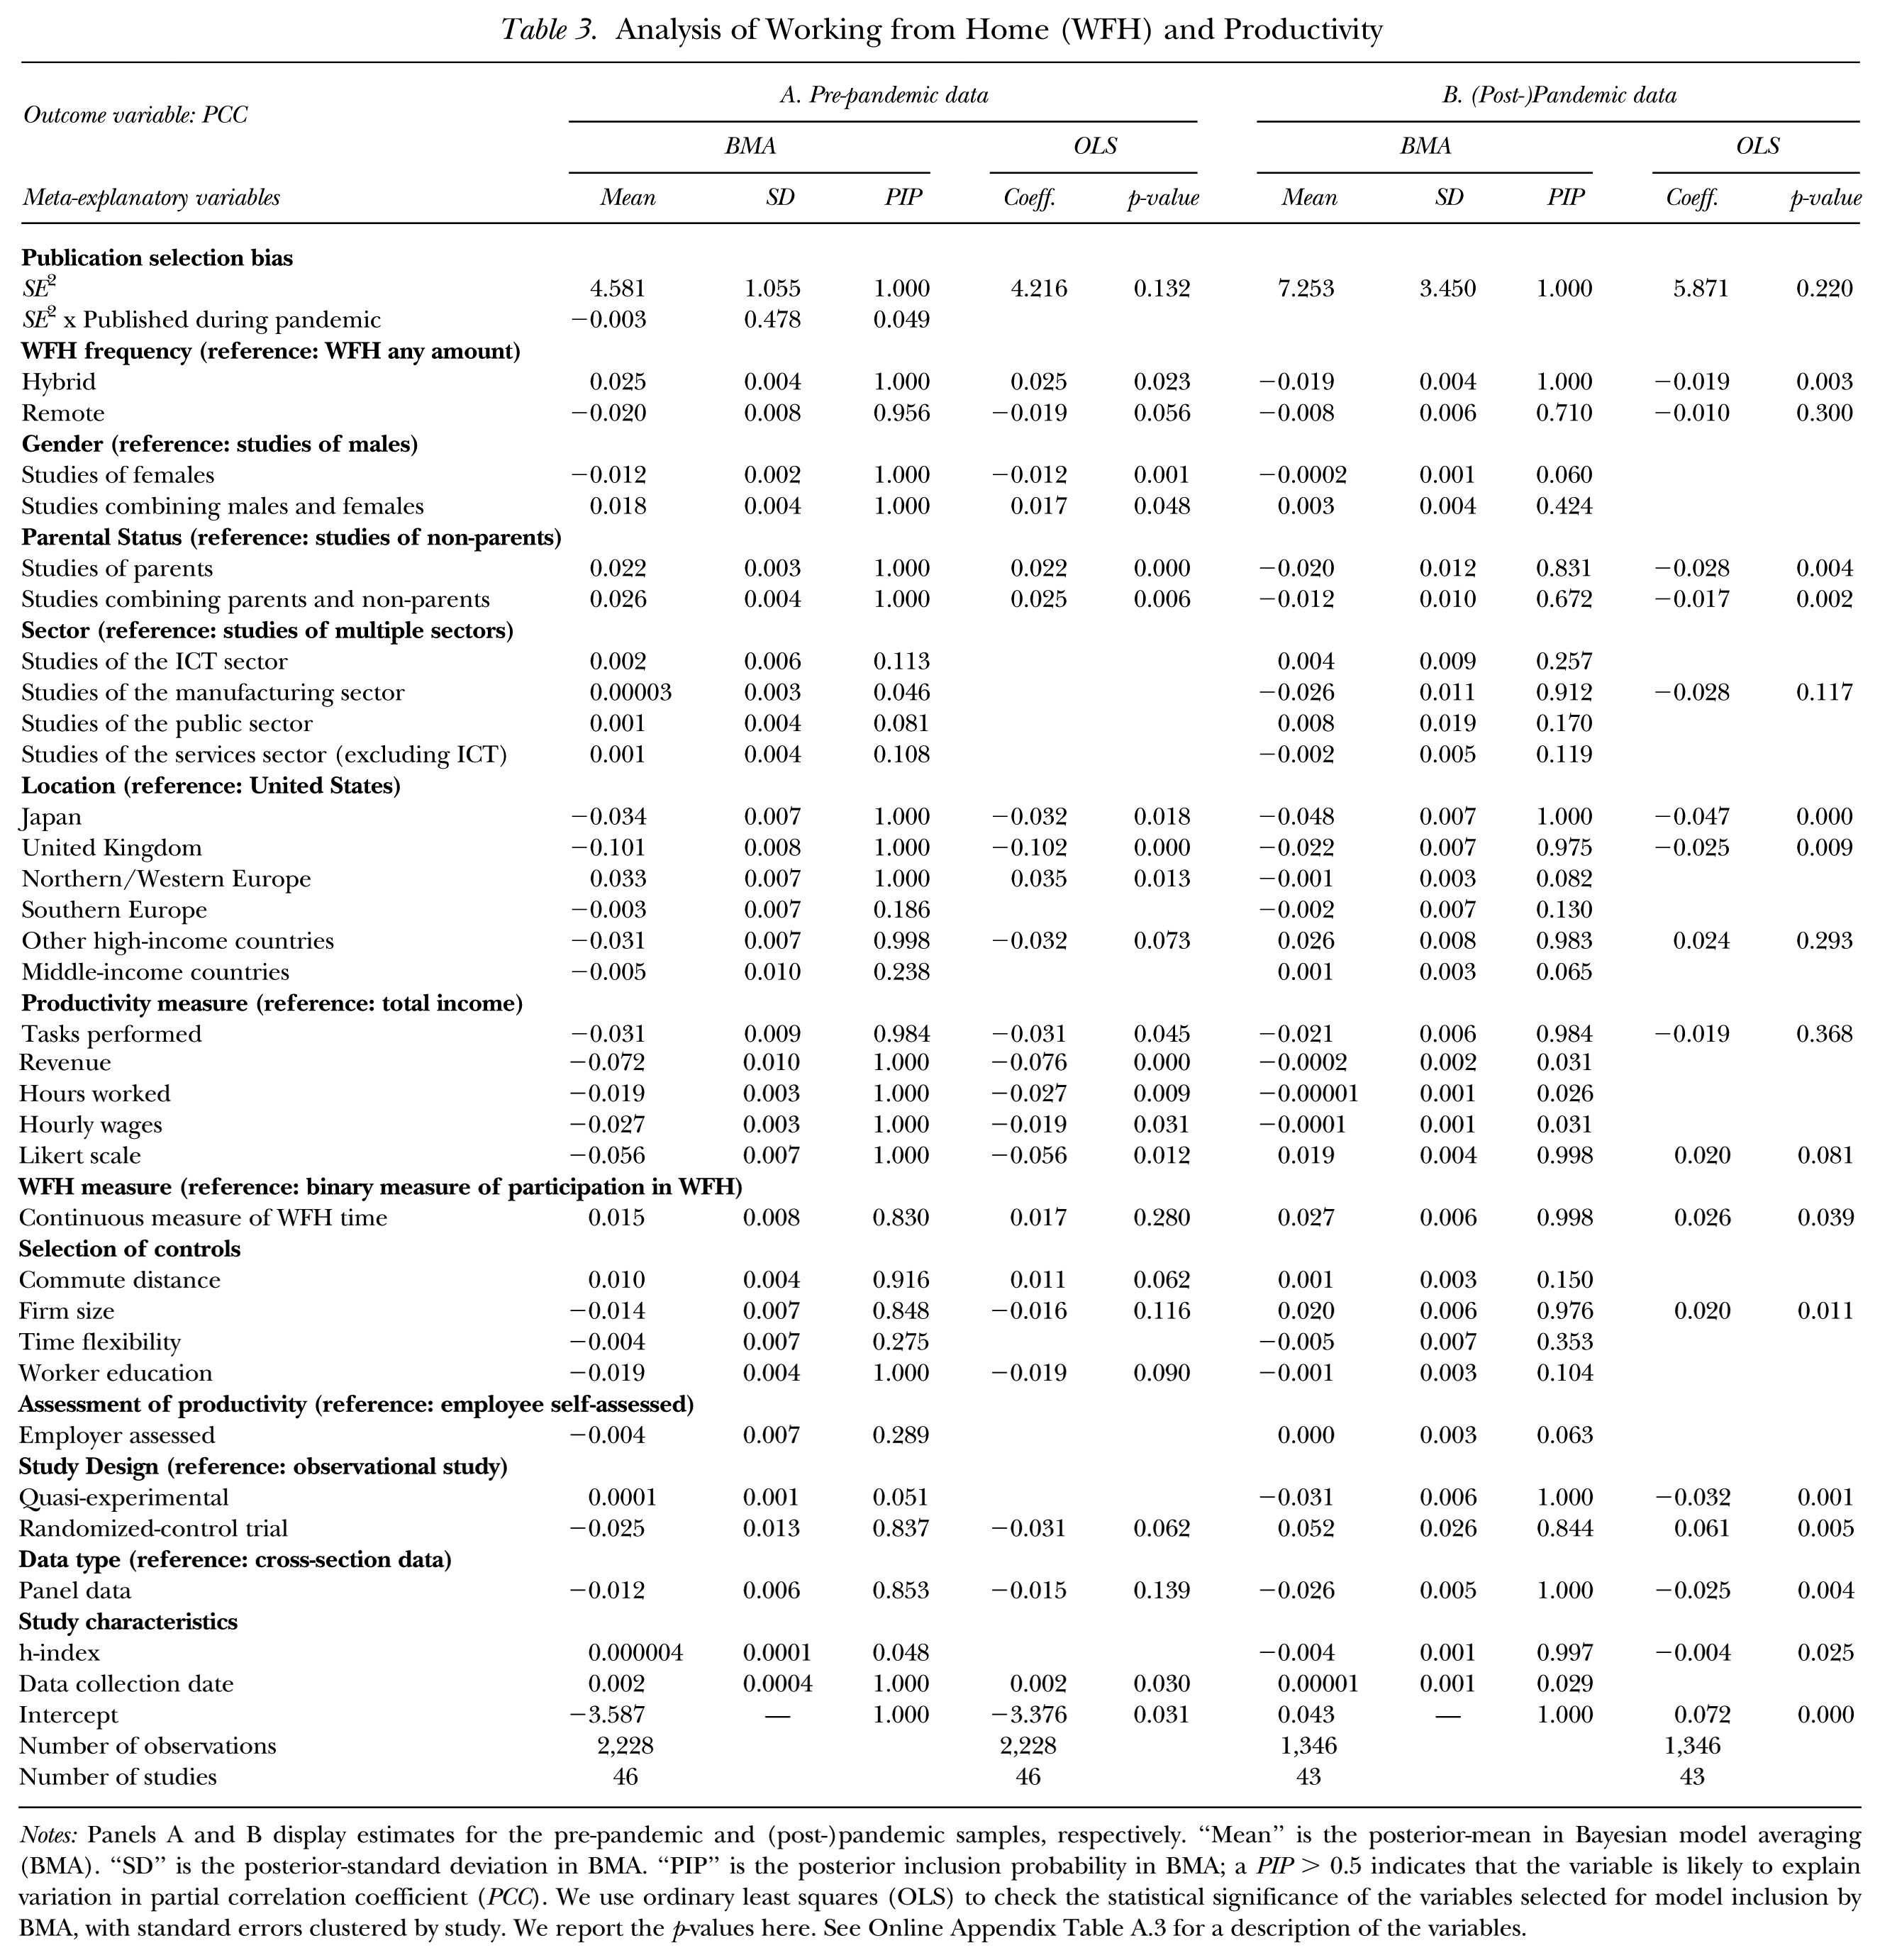
Notes: Panels A and B display estimates for the pre-pandemic and (post-)pandemic samples, respectively. “Mean” is the posterior-mean in Bayesian model averaging (BMA). “SD” is the posterior-standard deviation in BMA. “PIP” is the posterior inclusion probability in BMA; a PIP > 0.5 indicates that the variable is likely to explain variation in partial correlation coefficient (PCC). We use ordinary least squares (OLS) to check the statistical significance of the variables selected for model inclusion by BMA, with standard errors clustered by study. We report the p-values here. See Online Appendix Table A.3 for a description of the variables.
We draw the following conclusions from Table 3. First, we identify differences in the WFH–productivity relationship between studies that group remote and hybrid teleworkers together and studies that consider remote and hybrid teleworkers separately. The result is similar to the findings of Giménez-Nadal and Velilla (2024) and Kazekami (2018), who identified productivity differences based on time spent teleworking. Our finding indicates that future researchers should separate remote employees from those in hybrid arrangements when estimating the WFH–productivity relationship.
We also find that the relationship differs between males and females in the pre-pandemic data. This result, which is similar to the findings of Giménez-Nadal et al. (2020) and Pabilonia and Vernon (2022), suggests that researchers should separate males from females when estimating the relationship. Nevertheless, we do not find evidence of a sex difference in the (post-)pandemic data, suggesting either that the differential has dissipated or that the uniqueness of the pandemic experience caused a temporary leveling of the productivity effect between males and females.
In the pre-pandemic data, we find that the relationship is higher for parents compared to non-parents. This finding is similar to Angelici and Profeta (2020) and Pabilonia and Vernon (2022), who argued that WFH allows parents to better balance their work and childcare responsibilities, which provides them with an extra productivity boost that non-parents do not receive. This result flips in the pandemic data, however, where non-parents are shown to experience larger productivity gains. The pandemic-era finding is not surprising, perhaps, as lockdowns also led to school closures, so many parents had to simultaneously telework and mind their children, impeding their productivity (Deole et al. 2023). Therefore, future researchers should separate parents from non-parents when estimating the WFH–productivity relationship.
In the pre-pandemic data, we do not find any evidence that the relationship differs by sector as the PIPs for all sector variables are well below the 50% threshold; however, we do find that studies of the manufacturing sector during the pandemic produced lower productivity estimates compared to multi-sector studies. Both Kazekami (2018) and Monteiro et al. (2021) also reported differences across sectors; however, given the limited attempts in the literature thus far to compare sectors and, therefore, the limited number of observations we have for each sector, more investigation of sectoral differences is needed.
Furthermore, we find differences in the size of the relationship across geographic regions. In the pre-pandemic data, studies of Northern/Western Europe report PCCs higher than studies of the United States. We do not identify statistical differences between PCCs from studies of Southern Europe or Middle-income countries and studies of the United States. By contrast, studies of Japan and the United Kingdom report smaller PCCs compared to the United States. In the (post-)pandemic data, studies of Japan and the United Kingdom continue to report lower PCCs than studies of the United States, whereas studies of Northern/Western Europe, Southern Europe, and Middle-income countries are not statistically different from the United States.
In addition to differences by subpopulations, we also find that differences in study methods affect the estimation of the WFH–productivity relationship. In the pre-pandemic data, studies employing total income report higher productivity gains than other measures. By contrast, among studies employing (post-)pandemic data, the Likert measure produces the highest PCCs. BMA does not indicate a difference between studies employing total income, studies employing hours worked, and studies employing hourly earnings. Studies employing tasks performed show a lower average PCC than studies employing total income, but the difference is not statistically significant. Overall, these results indicate that measurement method does impact the estimation of the relationship, so future researchers should attempt to employ multiple measures to check the robustness of their conclusions, as some scholars (e.g., Arntz et al. 2022; Kawaguchi et al. 2022) have done. We find that estimates from studies using a continuous measure of time spent working from home produce larger PCCs than those employing the binary measure, but the difference is only statistically significant in the (post-)pandemic data. In the pre-pandemic data, studies controlling for commute distance produce stronger PCCs than studies omitting this control, while studies controlling for an employee’s education level produce weaker PCCs than studies excluding this variable. In the (post-)pandemic data, studies controlling for firm size produce stronger PCCs than studies ignoring firm size. Therefore, we can conclude that omitting commute distance, firm size, and employee education level can cause omitted variable bias and we recommend future researchers control for all three in model specifications.
We do not find that studies using employer-provided data produce results that differ from studies using employee-provided data, suggesting that both employers and employees perceive productivity the same way. However, we do find some statistical differences between observational, quasi-experimental, and randomized-controlled trial studies. The results indicate that there likely is some selection bias inherent in observational studies, and therefore, WFH should be treated as endogenous. For the pre-pandemic data, we do not find a statistical difference between the use of cross-sectional data and the use of panel data. However, for the (post-)pandemic data, the use of panel data on average produces smaller PCCs compared to the use of cross-sectional data. Because the (post-)pandemic panel data in our sample followed employees through both lockdown and lockdown-relaxation periods, we cannot rule out the possibility that medium-term external factors related to the pandemic were causing productivity to vary, thus weakening the relationship between WFH and productivity in panel studies. We recommend that future research be conducted specifically using post-pandemic panel data to investigate the long-run effect in a non-pandemic setting.
Last, we do not find evidence that studies published in higher ranked journals provide results that differ from those published in lower ranked journals or from working papers in the pre-pandemic data. In the (post-)pandemic sample, however, higher ranked journals have, on average, published weaker results. This finding indicates that referees and editors at higher ranked journals have not been more selective in terms of the estimates they choose to accept when evaluating studies employing pre-pandemic data, which, as we previously showed in Table 1, have typically demonstrated smaller effects. But, referees and editors at higher ranked journals appear more skeptical of (post-)pandemic data demonstrating larger effects, perhaps because these larger effects are not consistent with the previous pre-pandemic literature. In the pre-pandemic data, we demonstrate that the relationship strengthens each year, likely because of technology improvements. While we do not find statistical evidence that this trend continues in the (post-)pandemic data, that may simply be the result of having too few years post-pandemic to ascertain a meaningful difference over time.
Estimating the Work-from-Home–Productivity Relationship
In the previous sections, we have identified both publication bias and methodological differences as factors influencing the outcomes reported in primary studies. Using the meta-regression results, we can correct for these factors when estimating the WFH–productivity relationship. To do so, we follow the example of Elminejad, Havranek, Horvath, and Irsova (2023) and use fitted values from the OLS estimations reported in Table 3 to construct conditional point estimates of the WFH–productivity relationship, shown in Table 4, corrected for both publication bias and the use of best practices in research design. Fitted values are calculated by substituting the following values for each of the explanatory variables into the equations from Table 3. First, to correct for publication bias, we use SE = 0, that is, perfect precision. Second, for individual effects (i.e., WFH frequency, sex, and so on) we substitute 1 for the characteristic of interest and 0 for other characteristics from the same variable group. Third, we assume that estimates are collected using a continuous measure of time spent teleworking and set that variable equal to 1. Fourth, we calculate the estimates assuming the use of either a randomized-controlled trial or a quasi-experimental design to address endogeneity. Fifth, we set the relevant control variables identified by BMA as potentially leading to omitted variable bias (that is, commute distance, firm size, worker education) to 1 to avoid that bias. Sixth, because we have demonstrated that the WFH–productivity relationship strengthened over time in the pre-pandemic data, we calculate fitted values for the pre-pandemic data for the year 2019, the final year in that data series. For all other variables, we substitute their means, providing the meta-average, corrected for publication bias and best methodological practice, with results reported in Table 4.
Conditional Point Estimates
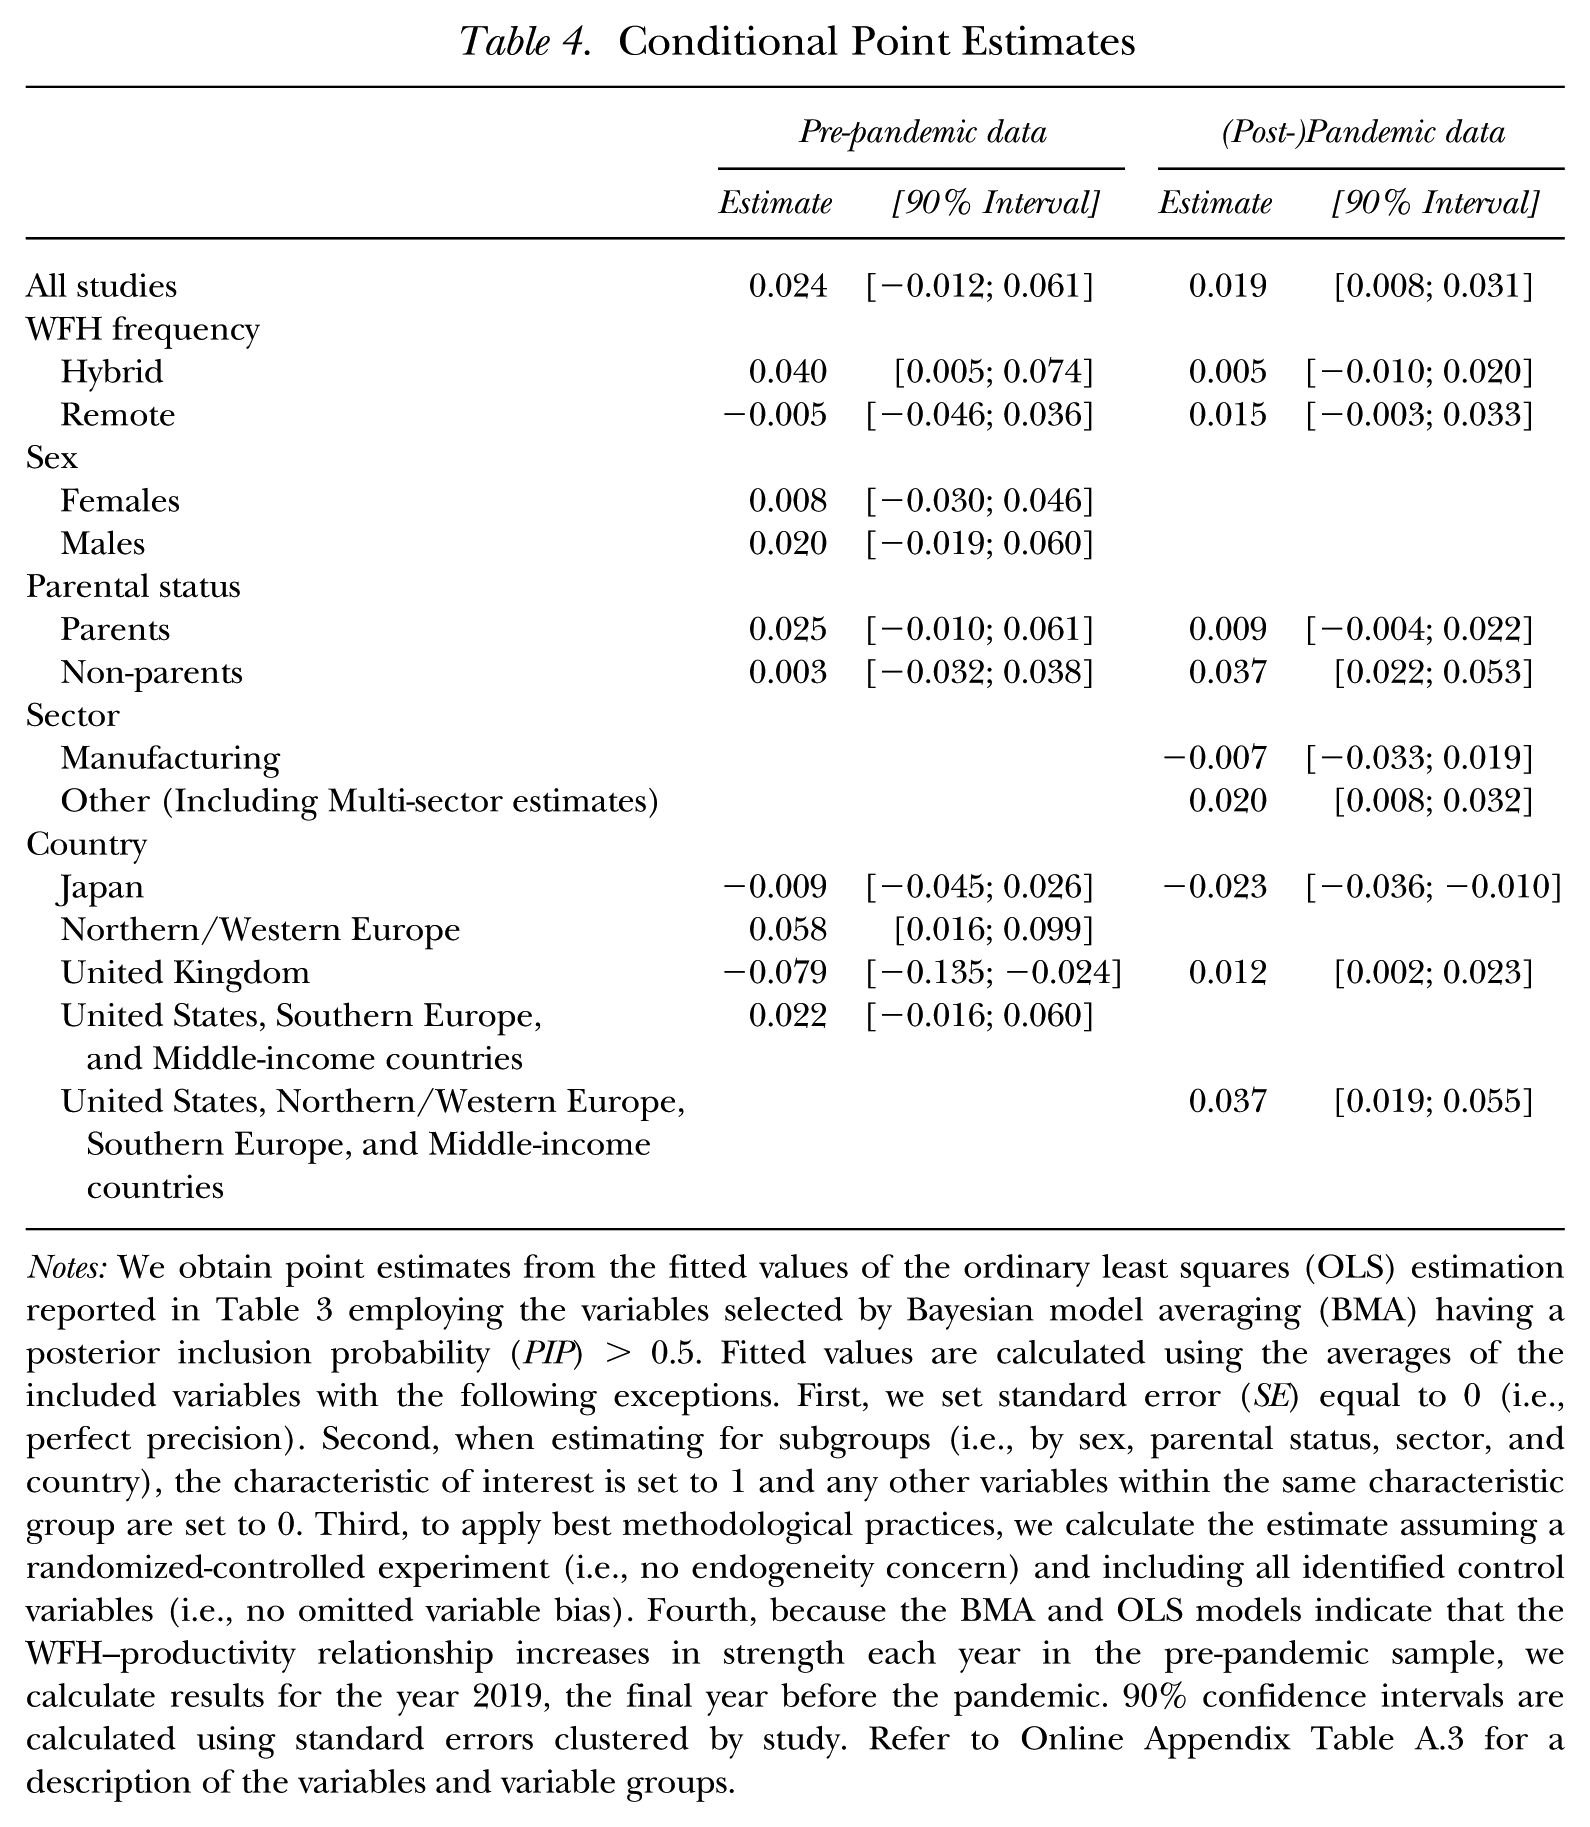
Notes: We obtain point estimates from the fitted values of the ordinary least squares (OLS) estimation reported in Table 3 employing the variables selected by Bayesian model averaging (BMA) having a posterior inclusion probability (PIP) > 0.5. Fitted values are calculated using the averages of the included variables with the following exceptions. First, we set standard error (SE) equal to 0 (i.e., perfect precision). Second, when estimating for subgroups (i.e., by sex, parental status, sector, and country), the characteristic of interest is set to 1 and any other variables within the same characteristic group are set to 0. Third, to apply best methodological practices, we calculate the estimate assuming a randomized-controlled experiment (i.e., no endogeneity concern) and including all identified control variables (i.e., no omitted variable bias). Fourth, because the BMA and OLS models indicate that the WFH–productivity relationship increases in strength each year in the pre-pandemic sample, we calculate results for the year 2019, the final year before the pandemic. 90% confidence intervals are calculated using standard errors clustered by study. Refer to Online Appendix Table A.3 for a description of the variables and variable groups.
Based on these findings, we can draw the following conclusions. The overall effect of WFH on productivity was not statistically significant in the pre-pandemic period, but is positive and statistically significant, though economically small, in the (post-)pandemic period. Nevertheless, we find that pre-pandemic productivity gains were experienced by hybrid teleworkers; those who worked remotely before the pandemic had productivity levels that were at best the same and possibly lower than those who never teleworked. This finding complements the work of Giménez-Nadal and Velilla (2024) and Kazekami (2018) who found that hybrid teleworkers were more productive than remote teleworkers. During and after the pandemic, we estimate positive coefficients for both hybrid and remote workers, but the wide confidence intervals mean the results are not statistically significant, likely due to having too few observations and thus low precision.
Similarly, when examining teleworking parents and non-parents pre-pandemic, we have large confidence intervals and do not have statistically significant results. Nevertheless, during the pandemic, non-parents saw the largest productivity increases.
While we do not identify sectoral differences in the pre-pandemic sample, we find that productivity gains in the (post-)pandemic sample were concentrated in sectors other than manufacturing; manufacturing, by contrast, did not see a statistically significant difference in productivity between teleworkers and non-teleworkers.
Prior to the pandemic, the WFH–productivity relationship was strongest in Northern/Western Europe; not statistically significant in the United States, Southern Europe, Japan, and Middle-income countries; and actually negative in the United Kingdom. By contrast, in the (post-)pandemic period, teleworking has improved productivity in most places, although the gains in the United Kingdom have been smaller than elsewhere, and in Japan productivity among teleworkers has actually been lower than among office workers.
Overall, the results indicate that the WFH–productivity relationship is positive, at least in some contexts, but the effect is heterogenous across workers. Our analysis has relied on the use of the partial correlation coefficient as a standardization measure to combine the results of heterogeneous primary studies. However, a main drawback of the PCC is that it only indicates the strength of the relationship between the outcome and explanatory variables and does not provide an easily interpretable value for the size of the effect. Therefore, to provide a more useful economic interpretation, and to investigate the actual impact of WFH, in the next section, we meta-analyze subsets of our two samples in which the productivity and WFH measures employed are the same across estimates.
Estimating the Impact of WFH on Productivity Measures
Whereas the PCC analysis presented above is useful for investigating general variations across groups, as well as the impact of different methodological choices on the estimation of the WFH–productivity relationship, it does not provide an easily interpretable economic measure. Therefore, we consider the impact on WFH on specific measures of productivity identified in the literature. To be able to combine estimates from multiple studies while retaining their original units, the studies must use the same measures of productivity and WFH. For productivity measures, we are able to consider the natural logarithm of hourly earnings, the number of hours worked per week, and Likert scale responses for both the pre-pandemic and (post-)pandemic data. We are also able to consider the natural logarithm of total income for the pre-pandemic data, but we have an insufficient number of comparable observations to consider it with the (post-)pandemic data. In all cases, we are limited by sample size to considering estimates employing the binary measure of WFH participation. We follow the same procedure described above to perform the meta-regression analysis for each productivity measure. An explanation of the variables included is provided in Table A.3 in Online Appendix D while the MRA results are provided in Tables A.4 and A.5 in Online Appendix F for the pre-pandemic and (post-)pandemic samples, respectively. We follow the same procedure described above to derive the impact of WFH on each productivity measure, adjusted for publication bias and best practice in methodology, with results reported in Table 5.
Impact of Working from Home (WFH) on Productivity Measures
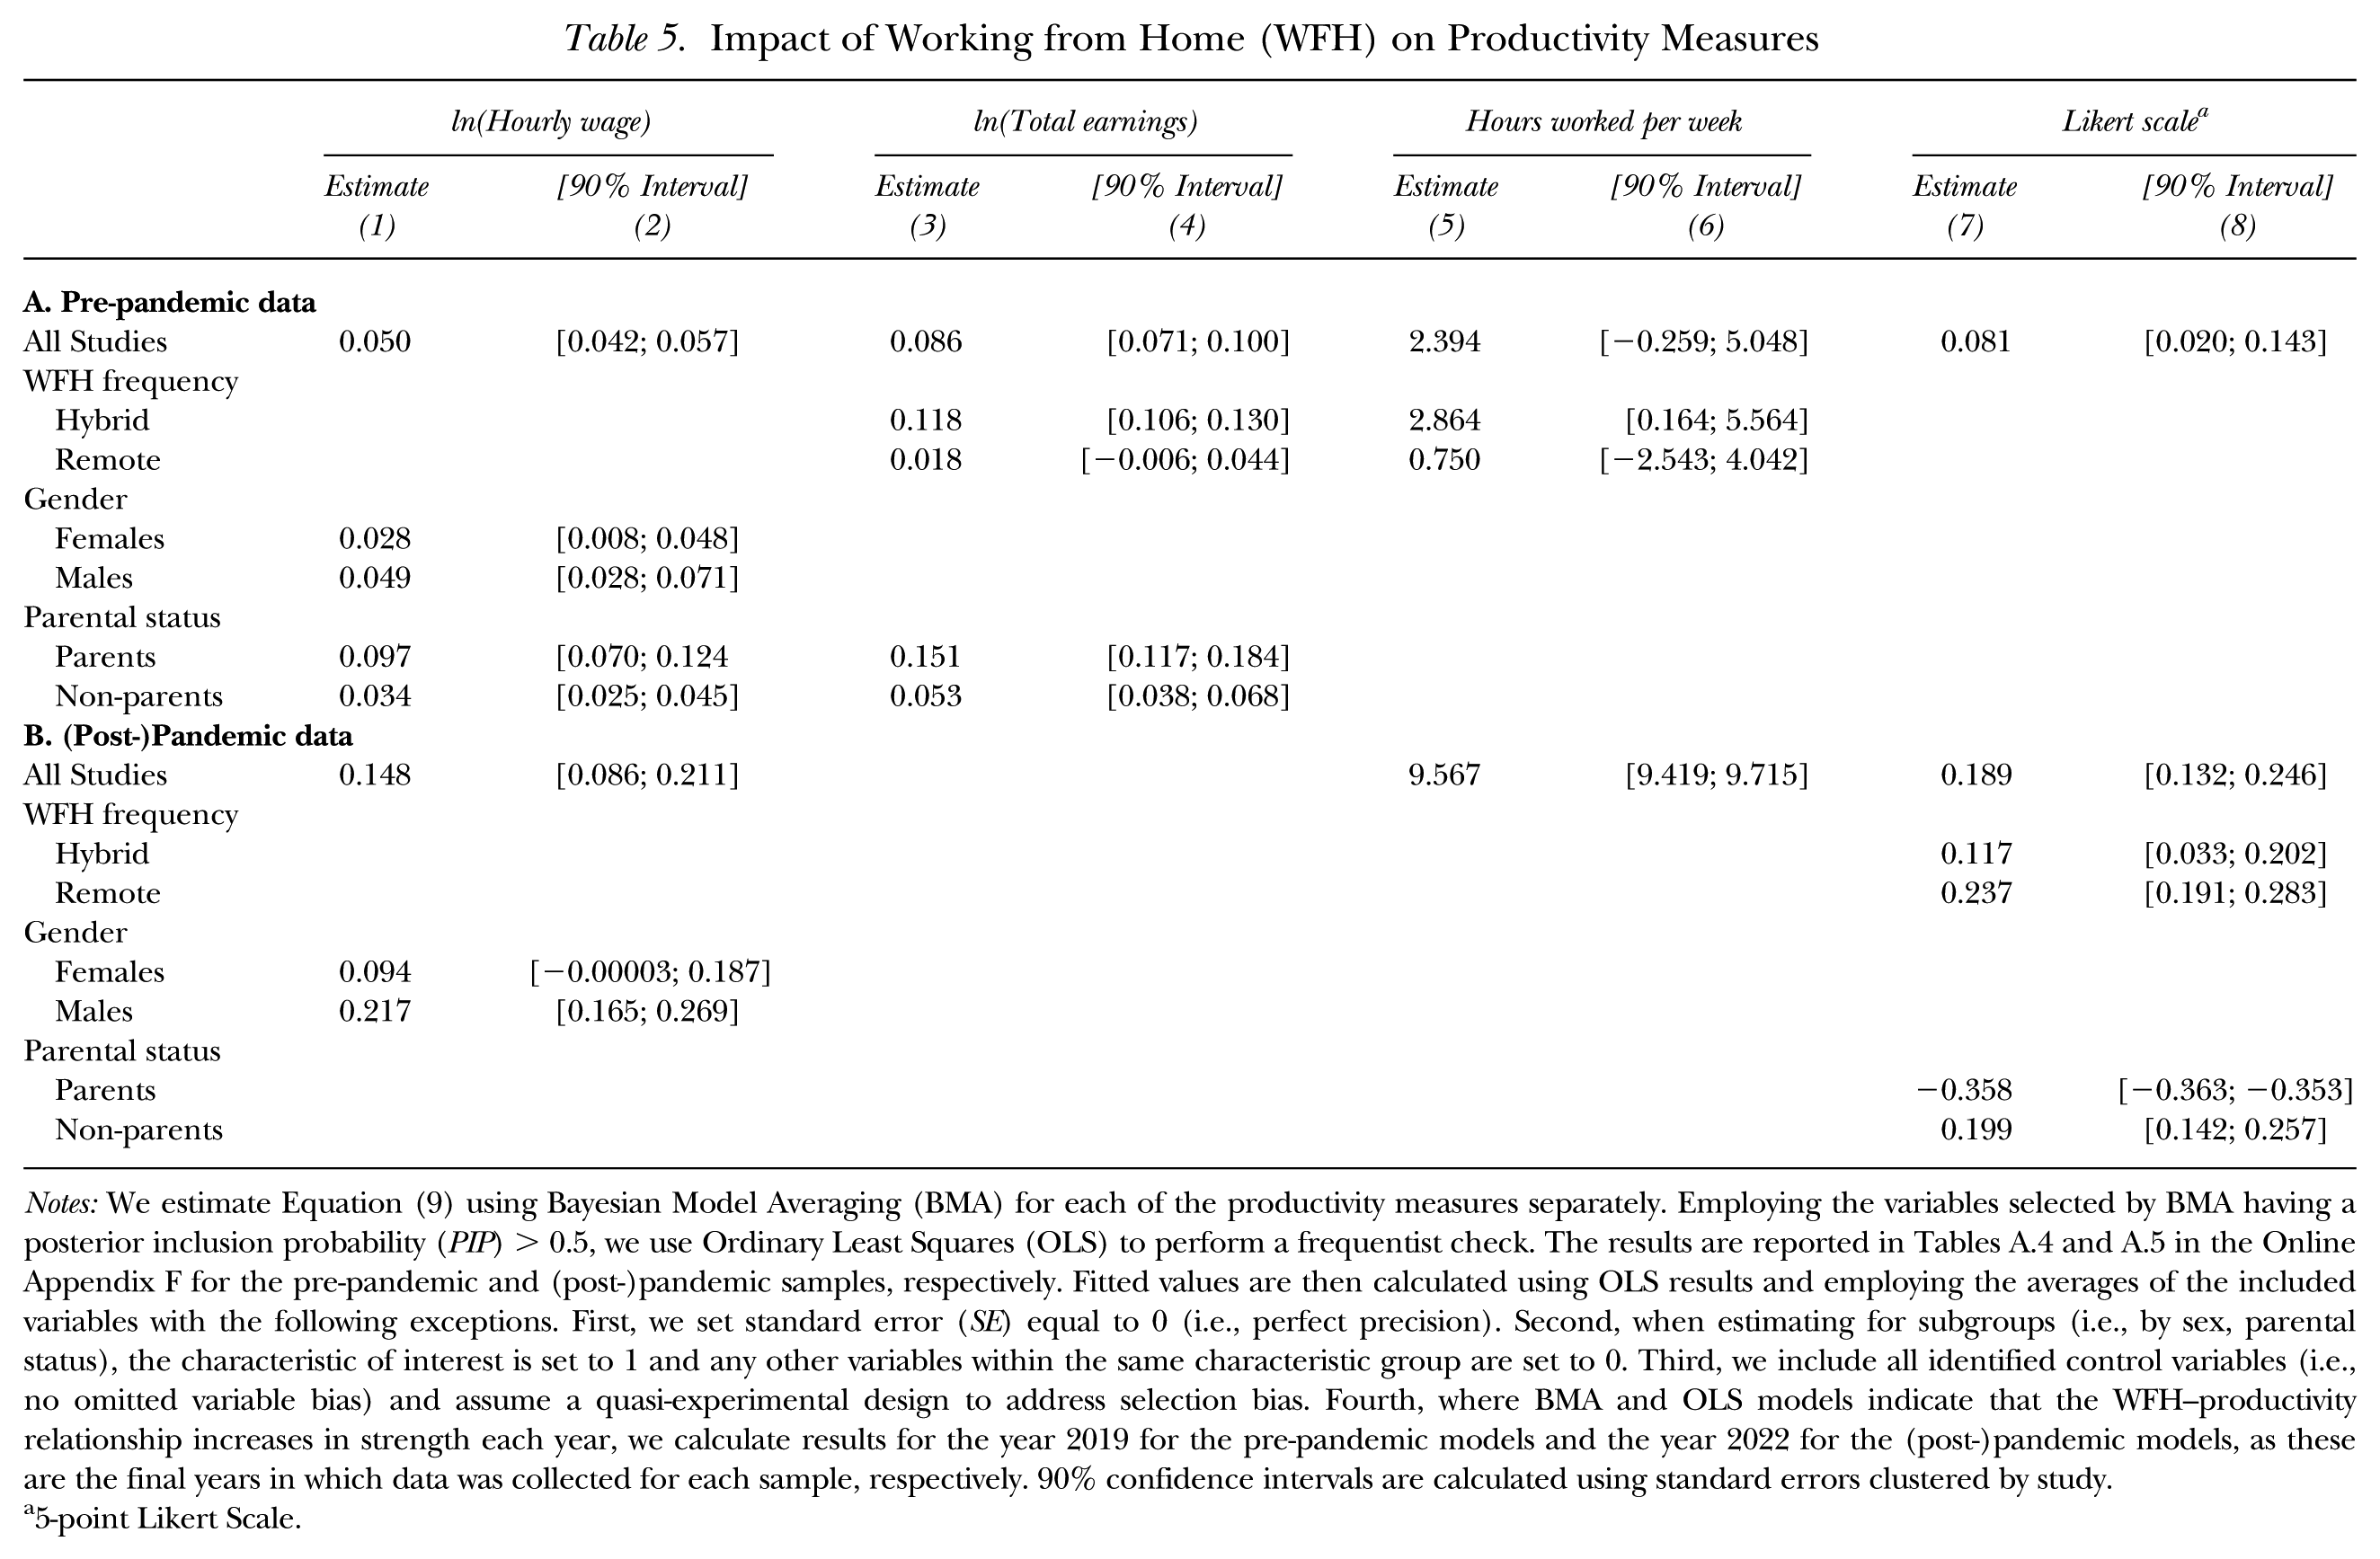
Notes: We estimate Equation (9) using Bayesian Model Averaging (BMA) for each of the productivity measures separately. Employing the variables selected by BMA having a posterior inclusion probability (PIP) > 0.5, we use Ordinary Least Squares (OLS) to perform a frequentist check. The results are reported in Tables A.4 and A.5 in the Online Appendix F for the pre-pandemic and (post-)pandemic samples, respectively. Fitted values are then calculated using OLS results and employing the averages of the included variables with the following exceptions. First, we set standard error (SE) equal to 0 (i.e., perfect precision). Second, when estimating for subgroups (i.e., by sex, parental status), the characteristic of interest is set to 1 and any other variables within the same characteristic group are set to 0. Third, we include all identified control variables (i.e., no omitted variable bias) and assume a quasi-experimental design to address selection bias. Fourth, where BMA and OLS models indicate that the WFH–productivity relationship increases in strength each year, we calculate results for the year 2019 for the pre-pandemic models and the year 2022 for the (post-)pandemic models, as these are the final years in which data was collected for each sample, respectively. 90% confidence intervals are calculated using standard errors clustered by study.
5-point Likert Scale.
Pre-pandemic, teleworkers on average earned approximately 5.1% more per hour than non-teleworkers. Both male and female teleworkers earned more than their non-teleworking counterparts, but the difference was larger for males. However, teleworking parents earned 10.2% more per hour than non-teleworkers, whereas teleworking non-parents earned only 3.5% more per hour than non-teleworkers. WFH is shown to increase total earnings by 9.0% overall; however, that is driven by earnings for hybrid teleworkers, which rose by 12.5%. Total income for remote teleworkers did not differ statistically from non-teleworkers. Total income for teleworking parents was 17.0% higher than non-teleworkers while for teleworking non-parents the increase was 5.4%. The discrepancy between hourly and weekly earnings suggests hours worked plays an important role in overall productivity. These income figures indicate that, although WFH raises hourly productivity, teleworkers produce even more over the course of a week because they also work longer hours than non-teleworkers. In fact, that is exactly what column (5) shows.
As displayed in column (5), prior to the pandemic, teleworkers were, on average, working about 2.4 more hours per week than non-teleworkers. However, this result appears to be driven by hybrid teleworkers who, on average, worked 2.9 hours more per week than non-teleworkers. The difference in hours worked between remote workers and non-teleworkers was not statistically significant. This result suggests that hybrid teleworkers may have been using the WFH opportunity as a supplement to time spent in the office, rather than as a substitute for office time, performing additional tasks at home that were not completed at their employer’s premises. This finding suggests that some instances of working from home may in fact have a negative impact on work–life balance for hybrid teleworks, a subject that should be investigated further.
When considering Likert responses in the pre-pandemic sample, teleworkers rated their productivity 0.081 points (on a 5-point scale) higher than non-teleworkers.
Since the beginning of the COVID-19 pandemic, hourly earnings for teleworkers have been almost 16.0% higher than for non-teleworkers; for males the gap between teleworkers and non-teleworkers has been even higher at 24.2%, while female teleworkers still experienced a wage premium of 9.9%. Although we do not have enough estimates to meta-analyze the overall impact on total income post-pandemic, the increase in total income is likely higher than the increase in hourly wages because, as in the pre-pandemic period, hours worked for teleworkers are on average higher (9.6 more hours per week) compared to non-teleworkers. When considering Likert responses, teleworkers rated their own productivity 0.189 points (on a 5-point scale) higher than non-teleworkers. These results appear to be driven more by remote teleworkers who reported average scores 0.237 points higher than non-teleworkers, while hybrid teleworkers reported average scores 0.117 points higher than non-teleworkers. Non-parents rated their productivity 0.199 points higher than non-teleworkers; however, teleworking parents in contrast rated their productivity 0.358 points lower than non-teleworkers, potentially due to the impact of having had to care for children during school closures during the pandemic. We do not have enough observations to distinguish differences across industrial sectors in any of the models or to consider the full range of regional variables included in the PCC analysis above. Furthermore, as shown in Online Appendix Tables A.4 and A.5, we also either do not have sufficient observations to examine, or do not find sufficient evidence of, differences based on frequency of telework, sex, parental status, or other variables of interest in some model specifications. Therefore, further research should be undertaken to examine these issues. Furthermore, the large differences in both hourly earnings and hours worked between teleworkers and non-teleworkers during the pandemic may be influenced by the unique economic circumstances of the pandemic, and so further research should be undertaken post-pandemic to ascertain how much (if any) of that difference still remains.
Conclusions and Recommendations
Prior to the COVID-19 pandemic, the practice of working from home had been gradually increasing over time. However, lockdowns imposed during the pandemic forced widespread adoption of the practice. While an extensive literature has established the health and welfare benefits of WFH (see, e.g., Shamir and Salomon 1985; Anderson et al. 2015; Kazekami 2020), the productivity effect has been extensively debated, with some arguing that WFH improves productivity (e.g., Pigini and Staffolani 2019) and should therefore be encouraged, and others stating that WFH reduces productivity (e.g., Giménez -Nadal et al. 2020) and should therefore be restricted. Our study makes multiple contributions to this literature. First, we demonstrate the average productivity effect is positive in some instances, but managers should not expect productivity improvements from all employees. Pre-pandemic, productivity rose for hybrid workers and for parents, while it was non-parents that benefited the most during the pandemic. We find that the productivity benefits of WFH are driven by both an increase in productivity per hour, as measured by hourly wages, and an increase in hours worked. As the only study thus far to compare the productivity effect across countries, we identify differences by geography that have implications for firm managers and future researchers.
Given that regular appearances at the employer’s premises allow managers to more closely monitor overall performance, reducing the incentive to shirk when working from home (see Causer and Jones 1996; Pyöriä 2011; Burbach and Day 2014), and given that regular appearances on-site also allow employees to build stronger connections with co-workers, thus reducing the negative productivity effect of lower group cohesion that can result when employees work remotely (see Baruch 2000; Fonner and Roloff 2010; Sarker et al. 2012), we recommend employers consider hybrid teleworking opportunities. We find that the productivity of hybrid teleworkers was higher than that of remote workers and on-site workers pre-pandemic. We find that, during the pandemic teleworkers overall were more productive than non-teleworkers, but we do not find enough evidence of a productivity difference between hybrid and remote workers to justify recommending remote over hybrid.
As the first study to compare the WFH–productivity relationship across geographic regions, we have found that prior to the pandemic, productivity gains were strongest in Northern/Western Europe; not statistically significant in the United States, Southern Europe, Japan, and Middle-income countries; and negative in the United Kingdom. By contrast, during the (post-)pandemic period, we have found that the effect of teleworking on productivity has been positive and broadly similar across most regions evaluated, positive but a bit weaker in the United Kingdom, and negative in Japan. Further exploration of why Japan has not seemed to benefit from a WFH-induced productivity expansion in the same way as other countries, in either time period, and especially more recently, is recommended and should consider whether differences in work culture, industrial mix, and communications infrastructure between Japan and other developed countries may explain the outcome. Given the lack of studies comparing multiple countries generally, future researchers should undertake more comparative studies to identify differences among individual developed and/or developing countries to ascertain more clearly which aspects of the local labor market and industry contribute to work-from-home-induced productivity changes.
Because our findings have shown that telework can improve overall productivity in both developed and developing countries, we suggest policymakers devise policies that promote teleworking in general, such as expanding broadband internet access to facilitate WFH. For emerging economies in particular, an expansion of telework could improve labor market access by providing new employment opportunities. In developed economies, telework can support productivity while enhancing work–life balance (Dingel and Neiman 2020). In both, telework has the potential to reduce commuting and congestion costs in cities. Given all these benefits, policymakers should encourage telework expansion broadly.
One important gap in the literature relates to a comparison of the productivity effects of WFH across occupations. Many studies (e.g., Arntz et al. 2022; Deole et al. 2023) control for occupation as a factor explaining overall productivity differences across individuals but nevertheless estimate a common effect of WFH on productivity for all occupations; others instead examine only a single occupation (e.g., Gibbs et al. 2023; Fenizia and Kirchmaier 2024). To date, a comprehensive examination of how or whether the WFH–productivity relationship varies across occupations has not been conducted and therefore we recommend that future researchers undertake such an investigation.
We have identified differences in outcomes between observational, quasi-experimental, and randomized controlled trial studies. WFH participation should be treated as endogenous in the broader population. A randomized controlled study design is ideal for avoiding the endogeneity problem; however, for results to be properly generalizable, they should involve multiple firms and multiple occupations within each firm, something that the literature to date has not accomplished. We recommend that future scholars undertake a broader RCT study involving multiple firms. In the absence of RCT data, scholars who rely on survey results from national statistics agencies should adopt a quasi-experimental approach. When conducting research on the WFH–productivity relationship, future scholars should be aware that different measures of productivity (task performance, hourly earnings, total income, hours worked, and so on) can produce different results; researchers should employ alternative productivity measures as robustness checks when possible. Although the binary measure of WFH participation is more common in the literature, we recommend future researchers use a continuous measure of time spent working from home, for two reasons. First, given that we identified differences between remote and hybrid teleworkers in one of the time periods investigated, separating respondents by WFH intensity is strongly recommended; knowing the specific number of hours spent teleworking would thus be helpful. Second, the use of a continuous measure of WFH will allow for a more precise estimate of the marginal effect of teleworking on productivity. To aid future researchers, we recommend that national statistics agencies modify their monthly labor force surveys to specifically collect data on the number of hours spent working from home in addition to the overall number of hours of work. Finally, we have found evidence that excluding commute distance, firm size, and worker education from the model specification may produce omitted variable bias. Future researchers should therefore be sure to include all of these factors in econometric specifications when possible.
Most studies examining how working from home impacts productivity focus on developed countries, leaving a significant gap in understanding its effects in emerging markets. Future research should explore the dynamic within developing countries, considering unique challenges such as infrastructure limitations, cultural differences, and varying technological adoption. Investigating these factors can provide valuable insights into optimizing remote work policies in diverse economic contexts and contribute to global workforce productivity strategies.
Supplemental Material
sj-pdf-1-ilr-10.1177_00197939261456260 – Supplemental material for Does Working from Home Improve Employees’ Productivity? Empirical Evidence from a Meta-Analysis
Supplemental material, sj-pdf-1-ilr-10.1177_00197939261456260 for Does Working from Home Improve Employees’ Productivity? Empirical Evidence from a Meta-Analysis by Colin F. Mang and Amar Anwar in ILR Review
Footnotes

For general questions as well as for information regarding the data, please contact the corresponding author, Colin Mang, at
1
“p-hacking” refers to situations in which researchers experiment with different model specifications specifically to improve precision and the statistical significance of results, and then only report estimates from models with the smallest p-values.
References
Supplementary Material
Please find the following supplemental material available below.
For Open Access articles published under a Creative Commons License, all supplemental material carries the same license as the article it is associated with.
For non-Open Access articles published, all supplemental material carries a non-exclusive license, and permission requests for re-use of supplemental material or any part of supplemental material shall be sent directly to the copyright owner as specified in the copyright notice associated with the article.
