






Abstract
Marine transportation moves approximately 80% of the world’s cargo volume, playing a vital role in global logistics. Ever-increasing environmental challenges and fuel economy concerns demand efficient, low-emission engine technologies. Homogeneous charge compression ignition (HCCI) offers improved thermal efficiency at minimum engine-out emissions, but maintaining combustion stability across varying operating conditions limits its widespread adoption. Established in-cylinder pressure-based control systems perform reliably when combustion phasing variations remain small but lack responsiveness under larger deviations, limiting robust real-time combustion state detection and correction. This study presents a vibration-based sensing and classification framework for detecting combustion states in an HCCI engine. Vibration signals recorded from a single-cylinder HCCI research engine were processed to extract a compact set of time- and frequency-domain features, which were used to train supervised classification models based on combustion phasing (CA50). Combustion states were categorized as Normal, Late, or Very Late Combustion. Six machine learning models were evaluated: K-nearest neighbors (KNN), support vector machines (SVM), Artificial neural networks (ANN), Random Forest (RF), Extreme Gradient Boosting (XGBoost), and a convolutional neural network (CNN) as a deep learning benchmark. All models demonstrated high accuracy and robustness, achieving F1-scores exceeding 98% for the Normal and Very Late Combustion classes. The ANN achieved the highest test accuracy of 98.36%, outperforming the CNN benchmark, particularly for the challenging Late Combustion class, demonstrating the effectiveness of the physically informed feature-based approach. The performance for the Late Combustion class was slightly lower, but the method remains promising for real-time applications due to its minimal computational overhead.
Introduction
Marine transportation plays a crucial role in global logistics, facilitating the movement of both cargo and passengers across vast distances. It is the backbone of international trade, handling approximately 80% of global goods by volume. 1 While maritime transport is generally more fuel-efficient per ton-mile versus other modes of transportation, its overall fuel consumption remains substantial due to the sheer scale of operations. This high fuel demand, combined with growing environmental concerns, has increased interest in more efficient and cleaner propulsion technologies.
Homogeneous charge compression ignition (HCCI) combustion is particularly promising because it offers high fuel efficiency and fuel flexibility. Unlike conventional internal combustion engines, HCCI operates through auto-ignition of a highly diluted and premixed, air-fuel mixture. It avoids local flame fronts and thus provides volumetric, low-temperature combustion, leading to significantly lower nitrogen oxide (NOx) and particulate matter (PM) emissions. Therefore, it effectively resolves the soot-NOx trade-off that typically limits diesel engine performance. However, despite their advantages, practical implementation of HCCI engines is challenging due to their high sensitivity to operating conditions. Maintaining stable and efficient combustion requires precise control, yet the lack of direct ignition mechanisms makes this inherently difficult.
Controlling the start of combustion (SOC) is a key challenge in HCCI engines. Spark ignition or fuel injection timing regulate SOC in conventional engines, but HCCI combustion is governed by chemical kinetics, making it highly sensitive to minor variations in fuel properties, intake air temperature, and cylinder pressure. This can lead to late combustion, or maybe even misfires, severely impacting engine efficiency and performance. 2 In particular, late combustion occurs when the charge-cooling effect of piston expansion outweighs the heat release from exothermic chemical reactions, preventing the mixture from reaching the required ignition temperature. This delays combustion, leading to efficiency losses, increased emissions, and potential cycle instability. The precise mechanisms and boundaries of this phenomenon are not yet fully understood, and its behavior depends strongly on fuel properties, intake conditions, and engine operating parameters. 3
Condition-based monitoring (CBM) has been widely used in internal combustion engines to mitigate such issues by facilitating early fault detection and predictive maintenance. CBM can reduce maintenance costs and extend operational lifespan through real-time performance tracking, helping to identify faults before they lead to severe engine failure. However, existing fault detection studies have focused predominantly on spark-ignition and diesel engines, analyzing common faults such as valve failures, misfires, knock, and fuel injection issues.
For instance, Jafari et al. 4 investigated valve fault detection in gasoline engines, using acoustic emissions data and artificial neural networks (ANN) for classification. Their study demonstrated that ANN-based methods could effectively distinguish between different types of valve faults, including semi-cracked, notched, and misadjusted valve clearance conditions. Similarly, Hu et al. 5 employed machine learning and deep learning models for valve leakage detection in diesel engines, ensuring their methods could generalize across different operating conditions. Zhao et al. 6 explored diesel engine fault diagnosis using vibration signals, applying Mel-frequency spectral analysis and K-nearest neighbors (KNN) classification to detect valve faults.
Several studies have also addressed combustion-related faults in conventional engines. Jafarian et al. 7 examined misfire and valve clearance faults using vibration signal analysis, employing ANN, support vector machines (SVM), and KNN classifiers. Firmino et al. 8 compared vibration-based and acoustic-based misfire detection, concluding that vibration analysis provided higher classification accuracy. Singh et al. 9 further explored sound-based misfire detection, demonstrating that acoustic data, when analyzed using SVM models, could distinguish between knock and normal combustion with high accuracy.
Similarly, Bondarenko et al. 10 focused on knock detection in gas-fueled engines, applying acoustic emission analysis and unsupervised learning techniques for feature extraction. Bi et al. 11 also worked on knock detection in gasoline engines, utilizing wavelet denoising and empirical mode decomposition (EMD) to identify knock events through vibration signal analysis. In the context of fuel injection fault detection, Albarbar et al. 12 employed acoustic measurements combined with Independent Component Analysis (ICA) for monitoring diesel engine injection faults.
Advanced learning methods such as CNNs (convolutional neural networks) and hybrid CNN-LSTM (long short-term memory) architectures have also been adopted for misfire classification under varying engine loads and transient conditions. Zhang et al. 13 utilized CNNs for detecting misfire in diesel engines with both single- and dual-cylinder faults. Qin et al. 14 implemented a multi-scale CNN-LSTM approach with a denoising module to enhance performance in noisy environments. Other approaches, such as the Hilbert–Huang transform with SVM, 15 and adaptive variational mode decomposition (VMD) combined with graph-regularized bi-directional NMF, 16 have been proposed for feature extraction and classification in engine diagnostics.
Earlier contributions also include the use of pattern recognition on vibration data for knock classification in internal combustion engines, 17 demonstrating the long-standing relevance of signal-based diagnostics.
Despite extensive research on condition-based monitoring (CBM) for conventional engines, fault detection in homogeneous charge compression ignition (HCCI) engines remains largely unexplored. The unique nature of HCCI combustion, particularly its auto-ignition dependence, sensitivity to charge conditions, and late combustion issues, necessitates specialized diagnostic approaches. Existing CBM techniques for conventional engines do not directly address combustion anomalies in HCCI engines, highlighting a significant gap in the literature.
Machine learning has been applied to HCCI combustion classification in prior work, primarily using engine operating parameters, such as fuel properties, intake conditions, and compression ratio, or pressure-derived metrics as classifier inputs18,19
Separately, vibration signals have been investigated in HCCI engines for combustion parameter estimation, including the reconstruction of in-cylinder pressure and the determination of SOC and CA50, rather than direct combustion-state classification. 20 Building upon these previous efforts, the present study investigates a vibration-based diagnostic framework that combines feature extraction and supervised machine learning for the detection and classification of late combustion fault states in HCCI engines. This approach extends the application of vibration-based diagnostics from combustion parameter estimation to automated fault-state identification and condition monitoring. In contrast to previous studies, which primarily focused on faults related to valves, misfire, and fuel injection, the present work targets combustion irregularities specific to HCCI operation. In the present study, in-cylinder pressure data are utilized only to define combustion-cycle labels through CA50 analysis, while fault detection is performed exclusively using vibration-derived features within a supervised machine learning framework.
In addition to the research gap identified above, the choice of vibration signals over in-cylinder pressure measurements is motivated by several practical considerations associated with real-world deployment. Piezoelectric pressure transducers are intrusive devices that require dedicated installation within the cylinder head and must operate reliably under harsh in-cylinder environments and elevated temperatures. 21 Furthermore, pressure sensing systems are generally more expensive and complex to implement than externally mounted vibration sensors, limiting their widespread adoption outside research and specialized applications. 21 Pressure sensors may also experience reliability degradation and reduced service life when exposed to demanding operating conditions over extended periods. 22 In contrast, accelerometers can be mounted externally on the engine block, are non-intrusive, robust, and inexpensive, and require no modification of the combustion chamber. Moreover, accelerometer-based sensing is already widely employed in production engines for applications such as knock detection, making vibration-based diagnostics particularly attractive for practical condition monitoring systems.
A key advantage of vibration-based diagnostics lies in their ability to provide a faster response compared to pressure-based methods. Diagnostic features can be extracted almost instantaneously from vibration signals, whereas combustion phasing metrics such as CA50 must be derived from in-cylinder pressure data through heat release (CHR) analysis, which is inherently a post-cycle process. Consequently, a vibration-based fault detection approach offers a more responsive and practical solution for real-time monitoring of HCCI engines.
This study evaluates six classification algorithms, namely KNN, SVM, ANN, Random Forest, XGBoost, and CNN, using vibration data collected from a single-cylinder HCCI engine to develop an efficient and reliable condition- monitoring framework. The results demonstrate high diagnostic accuracy, confirming the effectiveness of the proposed approach for detecting Late and Very Late Combustion events.
In contrast to many existing studies that utilize entire cycle data as classifier inputs—leading to increased computational complexity and high-dimensional feature spaces—this work incorporates engineering knowledge and mathematical feature selection techniques to extract only the most informative features. This approach reduces computational burden while maintaining strong classification performance.
While deep learning approaches, such as convolutional neural networks (CNNs) and hybrid architectures, have demonstrated strong performance in engine fault diagnosis, their effectiveness typically benefits from the availability of large-scale labeled datasets and high-dimensional input representations.23,24 In practical industrial scenarios, however, data availability is often limited, which can constrain the applicability of purely data-driven deep learning models.
Accordingly, this work primarily adopts feature-based machine learning methods that incorporate domain knowledge to extract physically meaningful features, while also evaluating a CNN-based deep learning benchmark for comparison. This approach maintains low computational complexity while enhancing model interpretability and robustness under limited-data conditions.
The remainder of this paper is organized as follows. First, the experimental setup and methodology are presented, including data preprocessing, fault classification, feature extraction, and classification strategies. The Results and Discussion section evaluates the performance of the proposed machine learning models, with particular emphasis on hyperparameter search, model tuning, classification results, and ablation study and feature contribution analysis. Real-time computational performance is also assessed to evaluate the feasibility of the proposed framework for practical deployment. Finally, the paper concludes with the key findings of this study.
Experimental setup and measurement
This study utilizes experimental data from a single-cylinder research engine test bench at Lublin University of Technology, Poland. The engine, depicted in Figure 1, has specifications typical of spark-ignition car engines. It features 500 cm
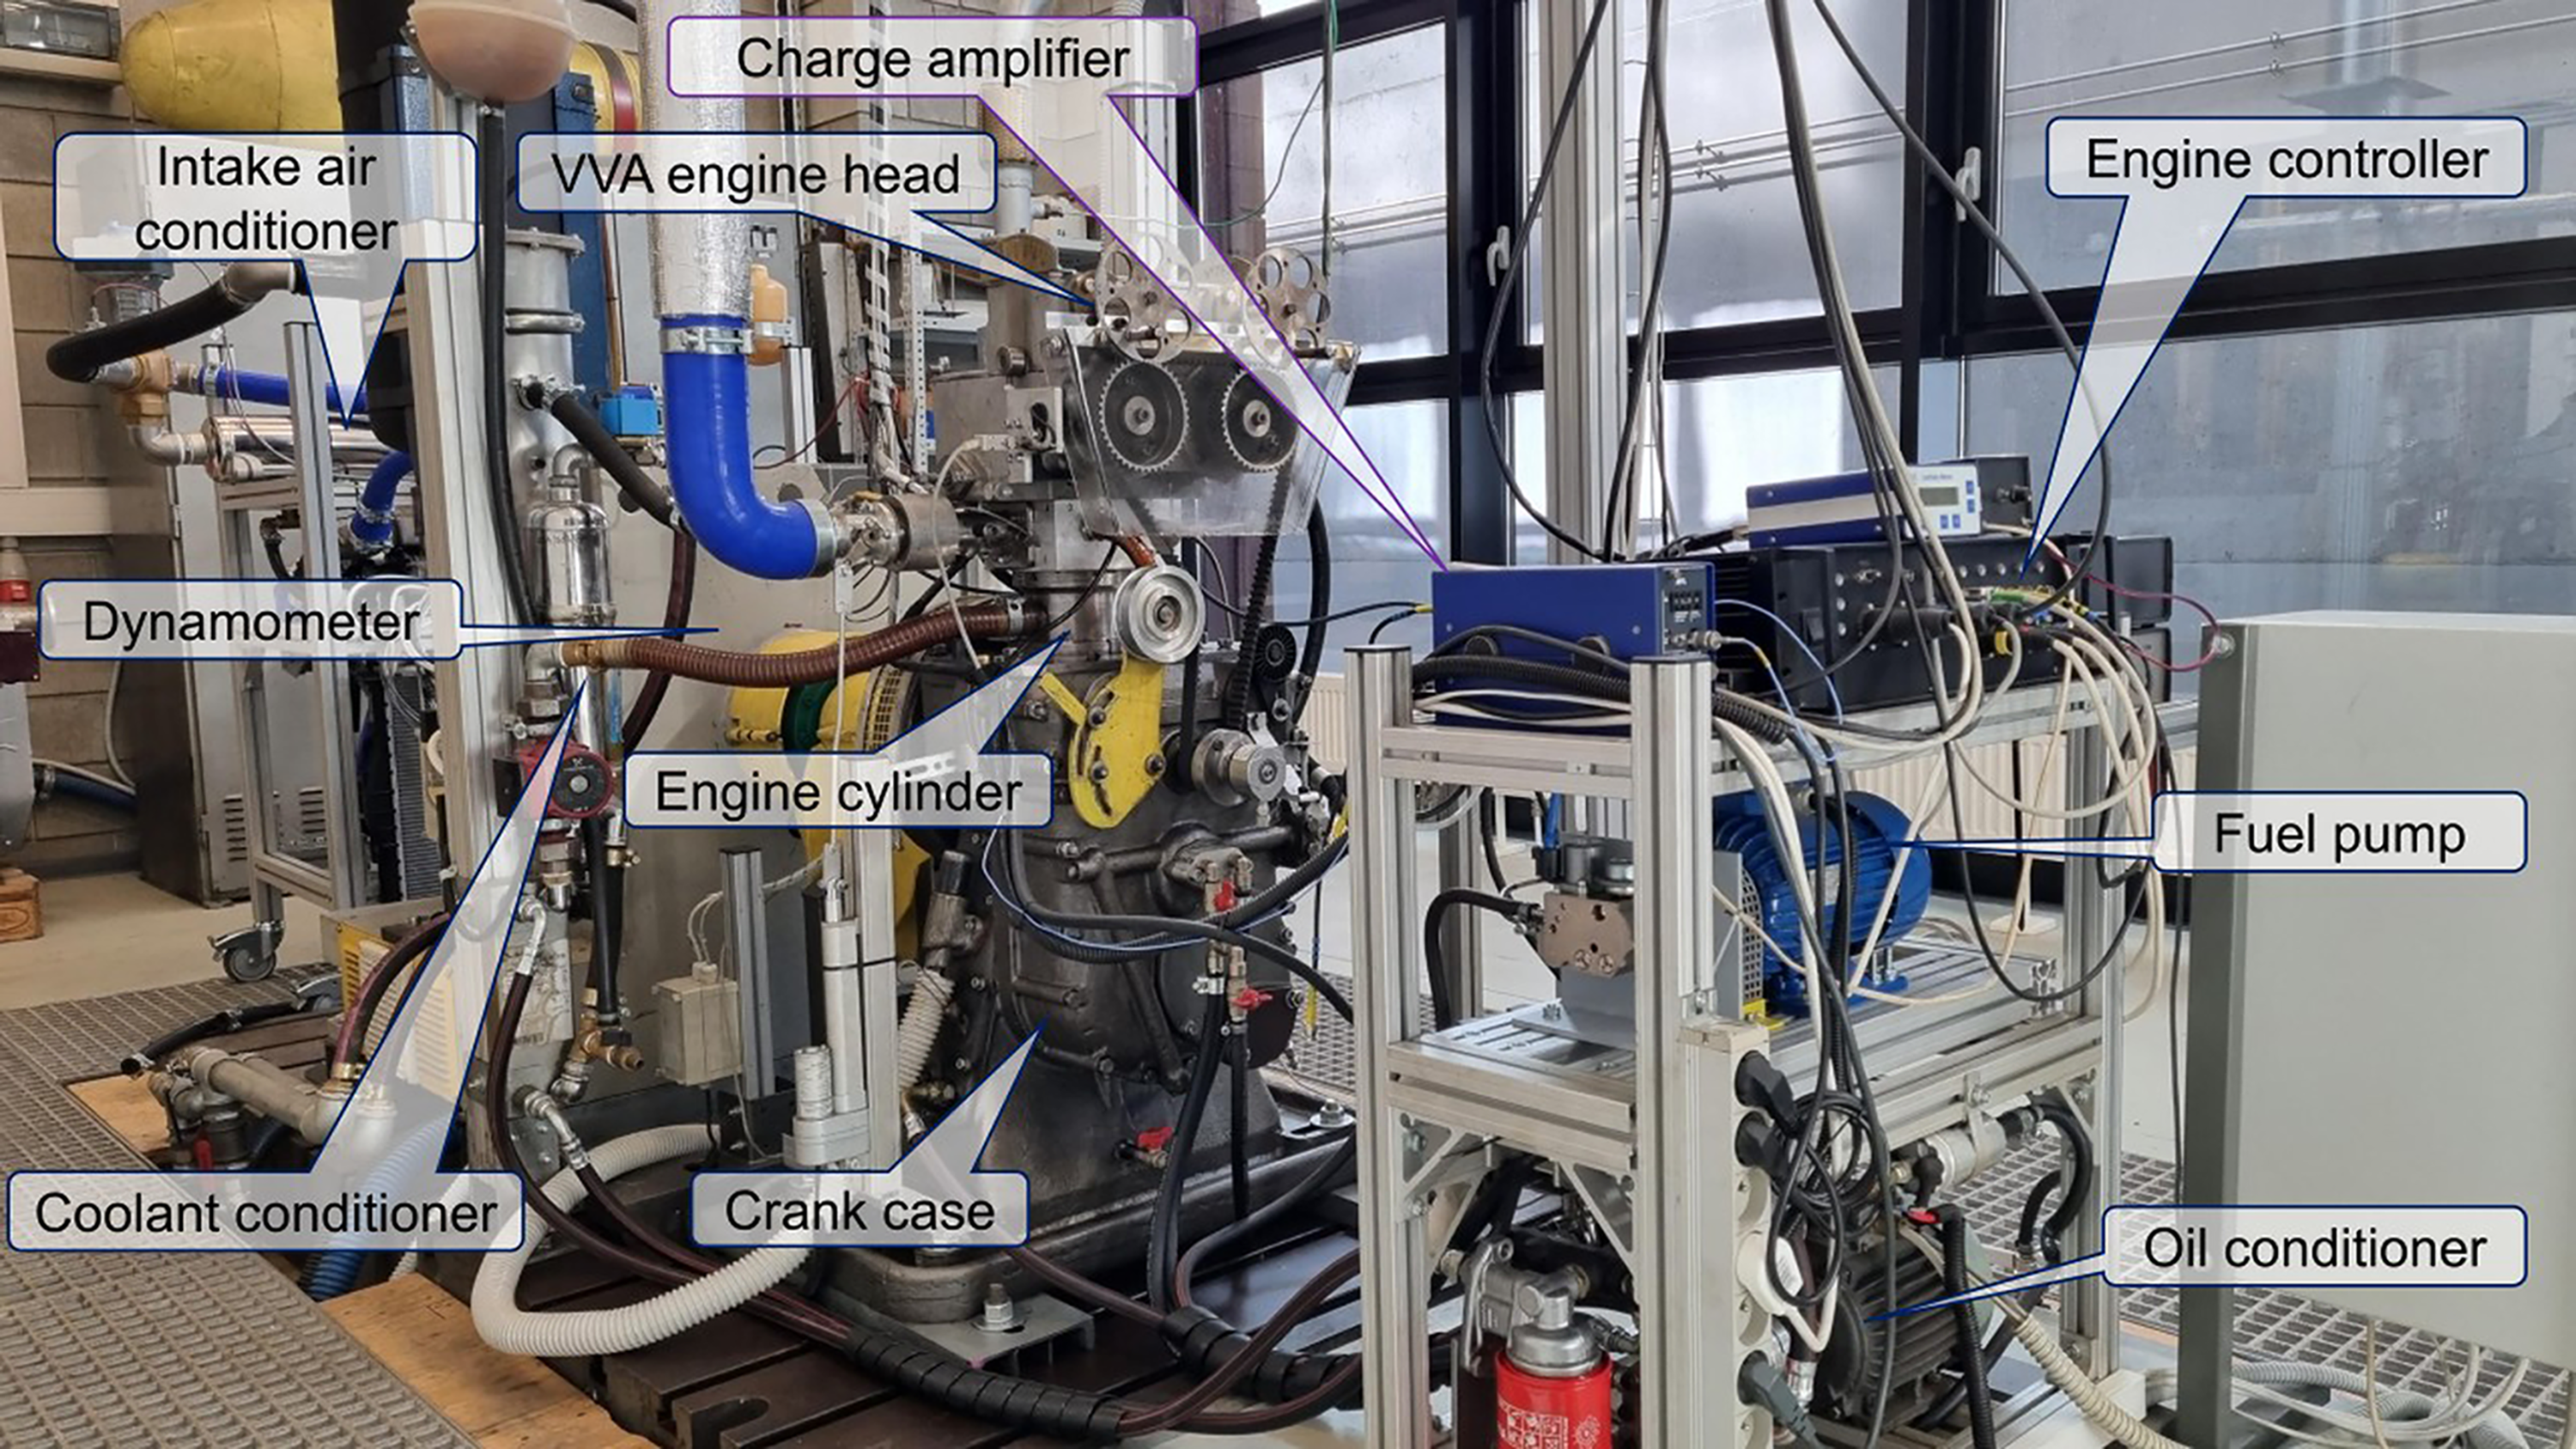
The experimental setup.
A fully automated dynamometer is connected to the engine to simulate real-world operating conditions. The test stand automation system provides temperature conditioning of all media: coolant, lubricant, and intake air.
The experiments involved variable engine load-speed conditions attainable at naturally aspirated HCCI combustion. The operating envelope was defined by engine speed and load. The engine speed ranged from 917 to 2293 RPM, while the engine load covered conditions from nearly idle operation to approximately 30% of the maximum load of a typical modern naturally aspirated spark-ignition passenger car engine. The engine load was expressed as indicated mean effective pressure (IMEP), defined as the thermodynamic work normalised by the swept volume. Although the investigated load range was relatively low, such operating conditions are typically attainable under HCCI combustion mode. These parameters are provided in Table 1. Extended conditions such as boosted intake pressure, cold intake temperatures, and deliberate EGR fluctuations were outside the scope of the current study and are identified as directions for future work. The engine load and air-fuel mixture were adjusted primarily by varying the fuel mass, since the throttle remained wide open throughout testing. Air-fuel ratios ranged from stoichiometric mixtures at higher loads to lean mixtures at lower loads, depending on the strategy applied.
Operating range of experimental data of the HCCI engine.

Fuel injection strategies were tailored to the engine load. At low loads, where auto-ignition is challenged by insufficient exhaust gas temperature, a portion of the fuel was injected during the NVO recompression phase to trigger exothermal reforming. The rest of the fuel was delivered during the intake stroke to create a homogeneous mixture. As engine load increased, the fueling strategy shifted to NVO exhaust expansion, providing a cooling effect and thus improving air aspiration. This allowed for consistent mixture preparation and control of combustion phasing across a range of conditions.
While the specific control parameter values are not reported here, the engine consistently operated within acceptable boundaries, without misfires or excessive emissions. Importantly, cycle-by-cycle variability was influenced by operating conditions and fueling strategies. The dataset consists of 2750 engine cycles, capturing both in-cylinder pressure and vibration signals under varying operating conditions.
Figure 2 presents sample pressure and vibration data from three engine cycles. The first cycle exhibits a higher peak pressure and increased vibration amplitude, characteristic of normal combustion. Conversely, the other two cycles show reduced amplitude, indicating deviations from the expected combustion behavior, and thus, anomalies.
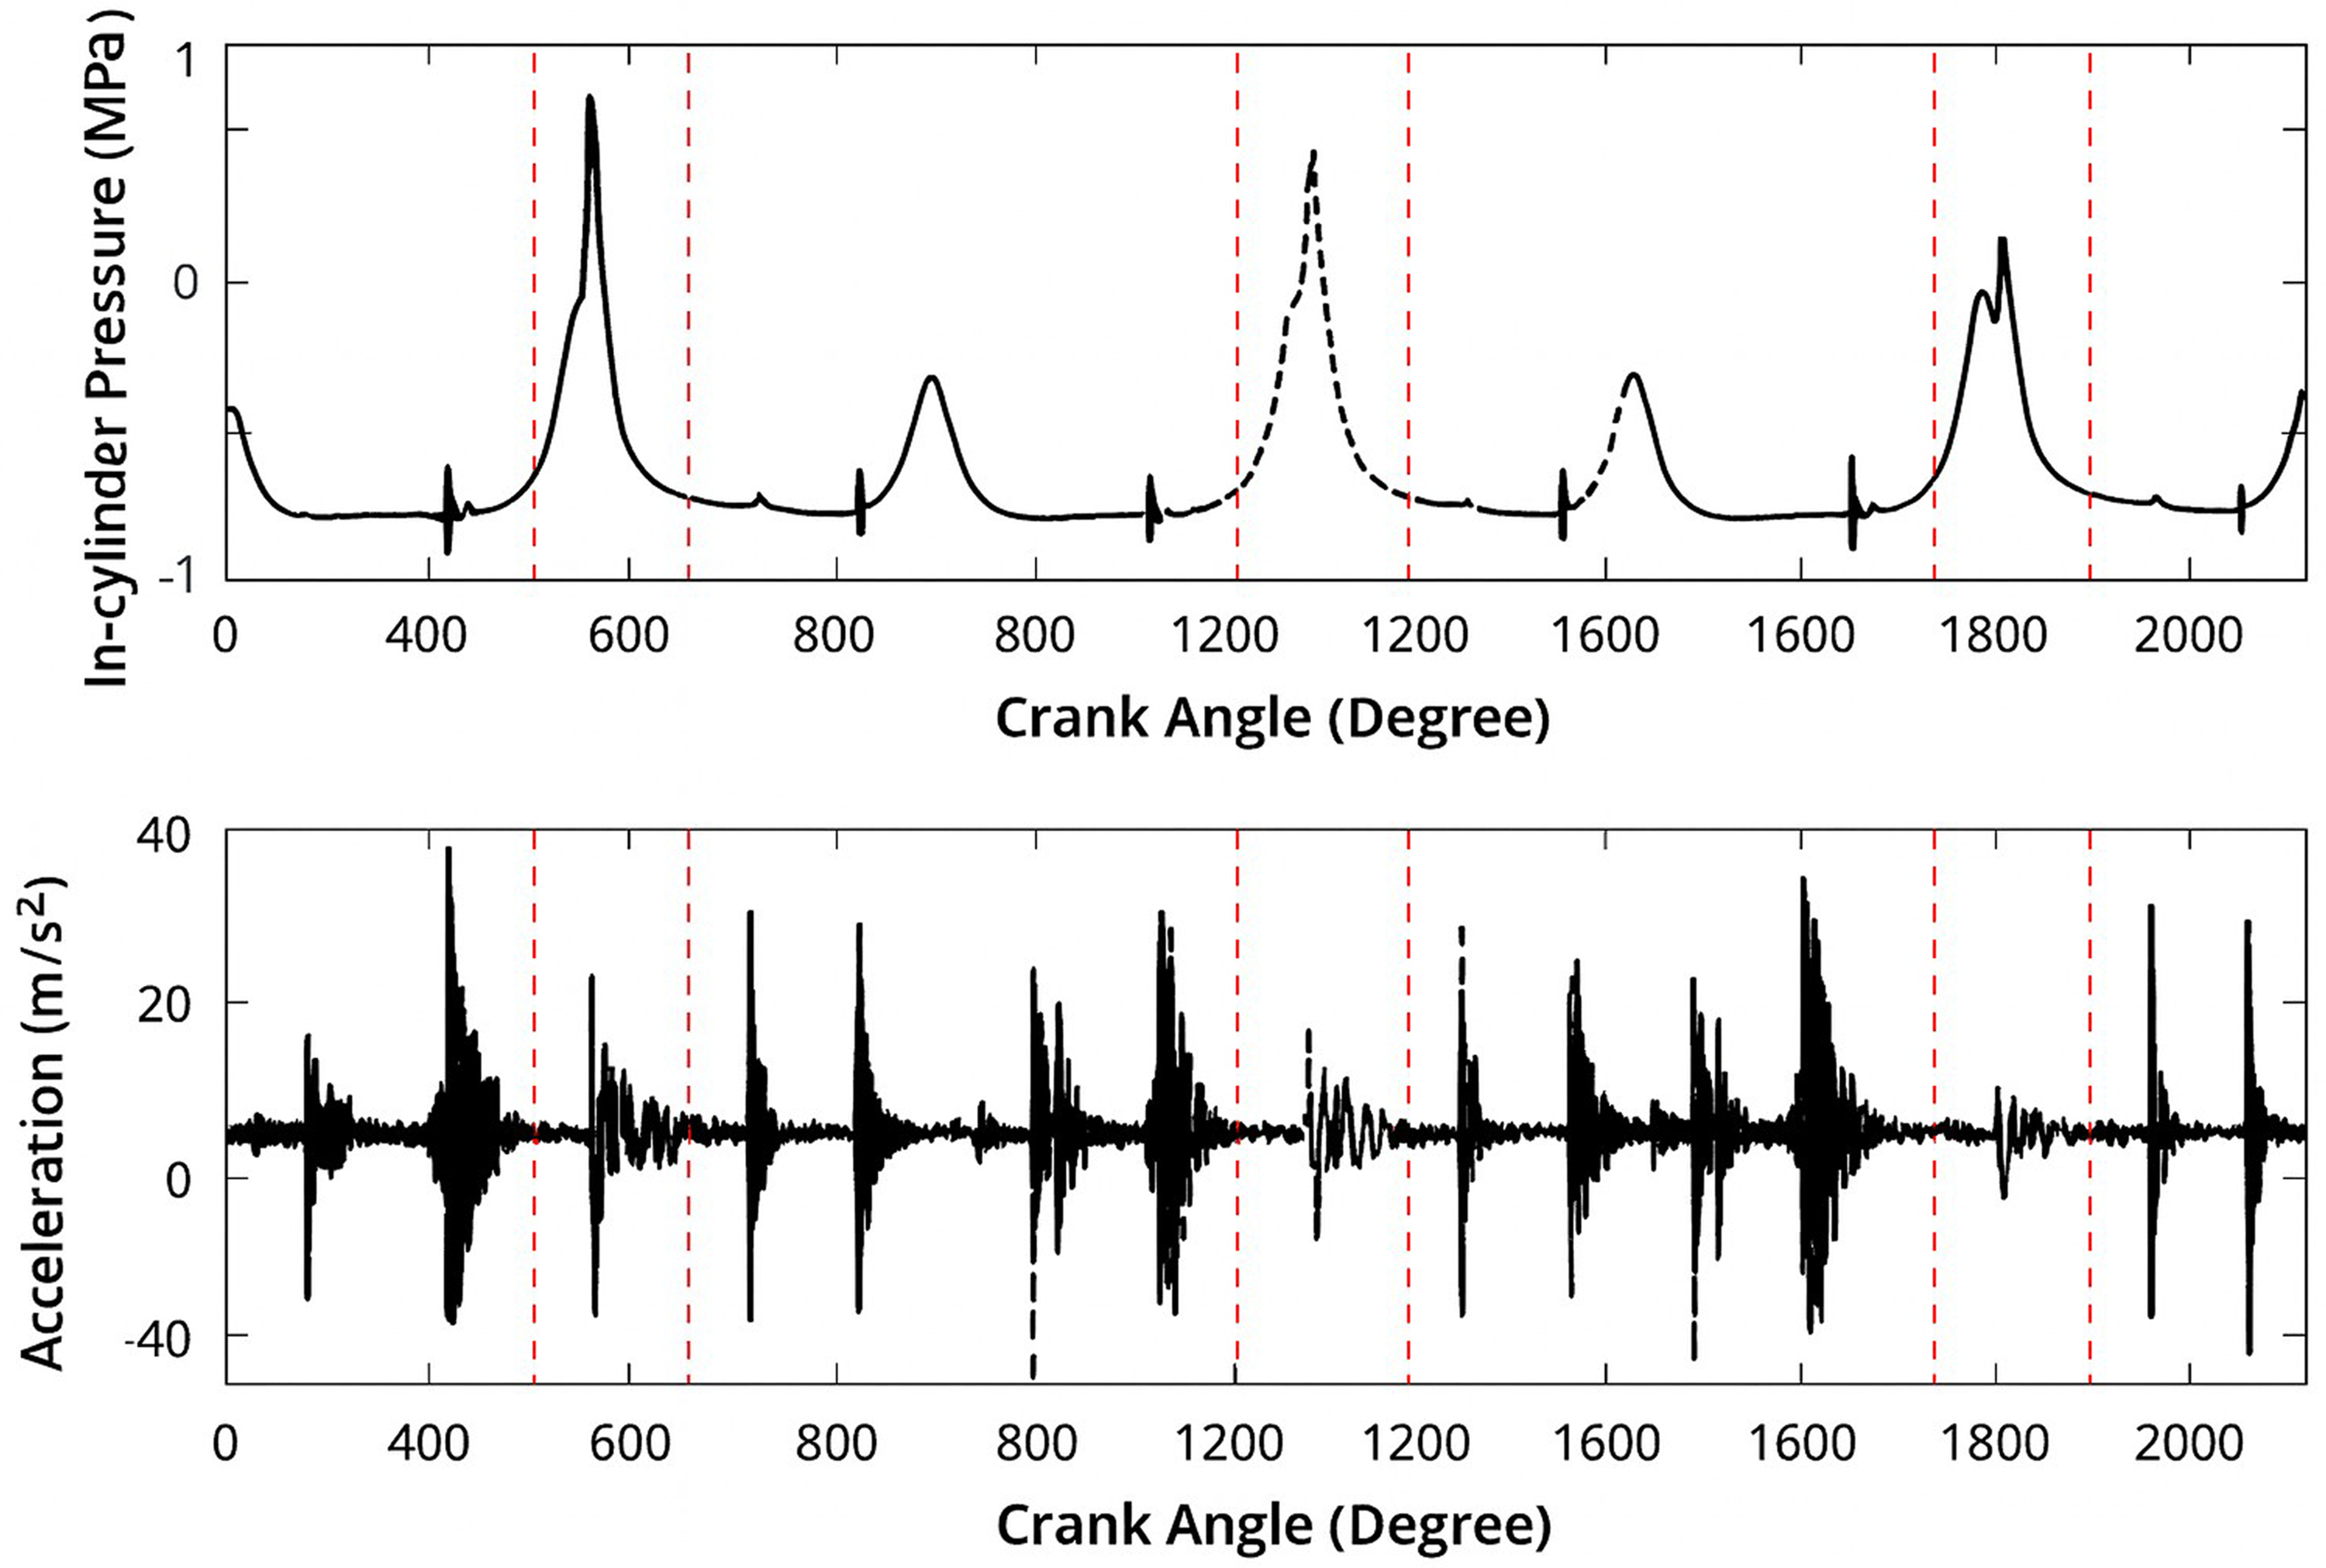
In-cylinder pressure and engine block vibration signals for three representative combustion cycles. The red dashed lines indicate the approximate crank angle ranges associated with combustion phases. These markers are used to visually highlight the regions where combustion typically occurs. The first cycle corresponds to Normal Combustion, while the second and third represent Late and Very Late Combustion events.
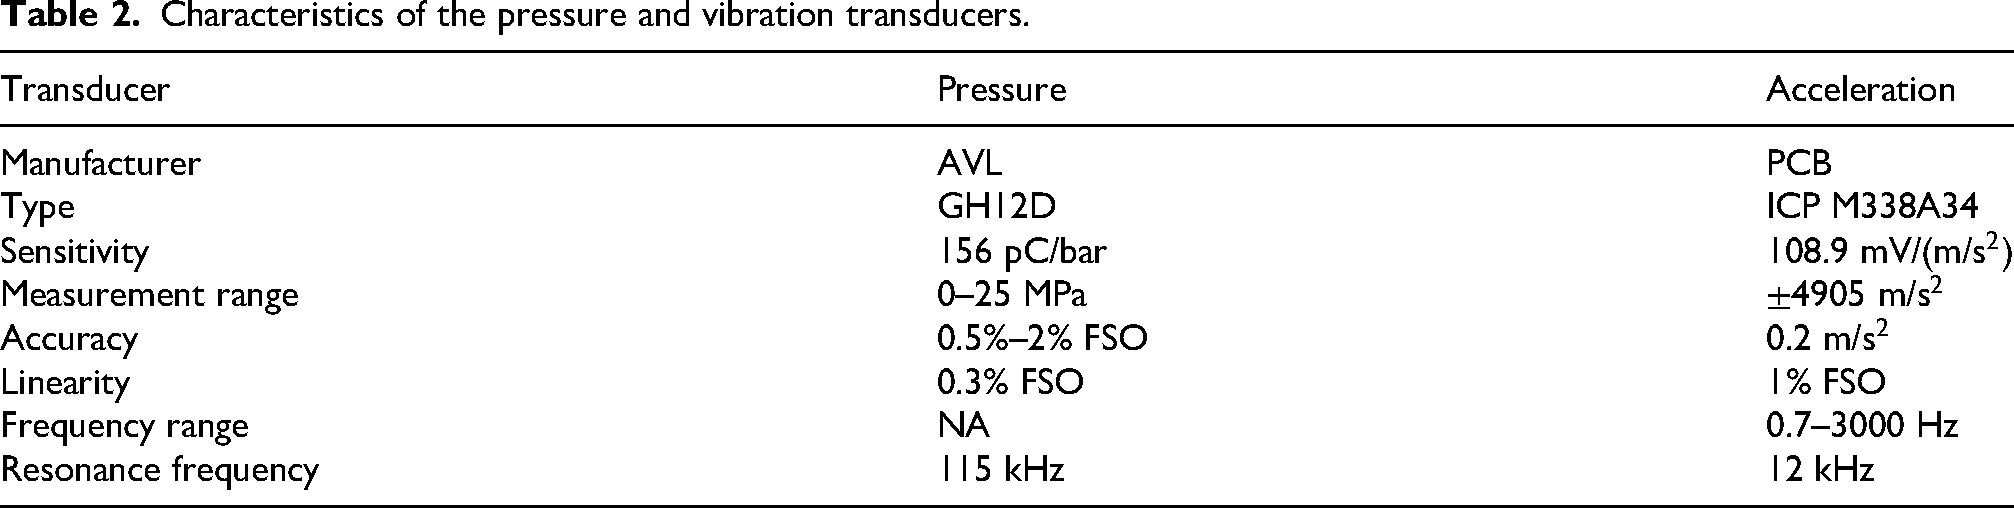
Vibration data serve as the primary diagnostic signal for fault detection in this study, while in-cylinder pressure is used as a reference for validation. Table 2 lists the transducers’ key metrological parameters. Vibration signals were recorded using high-sensitivity accelerometers mounted on the engine block. Two accelerometers were mounted on the engine head cover to acquire vibration data. One accelerometer was positioned vertically, parallel to the cylinder axis, while the second was positioned horizontally, parallel to the crankshaft and perpendicular to the cylinder liner. Both sensors were installed on the valvetrain mechanism not only for combustion monitoring, but also to identify valve opening and closing events. The accelerometer locations are shown in Figure 3. Although two accelerometers were installed, only the signal from the vertically mounted sensor was used for combustion diagnostics. Earlier studies 20 identified that the signal from this location provides more combustion-related information while being less cross-sensitive to mechanical vibration sources.
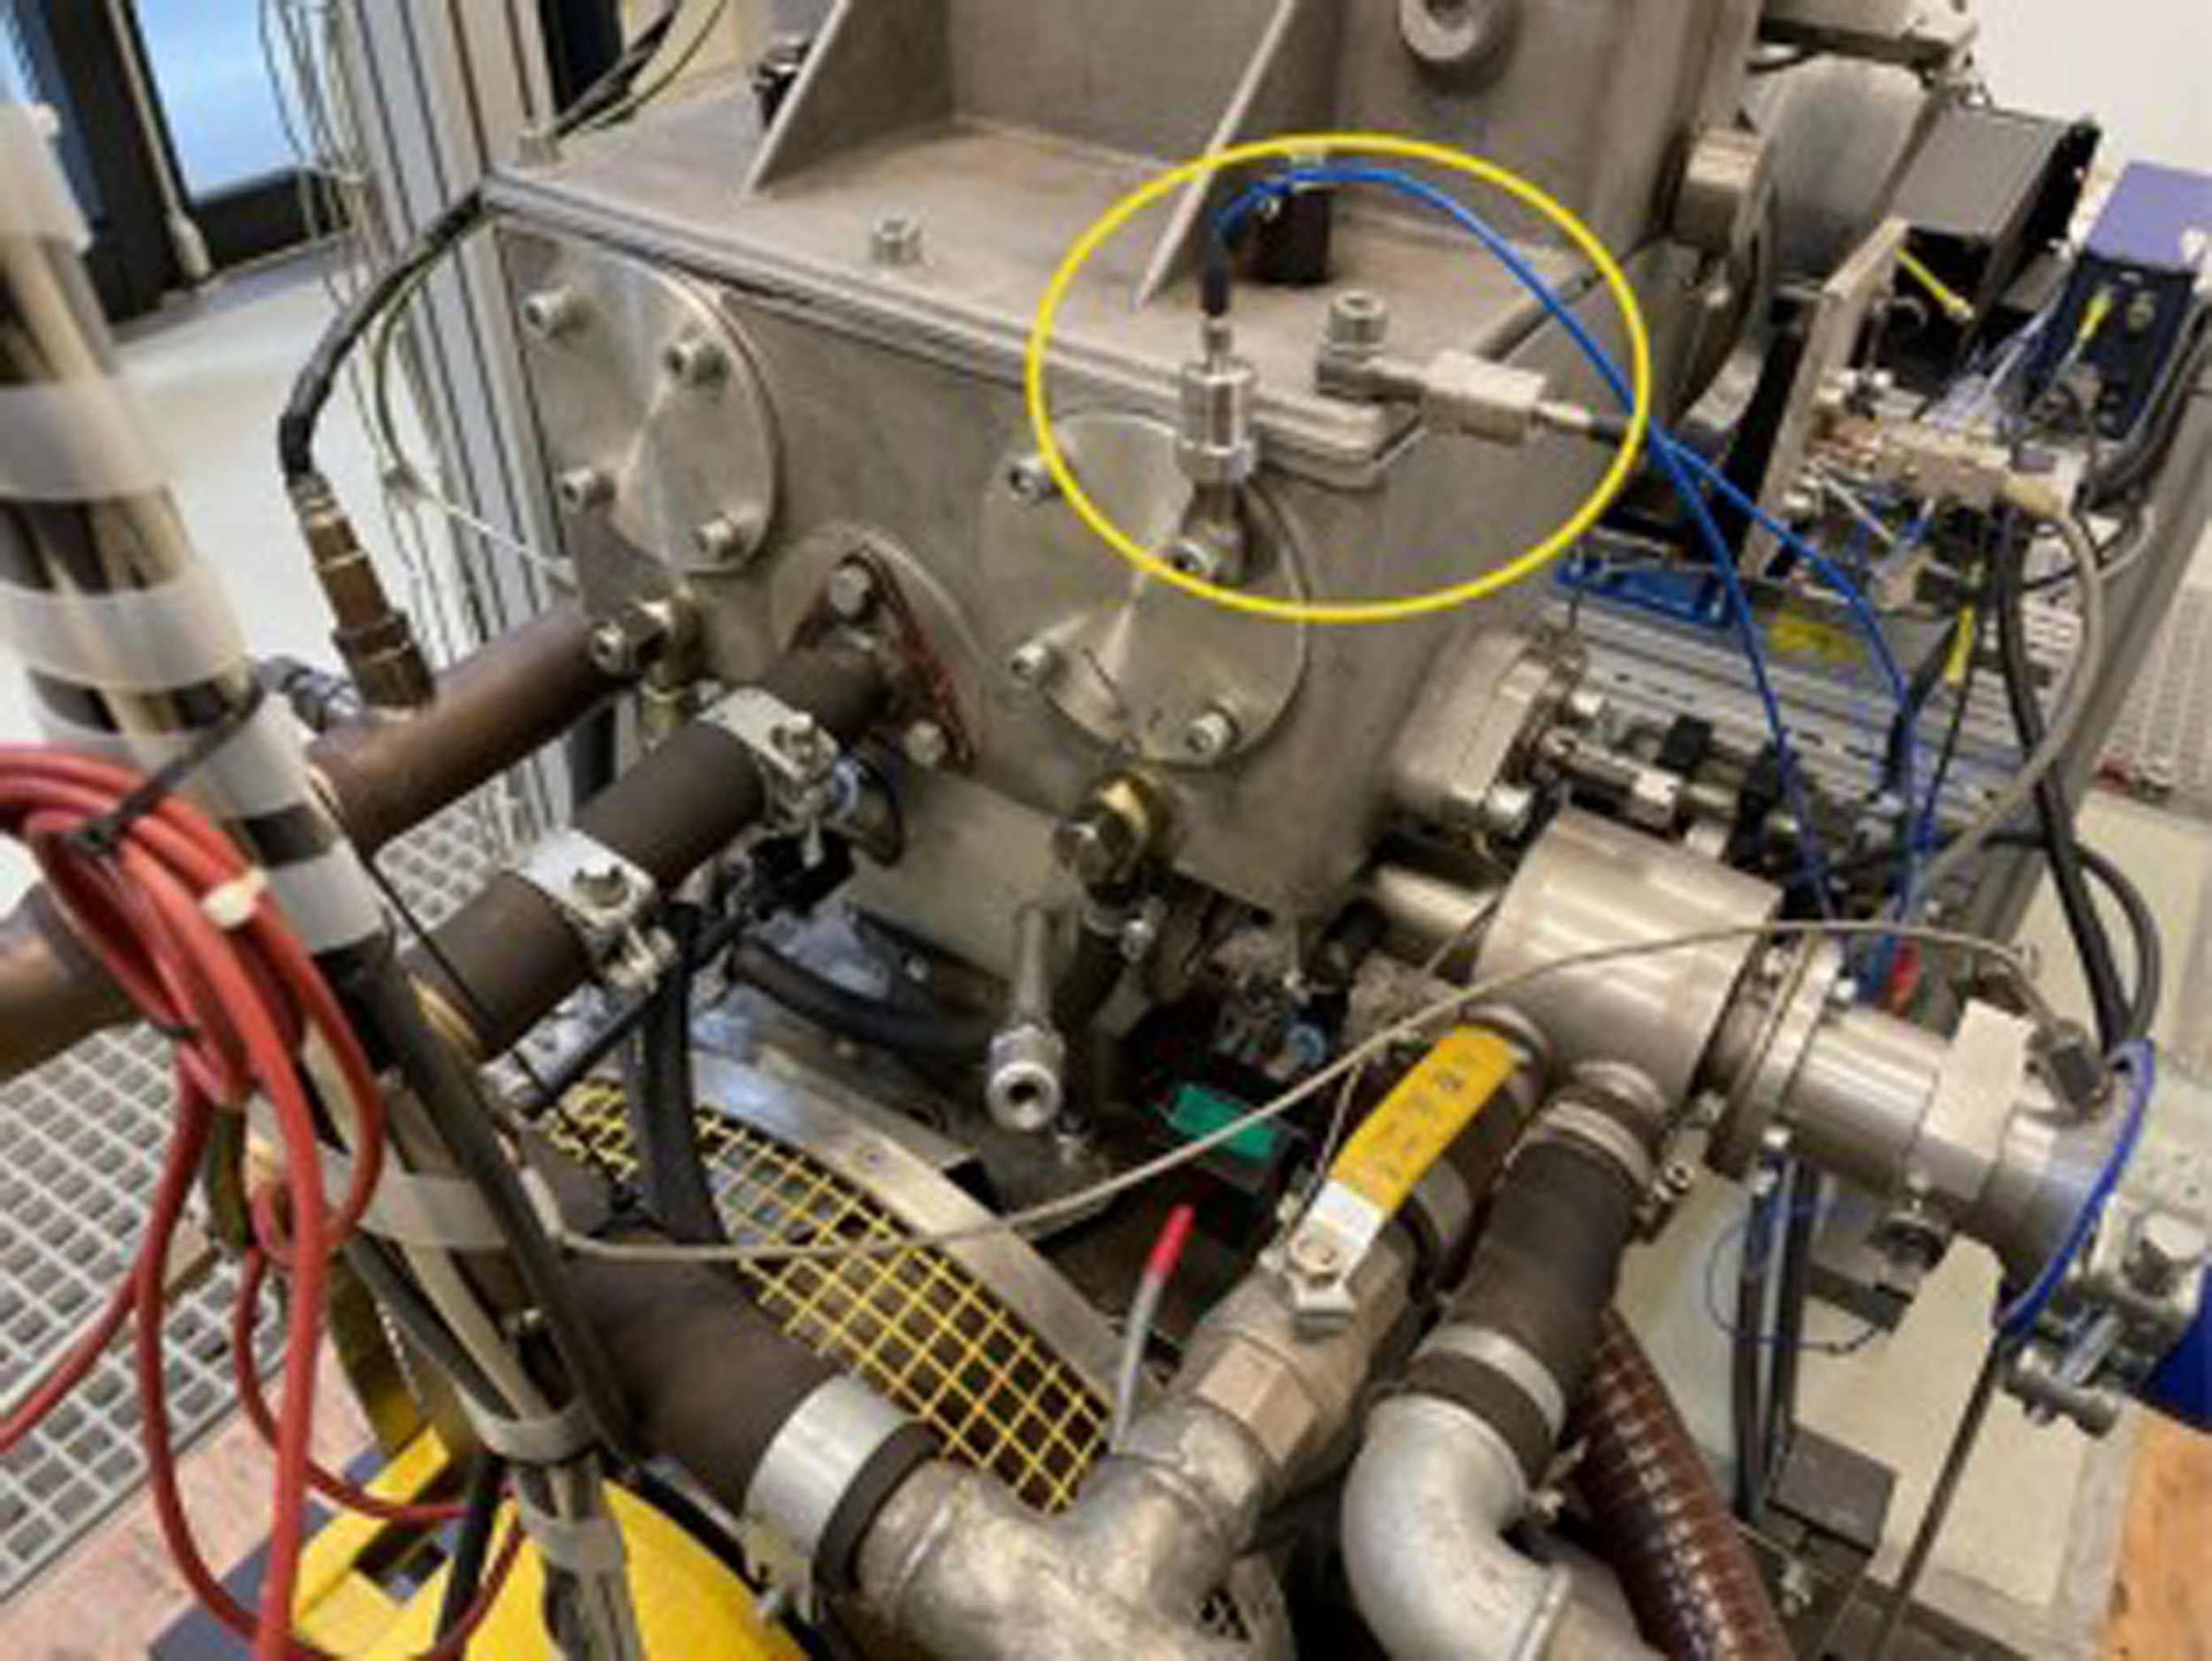
The mounting locations of the accelerometers.
Characteristics of the pressure and vibration transducers.
These accelerometers capture combustion-induced vibrations, which reflect variations in the combustion process. The signals were amplified and conditioned before being digitized using a National Instruments PXI-6071E A/D measurement card integrated into a PXI-8119 laboratory computer. The A/D converter offers a 12-bit resolution with a maximum sampling frequency of 1.25 MHz. Data acquisition was synchronized with the engine’s operation using a crankshaft optical encoder with a resolution of 0.1
Methodology and design
Following data acquisition from the HCCI engine, a comprehensive pre-processing phase was undertaken to extract meaningful features for classification. This involved calculating thermodynamic phenomena such as heat release rate and cumulative heat release rate, enabling a thorough combustion analysis for each cycle. Using thermodynamic logic, combustion events were labeled based on pressure data, providing a structured foundation for subsequent classification. Supervised machine learning techniques were employed for condition monitoring and classification. These techniques required both the labeled data and the relevant extracted features to train the models effectively. While the labeling process relied on pressure data to identify combustion characteristics, the classification models exclusively utilized features derived from vibration signals, ensuring a practical and scalable approach for real-world applications.
Figure 4 illustrates the research workflow, outlining the key steps from data acquisition through pre-processing to model implementation. This structured approach ensures a reliable and efficient condition monitoring system, offering a cost-effective alternative to traditional in-cylinder pressure sensors. Each step is described below.
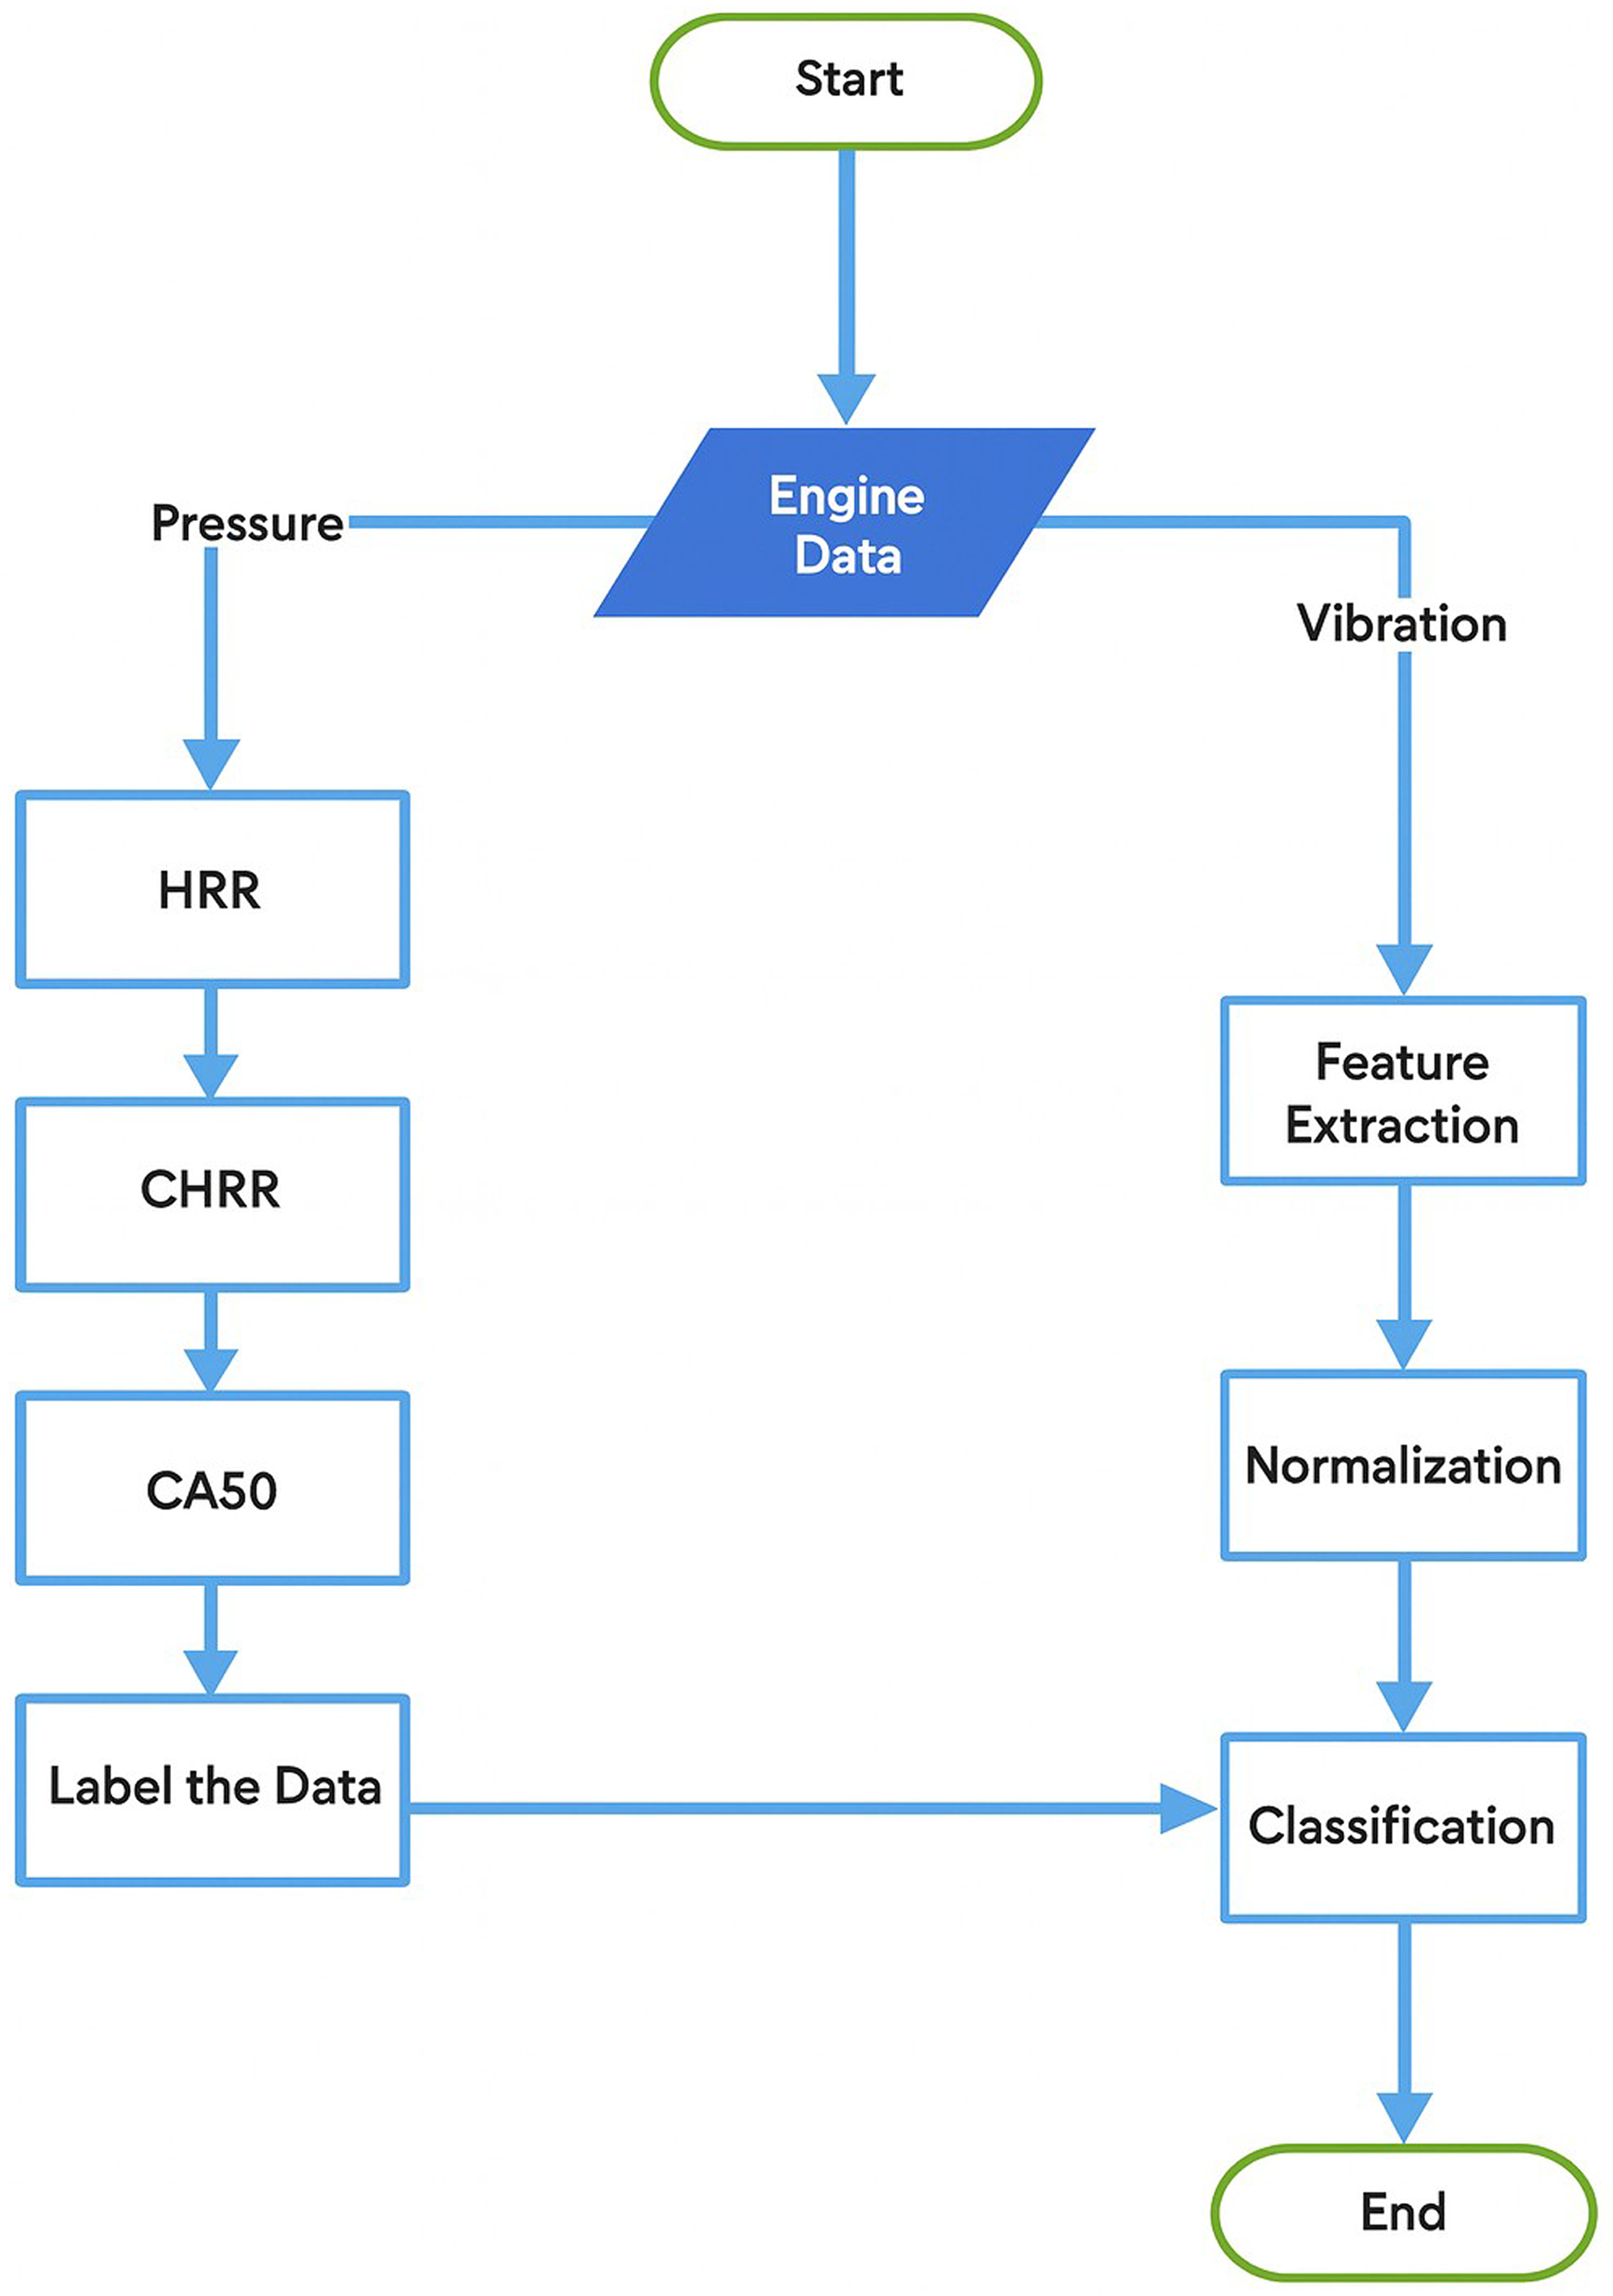
Schematic of the diagnosis system design.
Preprocessing the data and fault recognition
To enable detailed analysis, the data undergoes preprocessing, including the computation of key thermodynamic and combustion parameters. Specifically, the heat release rate (HRR) and cumulative heat release (CHR) are derived from in-cylinder pressure data using the first law of thermodynamics. The HRR is calculated using (1).
Where the dV is the derivative of volume and the dp is the derivative of pressure. The ratio of specific heats (
CHR could in fact be expressive of whether misfire has occurred or not. A partial misfire would give a tangible decrease in CHR; a complete misfire would drop CHR down to zero.
Additionally, the crank angle at which 50% of the fuel is burned (CA50) was calculated to further analyze combustion characteristics. CA50 could be easily derived from HRR as specified in (3).
CA50 is a primary metric of combustion phasing in internal combustion engines. Precise regulation of CA50 is critical for achieving high brake thermal efficiency and low emissions: deviations from the optimum phasing lead to higher fuel consumption and elevated pollutant formation. A notable graphical characteristic of CA50 is that it often occurs near the crank angle of maximum heat-release rate. Accordingly, the HRR peak may be used as an indicative marker of CA50. Figure 5 presents the HRR and CHR.
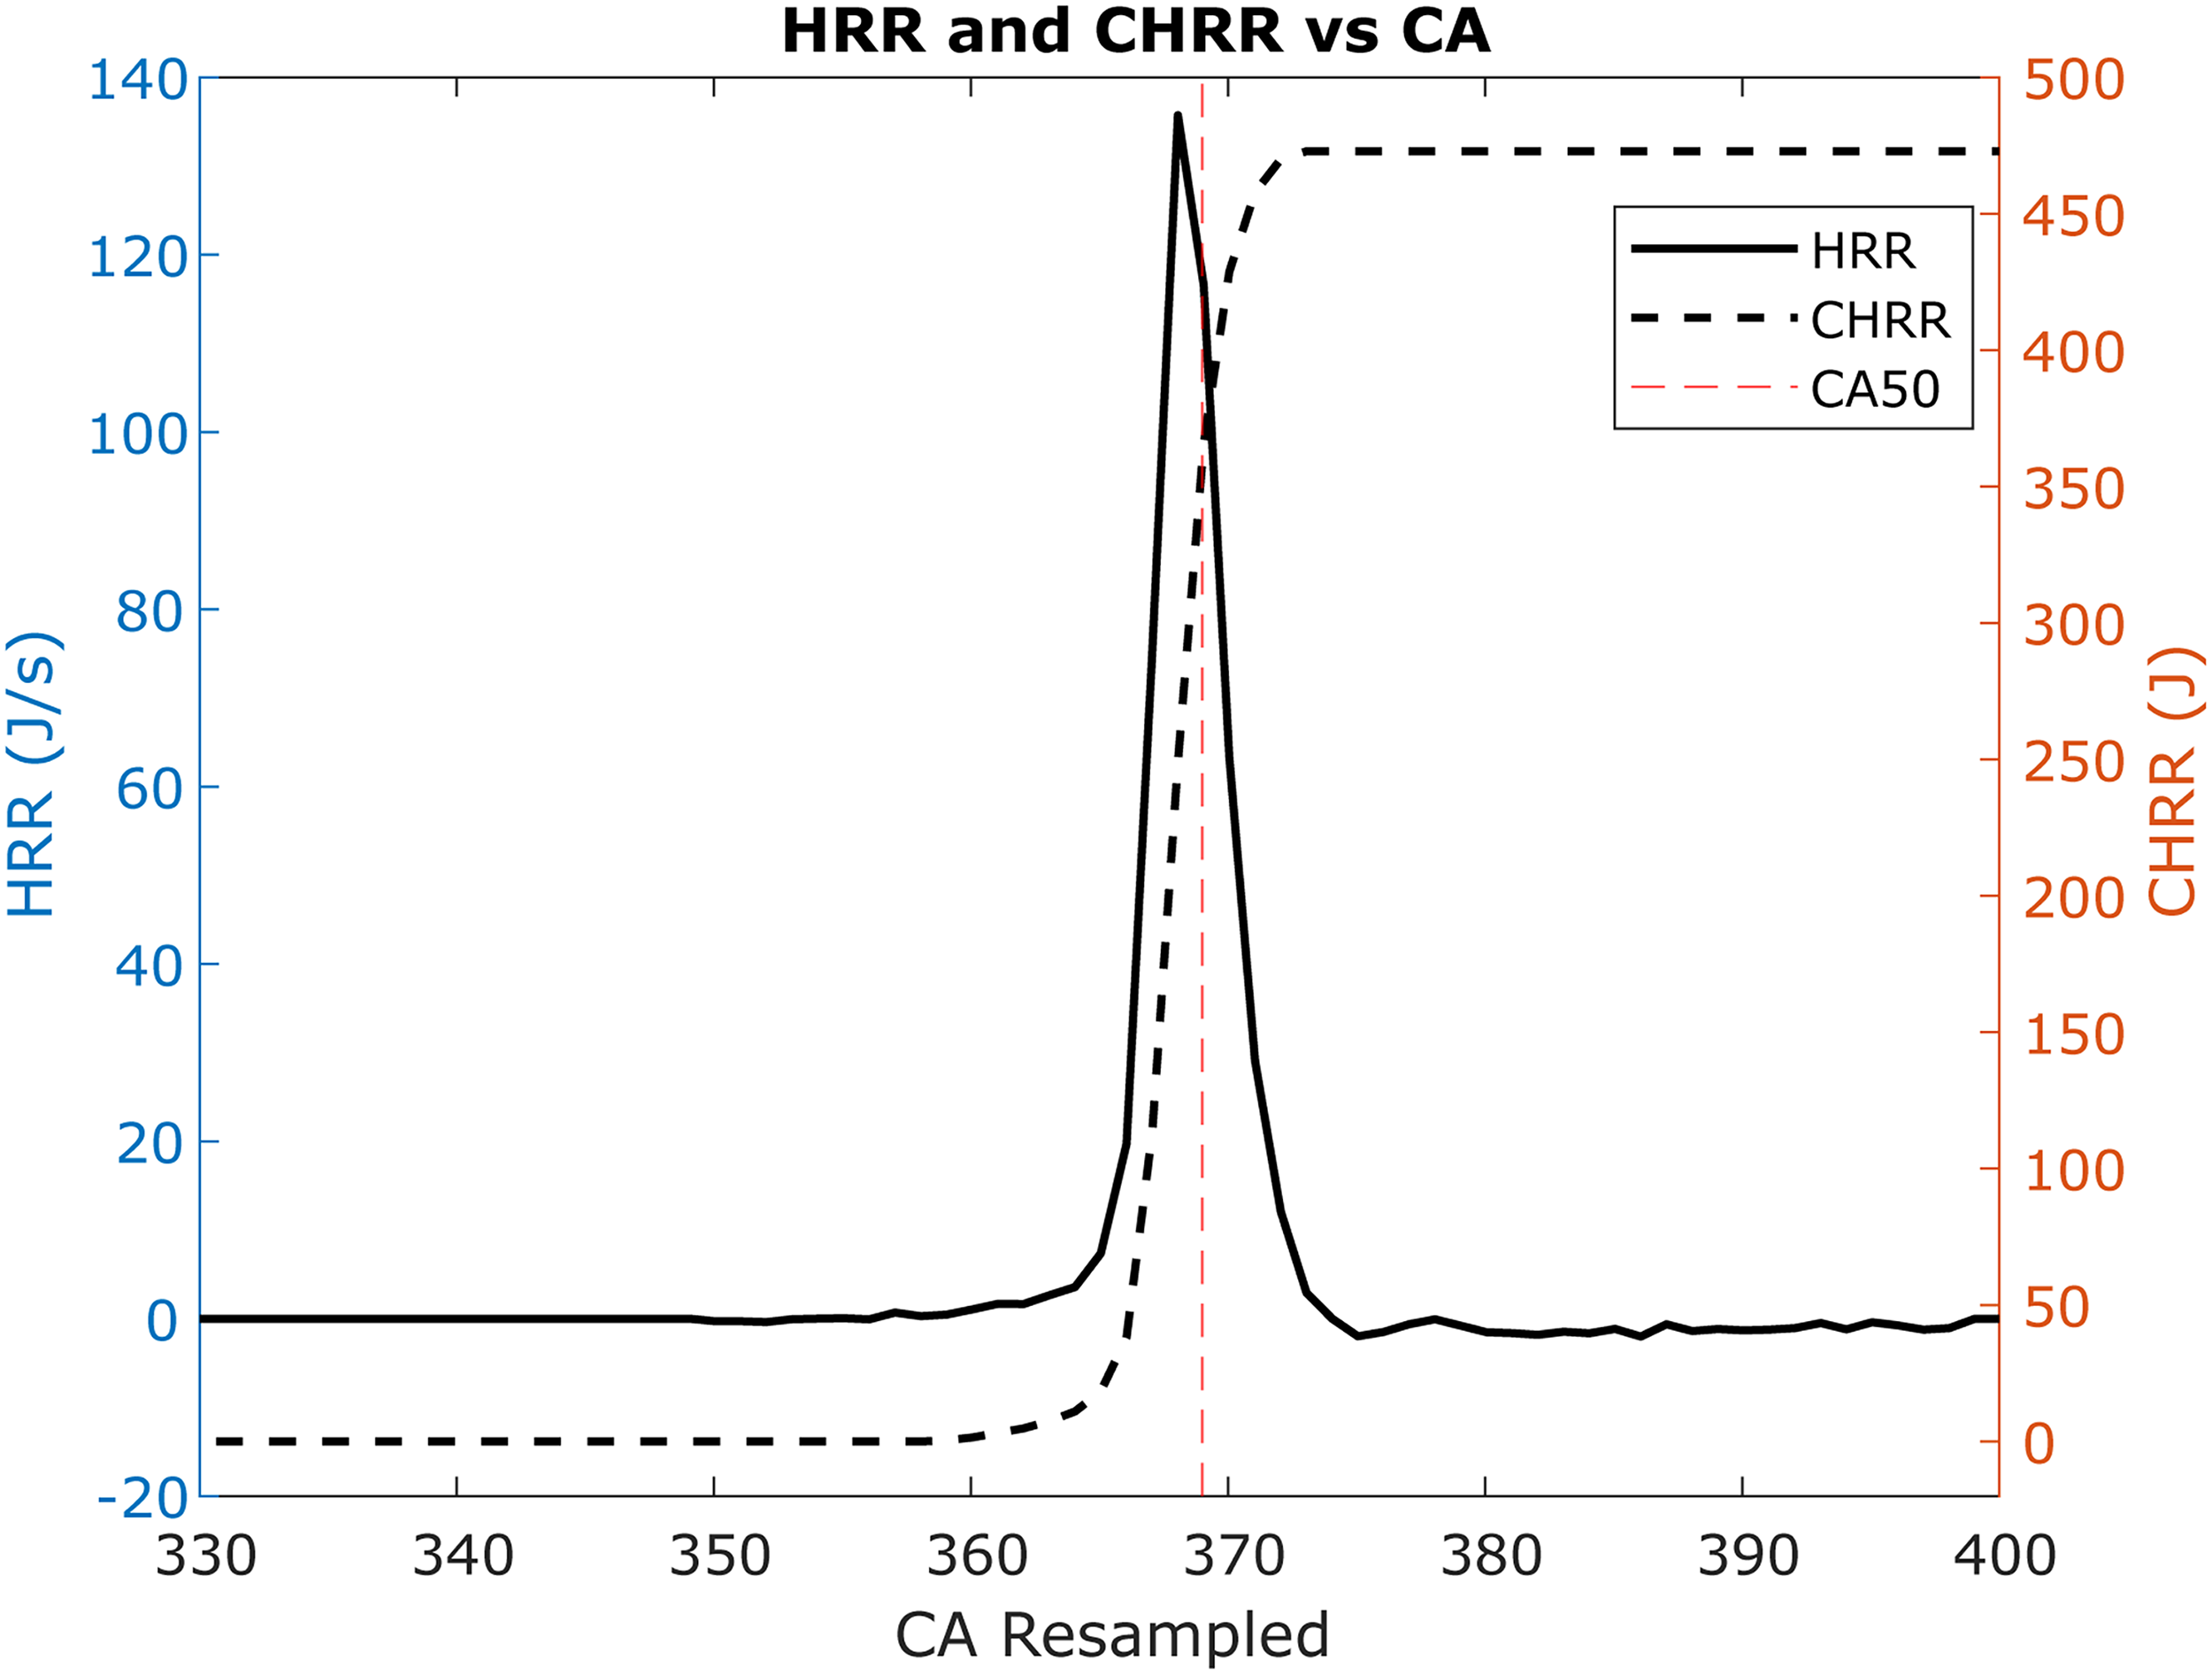
Heat release rate and cumulative heat release, with CA50 (the red dashed line). It shows that CA50 almost coincides with the maximum HRR.
The following section examines the suitable preprocessing metric for fault classification.
Fault classification
Figure 6 depicts the metrics discussed above (i.e., HRR, CHR and CA50) for the three cycles shown in Figure 2. Although the CHR curves are qualitatively similar across the cycles, a noticeable shift is observed in the CA50 values. The convergence of CHRs to the same amounts signifies that there is no misfire in the cycles. A comprehensive review of all 2750 cycles further confirmed the absence of misfire, affirming the stability of the HCCI engine during the test conditions.
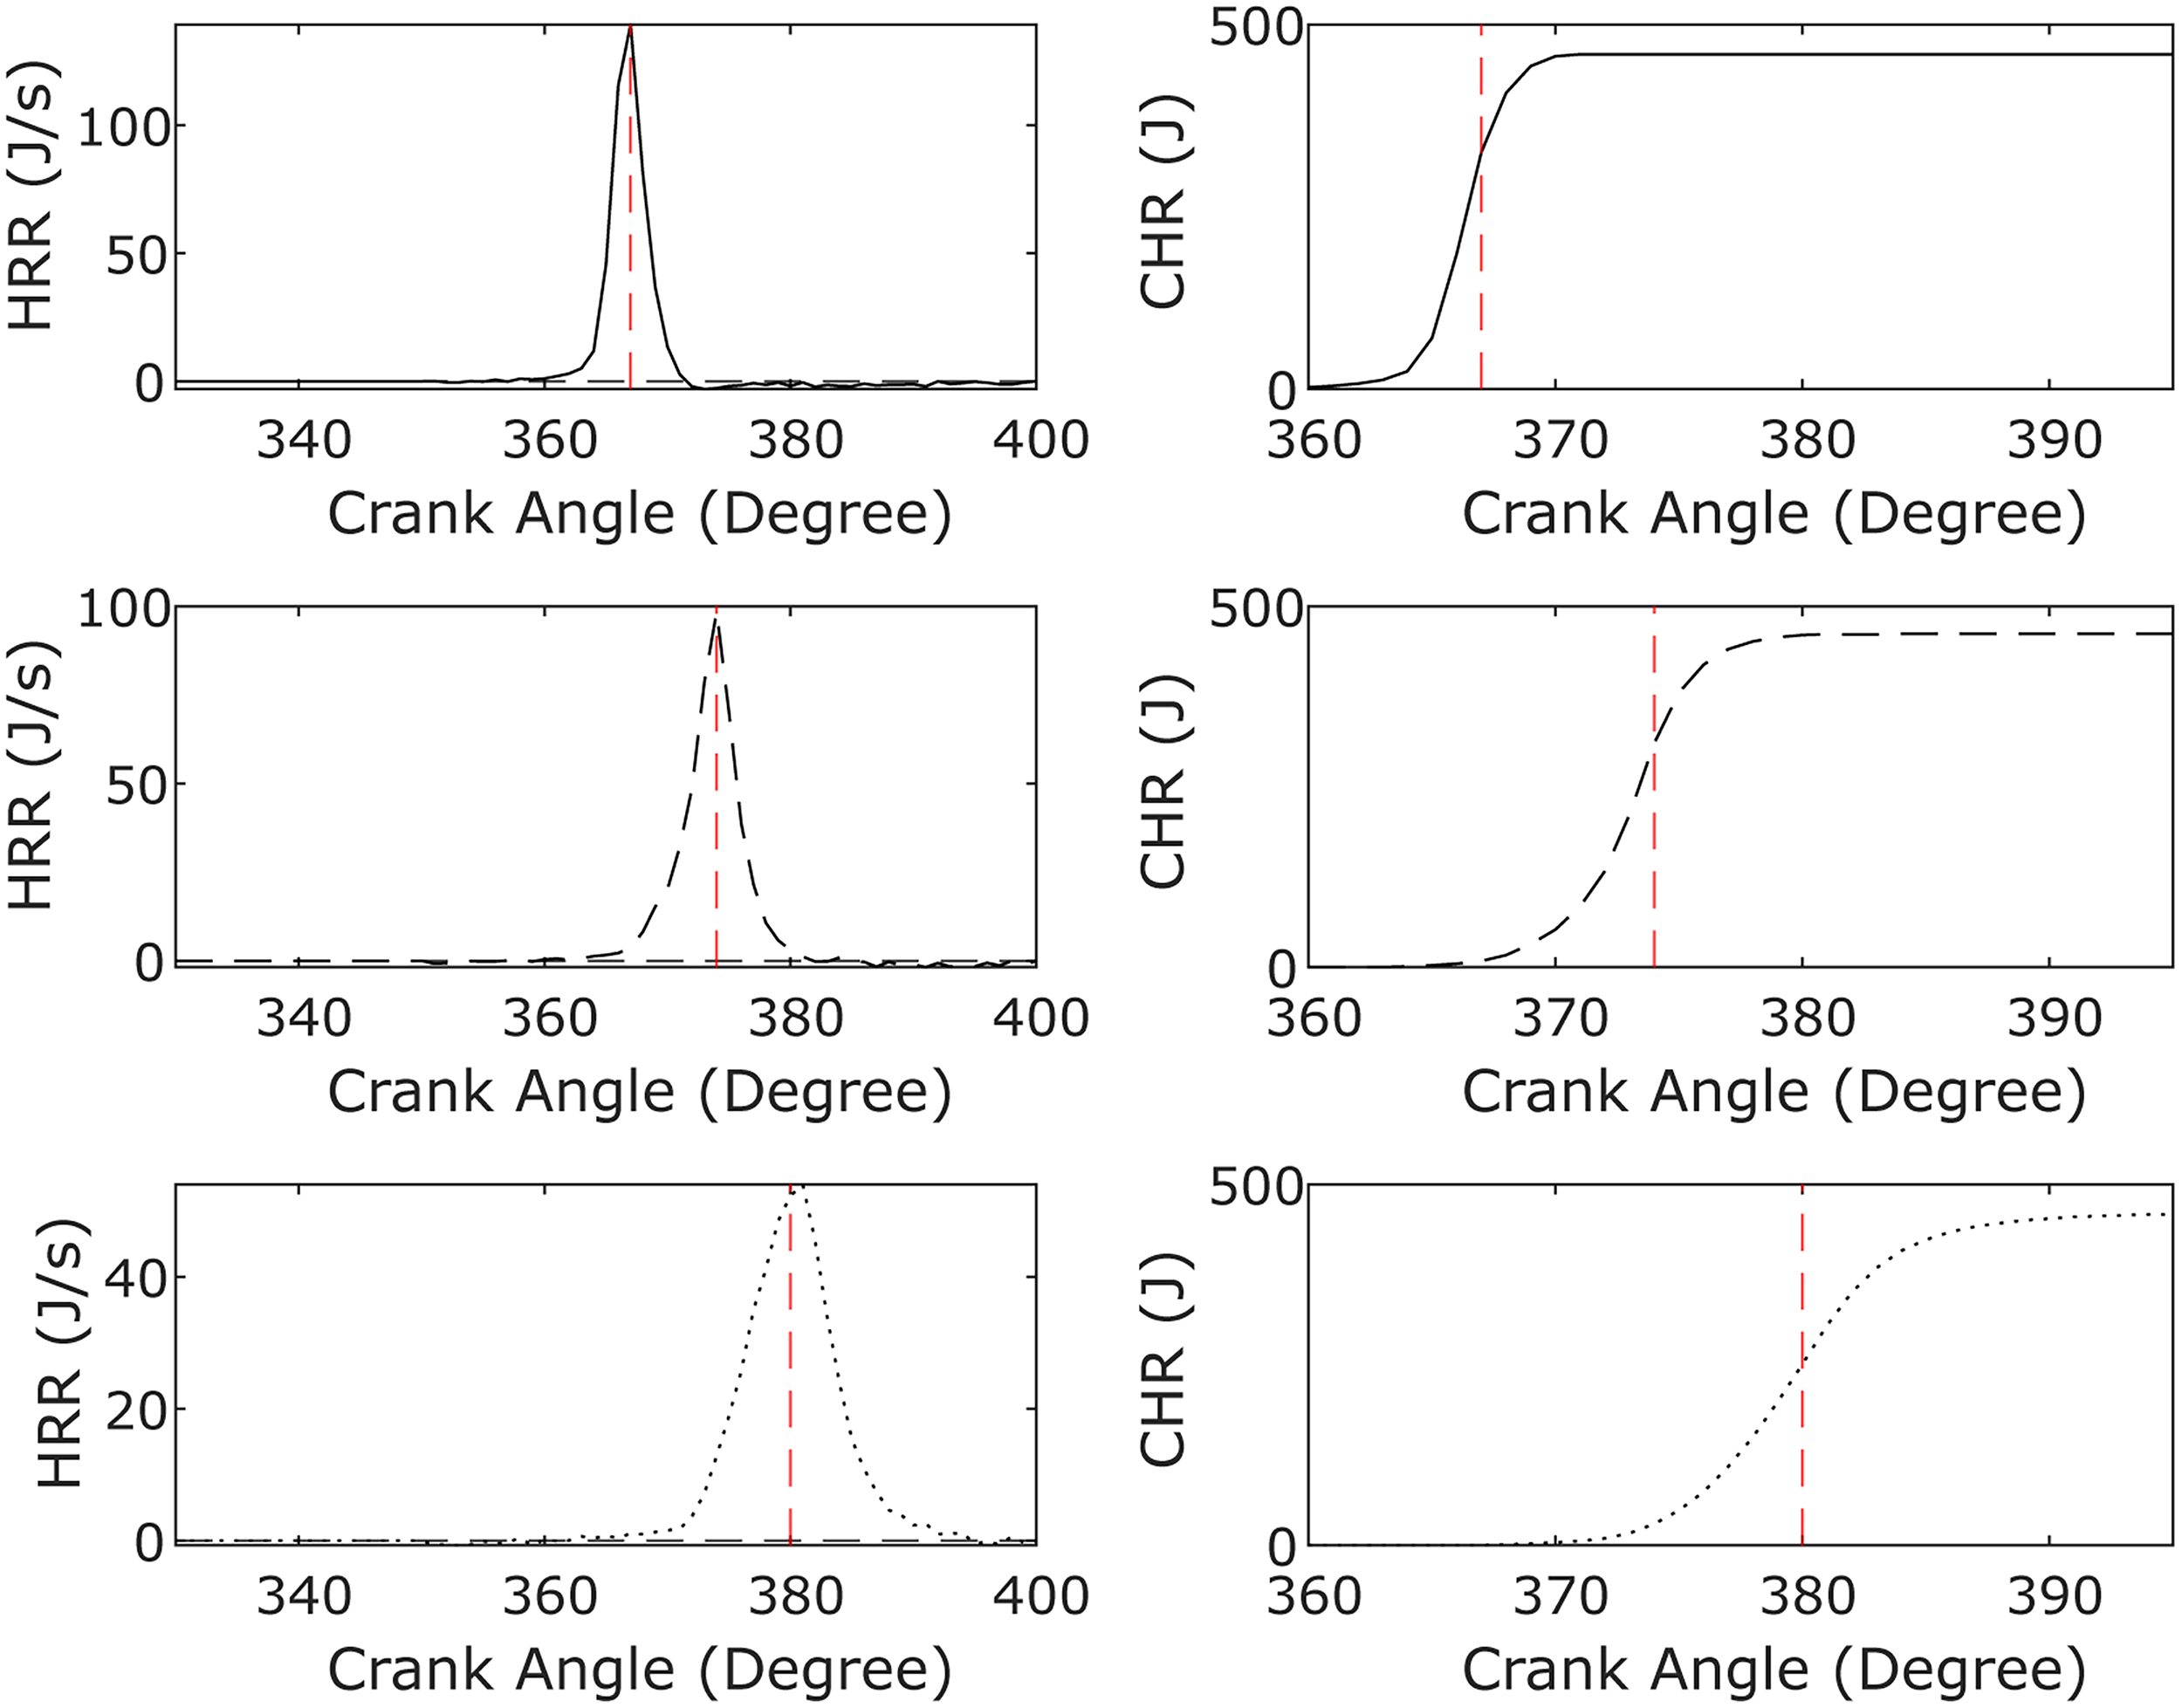
Heat release rate (HRR, left) and cumulative heat release (CHR, right) profiles of the three combustion cycles shown in Figure 2. The vertical red lines indicate the CA50 point in each case. From top to bottom: Normal Combustion, Late Combustion, and Very Late Combustion.
However, the combustion timing differences are apparent, with the second and third cycles exhibiting delayed combustion compared to the first. As mentioned, the best measure to determine this occurrence is CA50. Therefore, the CA50 points in the second and third cycles confirm the anomalies of “Late” and “Very Late Combustion” respectively. Accordingly, the observed abnormalities were categorized into two distinct classes, based on their CA50 combustion characteristics:
This definition was employed when analyzing and labeling all 2750 cycles to identify normal and faulty cycles. Table 3 provides the distribution of cycles across the defined classes.
Distribution of normal and abnormal cycles in the dataset.

Feature Extraction
Direct classification of raw vibration data is impractical due to its high dimensionality and complexity. Therefore, feature extraction was employed to derive meaningful and compact representations of the signal. In this study, a feature set consisting of six metrics was extracted, combining both frequency-domain and time-domain representations of the vibration signal.
The first four features include the three highest peak amplitudes obtained from the fast Fourier transform (FFT) and the root mean square (RMS) value of the spectrum. FFT peak amplitudes represent dominant frequency components of the vibration signal, which arise from both excitation sources (such as combustion-induced pressure fluctuations) and the structural dynamic response of the engine. The RMS value reflects the overall energy of the vibration signal and can be obtained from either the time domain or its frequency-domain representation.
An additional feature was defined as the signal energy computed in the time domain over the combustion phase of each engine cycle. This feature captures the intensity of vibration induced by combustion events and provides an indirect measure of combustion intensity reflected in the vibration signal.
A sixth feature was introduced to enhance sensitivity to abnormal combustion behavior. This feature is defined as the sum of FFT magnitudes within the low-frequency band. The inclusion of this feature is motivated by the observation that delayed combustion alters the distribution of vibration energy toward lower frequencies. From a physical perspective, late and very late combustion events are characterized by slower heat release rates and reduced in-cylinder pressure gradients. As a result, the excitation of high-frequency structural modes diminishes, leading to a relative increase in the prominence of low-frequency vibration components. This shift in spectral distribution is effectively captured by the proposed low-frequency summation feature, making it particularly relevant for detecting delayed combustion states.
In addition to the selected six features, several other candidate features were initially investigated during the feature screening stage, including statistical, spectral, and wavelet-based descriptors such as kurtosis, skewness, peak-to-peak amplitude, PSD-based features, and wavelet energy metrics. Feature importance analysis and ablation studies were subsequently performed to evaluate the discriminative capability of these features for combustion-state classification. Although several additional features demonstrated relatively high individual ranking scores, the final compact feature subset provided the best trade-off between classification accuracy, computational efficiency, and physical interpretability. The selected features were found to provide complementary information across both time and frequency domains, resulting in improved detection of delayed combustion states.
All extracted features were normalized prior to classification to ensure consistency and improve generalization performance. Normalization mitigates the effects of scale differences among features, enabling more stable and reliable learning across varying operating conditions Figure 7.
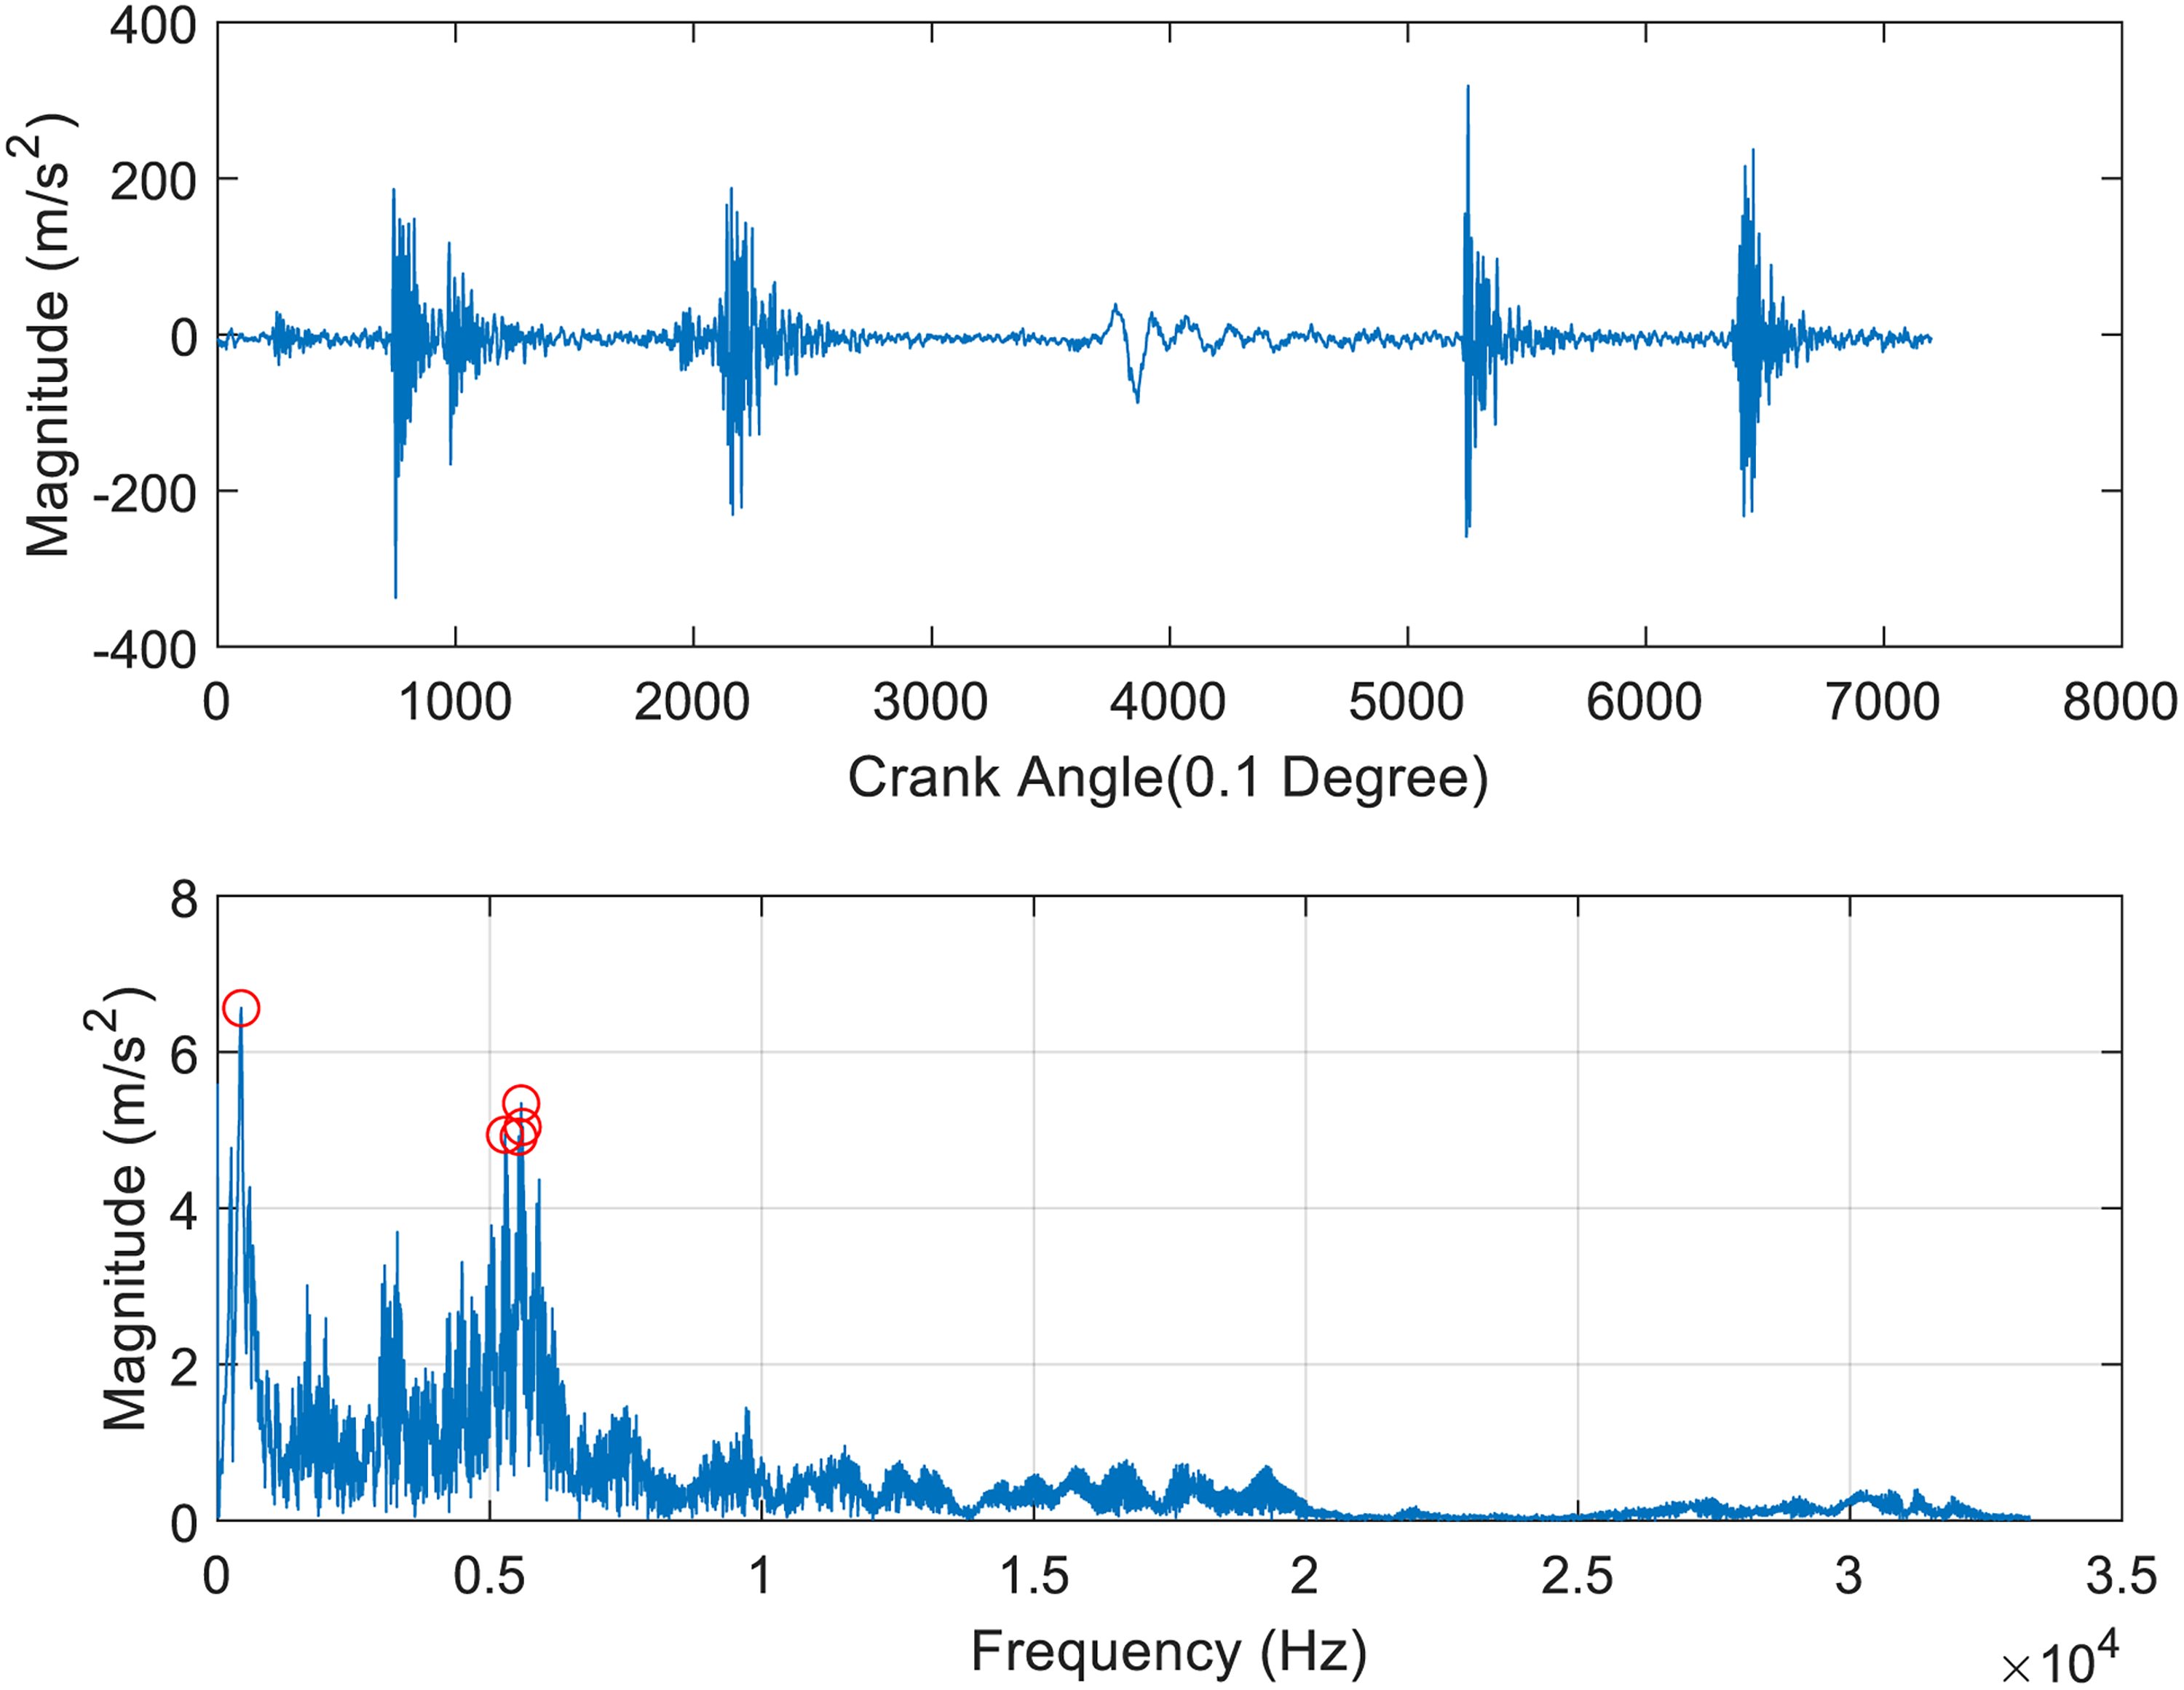
The vibration signal (top) in the time domain, and its fast Fourier transform (FFT) (bottom) showing the three highest peak amplitudes marked with red circles.
Diagnostic identifiers
To classify the combustion cycles, three distinct states were defined for all cycles, and six supervised machine learning methods were employed: K-nearest neighbors (KNN), Support Vector Machine (SVM), Artificial Neural Network (ANN), Convolutional Neural Network (CNN), XGBoost (XGB), and Random Forest (RF). The inclusion of multiple models enables a comparison across different classes of machine learning algorithms and offers additional insight into the effectiveness of the proposed feature engineering approach.
A one-dimensional convolutional neural network (CNN) was additionally evaluated as a benchmark deep learning approach. Unlike the feature-based machine learning models, the CNN was trained directly using raw vibration signal data, enabling automatic feature learning from the original waveform without manual feature engineering.
In contrast to deep learning approaches, which typically require large datasets and high computational resources, the selected models in this study are well-suited for structured feature-based inputs and limited data scenarios. By leveraging physically informed feature extraction, the adopted approach enables efficient training and robust performance while maintaining lower computational complexity and improved interpretability.
The dataset contains a significant class imbalance, comprising 2539 Normal, 143 Late Combustion, and 68 Very Late Combustion cycles. To mitigate potential bias toward the majority class, random undersampling of the Normal Combustion class was applied during model development while retaining all minority class samples. Random undersampling was preferred over synthetic oversampling approaches to avoid introducing artificially generated samples that may not reflect true engine combustion behaviour. Stratified train-test splitting and stratified 10-fold cross-validation were additionally applied to preserve class proportions across all training and evaluation folds. Evaluation during hyperparameter tuning focused on maintaining reliable performance across all classes, and final model configurations were selected based on their overall generalization capability.
As mentioned, the features used for classification were extracted from vibration data, while the labels for each cycle were derived from in-cylinder pressure data.
The machine learning algorithms were implemented using Python 3, employing its robust libraries for data processing, feature extraction, and supervised classification. This leverages the efficiency and practicality of using vibration-based features for combustion cycle classification in HCCI engines. Each machine learning method is now explained.
K-nearest neighbors (KNN)
K-nearest neighbors (KNN) is one of the most widely utilized algorithms in classification tasks, due to its simplicity and effectiveness. As a non-parametric method, KNN classifies an unlabeled instance based on the class labels of its K nearest neighbors in the feature space. This approach relies on the assumption that instances in proximity are more likely to belong to the same class.
The parameter 
After computing the distances, the algorithm identifies the
Support vector machine (SVM)
Support vector machine (SVM) is a powerful and widely used supervised learning algorithm which is particularly effective for classification tasks. SVM aims to find the optimal hyperplane that separates instances of different classes in the feature space. It is especially well-suited for binary classification problems, though extensions to multi-class classification are also common.
The fundamental principle of an SVM is to project the data from the original input space into a higher-dimensional feature space through a kernel function. Linear separation becomes feasible in this transformed space, and the classifier seeks an optimal hyperplane that maximizes the separation margin between different classes. This margin maximization enhances both the generalization performance and the confidence of classification results.
For linearly separable datasets, the SVM constructs the separating hyperplane 
When the data is not perfectly separable, the slack variables 
Lagrange multipliers 
Equation (8) specifies the resulting decision function.26,27
A key feature of SVMs is their capacity to model complex, nonlinear relationships in heterogeneous data through the application of various kernel functions, which include linear, polynomial, radial basis function (RBF), and sigmoid kernels. These functions effectively map the input data into a higher-dimensional feature space where a linear decision boundary can be constructed.
Among these kernels, the radial basis function (RBF) kernel is particularly prominent due to its strong generalization capabilities in complex, nonlinear classification problems. Formally, the RBF kernel function is calculated using (9).
The value of
Conversely, a large value of
The
The optimal performance of an SVM with an RBF kernel depends heavily on careful tuning of both
The training data was partitioned into ten equally sized “folds.” In each of the ten iterations, nine of these folds were used to train the SVM model, while the remaining single fold was used for validation. This process was repeated ten times, with each fold serving as the validation set exactly once.
Once the optimal hyperparameters were determined, the SVM model was retrained on the entire training set, using the best
Artificial neural network (ANN)
Artificial neural networks (ANNs) are a powerful class of machine learning models designed to mimic the human brain’s structure. This design makes them particularly effective at capturing complex, non-linear relationships within data, making them an ideal choice for challenging classification tasks.
The core of an ANN comprises interconnected layers of nodes, or ”neurons.” These layers include an input layer for receiving data, one or more hidden layers where the bulk of the computation occurs, and an output layer producing the final prediction. Each individual neuron processes data by calculating a weighted sum of its inputs before applying an activation function, such as rectified linear unit (ReLU) or sigmoid. This function introduces non-linearity, allowing the network to learn intricate patterns. The output of this function is then passed as input to the neurons in the next layer.
The true power of an artificial neural network (ANN) lies in its ability to learn from data. The network learns by continuously adjusting the weights connecting its neurons. This process is driven by backpropagation, an algorithm that calculates the contribution of each weight to the overall prediction error. This error, quantified by a loss function, is then minimized using an optimization algorithm like gradient descent, Newton’s method, or the conjugate gradient method. Gradient descent iteratively updates the weights in the direction that most efficiently reduces the loss, teaching the network to make more accurate predictions over time. Newton’s method uses the Hessian (second derivatives) for faster convergence near the optimum, while the conjugate gradient method improves over steepest descent by combining current gradient information with previous search directions, avoiding zig-zag inefficiencies.
The final layer of an ANN is tailored to the specific type of classification problem. For binary classification, the output layer uses a single neuron with a sigmoid activation function. This function squashes the output into a value between 0 and 1, which can be interpreted as the probability of the input belonging to the positive class.
For multi-class classification (e.g., classifying combustion cycle data into multiple categories), the output layer contains a neuron for each class. A softmax function is applied to these neurons, converting their raw outputs into a probability distribution. The neuron with the highest probability indicates the network’s predicted class. This structured approach allows ANNs to handle a wide range of classification challenges effectively.
The study used Optuna to pinpoint the ideal artificial neural network (ANN) architecture. Optuna is a powerful framework for automated hyperparameter optimization. 28 It streamlines the search for the best model configuration, moving beyond manual trial-and-error. Consistent with our approach for the SVM classifier, a 10-fold cross-validation strategy was employed to ensure robust model evaluation and to prevent overfitting during the tuning process.
Random Forest and XGBoost
In addition to the previously introduced classifiers, tree-based ensemble methods, namely Random Forest (RF) and Extreme Gradient Boosting (XGBoost), were included to further evaluate the effectiveness and robustness of the proposed vibration-based feature set. These models represent two fundamentally different ensemble strategies, namely bagging and boosting, providing complementary perspectives on classification performance.
Random Forest is a bagging-based ensemble method that constructs multiple decision trees using randomly sampled subsets of the training data and feature space. The final prediction is obtained through majority voting across all trees, which helps reduce variance and generally improves generalization performance.
XGBoost, on the other hand, is a gradient boosting algorithm that builds trees sequentially, where each new tree is trained to correct the errors of the previous ensemble. By optimizing a differentiable loss function, XGBoost effectively captures complex patterns in the data. In addition, it incorporates regularization techniques and subsampling strategies that help control model complexity and mitigate overfitting.
For both RF and XGBoost, hyperparameter optimization was performed using randomized search with cross-validation.
Metrics
A primary challenge during classification was significant class imbalance in the dataset, where most samples belonged to the “Normal” class. Relying solely on accuracy as a performance metric in such scenarios can be misleading, as it may not truly represent the model’s effectiveness. To overcome this limitation, the F1-score was employed as a more appropriate metric for assessing classification models in the presence of imbalanced datasets. The F1-score offers a balanced perspective by incorporating both precision and recall into a single measure.
Precision quantifies the proportion of correctly predicted positive instances out of all instances predicted as positive, while recall reflects the proportion of correctly identified positive instances out of all actual positive instances. The F1-score takes the harmonic mean of precision and recall, giving equal importance to both metrics, thus making it particularly effective for evaluating models in imbalanced data conditions. It is mathematically defined as the harmonic mean of precision and recall, providing a comprehensive measure of the model’s performance in such challenging scenarios. The F1-score, precision, and recall are expressed in (10)–(12).


True positives (TP) represent the number of positive instances correctly predicted by the model. False positives (FP) refer to the number of instances incorrectly classified as positive, while false negatives (FN) indicate the number of actual positive instances misclassified as negative. Leveraging the F1-score provides a more comprehensive and equitable evaluation of model performance, particularly in scenarios involving imbalanced datasets. This metric ensures that both precision and recall are considered, providing a balanced measure of the model’s ability to handle such data distributions effectively.
Results and discussion
This section investigates and discusses the performance of the diagnosis system. The evaluation considers six supervised machine learning models: K-nearest neighbors (KNN), support vector machines (SVM), artificial neural networks (ANN), convolutional neural networks (CNN), Random Forest (RF), and XGBoost.
The section is divided into three parts. First, we detail the hyperparameter search and model tuning procedures for each algorithm, describing how optimal configurations were determined to maximize performance. Second, we present and analyze the classification results, comparing the models in terms of accuracy and effectiveness to identify the most suitable approach for the diagnosis system. Finally, we evaluate the real-time computational performance of the models, assessing their inference and total processing times to determine their feasibility for real-time deployment.
Hyperparameter search and model tuning
The first step in evaluating the machine learning approaches was to split the dataset into an 80% training set and a 20% test set. The training set was used to tune the hyperparameters and to build the model using 10-fold cross-validation, while the test set was held separate for the final, unbiased performance evaluation.
K-nearest neighbors (KNN)
Analysis through a series of tests consistently showed that the value of
Support vector machine (SVM)
Figure 8 visualizes the results of the grid search, showing the relationship between the hyperparameter values (
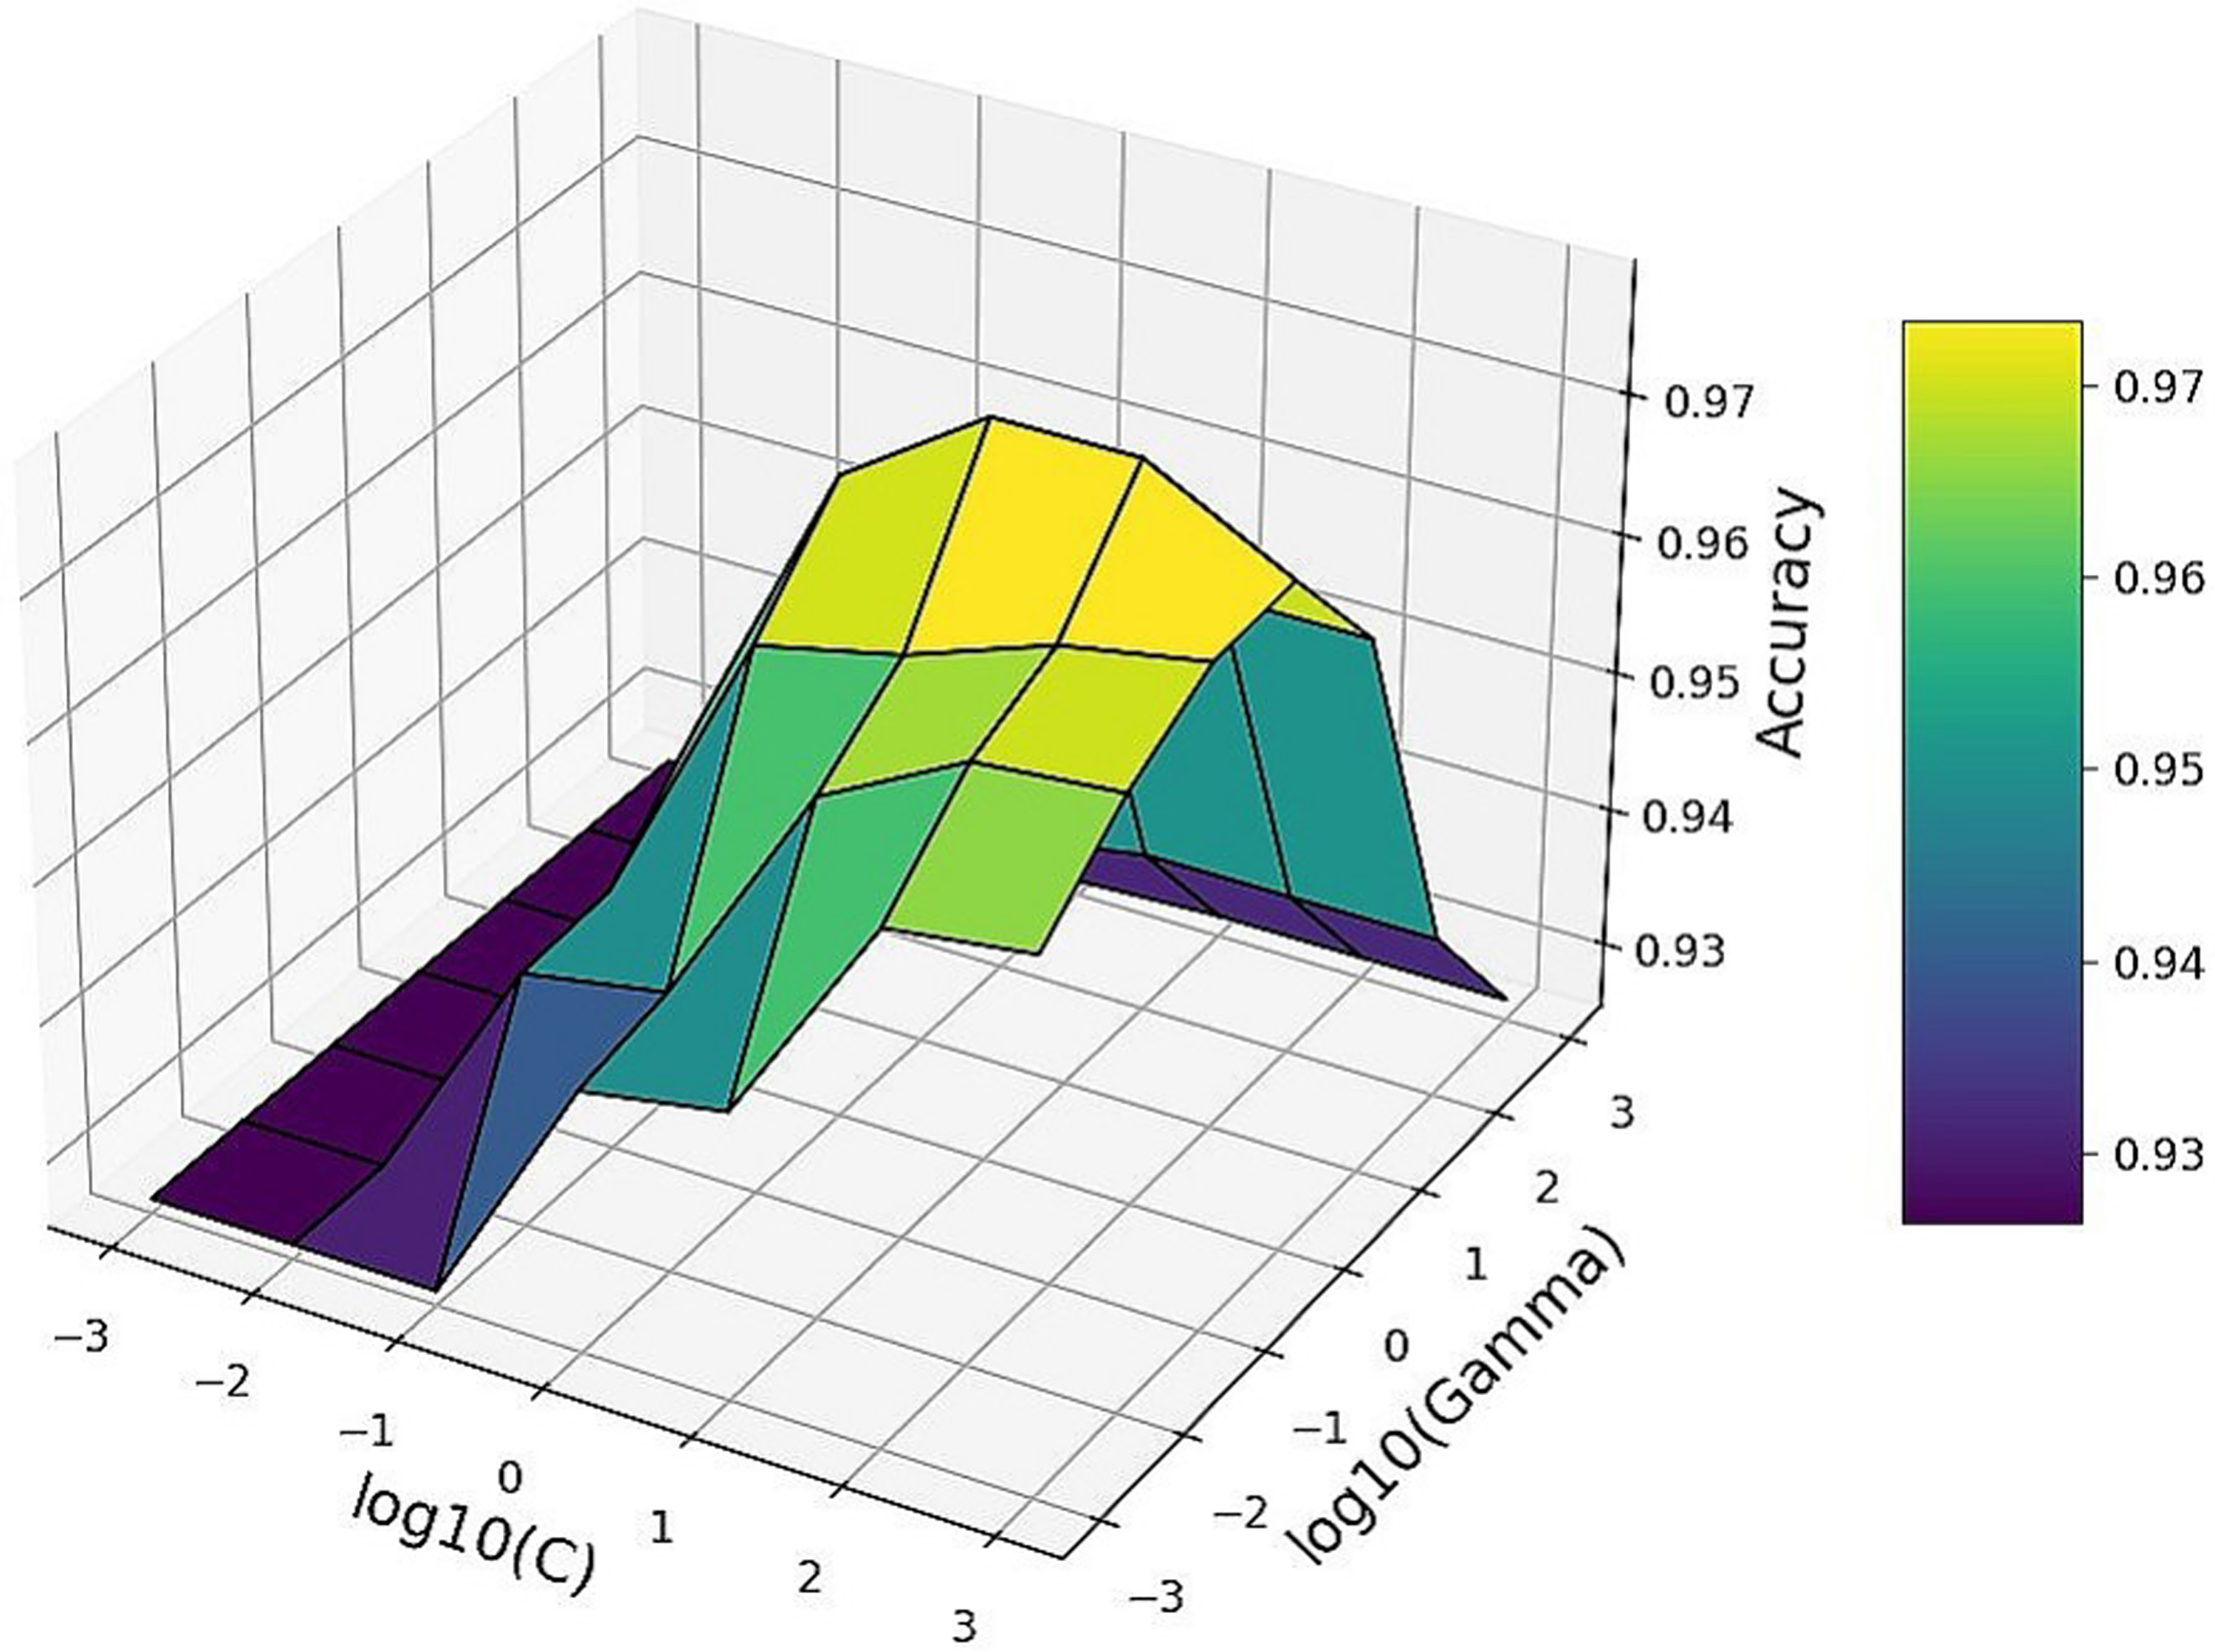
Grid search results showing the classification accuracy of the support vector machine (SVM) model across different combinations of the hyperparameters C (log10 scale) and Gamma (log10 scale).
The combination of
Finally, the model’s performance was evaluated on the withheld 20% test set. This final evaluation provides an unbiased estimate of the model’s generalization performance, indicating how well it is likely to perform on new, unseen data.
Artificial neural network (ANN)
As mentioned, Optuna was used to comprehensively explore a wide range of hyperparameters, including the number of hidden layers, the number of neurons per layer, batch size, and learning rate. The optimization process was guided by the average cross-validation accuracy, intelligently exploring the hyperparameter space to find the most promising configurations. Figures 9 to 11 depict optimization history, parameter importance, and slice plots. They illustrate the search process to identify the most influential hyperparameters and guided convergence towards the best-performing configuration.
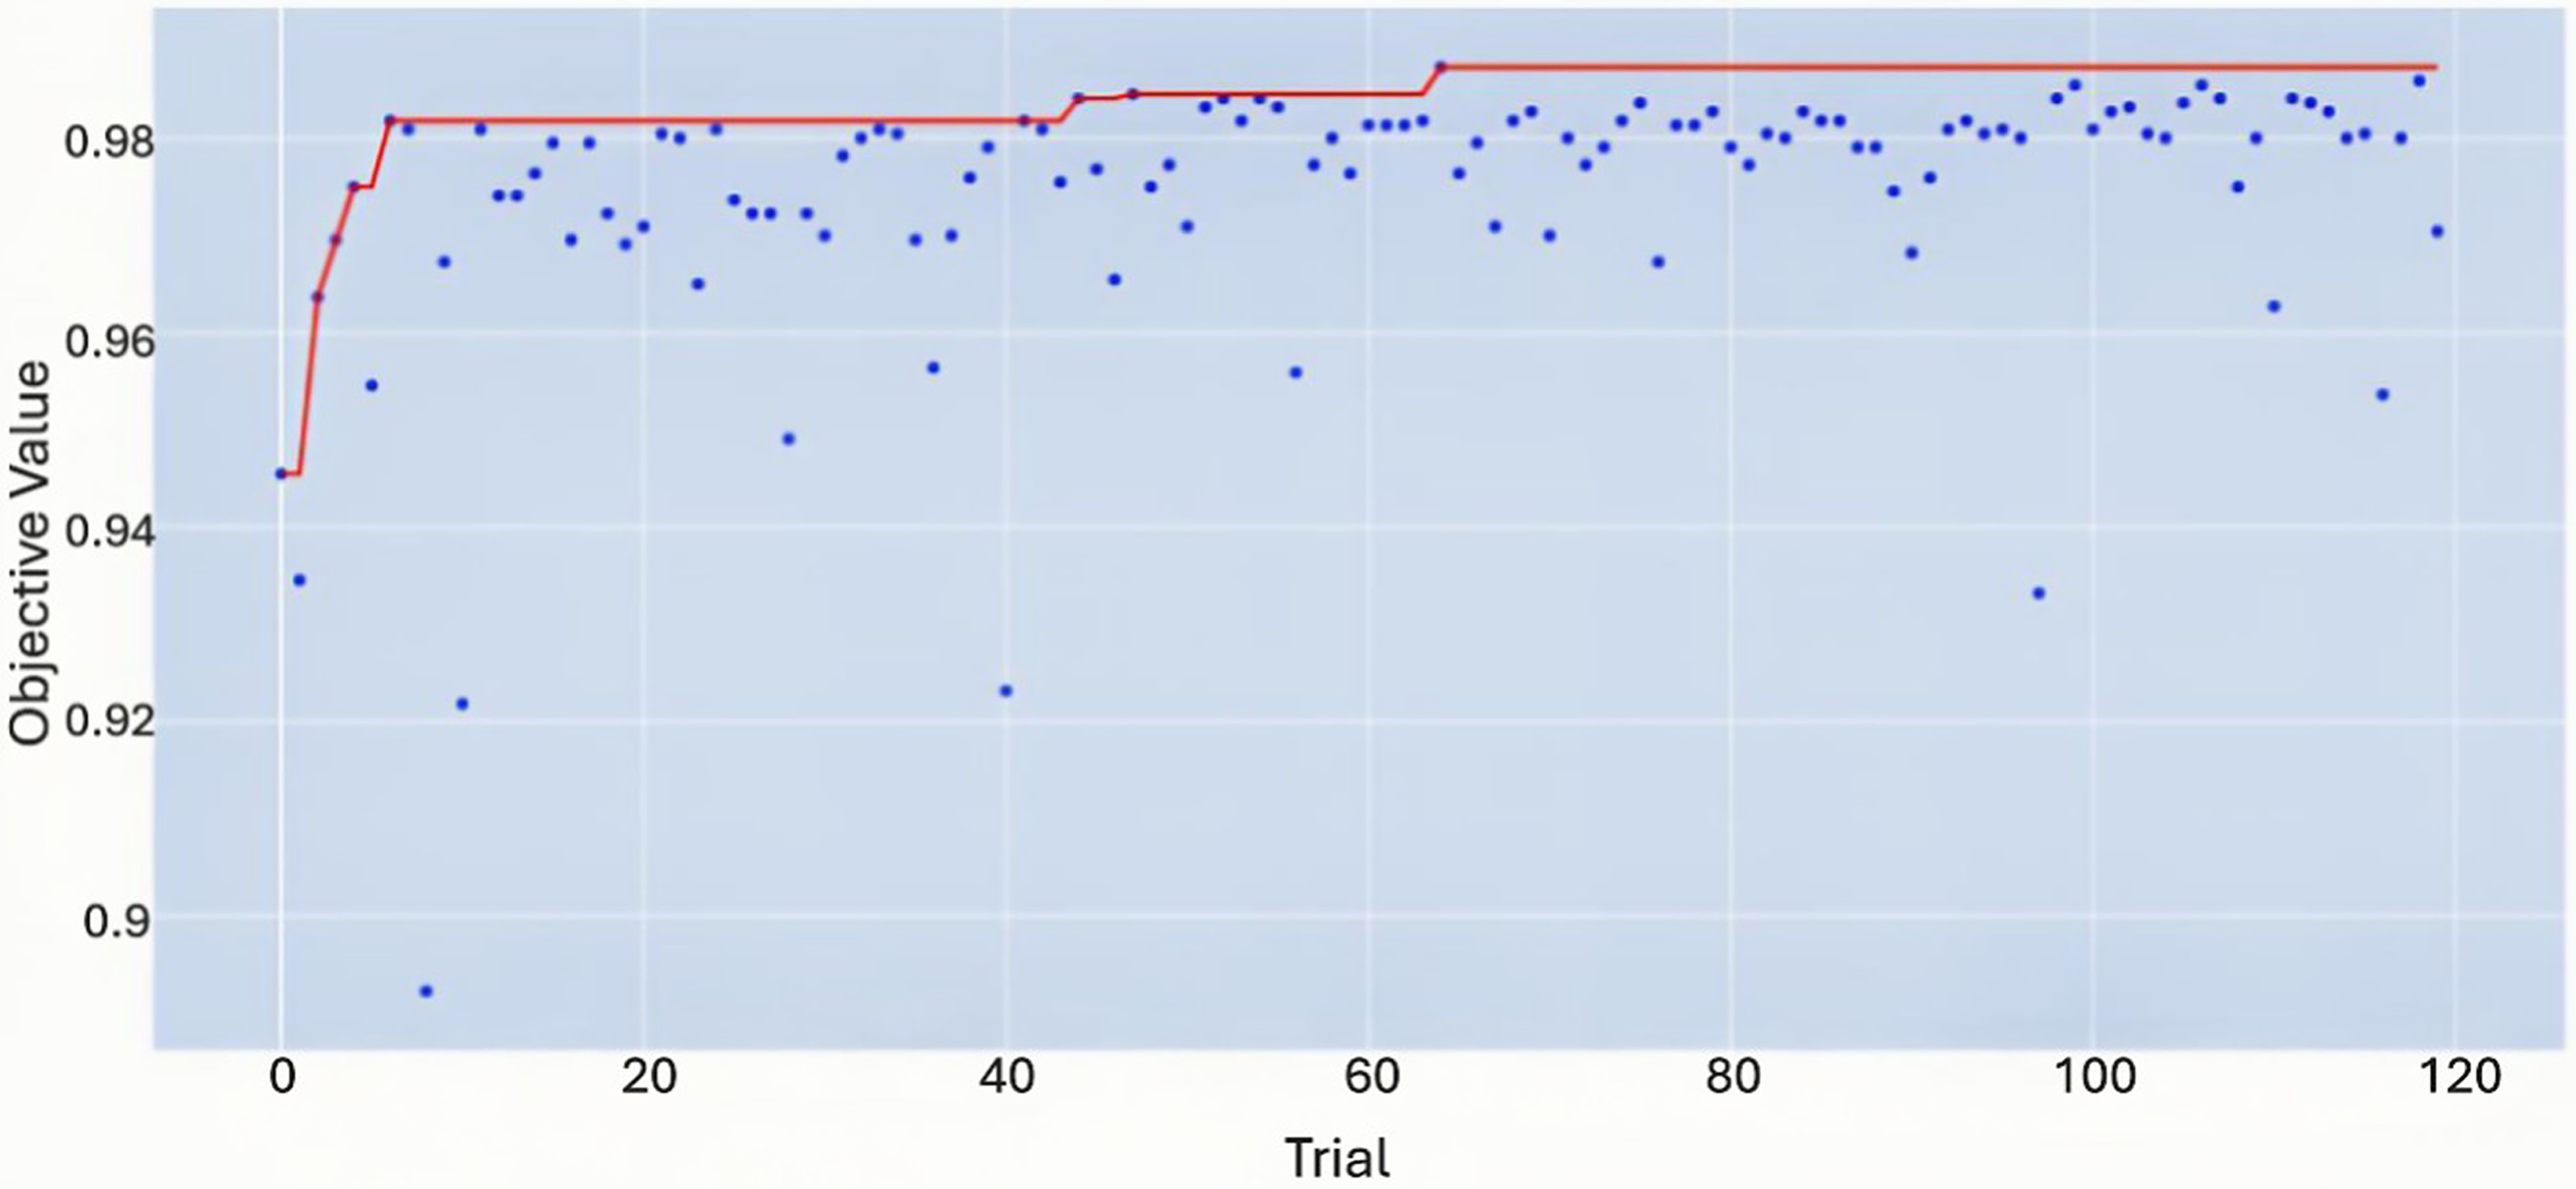
Optimization history from the Optuna hyperparameter search for the artificial neural network (ANN). The plot displays the objective value for each individual trial (blue dots) and the best value found up to that trial (red line).
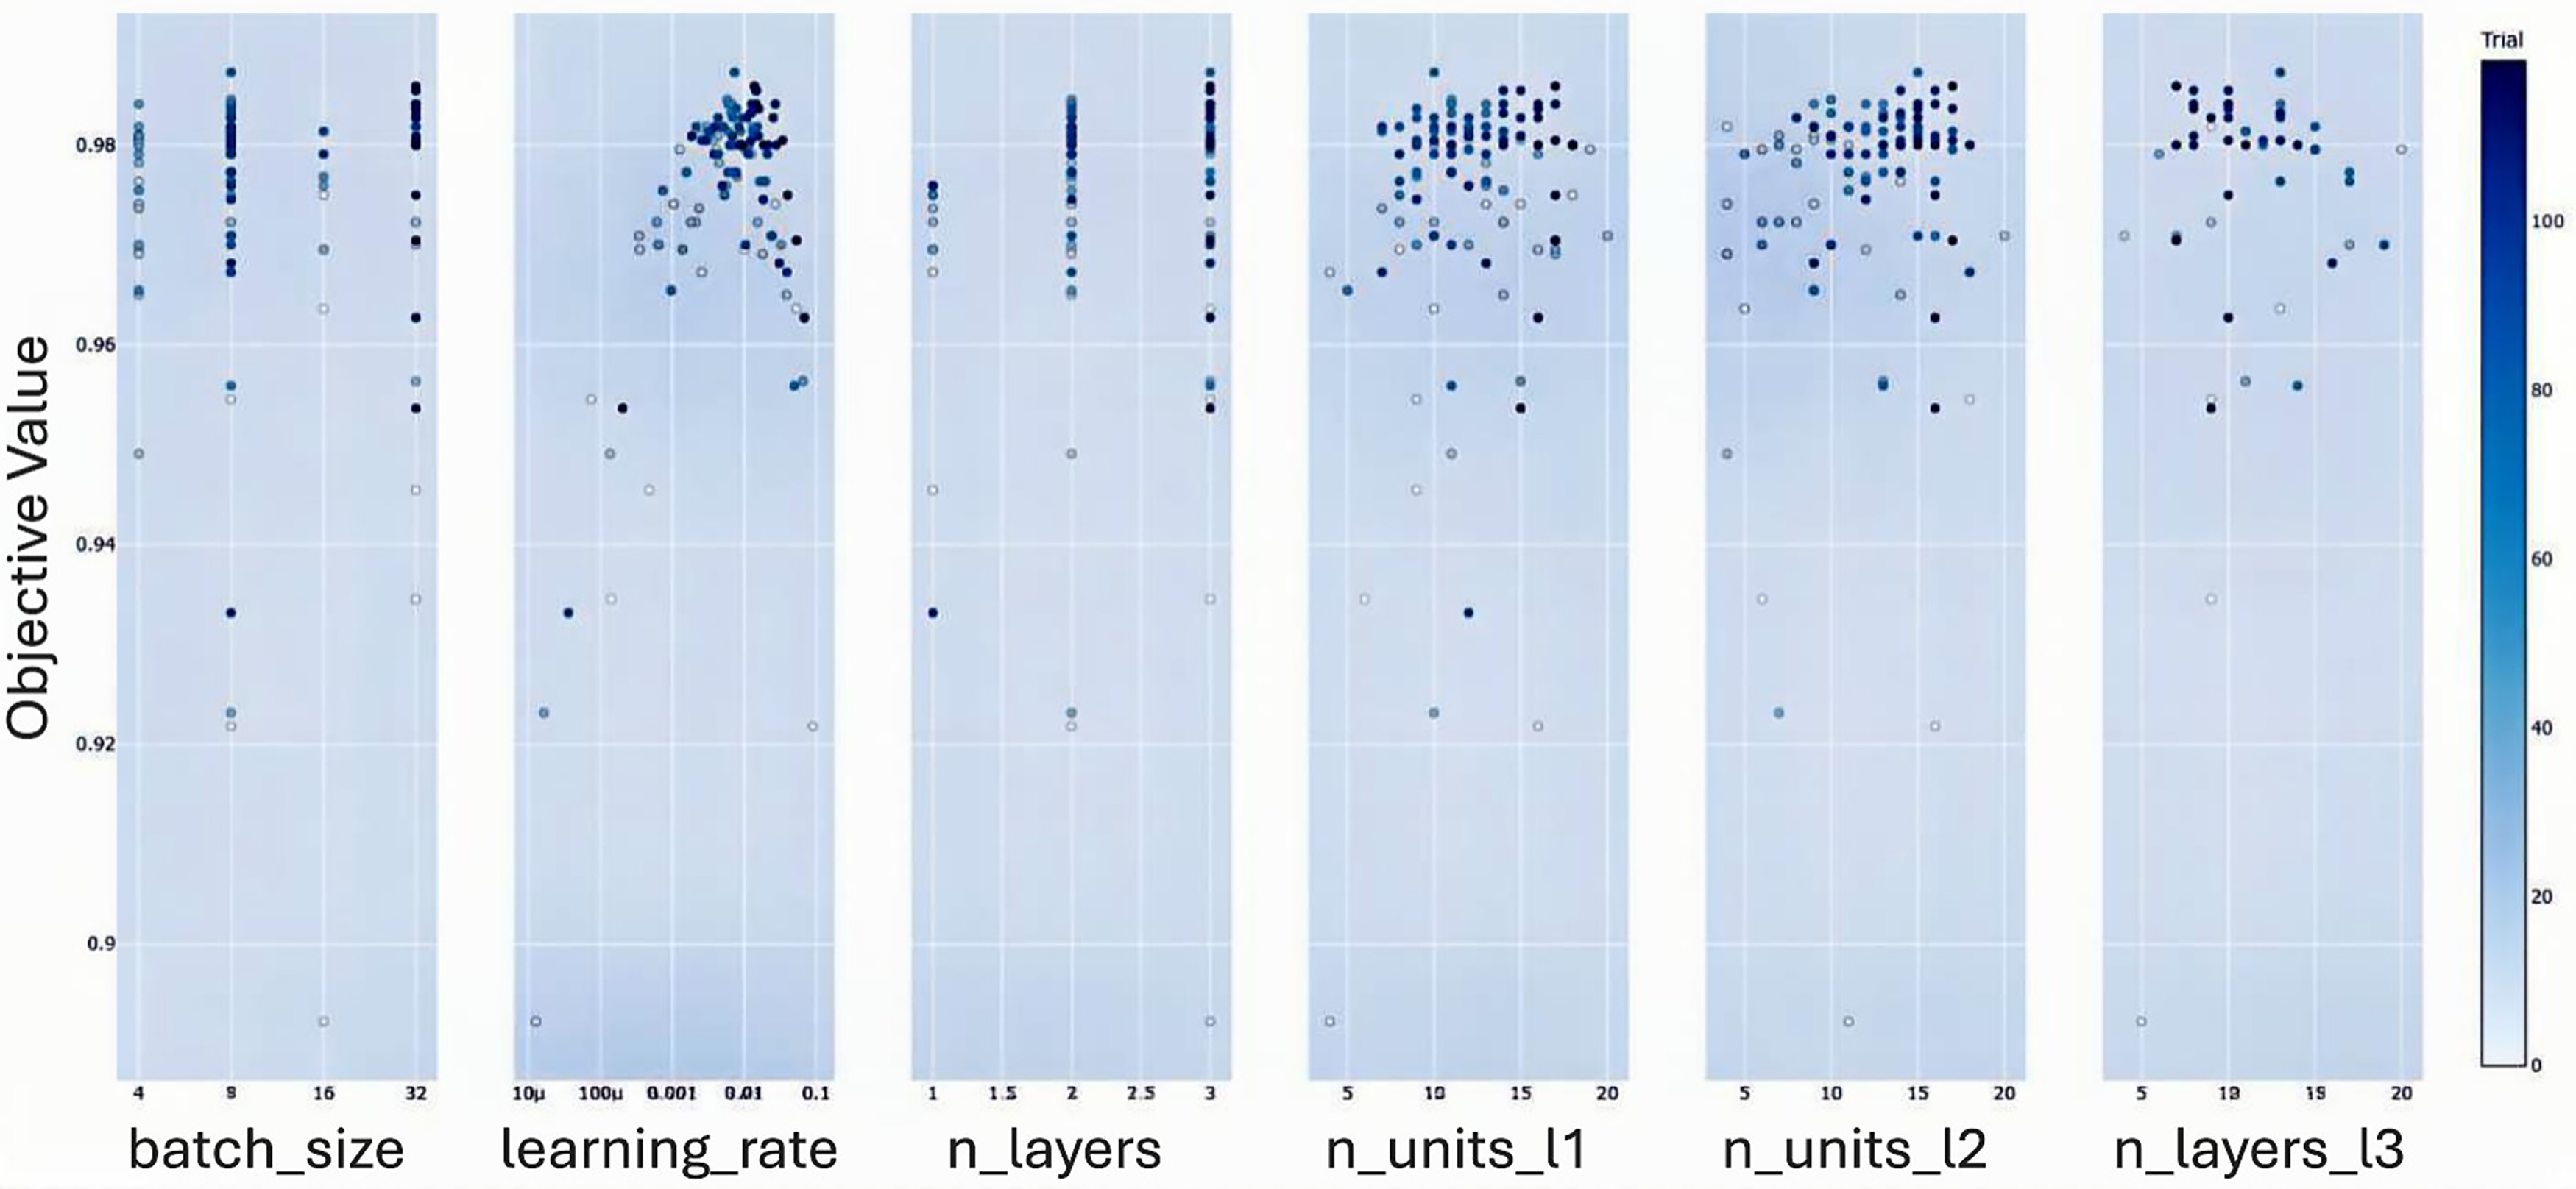
Slice plot, showing the relationship between each hyperparameter and the objective value achieved. The color bar indicates the trial number, illustrating the evolution of the search.
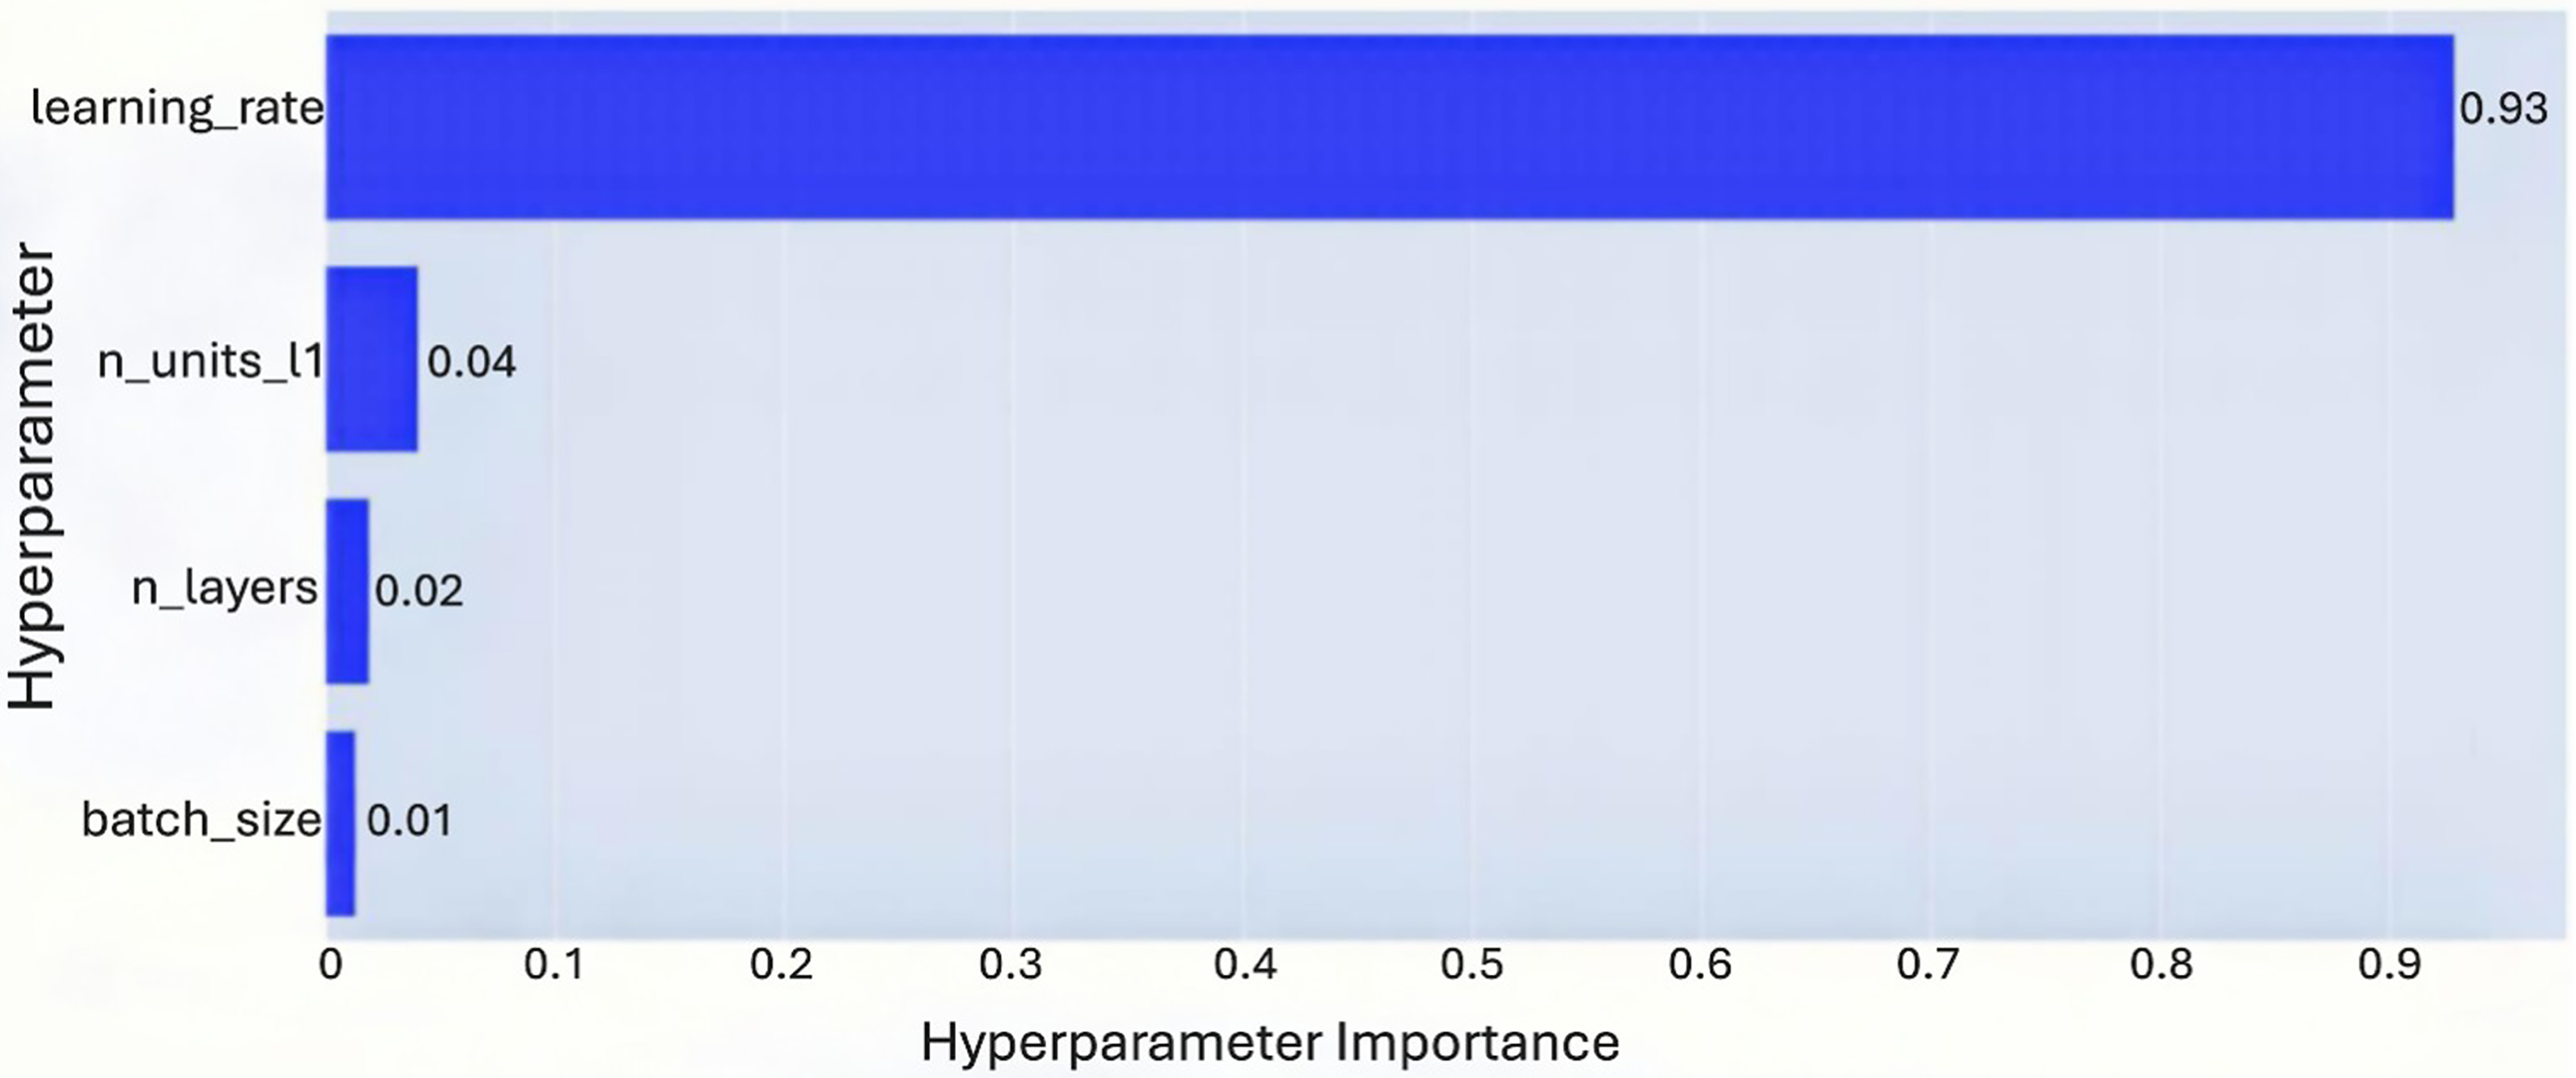
Hyperparameter importance for the ANN model as determined by the Optuna framework. The importance is a measure of how much each hyperparameter contributed to the model’s performance variation.
The optimization process culminated in the selection of a specific, high-performing ANN architecture. This final model, chosen for its superior average cross-validation accuracy, yielded the following optimal values:
Three hidden layers with neuron counts of 10, 15, and 13. A learning rate of 0.00728. A batch size of 8.
This architecture, specifically trained with a
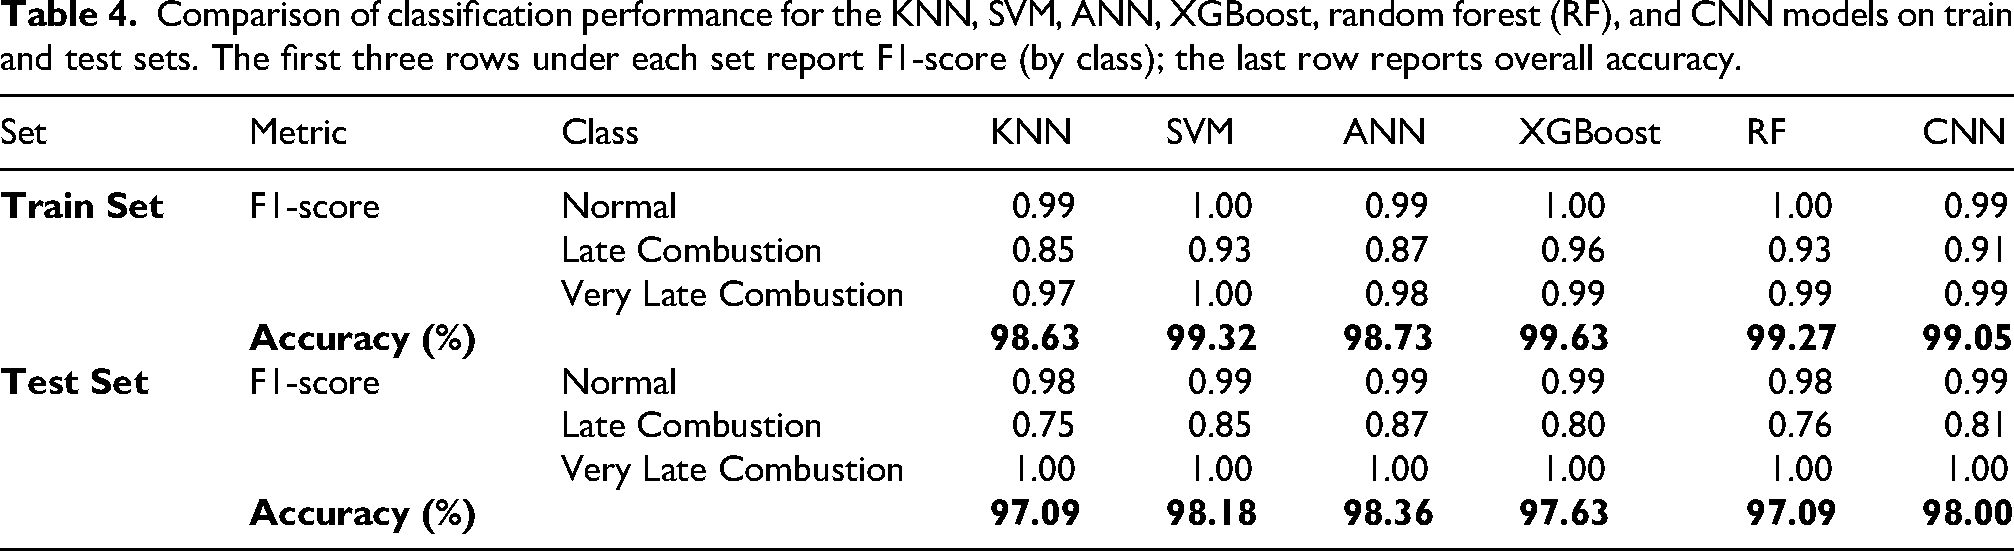
Comparison of classification performance for the KNN, SVM, ANN, XGBoost, random forest (RF), and CNN models on train and test sets. The first three rows under each set report F1-score (by class); the last row reports overall accuracy.
Random Forest and XGBoost
In addition to KNN, SVM, and ANN, tree-based ensemble methods, namely Random Forest and XGBoost, were also evaluated. For these models, hyperparameter optimization was performed using randomized search with cross-validation. This approach allows efficient exploration of the hyperparameter space without the computational cost of exhaustive grid search. The selected configurations were determined based on cross-validation performance, aiming to achieve a balance between model complexity and generalization capability while mitigating overfitting, particularly given the relatively small dataset size and class imbalance.
Classification results
Table 4 presents the accuracy and F1-score results for each class, evaluated on both the training and test datasets. These results provide further insights into the classification performance of six machine learning models: K-nearest neighbors (KNN), Support Vector Machine (SVM), Artificial Neural Network (ANN), Extreme Gradient Boosting (XGBoost), Random Forest (RF), and Convolutional Neural Network (CNN).
Overall, the diagnosis system demonstrates strong performance across all models, particularly in detecting anomalous combustion events (Late and Very Late Combustion). On the training set, all models achieved high F1-scores. SVM, XGBoost, and RF reached perfect scores (1.00) for the Normal class, while SVM also achieved a perfect score (1.00) for Very Late Combustion. The overall training accuracy is highest for XGBoost (99.63), followed by SVM (99.32), RF (99.27), CNN (99.05), ANN (98.73), and KNN (98.63), indicating excellent fitting across all models.
On the unseen test data, ANN achieved the highest overall accuracy (98.36), closely followed by SVM (98.18). XGBoost (97.63), KNN (97.09), and RF (97.09) also demonstrate strong and comparable performance.
In terms of class-wise detection, ANN again shows the best performance for Late Combustion, achieving the highest F1-score of 0.87. This is followed by SVM (0.85), XGBoost (0.80), RF (0.76), and KNN (0.75), confirming that Late Combustion remains the most challenging class across all models. All models achieved perfect detection (F1-score = 1.00) for Very Late Combustion on the test set, indicating that this class is highly distinguishable. Similarly, the Normal class is consistently classified with high accuracy, with F1-scores ranging from 0.98 to 0.99 across all models.
Although tree-based models such as XGBoost and RF show strong training performance, a slight reduction is observed in test performance, particularly for Late Combustion, suggesting some limitations in generalizing borderline cases. This behavior may be attributed to the nature of tree-based models, which rely on axis-aligned splits and may struggle with overlapping class boundaries.
In contrast, ANN demonstrates an improved capability to capture nonlinear feature relationships, enabling better discrimination of ambiguous patterns. Among the evaluated models, ANN exhibits the strongest generalization ability, as evidenced by its superior performance on unseen test data, particularly for the challenging Late Combustion class. This can be attributed to its capacity to learn complex, distributed representations of the underlying data. SVM also maintains strong generalization due to its margin-based optimization, although it remains slightly less effective than ANN for Late Combustion detection.
To further assess the effectiveness of the proposed feature-based framework, a CNN model trained directly on raw vibration signals was also evaluated as a representative deep learning benchmark. Although the CNN achieved competitive overall classification accuracy of 0.98, its F1-score for the challenging Late Combustion class (0.81) remained lower than that of the ANN classifier (0.87). This result suggests that, for the relatively limited dataset size considered in this study, the proposed compact physically informed feature-based approach provides superior generalization capability compared with automatic feature learning from raw vibration signals. The findings indicate that carefully engineered vibration features can remain highly effective even when compared with more complex deep learning architectures. In addition, the proposed feature-based framework offers improved interpretability and lower computational complexity, making it more suitable for practical real-time combustion monitoring applications.
Overall, the diagnosis system proves to be highly effective in identifying combustion conditions. Among all models, ANN emerges as the most reliable classifier, providing the best balance between accuracy and robustness across all classes. SVM follows closely with competitive performance, while XGBoost and RF deliver strong but slightly less consistent results for challenging cases. KNN, although simpler, shows comparatively lower performance in distinguishing Late Combustion. The CNN, despite achieving competitive overall accuracy, showed lower generalization for the Late Combustion class compared with the feature-based ANN, confirming the advantage of physically informed feature extraction under limited data conditions.
These findings confirm that Late Combustion is the most difficult class to classify, a difficulty inherent to its transitional nature. Late Combustion cycles are defined by CA50 values in the narrow range of
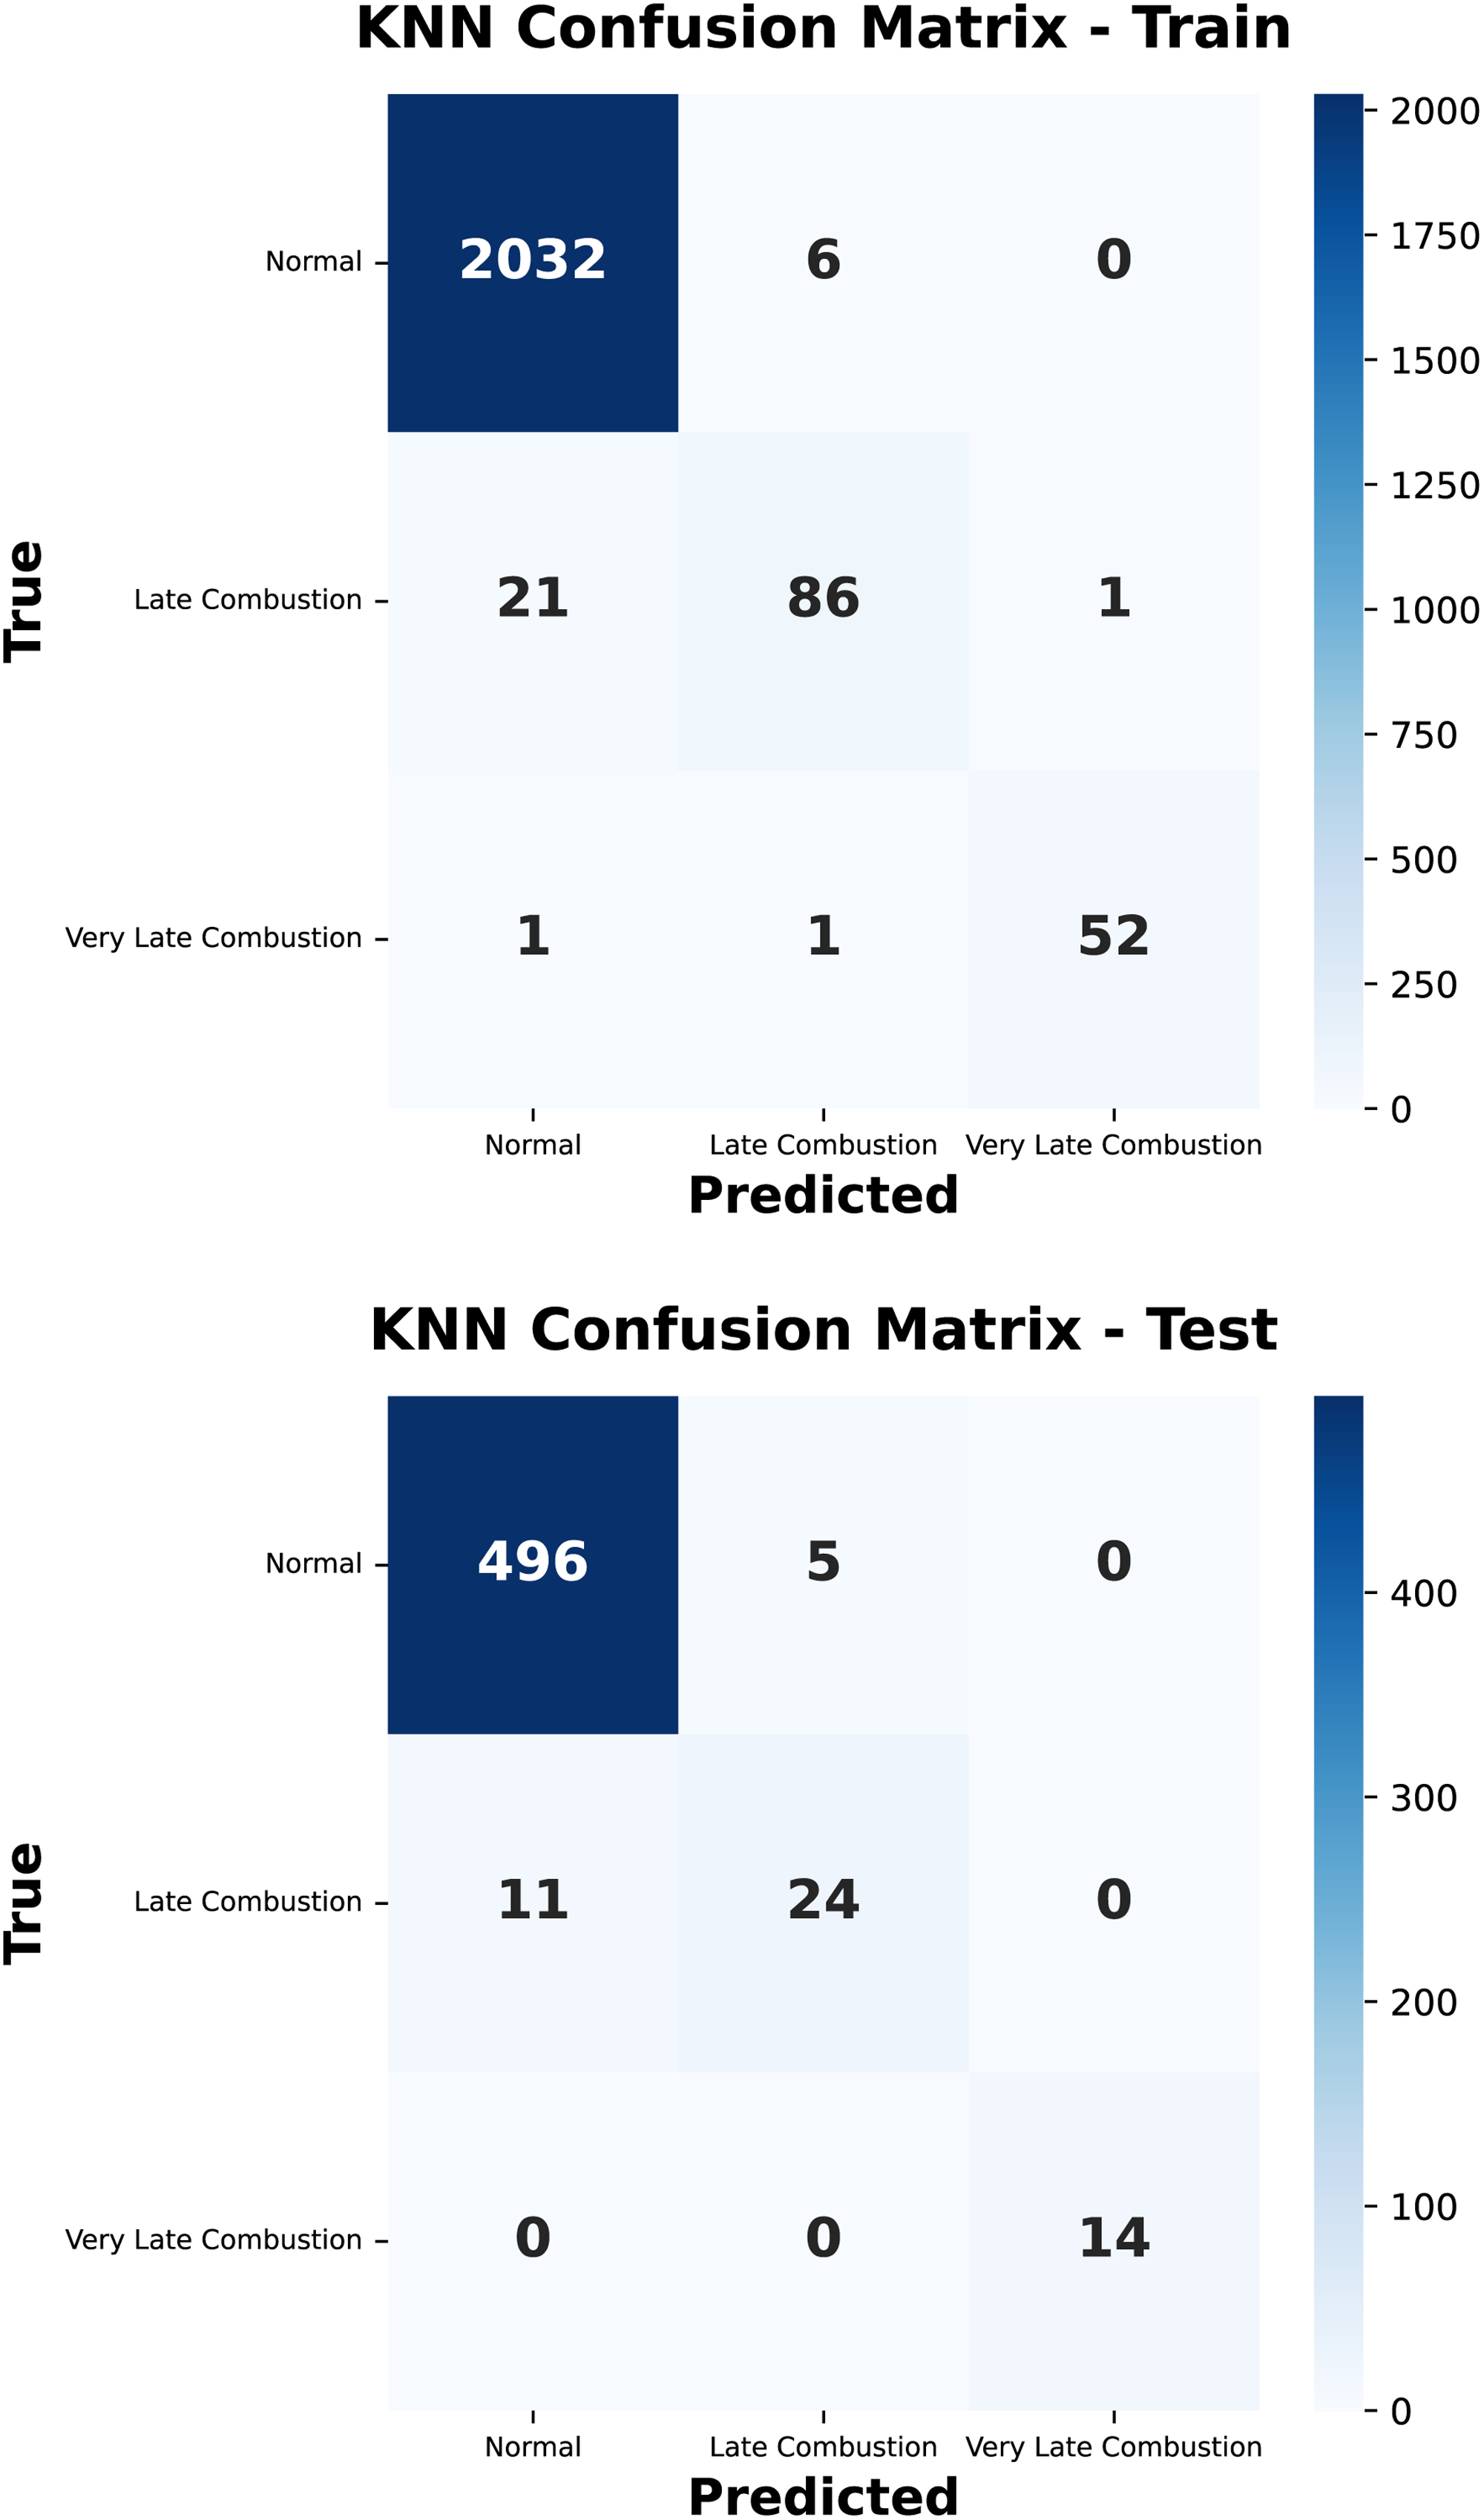
Confusion matrices of the KNN model for the training (left) and test (right) datasets.
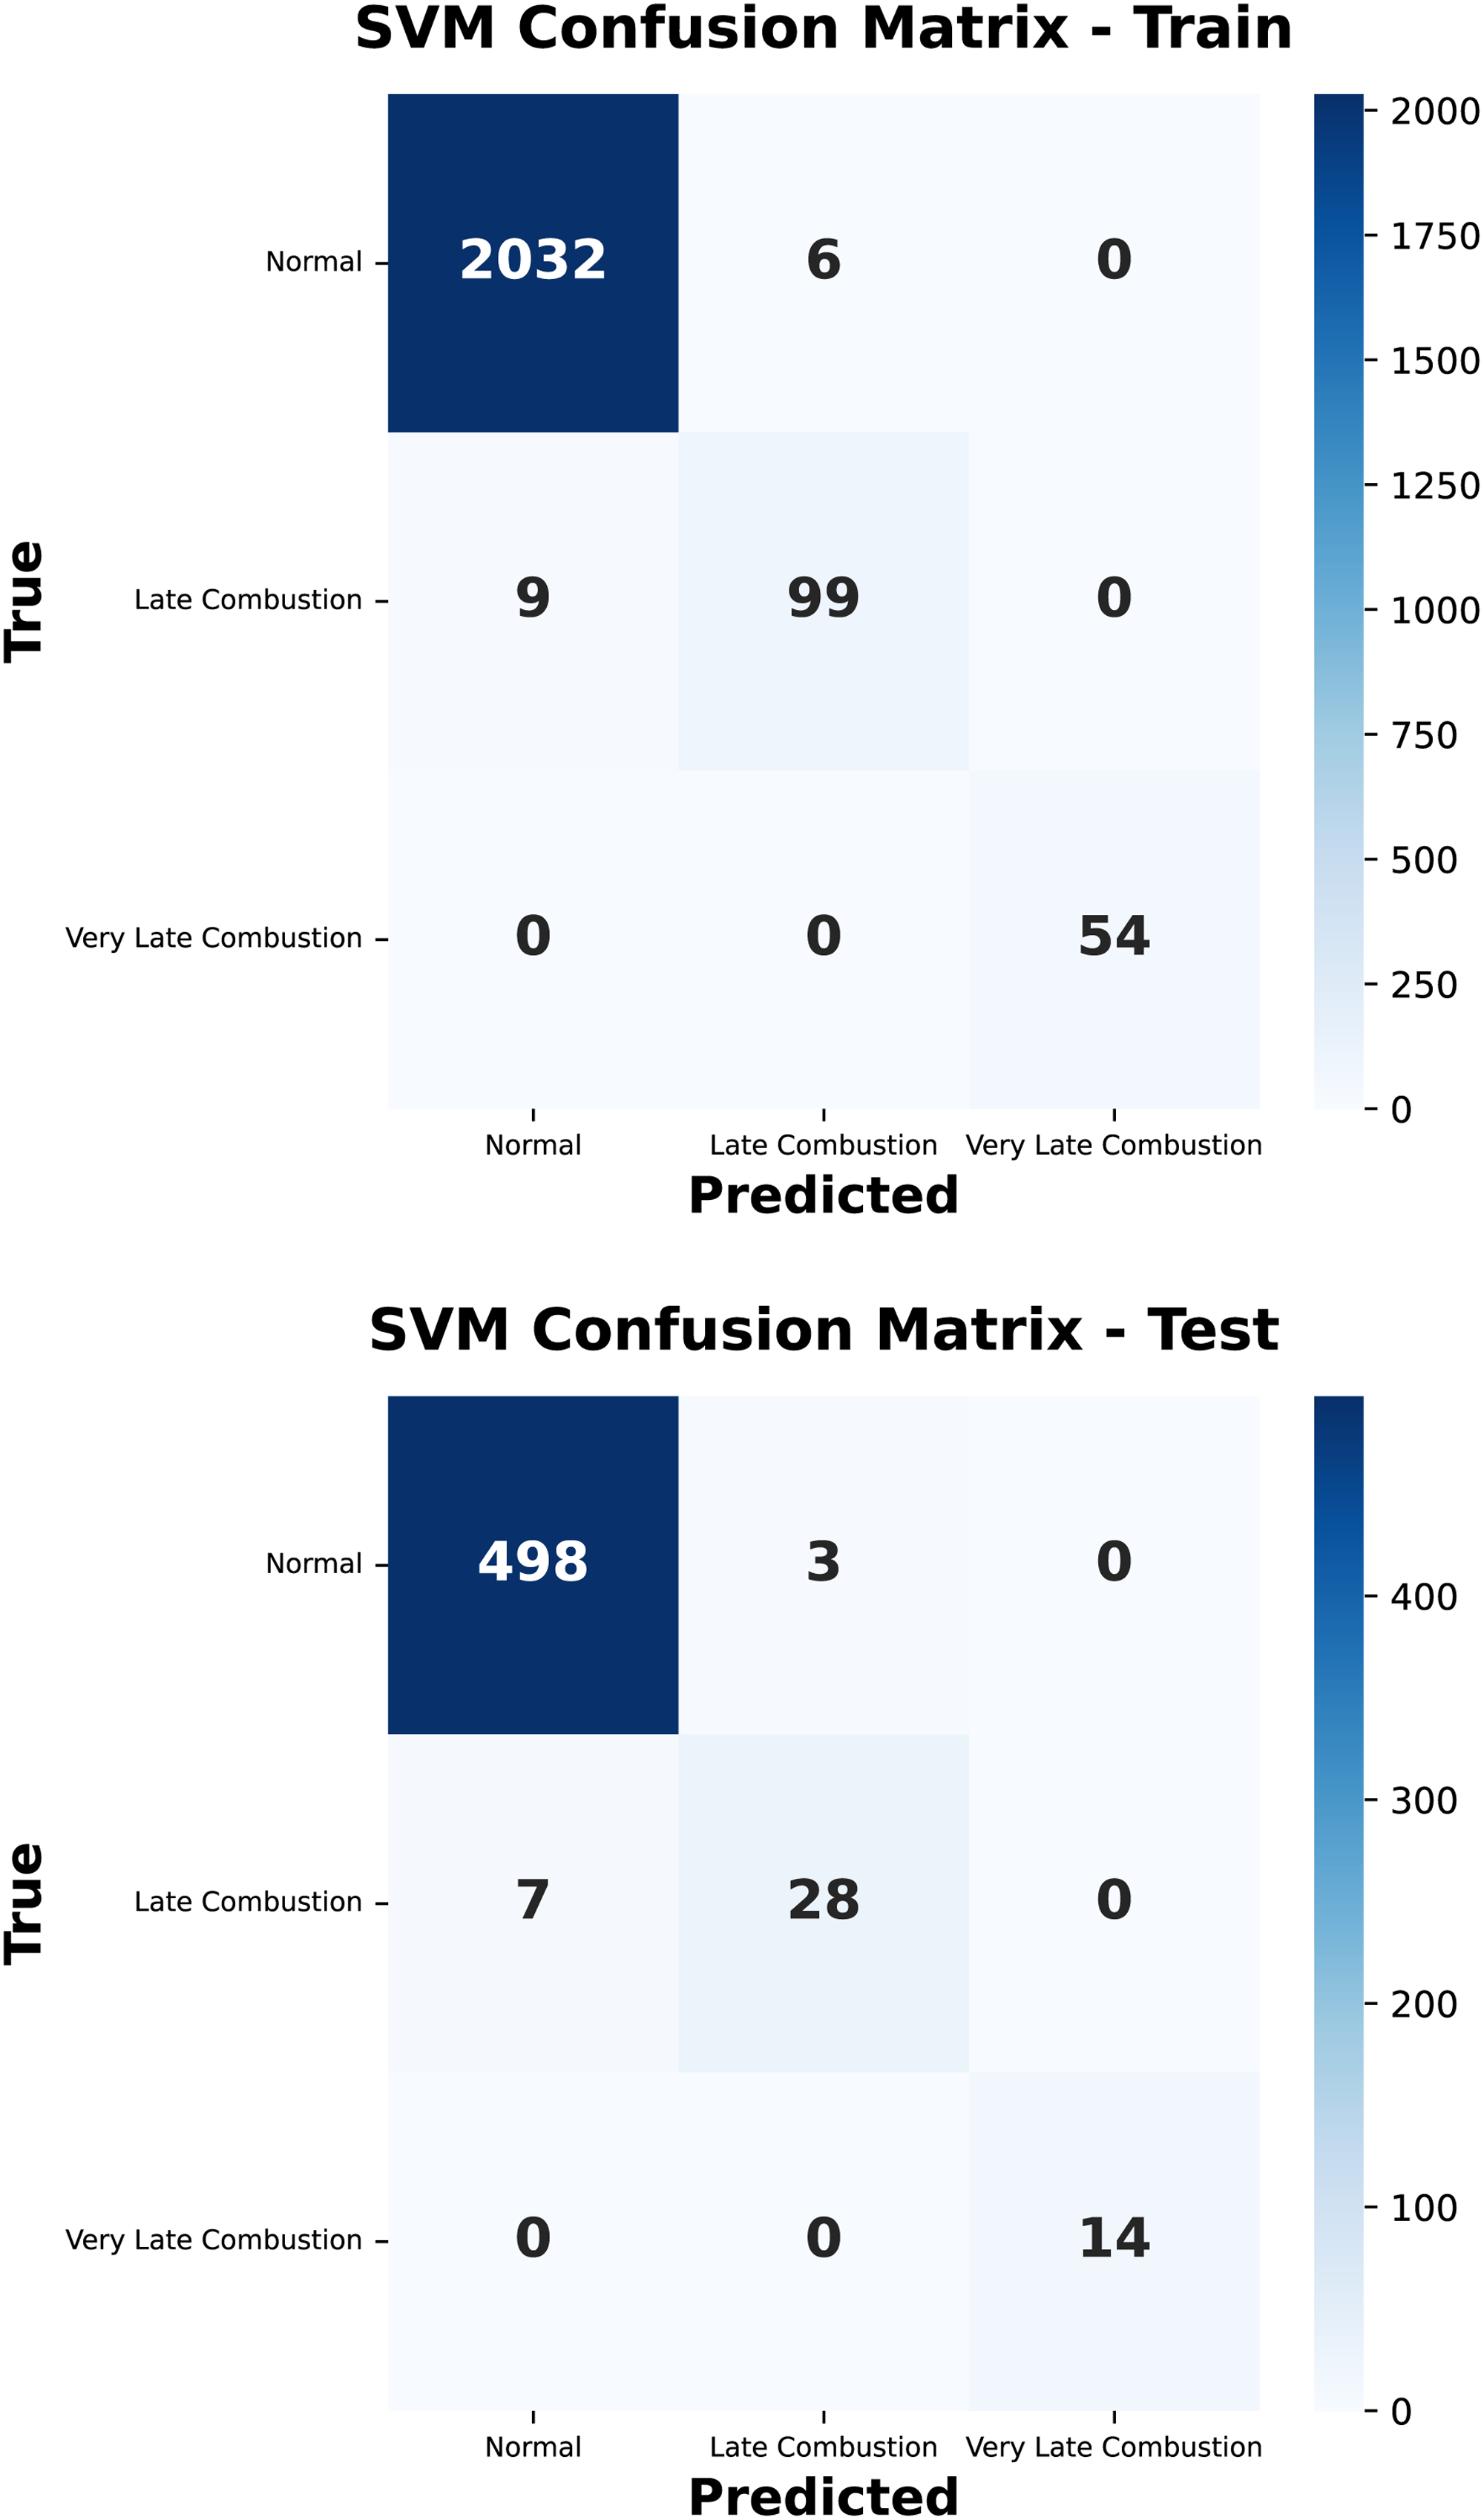
Confusion matrices of the SVM model for the training (left) and test (right) datasets.
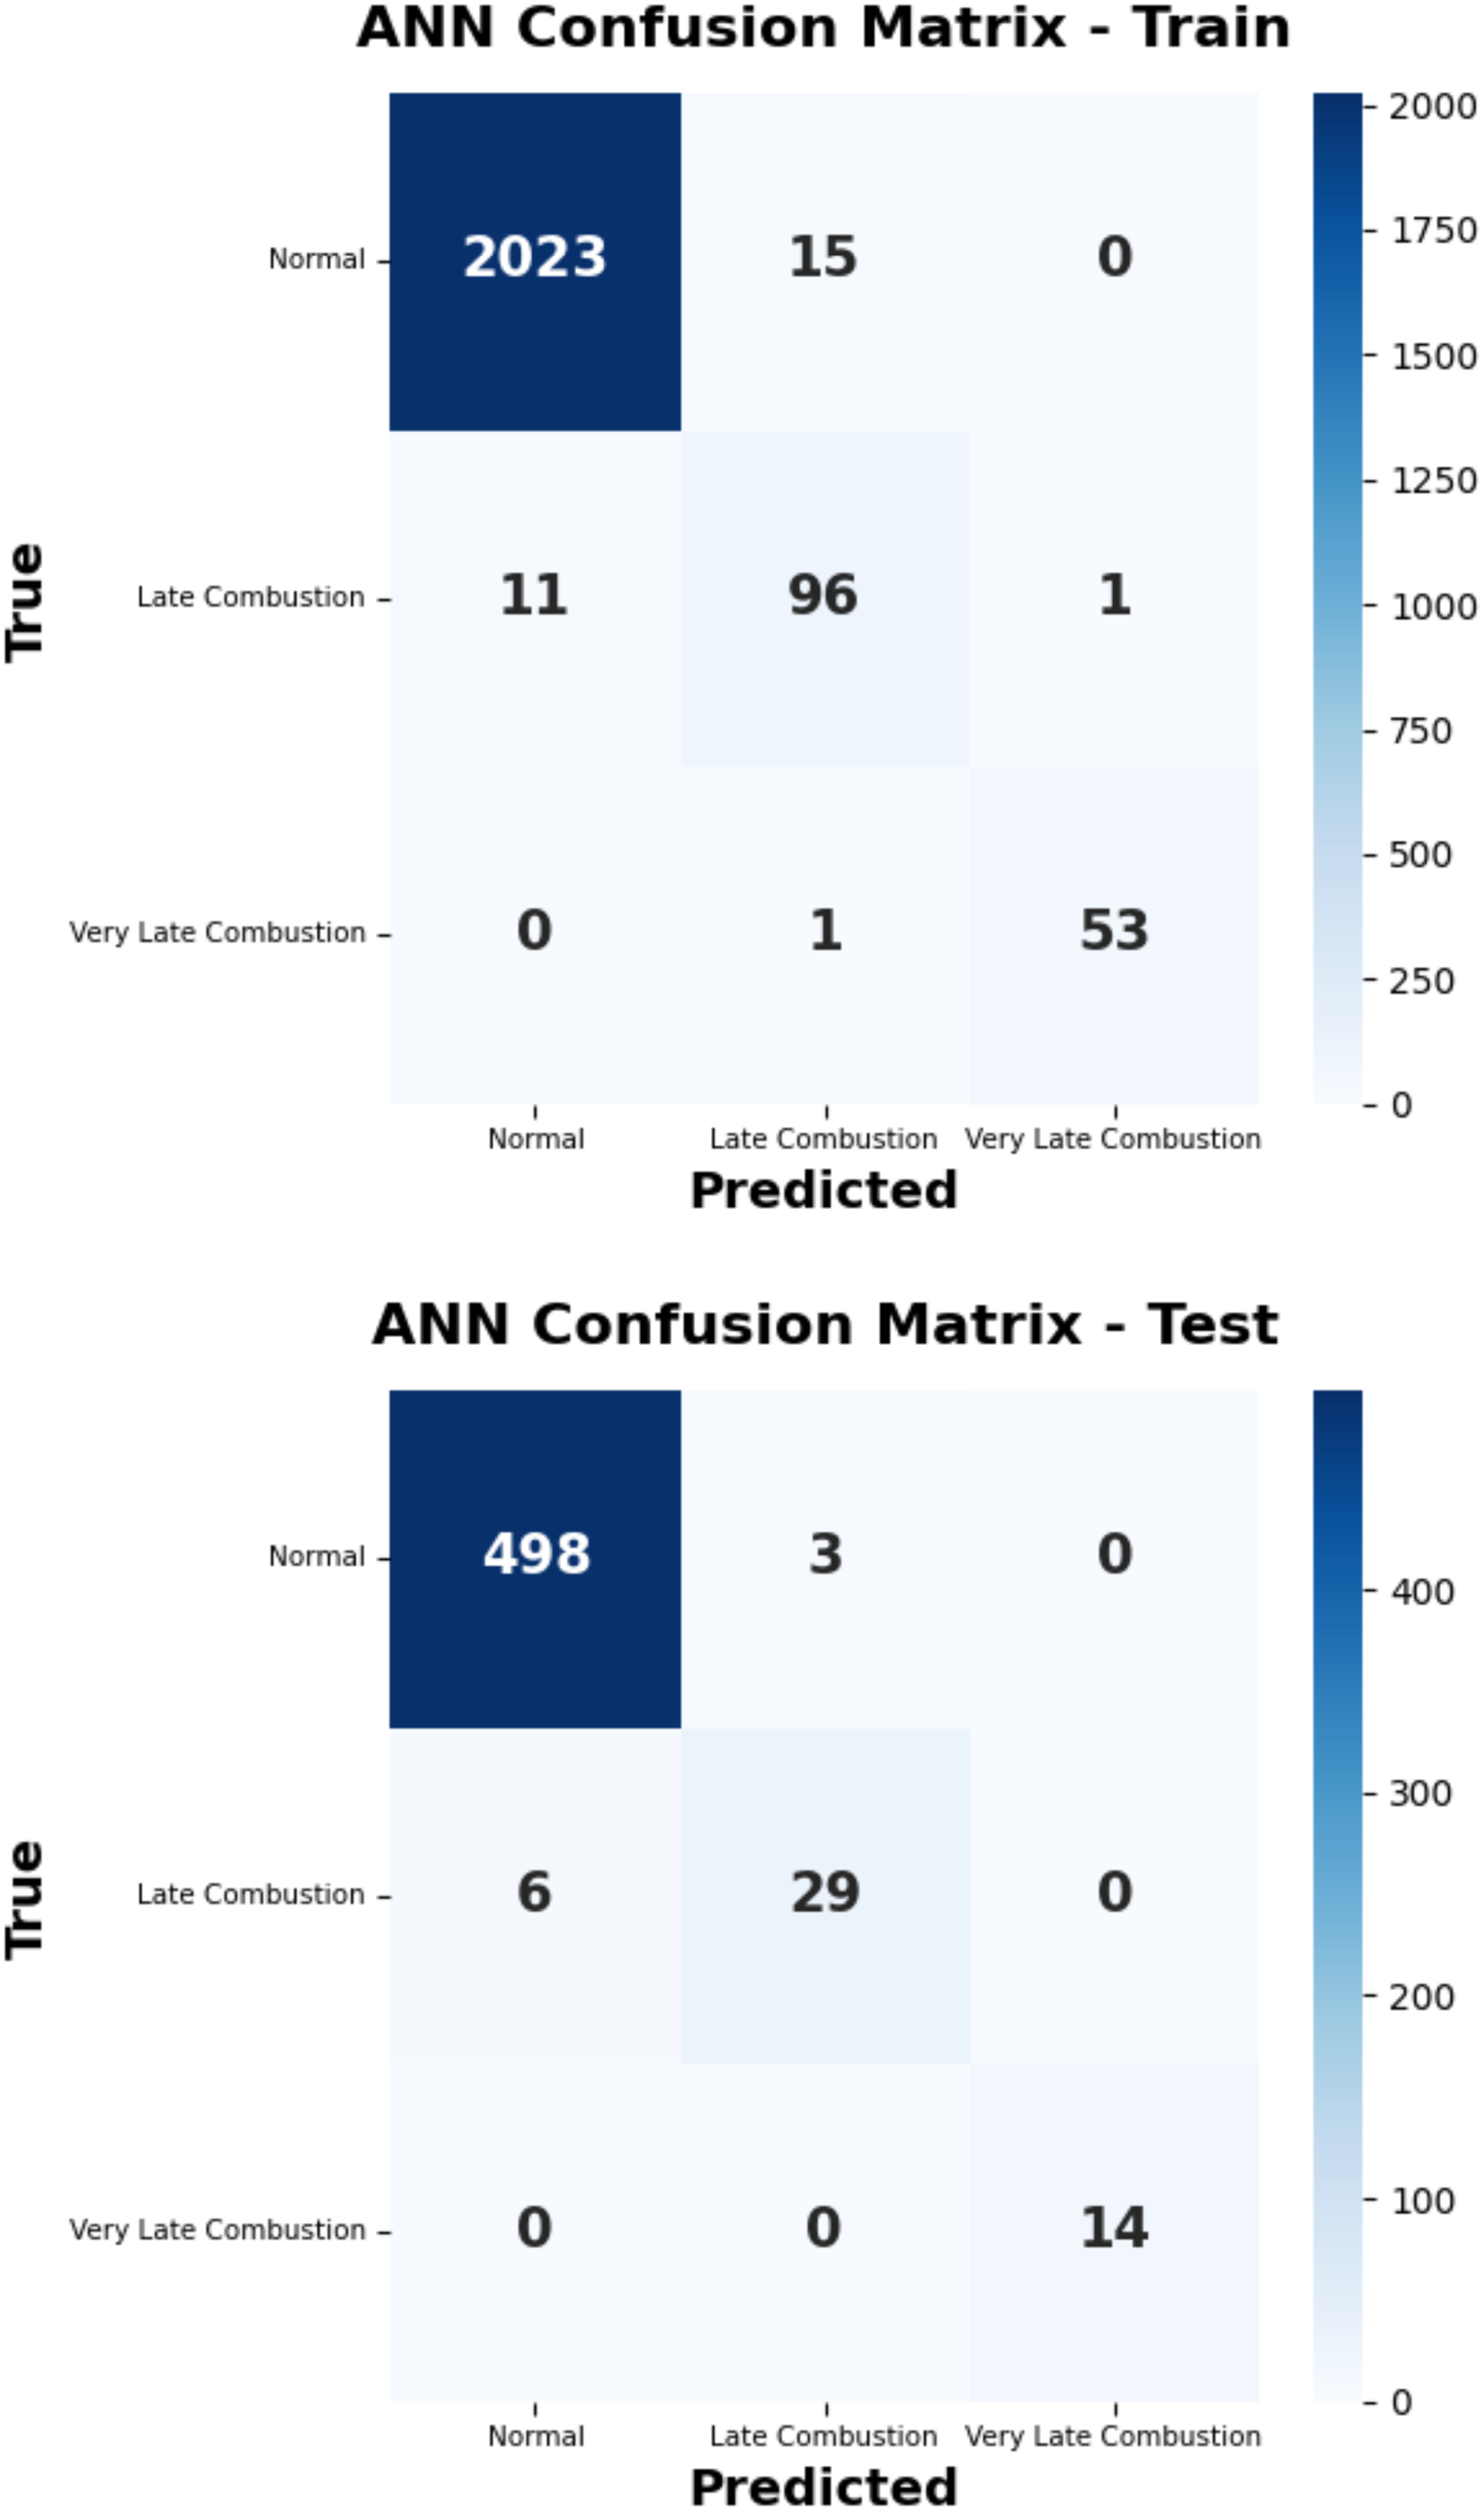
Confusion matrices of the ANN model for the training (left) and test (right) datasets.
Ablation study and feature contribution analysis
To further investigate the contribution of different vibration features to combustion-state classification, feature importance analysis and ablation studies were conducted using the ANN classifier, which demonstrated the best overall classification performance among the evaluated models. The objective of this analysis was to evaluate the discriminative capability of candidate features and determine the most effective feature combination for robust combustion-state classification.
Figure 15 presents the combined feature importance ranking obtained from multiple evaluation methods. Combustion Band Energy and SumPeak emerged as the most influential features, followed by several spectral and statistical descriptors. Additional candidate features, including wavelet-based, statistical, and PSD-related metrics, were also investigated during the screening process. However, the final feature selection was not based solely on ranking scores. Instead, feature complementarity, physical interpretability, computational efficiency, and overall classification performance were also considered when determining the final compact feature subset.
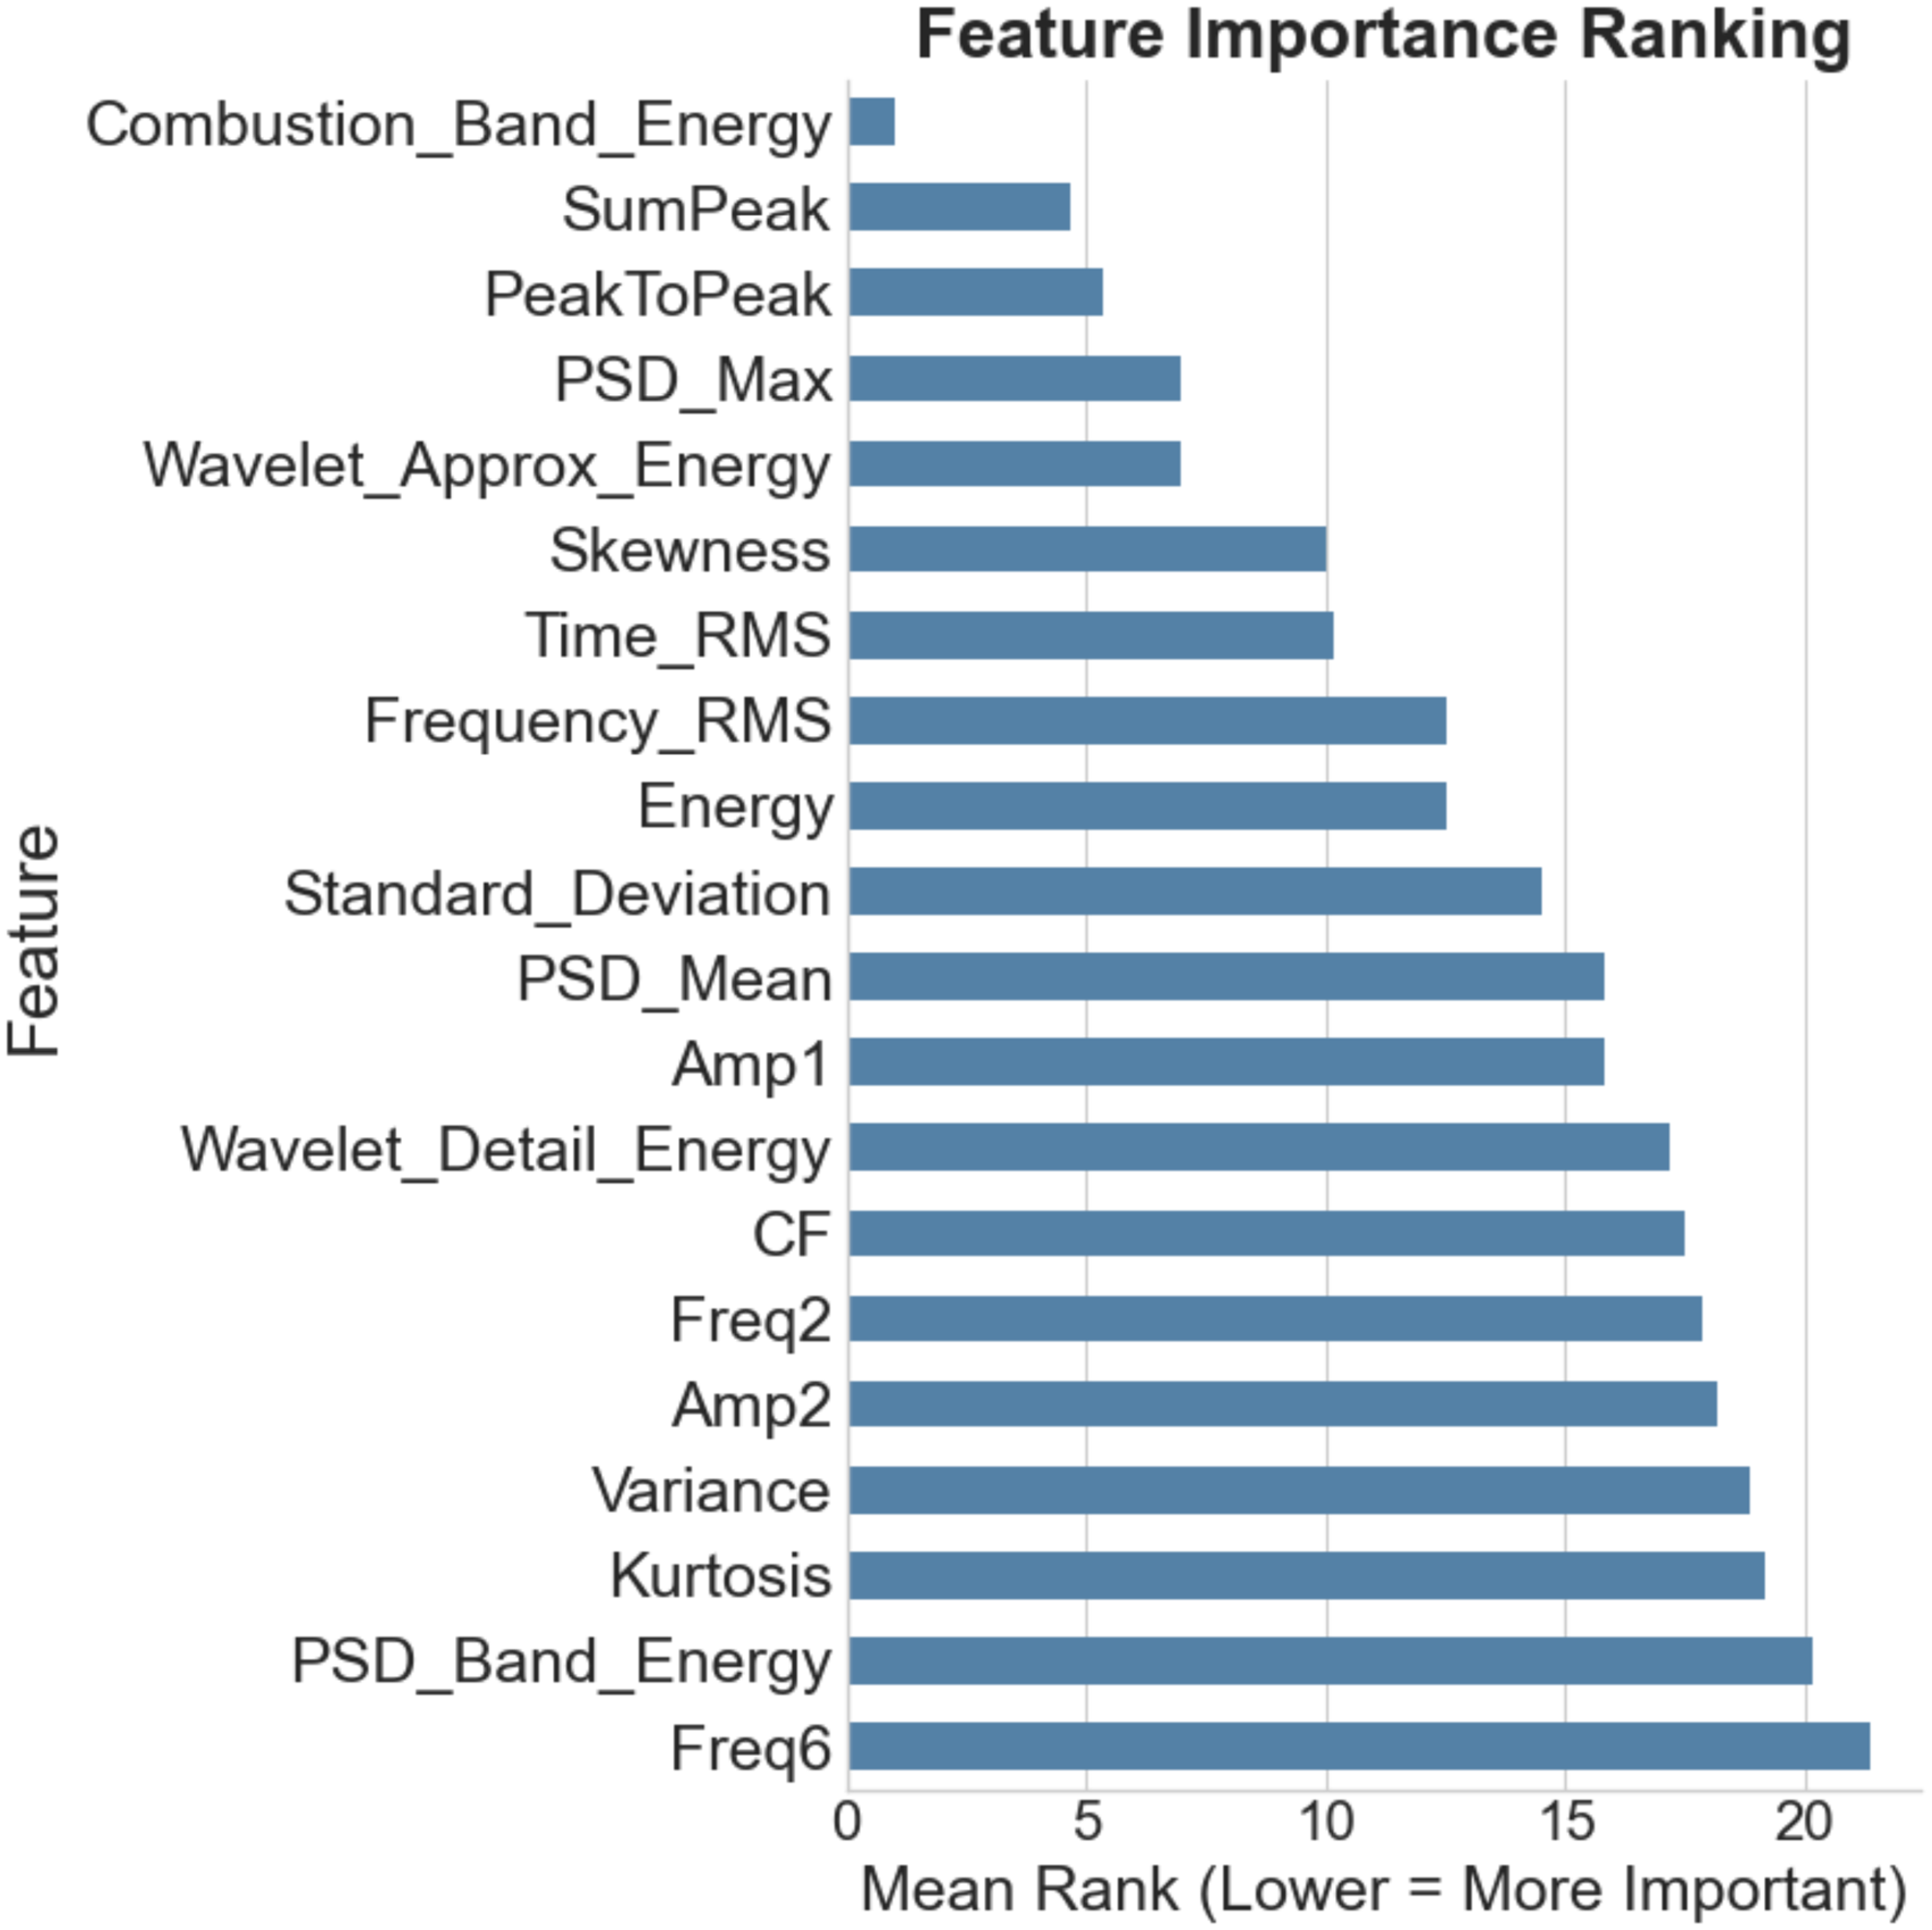
Combined feature ranking scores obtained from Random Forest importance, ANOVA F-score, and permutation importance analysis. Lower mean rank indicates higher feature importance.
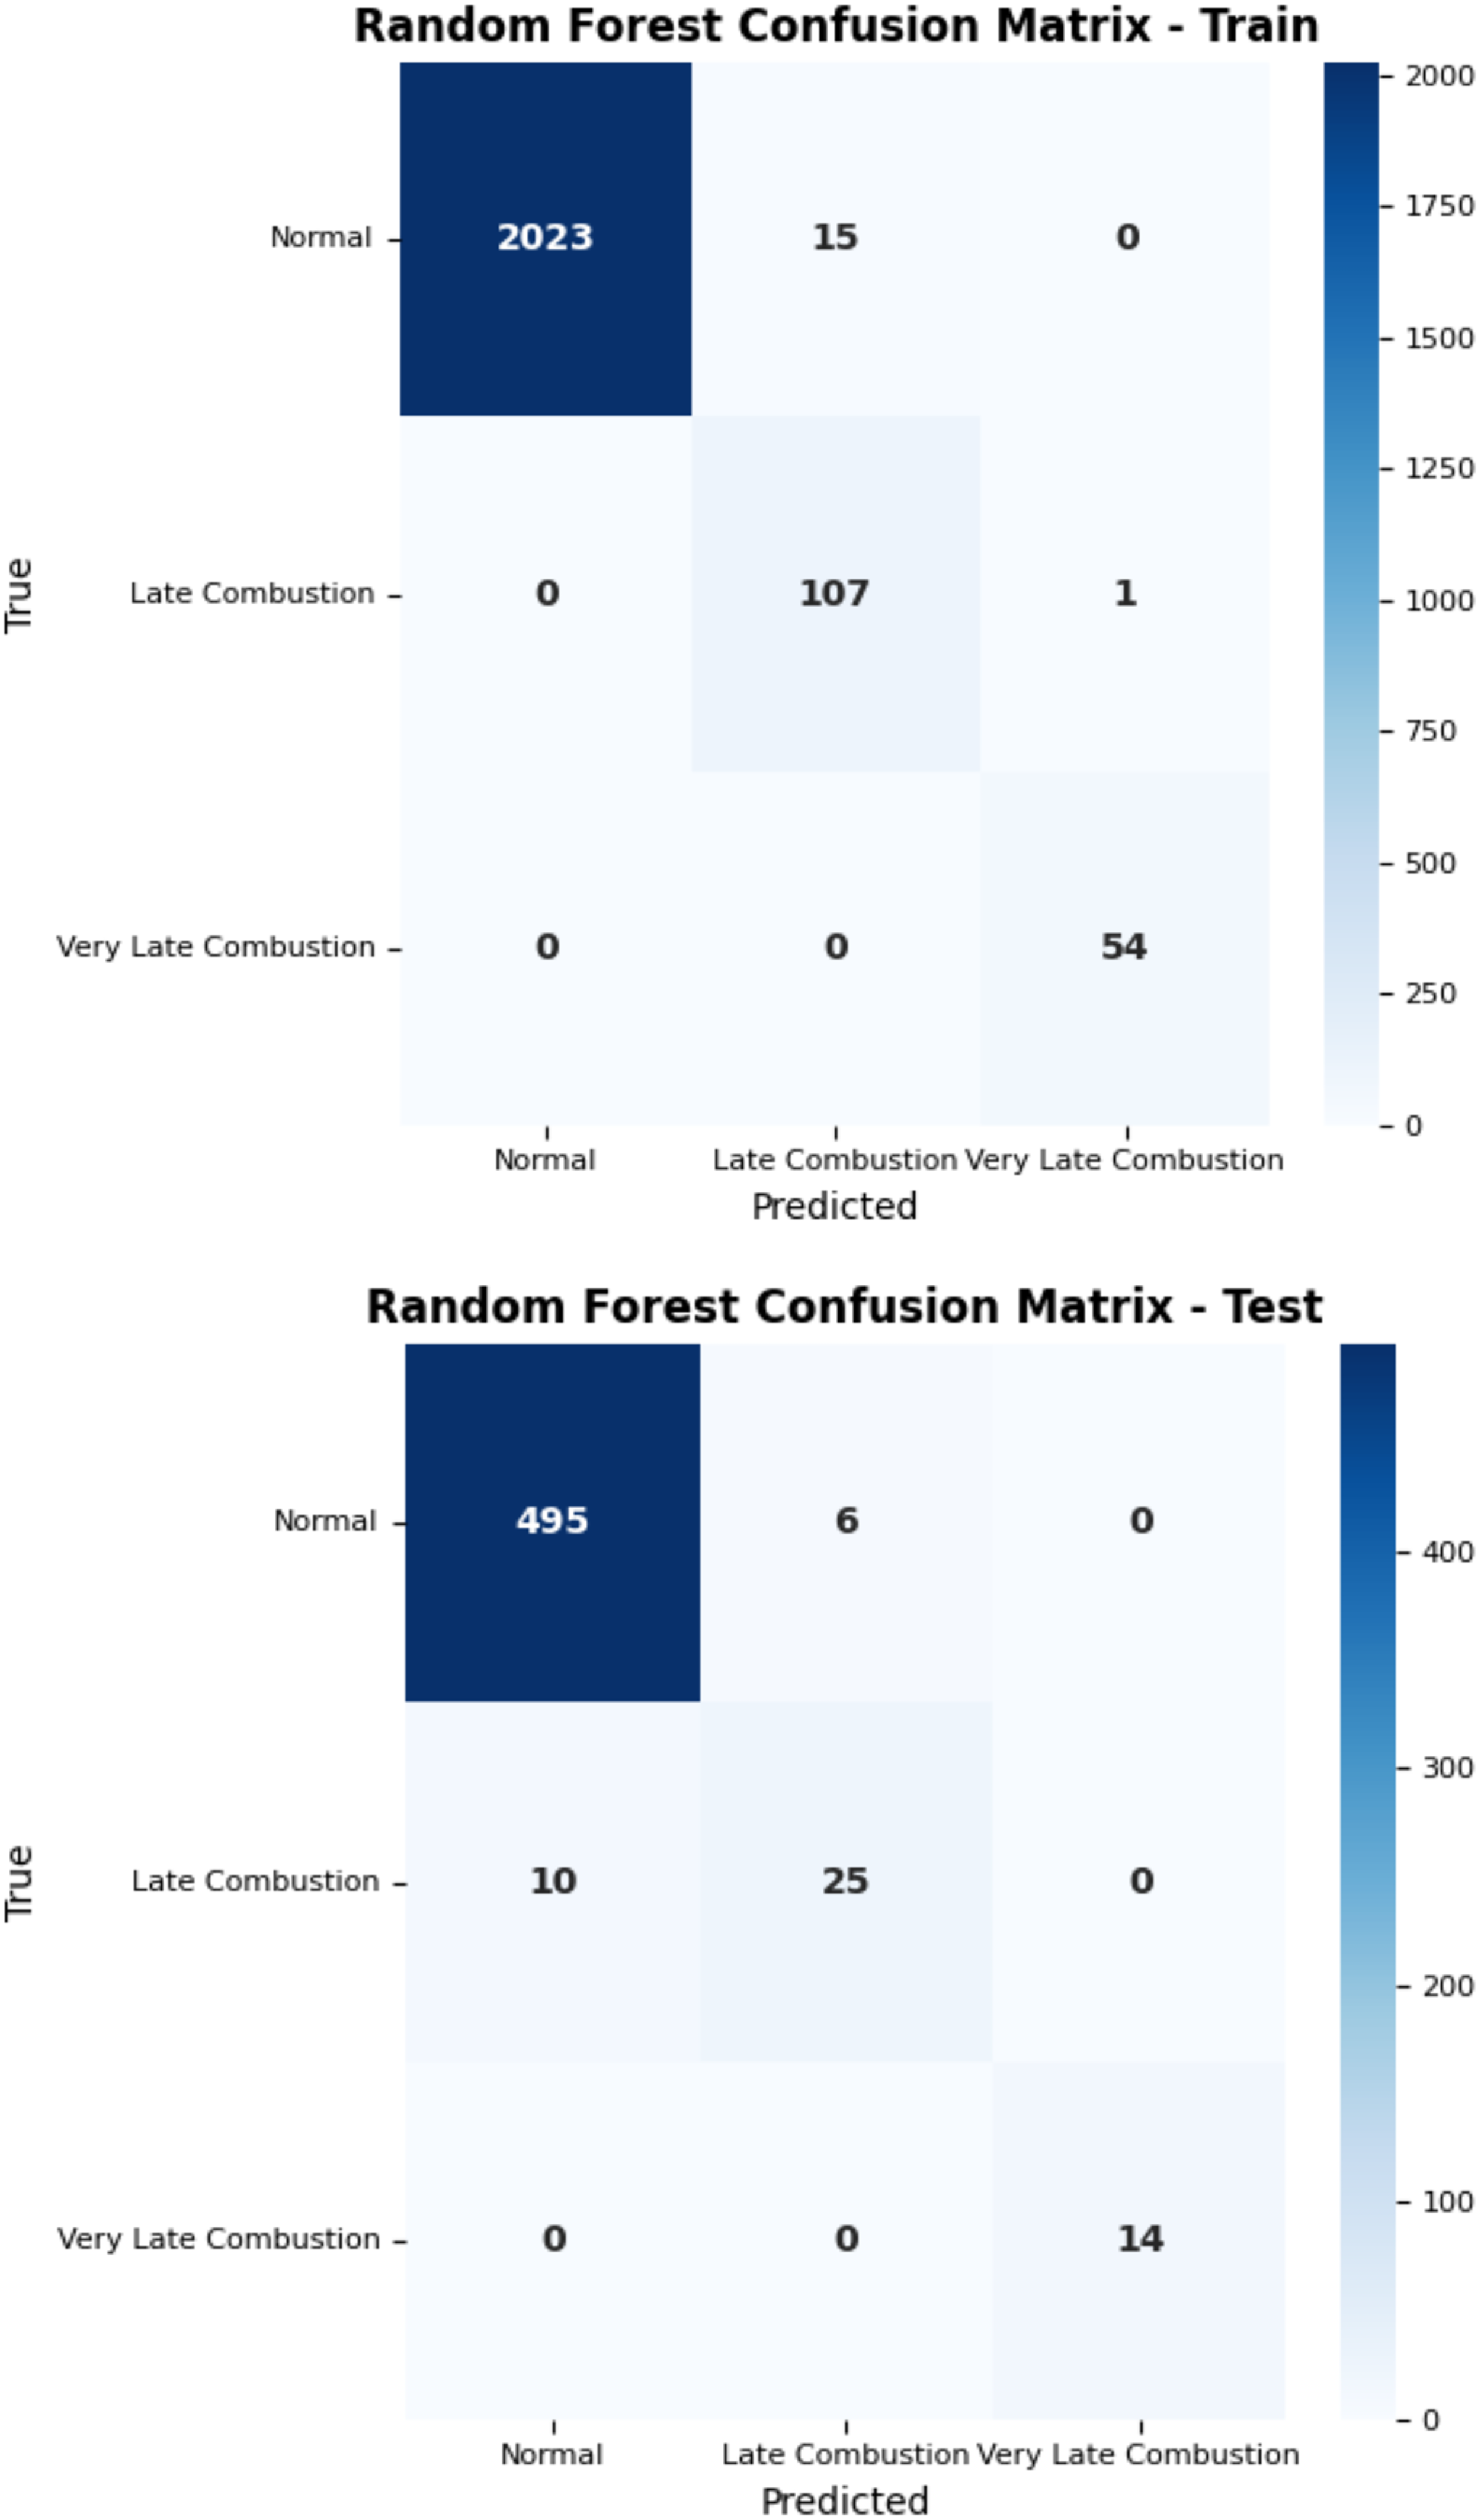
Confusion matrices of the Random forest model for the training (top) and test (bottom) datasets.
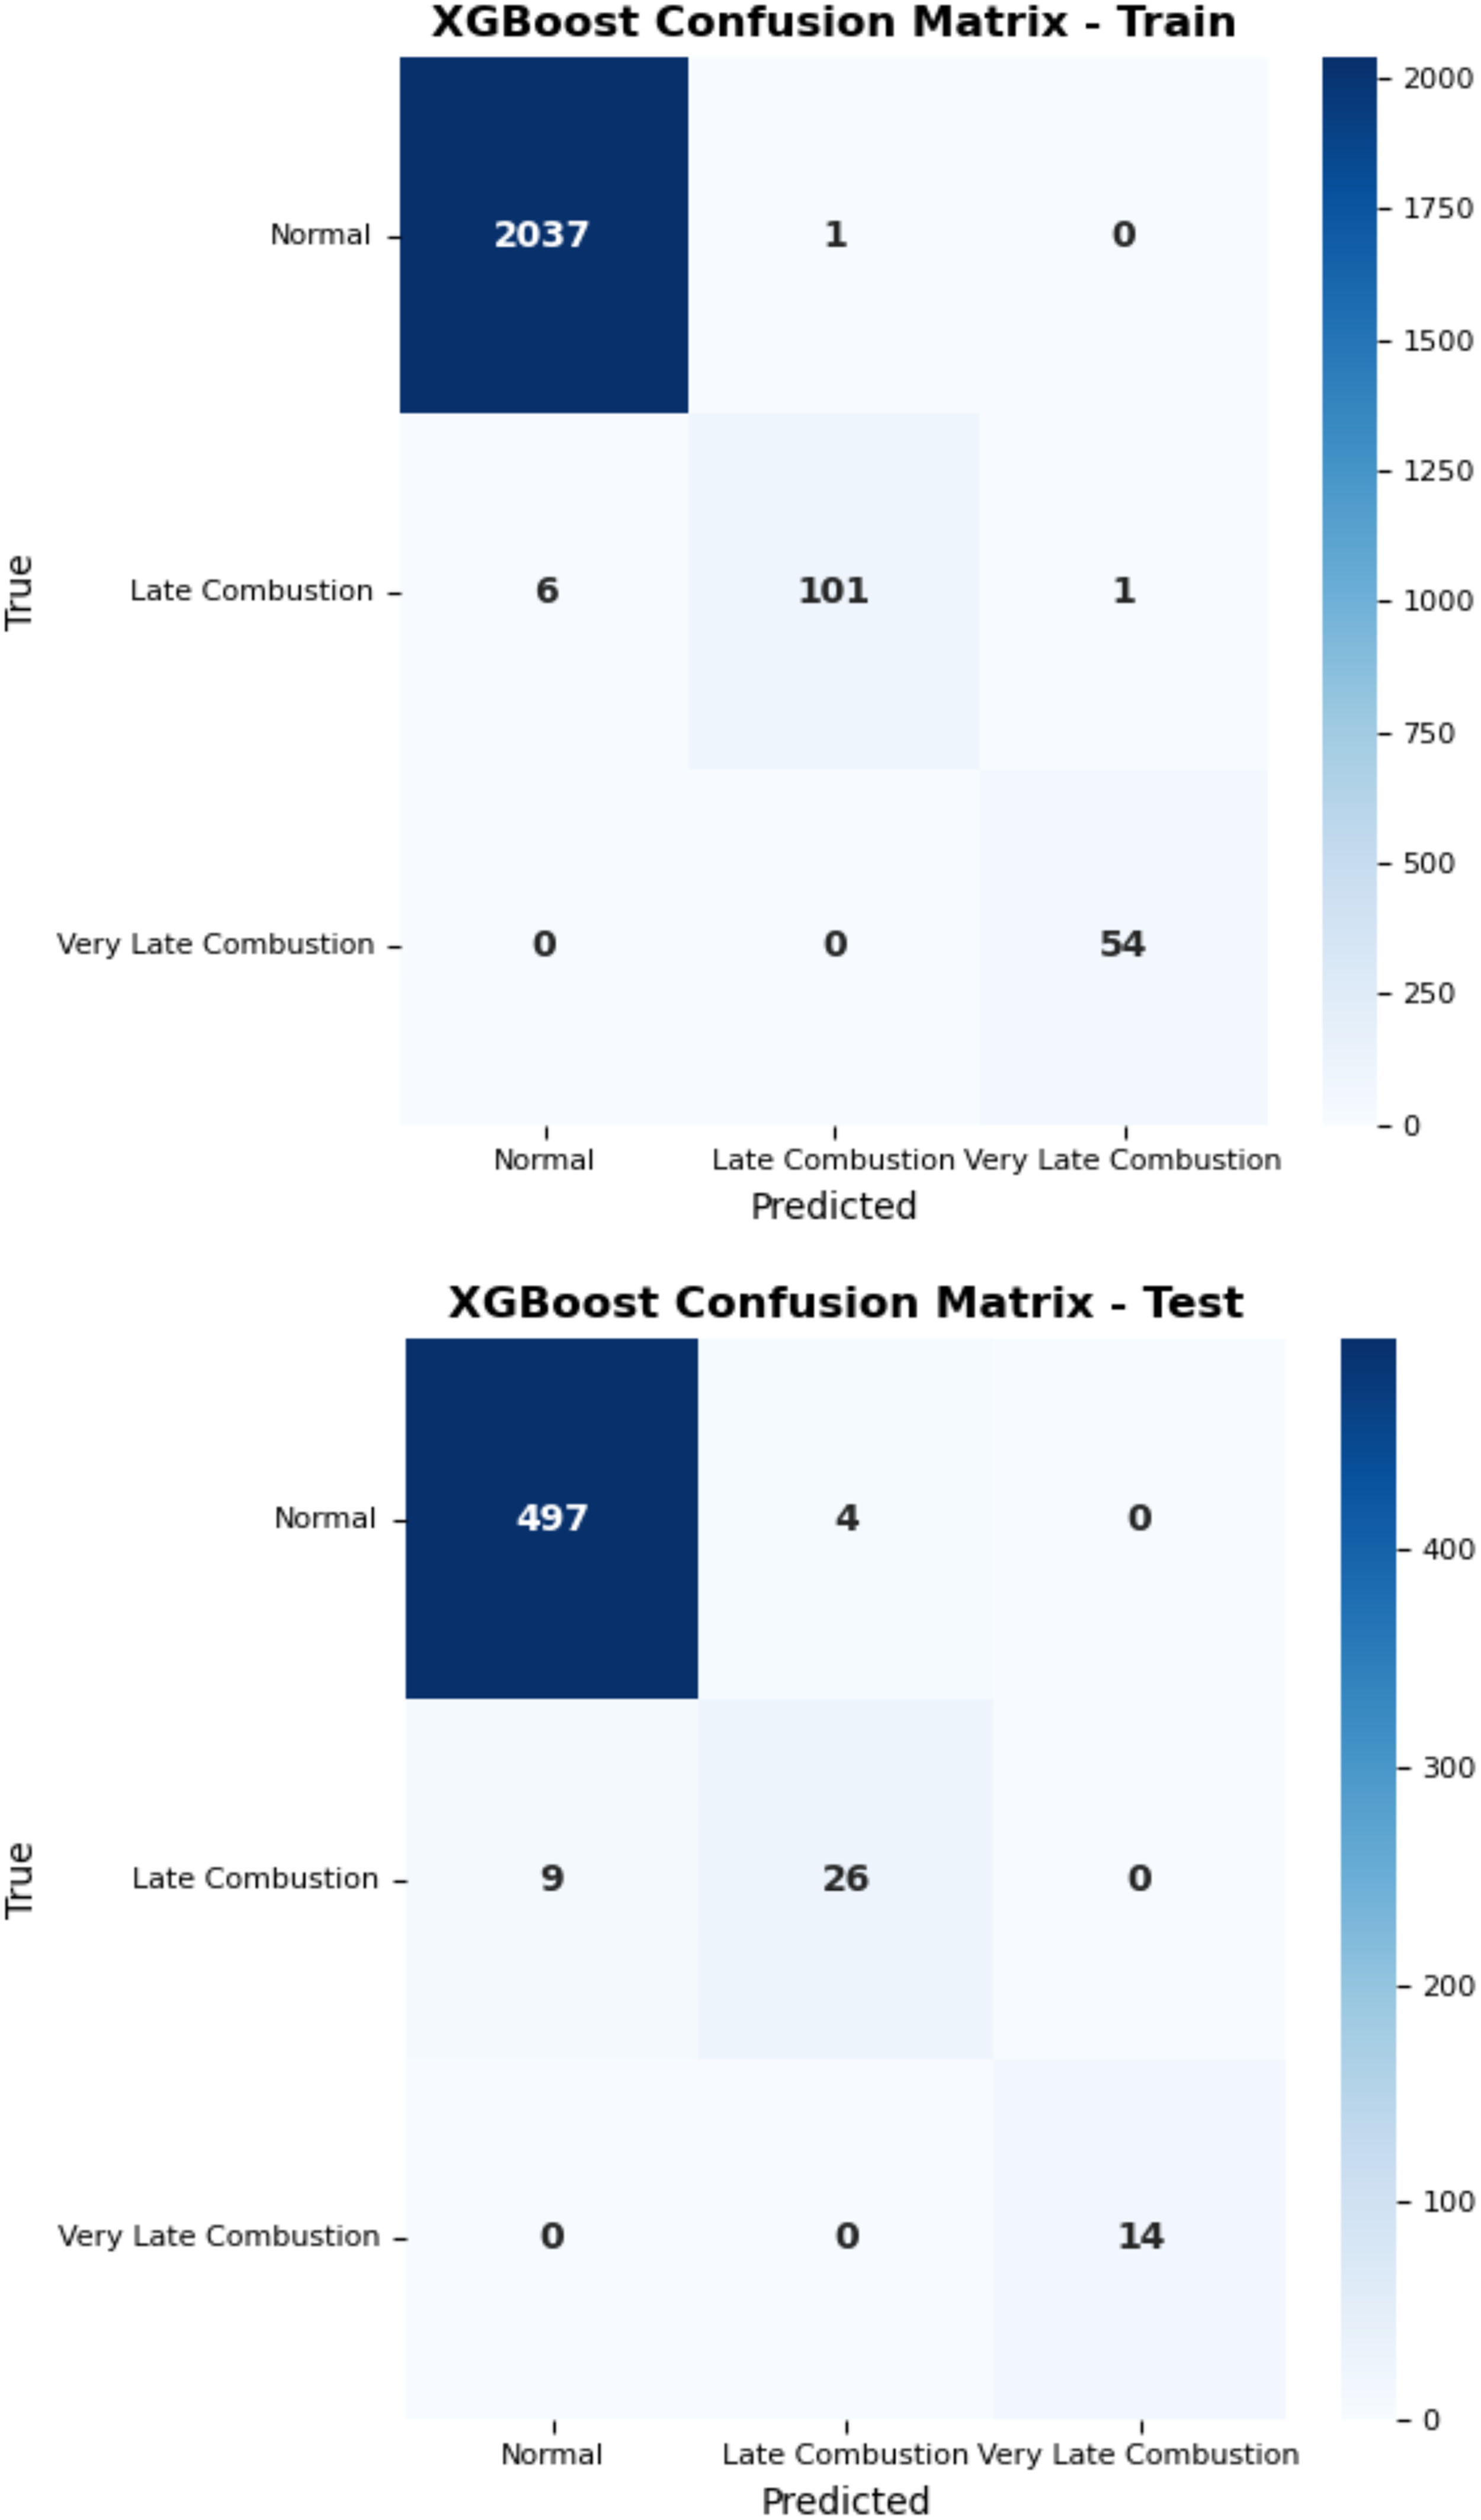
Confusion matrices of the XGBoost model for the training (top) and test (bottom) datasets.
To validate the effectiveness of the selected features, an ablation study was performed using four different feature configurations: the proposed compact feature set, the top 10 ranked features, frequency-domain features only, and time-domain features only. The results are summarized in Table 5.
Ablation study results using the ANN classifier.

The proposed compact feature set achieved the highest overall accuracy (98.36%) and the highest F1-score for the challenging Late Combustion class (0.87). Although the top 10 ranked features also produced strong classification performance, their results remained inferior to the proposed compact subset. This indicates that feature ranking alone is insufficient for determining the optimal feature combination. Instead, the selected compact subset benefits from complementary and physically meaningful features that improve class separability and generalization capability.
In contrast, using only time-domain or only frequency-domain features significantly reduced classification performance, particularly for the Late Combustion class. This observation suggests that delayed combustion characteristics are distributed across multiple signal domains and are best captured through a hybrid feature representation. Overall, the ablation study confirms the effectiveness of the proposed compact physically informed feature set for robust combustion-state classification while maintaining low computational complexity.
Real-time computational performance
To evaluate the real-time feasibility of the proposed combustion classification framework, both feature extraction and model inference times were measured. The feature extraction time corresponds to the computation of vibration-based features from a single combustion cycle, while the inference time represents the prediction time of each machine learning model using one feature vector.
To ensure accurate estimation, each process was executed 1000 times and the average execution time was reported.
The computational experiments were conducted on a standard workstation equipped with an Intel Core i7 processor and 16 GB RAM. The results are presented in Table 6. The feature extraction stage required 0.75 ms per cycle. Among the evaluated models, the support vector machine (SVM) demonstrated the fastest prediction time (0.10 ms), followed by XGBoost (0.37 ms), K-nearest neighbors (KNN) (0.82 ms), and the artificial neural network (ANN) (1.28 ms). The random forest (RF) model exhibited the highest inference time among the feature-based models (2.85 ms), primarily due to the evaluation of multiple decision trees. The CNN model, which operates directly on raw vibration signals without feature extraction, required a substantially higher total processing time of 12.19 ms, approximately three to fourteen times longer than the feature-based models. This further highlights the computational advantage of the proposed feature-based framework for real-time deployment.
Computational time comparison of feature extraction and classification models.
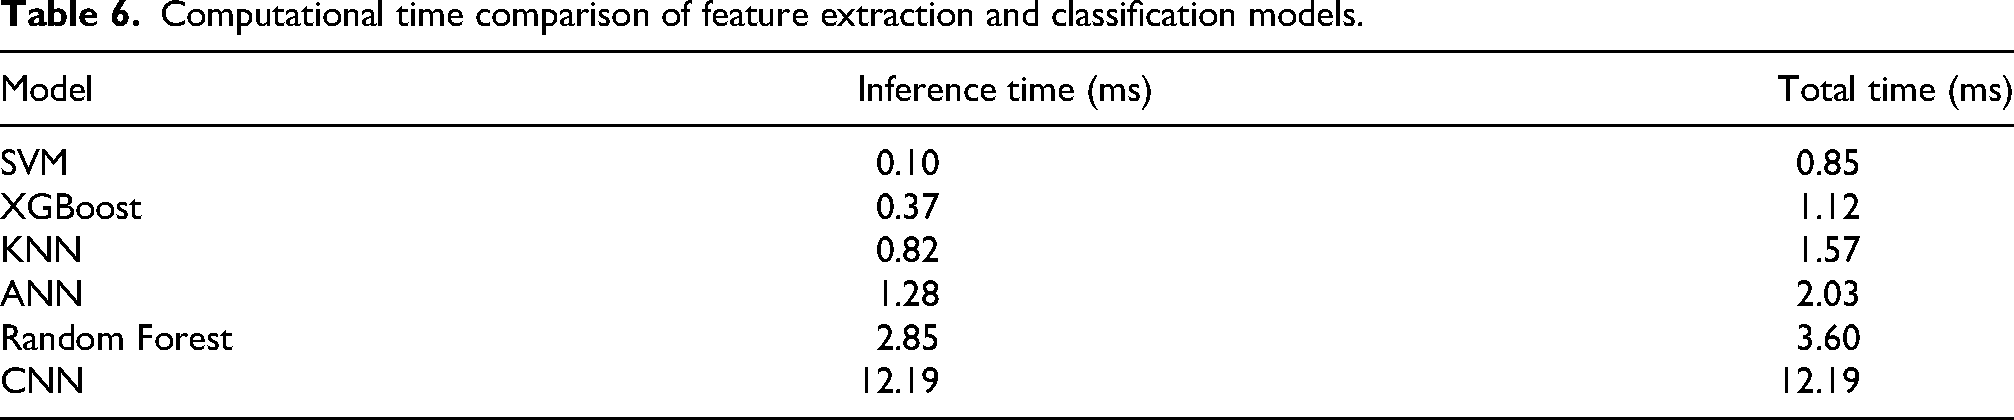
The total processing time, including both feature extraction and classification, remains substantially lower than the duration of a single engine cycle across all investigated operating conditions. Even for the slowest feature-based model (RF), the combined processing time was less than 4 ms per cycle. These processing times are significantly shorter than the corresponding engine-cycle duration, indicating that the proposed vibration-based diagnostic framework can perform combustion-state classification on a cycle-by-cycle basis without introducing computational delays. This demonstrates the suitability of the proposed approach for real-time combustion monitoring and control applications.
Conclusion
This study presents a vibration-based combustion classification framework for homogeneous charge compression ignition (HCCI) engines, achieving a high classification accuracy of 98.36% on unseen test data. By integrating thermodynamic-based labeling derived from CA50 analysis of in-cylinder pressure with feature-based classification using vibration signals, the proposed approach provides a practical and scalable diagnostic solution. The system successfully distinguishes three combustion states: Normal, Late, and Very Late combustion.
Among the evaluated models, the artificial neural network (ANN) demonstrated the best overall performance and generalization capability, particularly in maintaining consistent performance for the challenging Late Combustion class across training and testing datasets. Across all models, Late Combustion was identified as the most difficult class due to its overlap with Normal combustion, whereas Very Late Combustion was consistently detected with high confidence.
From a computational standpoint, the proposed framework demonstrates strong real-time capability. The combined feature extraction and inference times are significantly lower than the duration of a typical engine cycle, enabling cycle-by-cycle combustion monitoring. All evaluated models satisfy real-time requirements, confirming the suitability of the approach for real-time deployment.
In contrast to data-intensive deep learning methods, this work adopts a feature-based approach grounded in physical insight, maintaining low computational complexity while achieving high classification accuracy. This was confirmed by the CNN benchmark evaluation, in which the proposed ANN-based framework demonstrated superior performance for the challenging Late Combustion class compared with automatic feature learning from raw vibration signals. Several limitations of the present study should be noted. The experimental dataset was collected from a single-cylinder research engine under naturally aspirated conditions, covering approximately 30% of the maximum load of a typical naturally aspirated spark-ignition engine. Extended conditions such as boosted intake pressure, cold intake temperatures, and deliberate EGR fluctuations were not included, which may affect generalizability to a broader range of operating conditions. Computational benchmarks were obtained on a standard workstation under isolated conditions; validation on embedded hardware platforms under multi-tasking scenarios remains to be performed. Future work should address the identified limitations through three specific directions: extension of the experimental envelope to boosted intake, cold intake, and EGR fluctuation conditions; validation on multi-cylinder production engines; and real-time deployment on embedded ECU hardware platforms.
Overall, the proposed vibration-based diagnostic framework provides a cost-effective, efficient, and reliable alternative to conventional pressure-based methods, eliminating the need for expensive in-cylinder sensors. The results highlight its strong potential for real-time engine control, fault detection, and predictive maintenance in advanced HCCI applications.
Footnotes
Acknowledgements
The work was conducted within the Data Analytics for Zero Emission Marine (DAZE) project with financial support from Business Finland (ref. 6525/31/2022). The authors gratefully acknowledge Lublin University of Technology and Professor Jacek Hunicz for the data provided for this study.

Ethical considerations
This article does not contain any studies with human or animal participants.
Consent to participate
Not applicable.
Consent for publication
Not applicable.
Trial registration number/date
Not applicable.
Funding statement
The author(s) disclosed receipt of the following financial support for the research, authorship, and/or publication of this article: The work was conducted within the Data Analytics for Zero Emission Marine (DAZE) project with financial support from Business Finland (ref. 6525/31/2022).
Declaration of conflicting interests
The authors declared no potential conflicts of interest with respect to the research, authorship, and/or publication of this article
Data availability
The data that support the findings of this study were obtained from a third-party organization and are subject to a non-disclosure agreement (NDA). Due to confidentiality restrictions, the data are not publicly available and cannot be shared.