
Abstract
Augmented reality is gaining presence in the classroom because it allows to combine the physical environment and digital information in real time. An implementation of augmented reality that is attracting great attention are quick response codes because they can be read immediately in smartphones and tablets using free apps. A teaching field where it is beneficial to provide a prompt access to supplementary materials are laboratory sessions in scientific–technical disciplines. There, students realize complex measurement tasks using specific instrumentation, and so it is convenient to access technical documentation and explanations of the measurement process during the session. This work describes how quick response codes can be introduced in laboratory sessions to provide links to specifically designed supporting resources. Thanks to this strategy, an improvement in the acquisition of experimental skills has been observed as well as a better and quicker realization of the practical sessions.
Keywords
Information and communication technologies (ICTs) have become a key element in the evolution of teaching strategies, as it can be inferred from their massive implementation at all educational levels. In particular, one of the most widely used realization of ICTs are multimedia resources such as videos, commented presentations or info-graphics (Sánchez-Azqueta et al., 2015a).
Two aspects contribute essentially to this. On the one hand, the proliferation of free mobile apps that facilitates the creation and edition of contents as well as their ubiquitous use in what is known as m-learning (Cheon, 2012; Motiwalla, 2007; Pu et al., 2011); on the other hand, the efforts that are being made by educational institutions to implement, maintain and improve the digital platforms where these contents are hosted.
One of the most critical problems about the use of multimedia resources in education, and particularly in higher education, is how to facilitate their access when they are most relevant. While digital formats such as enriched notes, e-books or multimedia presentations allow to place hyperlinks to the multimedia contents (Sánchez-Azqueta et al., 2016), there are still a lot of learning materials that are not digital and thus do not allow the addition of hyperlinks. This is the case of many reference manuals and books, traditionally included in alternative media such as DVDs or web pages designed as repositories.
A field of education where the need to introduce supplementary multimedia materials is particularly remarkable are practical laboratory sessions in scientific disciplines, where students use complex instrumentation to reproduce advanced measurement techniques. Although the operation manuals of the instruments and the instructions to carry out the measurements can be easily translated to multimedia formats (as a text file in the former case and a video or info-graphics in the latter), providing an easy and immediate access to them during the laboratory session is a more complex task.
It is in this context where augmented reality (AR) applications gain special relevance because they allow to combine digital and physical information in real time using mobile devices. AR, thus, brings many advantages to the field of education because it allows to offer contextualized information and to present it where and when it is most significant in the learning process (Estebanell et al., 2012).
One of the most widespread realizations of AR are quick response (QR) codes, which appeared as an evolution of bar codes, taking the shape of two-dimensional matrices. QR codes are open-code and license-free. Among their many properties, it can be highlighted that they are easy to use and can store large amounts of information, which has been identified to have a great potential for education (Kossey et al., 2015; Law and So, 2010; Tretinjak, 2015), although not all authors classify them as a separate category inside AR (Cabero and Barroso, 2016; Estebanell et al., 2012; Prendes, 2015).
This work presents an experience on the use of QR codes as a complementary resource for the teaching of experimental Electronics. Preliminary results of this work were advanced in Sánchez-Azqueta et al. (2018), where a description of the use of QR codes as a complementary resource for the teaching of experimental Electronics was given. This work presents the full description and analysis of the experience and also presents an extension of the contents, introducing a new type of QR codes, called Type 3 QR codes. This newly developed type of QR codes provides links to two types of contents: on the one hand, to materials that cover the origin and history of the operational amplifier and the foundation of the companies that pioneered their fabrication and commercialization; on the other hand, to simulation tools, application notes and self-assessment exercises.
Context
One topic that is generally emphasized in the curricula of scientific and technological disciplines is the acquisition of skills in the field of experimentation and work in the laboratory. This way, practically, since the beginning of the degrees, students are faced with laboratory sessions and asked to apply the theoretical knowledge acquired to realistic practical situations.
In this work, the students are enrolled in a Bachelor Degree in Physics, and the contents related to Electronics are developed in the courses Physical Electronics, Micro- and Nano-Systems, and Digital Systems, all in the fourth year of the degree as well as in laboratory courses called Physical Techniques I, II and III, which are taught, respectively, in the second, third and fourth years of the degree. These courses aim to provide students with all necessary skills to carry out tasks related to the design and preparation of the experimental setups, realization of measurements and data collection and analysis.
On top of the skills that are particular to each degree, such as the operation of specific instrumentation, the use of component data-sheets or the familiarization with safety measures, students gain transverse skills like teamwork, writing technical reports or, even, working by objectives and deadlines since laboratory sessions have a finite time duration. All of them are highly valuable professional skills and, as well as what happens in a professional environment, students are expected to solve the questions asked making use of their knowledge but also of the resources at their disposal (Sánchez-Azqueta et al., 2015b).
Traditionally, before the realization of every laboratory session, students receive a theoretical–practical explanation about the goals and procedures to be used. In turn, during the session, they have access to specific supporting materials (instrumentation user manuals, component data sheets, etc.). Also, the instructors are present during the sessions to help in the realization of the different tasks. However, because every instructor typically has to deal with several groups simultaneously during each session, this scheme makes it difficult to provide an immediate and comprehensive answer to all questions raised by the students. On the other hand, on many occasions, students face similar problems, so it does not promote an efficient use of the time in the laboratory.
A solution to address this is the edition of multimedia contents where the most relevant aspects of the laboratory sessions are developed. This way, a theoretical–practical description of the key parts of each session is offered to the students in the shape of commented presentations, info-graphics or even videos.
Students can download the multimedia resources and use them to prepare the sessions before they take place, during their realization and even after they have finished to write the laboratory reports. Nevertheless, one aspect that remains unsolved to integrate the multimedia resources is how they can be accessed during the realization of the sessions to optimize the use of time. In this scenario, AR gains relevance because it allows a combination of physical and digital information in real time, and it can be implemented using common devices like tables or smartphones. As it has already been discussed, one particularly interesting realization of AR are QR codes since they can store large amounts of information and provide immediate access to it.
QR codes were created in 1994 by Denso Wave to manage and control their inventory. They are an evolution of traditional bar-codes, but in the shape of two-dimensional matrices, which allows them to store a larger amount of information (7089 numerical and 4296 alphanumerical characters). They are open-code and free of licenses, and they have been massively used from their first versions to the most recent iQR codes, which can adopt both square or rectangular shape. The biggest QR codes have up to 422 × 422 modules, which allow storing over 40,000 numerical characters. The information stored in a QR code can be a plain-text or a link to a URL, and it can also be used to start actions in a device such as making a phone call, sending an SMS or a digital card (vCard), sending an e-mail, linking a profile in a social network or adding an event to a calendar.
In the Internet, it is possible to find many free pages devoted to the creation of QR codes, among which we can highlight the web generators Kaywa (http://qrcode.kaywa.com), UQR (https://uqr.me/), GoQR (http://goqr.me) or QRCode (http://qrcode.es), a simple generator of QR codes that operates without the need of installation or registering.
The retrieval of the information stored in QR codes is carried out using the mobile devices themselves, for which it is also possible to find a great variety of free apps that realize that function in all mobile platforms. Some of them are QuickMark, ZXing Decoder Online or ScanLife.
The use of QR codes in education allows to establish links between the elements that are found in the educational environment (notes, reports, manuals, etc.) and information accessible through the Internet like texts with reinforcement materials, collections of problems and exercises, discussion forums, web-pages with specific resources or practical demonstrations of certain processes, to name only a few. Also, they have shown a great potential for applications where it is difficult to bring all the required resources to the educational environment, such as outdoor activities (Lai et al., 2013).
Description
For the development of this work, a set of multimedia resources have been developed to assist in the practical sessions of a laboratory of Electronics. These resources are accessed using hyperlinks in the shape of QR codes, which are placed in the materials of every session (as labels on the instruments or links in the laboratory scripts) in a place relevant in their development. These resources have the purpose to improve the use of laboratory time and also to achieve a more significant learning.
Initially, two types of multimedia resources were developed, each associated to its own QR code. Ones, called Type 1, are placed directly on the instrumentation used in the laboratory session, and they provide hyperlinks to manuals and data-sheets; their goal is to facilitate the access to information on the operation and use of the instrumentation required in the laboratory. To endow these resources with a character transverse to different courses of scientific and technological degrees, this first type of QR codes has been oriented to basic pieces of instrumentation such as oscilloscopes, signal generators or multi-meters. In particular, one of them provides a link to the user manual of the Agilent InfiniiVision 2000X oscilloscope, as shown in Figure 1.
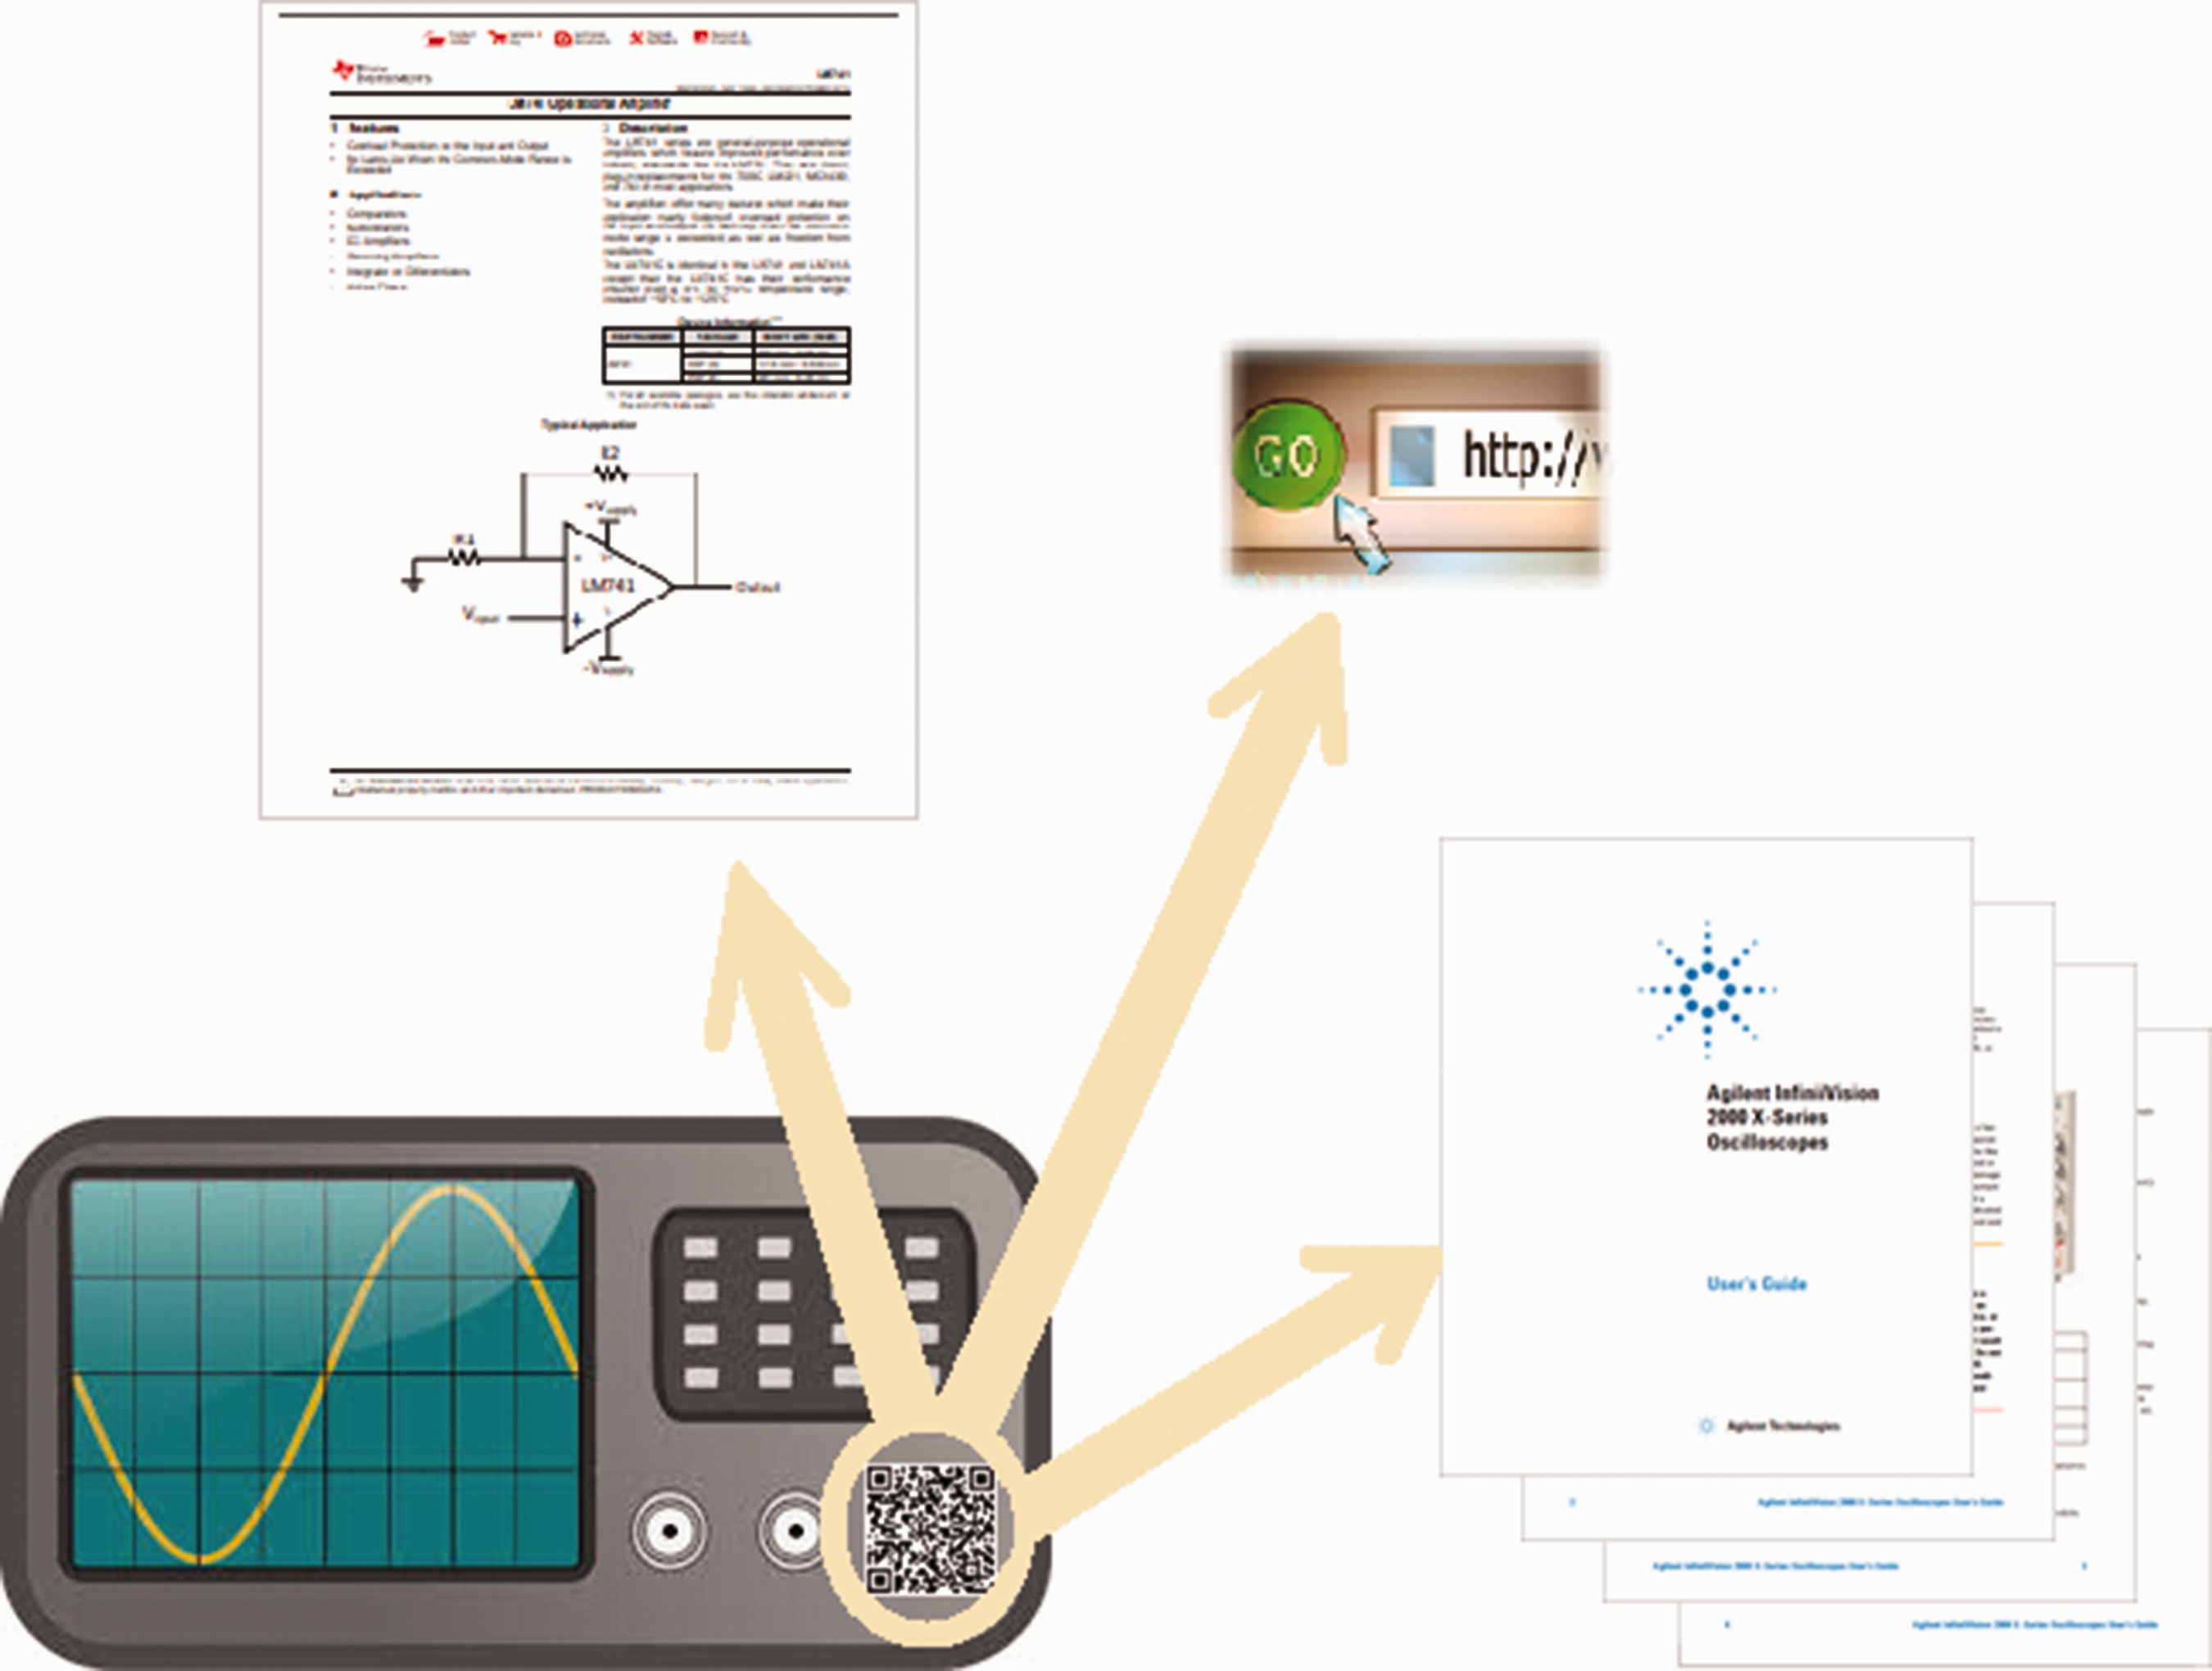
Illustration of the use of QR codes in a laboratory of Electronics. A QR code placed on the instrumentation gives access to materials such as datasheets, user manuals or other relevant information online.
This approach can be understood as the first level of the use of QR codes in laboratory activities and, as such, has already been used before Dorado et al. (2016). In this work, the use of QR codes has been given a wider scope to provide a more comprehensive set of tools for the laboratory sessions, developing and setting up specific pieces of multimedia contents that are accessed by them, which gives rise to two new types of QR codes as described in the following paragraphs.
The second type of QR codes, called Type 2, appears in the documentation that every student has to download to carry out the laboratory sessions. Using them, students have access to commented presentations of the most relevant theoretical and practical aspects of the sessions as well as to videos with practical demonstrations of how the measurement of particular parameters in the most difficult parts of the sessions is carried out. This allows an optimization of laboratory time, minimizing the issues that arise when specific instrumentation is used, improving its operation and allowing students to concentrate on the analysis of the results and their relationship with the theoretical predictions.
The contents generated to build the tutorials and videos are oriented to detail common measurement processes in the field of Electronics, such as the determination of the main characteristics of electrical signals, the bandwidth of a system, the slew-rate of a general-purpose operational amplifier or the voltage gain of an amplifying stage. As an illustration, Figure 2 shows a sample of the teaching materials that have been developed.
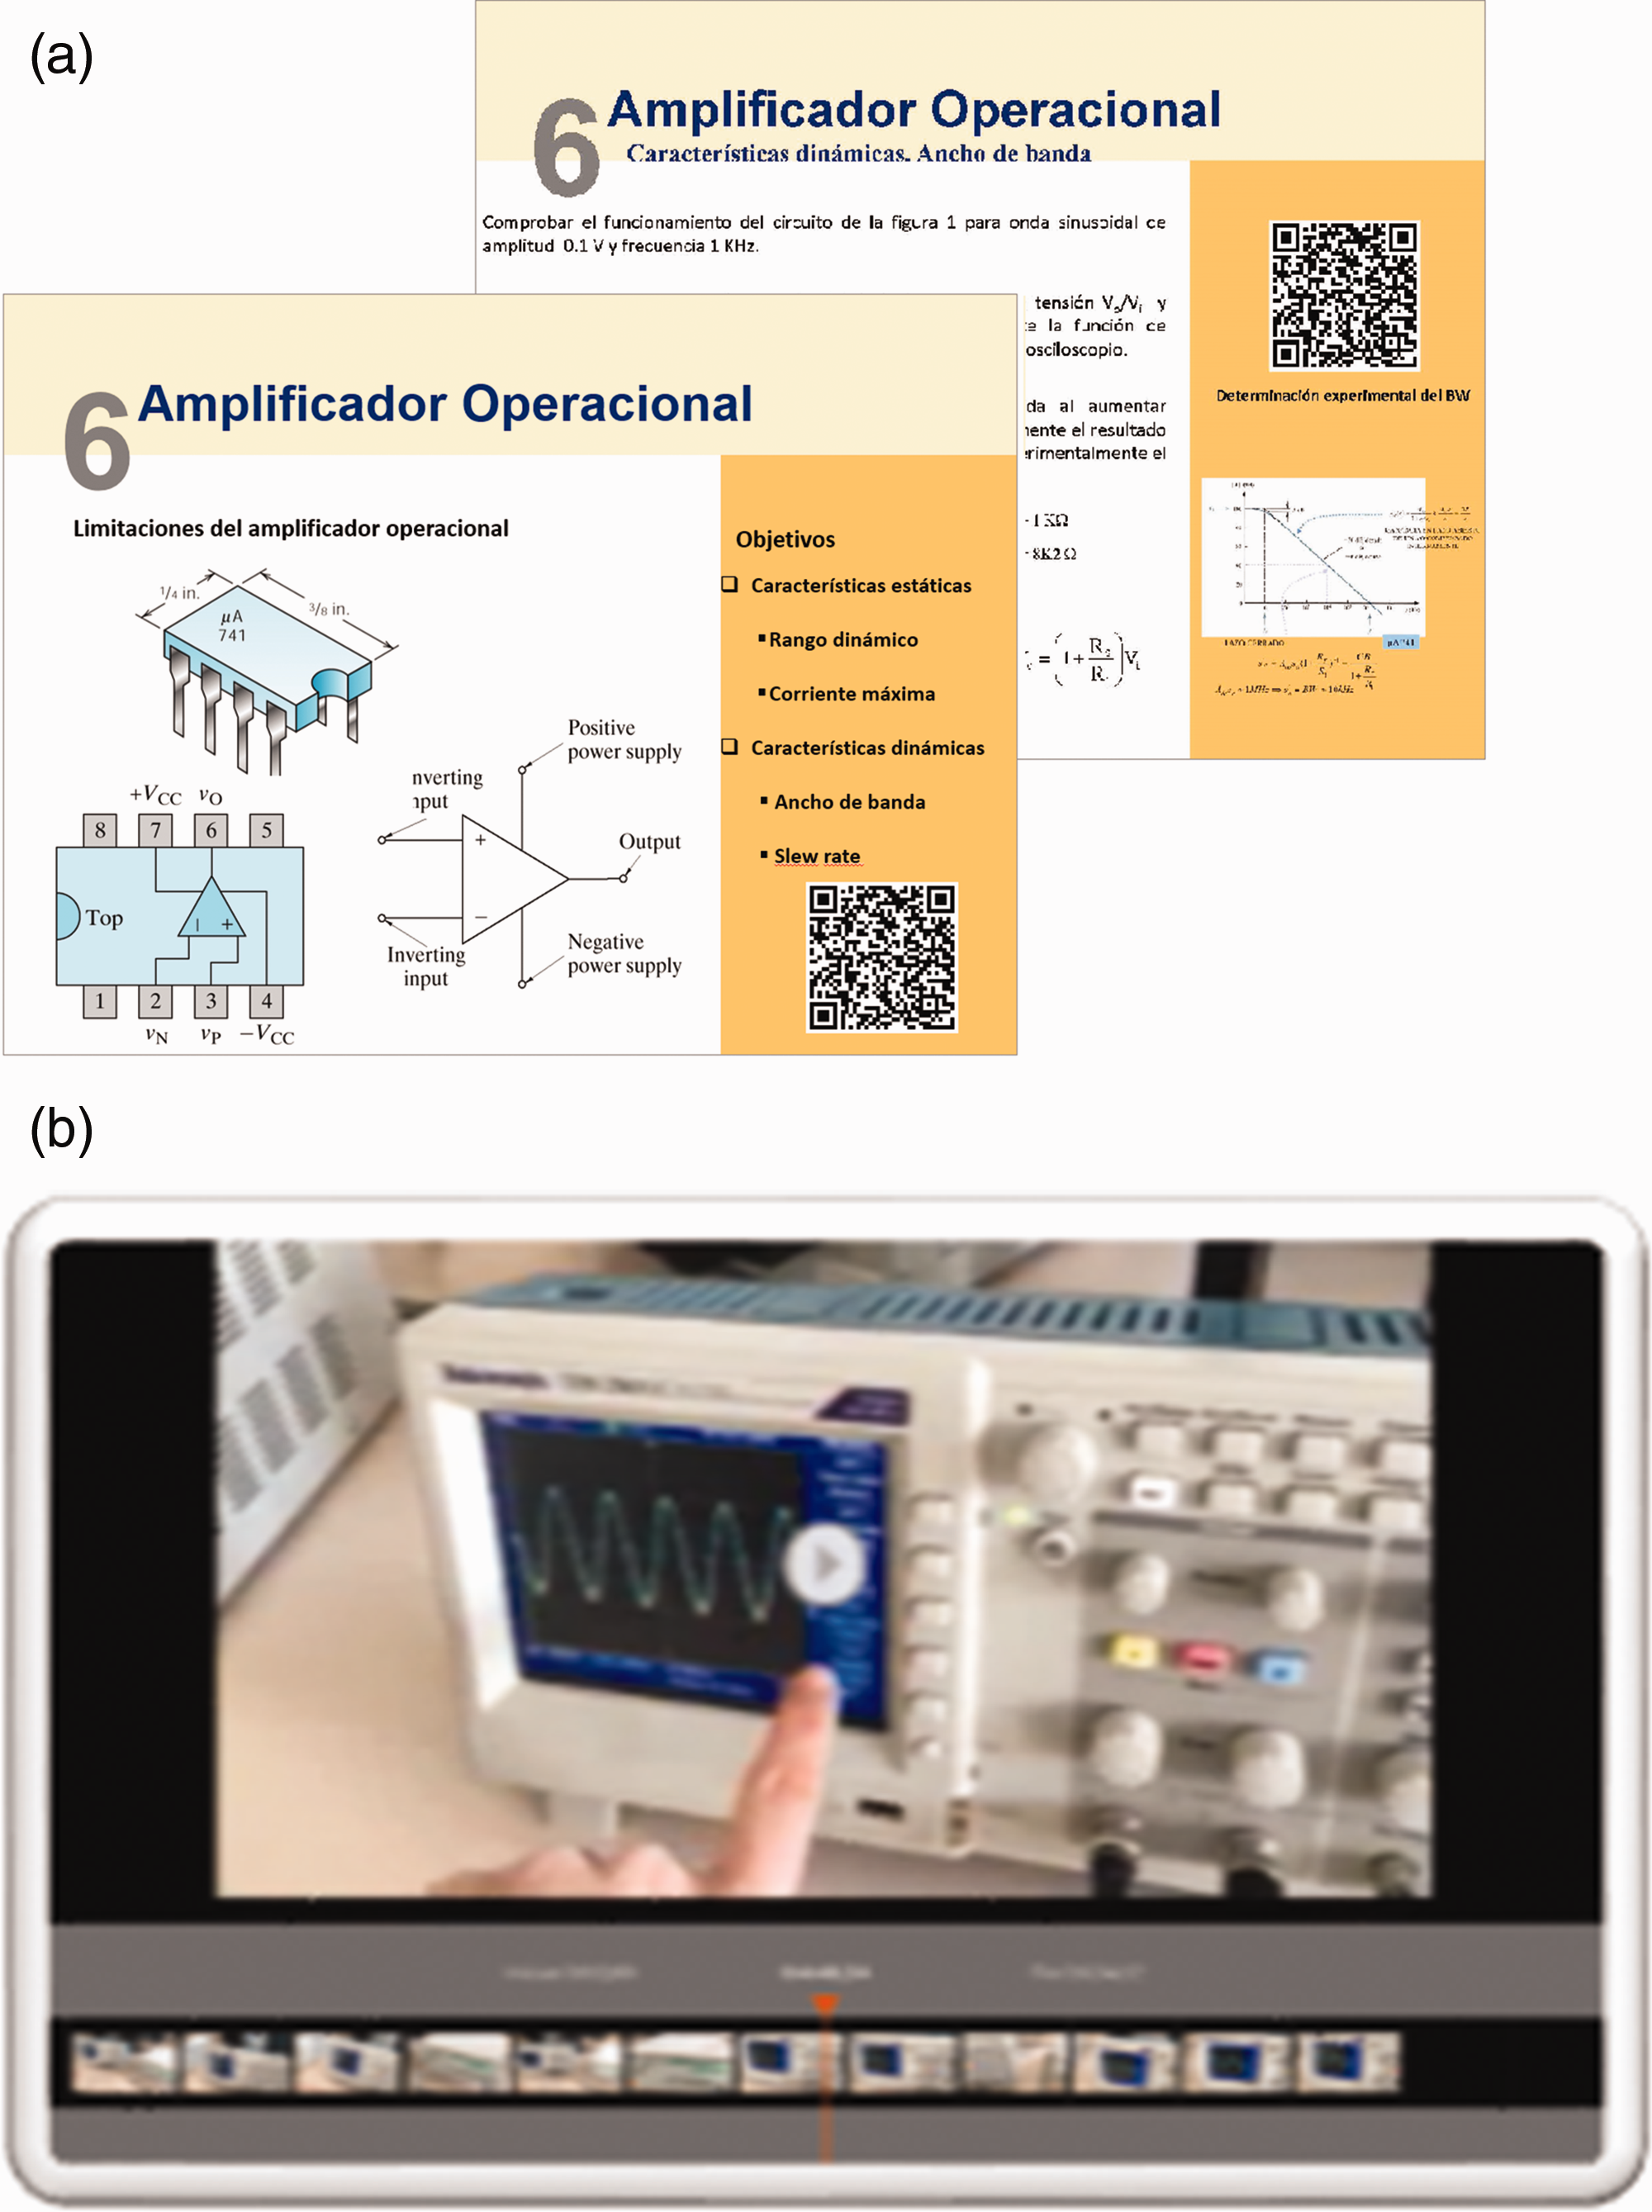
Examples of the use of QR codes in the realization of the practical sessions and of the resources generated to be accessed through them. (a) QR codes in the slides of the session explanations and (b) frame of an explanatory video of the measurement process.
In a subsequent stage, a specific set of resources with their corresponding QR codes has been developed to complement the two types of codes described above. These codes, called Type 3 codes, have been added to the documentation corresponding to a set of laboratory experiences that have in common the use of the operational amplifier as a core circuit element to the study and characterization of different configurations. Particularly, they appear in the sessions devoted to the characterization of amplifying stages and active filters.
Type 3 QR codes are in turn sub-divided into two categories: the first one includes QR codes that provide links to contents relative to the origin and history of the operational amplifier as well as to the establishment of the companies that pioneered their design, fabrication and commercialization. These codes give the opportunity to present students with materials of a more informative nature in a selective way, which seldom appear in the academic programs. Figure 3 shows an example of the Type 3 QR codes found in the laboratory script of the sessions on the characterization of amplifier stages.
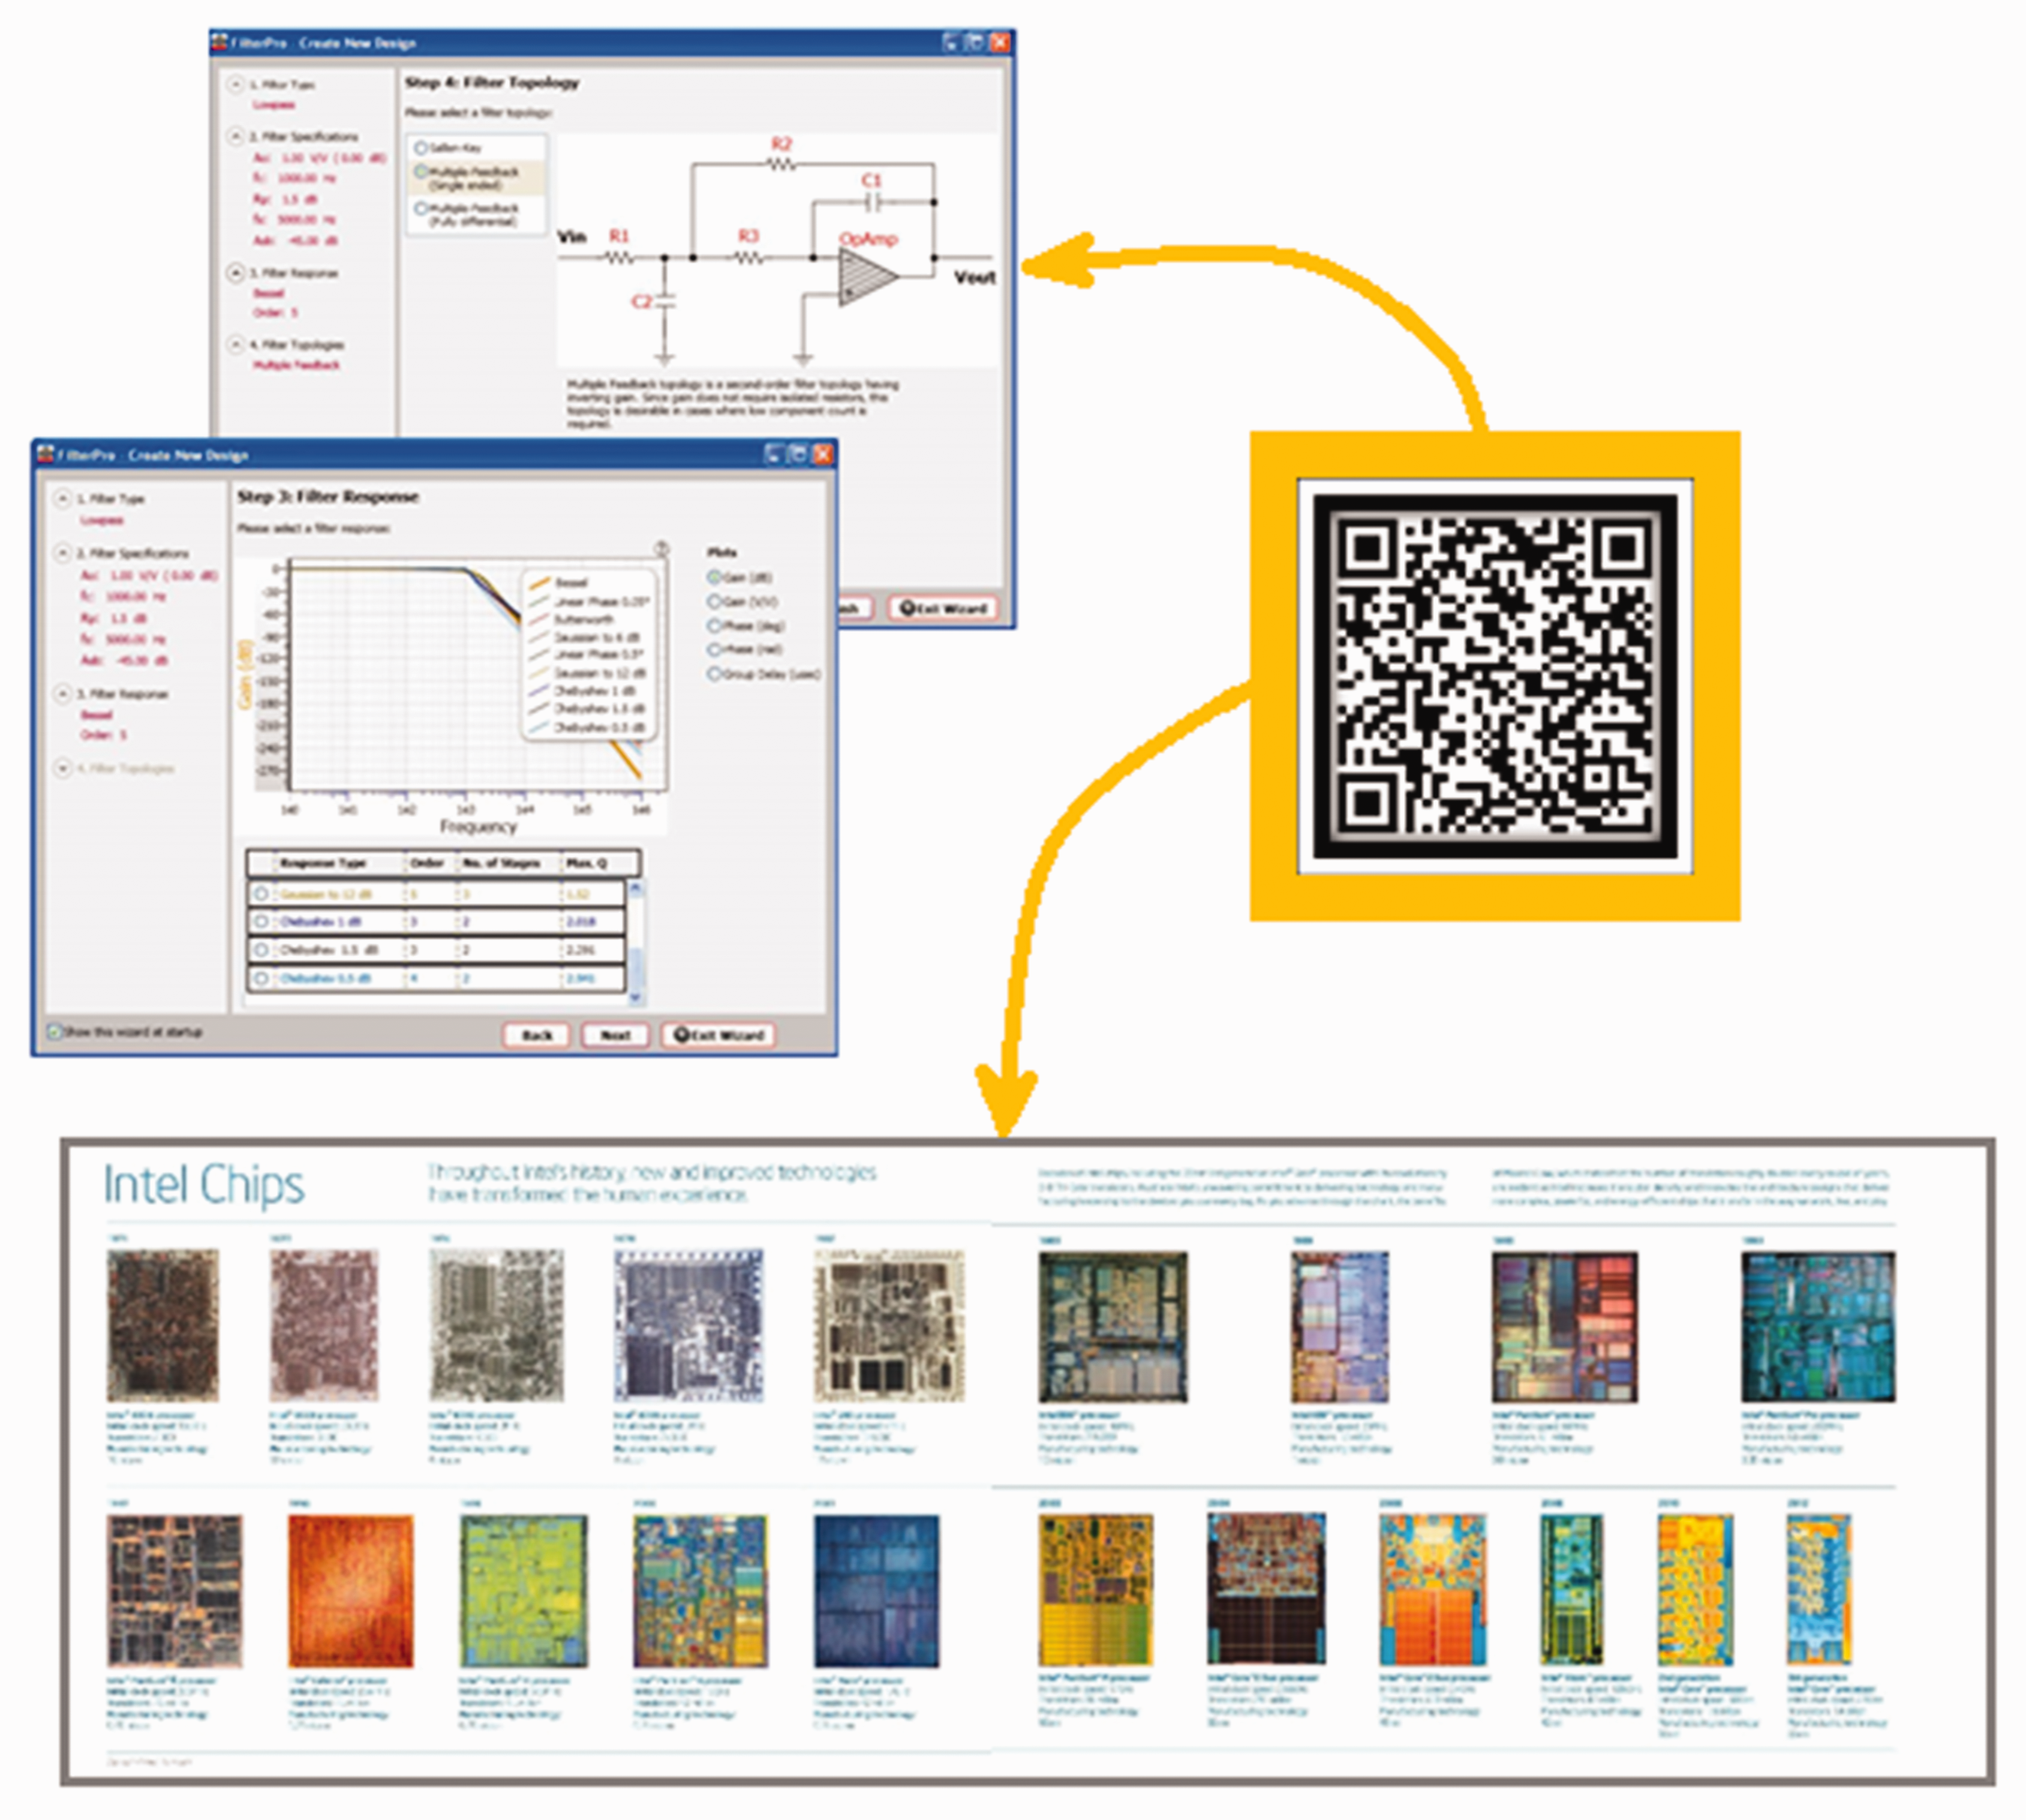
Illustration of the use of QR codes to provide a link to simulation tools for the operational amplifier (FilterPro™) and an infographics on the history and evolution of the fabrication of integrated circuits (Intel Museum, www.intel.la).
The other category, associated to laboratory sessions on the characterization of active filters, is made up by QR codes that provide links to simulation resources, application notes and self-assessment exercises. These resources allow both the virtual characterization of filters that are not experimentally characterized in the laboratory and the possibility to check the data obtained from the filters that have been actually characterized in the laboratory, which give students a broader view of these structures.
The self-assessment exercises have the objective to consolidate theoretical aspects presented previously and also to help in the realization of the report or laboratory notebook that every student has to hand out after the realization of each laboratory session. All this facilitates the acquisition of skills related to the scientific method, and in particular to the treatment, analysis and interpretation of the data obtained in the laboratory, the argumentation of the results and the extraction of conclusions.
Type 1 QR codes are intended to be used in the laboratory from the first day. In turn, Type 2 and Type 3 QR codes have been incorporated to the documentation when they are needed for the realization of the laboratory sessions. All the contents that have been developed to be accessed using the QR codes (video-tutorials, manuals, supplementary information, etc.) have been hosted in a permanent course in the virtual platform of the authors’ institution.
Methodology of the research
The assessment of the activity has been realized around the following three major points:
Performance of the students in the realization of the laboratory sessions. Quality of the resources designed and their accessibility as a software product. Personal motivation and satisfaction of the students.
The first one has been assessed by the registration of the laboratory time that the students needed to carry out the tasks entrusted, and the assessment of the laboratory reports and their comparison with the results registered in past editions of the course, when the resources were not available. It is expected that having a quick and immediate access to a set of multimedia resources applied to the laboratory sessions will improve the learning process of the students, which in turn will translate to an overall better performance.
To evaluate the quality of the resources, the ISO 9126 international standard for the assessment of software products has been adopted. It is organized in four main parts, which evaluate, respectively, the quality of the software product, the performance with respect to external benchmarks, the performance with respect to internal benchmarks and the use of metrics. The first part is referred to as ISO 9126–1, and it assesses the quality of software products attending to six categories:
Functionality Efficiency Usability/re-usability Reliability Sustainability Portability
In this work, we have designed a specific test to assess the quality of the multimedia resources and their access using as a base the ISO 9126–1 standard as described above. To particularize it to the characteristics of our design, we have formulated questions regarding these six topics as they are perceived by the students when using the materials. Figure 5 shows an extract of the test, with statements regarding all six topics about the assessment of the quality of software products.
The third major point around which the activity has been evaluated is the experience of the students, since evidence suggests that there exists a strong correlation between student motivation and satisfaction and the success of virtual learning activities (Regueras et al., 2009). To this end, a specific survey has been created to obtain information about the activity by a set of statements to which students need to indicate their degree of satisfaction using a Likert scale from 1 (strong disagreement) to 5 (strong agreement).
Among the aspects of interest, it has been asked whether:
The resources provide links to relevant information. The resources facilitate the consultation of the manuals. The resources facilitate the measurement process. The multimedia contents linked produce a better use of the laboratory time. The resources minimize the time used searching for information. The multimedia contents linked improve the laboratory results.
Results
Example of application
As an example of the application of the proposed methodology to the practical laboratory sessions of the course, we describe in the following paragraphs its use in the study of the limitations of the operational amplifier, carried out for the first time in the second laboratory session of the course Physical Techniques I and also used in the subsequent sessions. Students are asked to determine experimentally the slew-rate of the amplifier in a non-linear configuration (a basic comparator) and also the bandwidth of a non-inverting amplifying stage.
The design of the measurement setup and the measurement of the bandwidth have been, in the previous years, the part of the session where students have on average found the most difficulties. This translated in a significant increase in the demand for instructor assistance and in a significant number of lab reports with a wrong result for the bandwidth. To solve this, a Type 2 QR code was developed that linked to a video-tutorial covering the measurement process of the bandwidth of the non-inverting amplifier stage from the experimental setup to the realization of the measurements.
The first effect that was observed after introducing the QR code linking to the video has been an optimization of the time spent in the laboratory. On average, when compared to previous years, all students are capable to finish the measurements within the time assigned to the session, and the average time in the lab has been reduced by 15%. Another effect that has been observed is an improvement in the marks received by the reports made by the students, which stems from the fact that their performance in the lab is better, and therefore they are able to provide answers to all questions asked, and also because the ratio of wrong answers is reduced, due to a better comprehension of the physics behind all measurements and calculations made. As a way of example, Figure 4 shows a comparison between the marks obtained by the students in the two years prior to the implantation of the strategy presented in this paper (in blue) and the marks in the first year of the use of the QR codes (in green). Figure 4(a) shows the results of the second laboratory session, devoted to the determination of the slew-rate of a comparator and the bandwidth of an amplifier as indicated above. In turn, Figure 4(b) shows the results of the next laboratory session, devoted to the study of filters and signal conditioning stages, to illustrate the general trend achieved by the experience, with a shift of the marks towards to top grades.
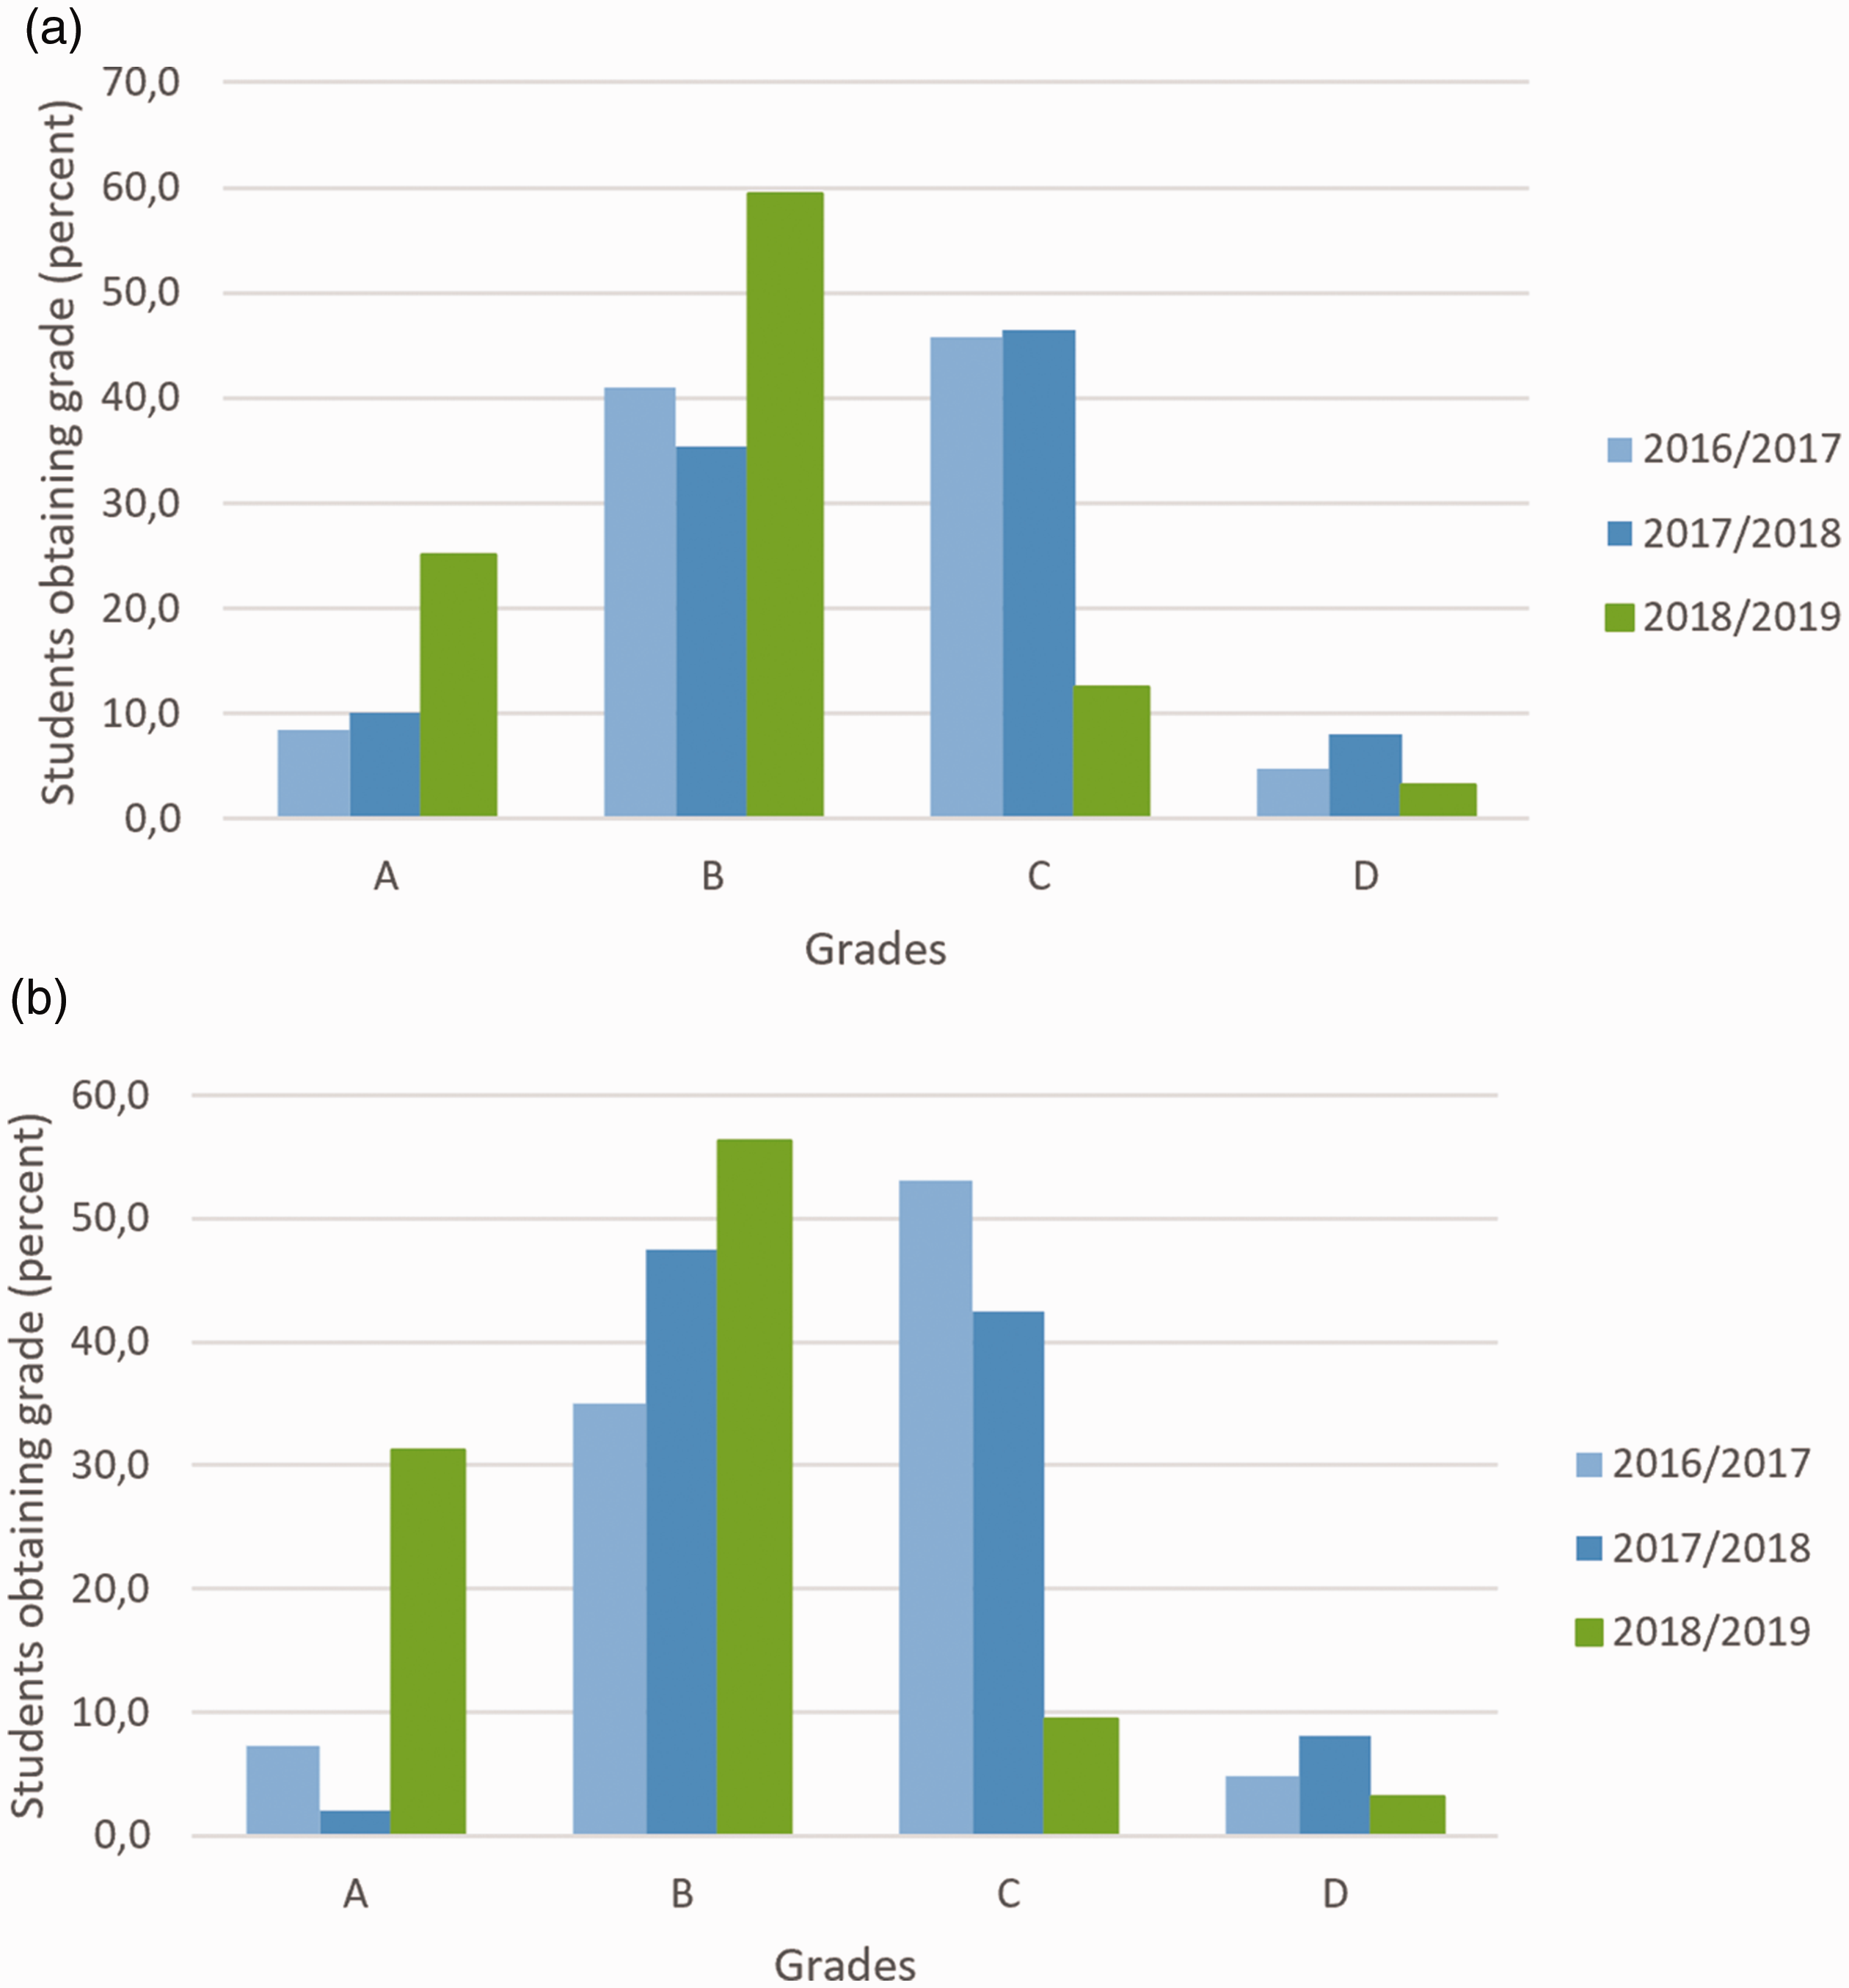
Comparison between the marks obtained by the students in the two years prior to the implantation of the strategy presented in this paper (in blue) and the marks in the first year of the use of the QR codes (in green). (a) shows the results of the second laboratory session, devoted to the determination of the slew-rate of a comparator and the bandwidth of an amplifier, whereas (b) shows the results of the third laboratory session, devoted to the study of filters and signal conditioning stages. Marks are: D-fail; C-pass, B-good, A-very good/outstanding.
Assessment
The analysis of the three major points for the assessment of the activity described in the Methodology has shown a reduction in the average time spent by the students for the realization of the laboratory sessions. While every session has an expected duration of 3 h, there are some specific parts where students found more problems and contributed to an overall longer duration. For this reason, the multimedia resources designed for this activity, and in particular the videos accessible via type 2 QR codes, have been designed specifically to cover these parts. As a result, the instructors have observed that the realization time of these parts has been reduced by an average 15% when compared to the times registered when the multimedia materials were not available. Also, the grades obtained by the students in the laboratory activities have shifted towards the highest grades, with most students earning a grade of ‘good’ or ‘outstanding’ in a scale that comprises the levels ‘fail’ – ’pass’ – ‘good’ – ‘outstanding’.
This reduction has been observed to be due to two main factors: (i) students do not need to wait for the assistance of the instructors, which typically required them to be idle until the instructor finished to help other groups and (ii) having a direct access to the sources of relevant information, students carried out the tasks in the laboratory in a more fluent way.
Students were asked to grade each of the statements in the software assessment test using a Likert scale from 1 (strong disagreement) to 5 (strong agreement); subsequently, the results were averaged using the relative weights shown in Figure 5. As it can be seen from the relative weights, the strongest emphasis is placed on the functionality of the resources (25%) and then on the efficiency, usability and portability (20% each); finally, the reliability (10%) and sustainability (5%) were also considered, but to a lower amount. The results obtained from the answers provided by the students showed that the general appreciation of the quality of the software was high, with an average of 4.2 out of 5.
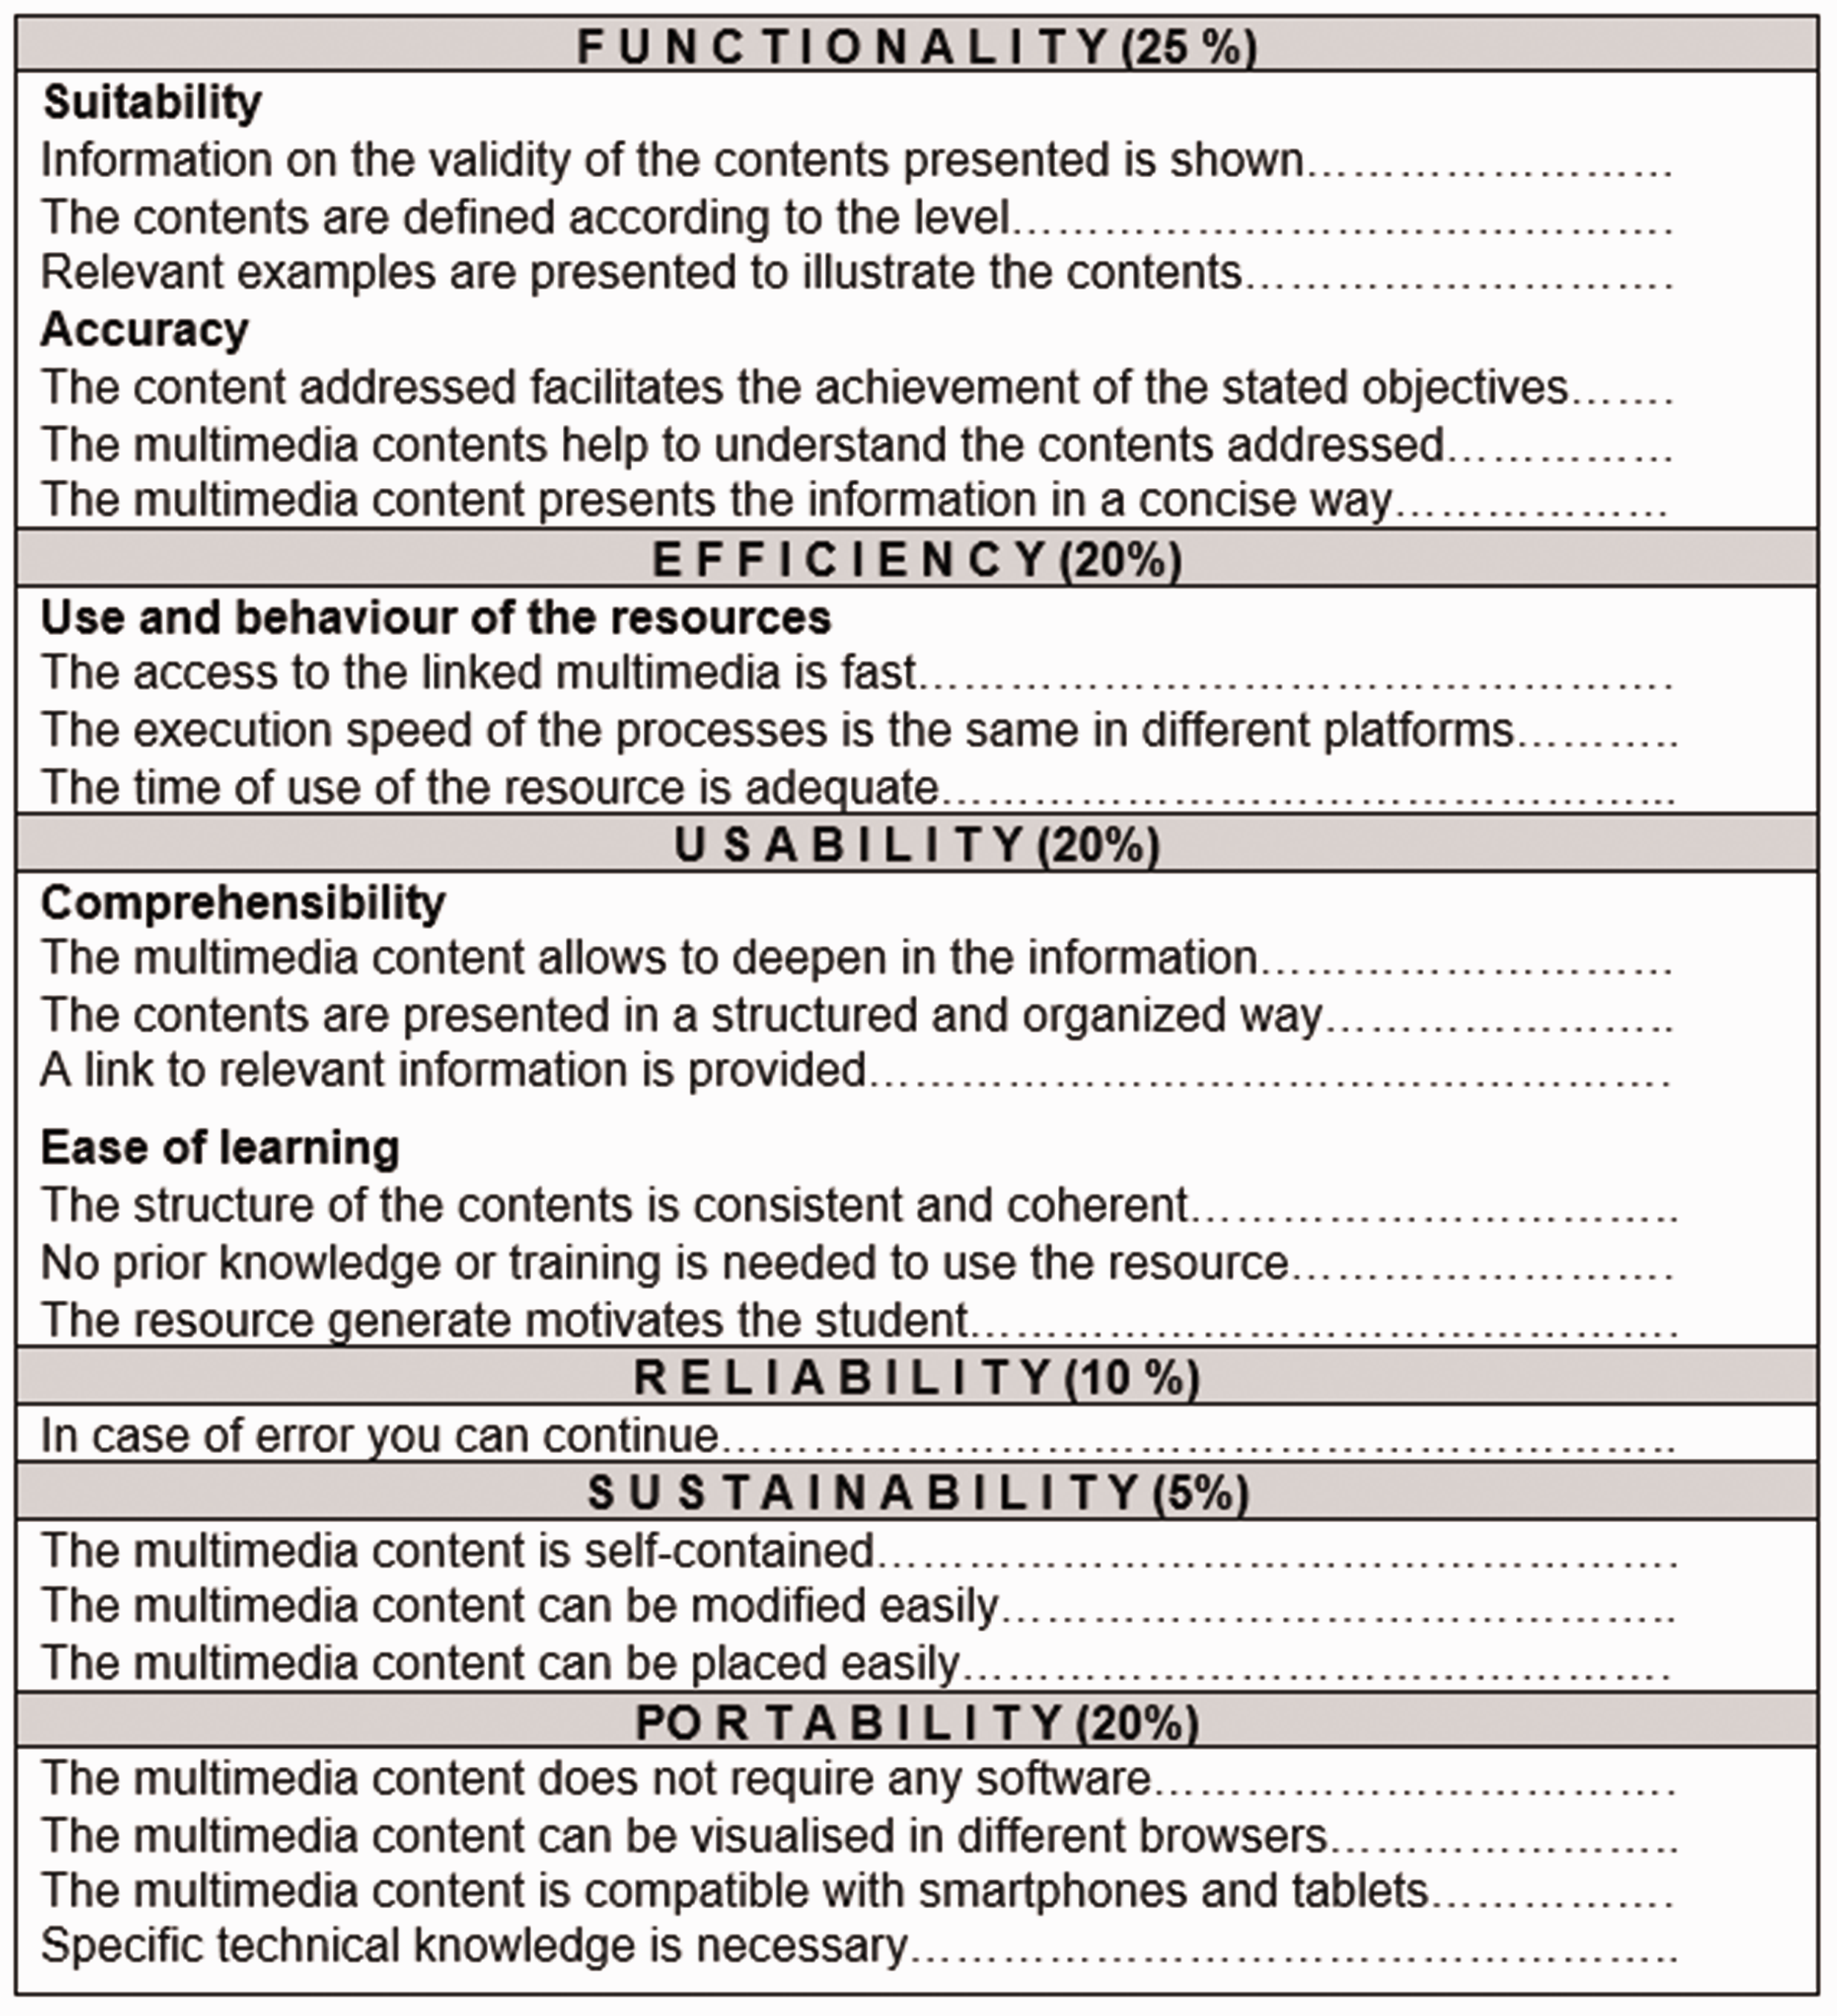
Example of the test designed to assess the quality of the software according to the ISO 9126 standard.
In the survey on student satisfaction, over 75% of them gave a grade of 4 or 5 to the questions raised. This shows that students are in general content with the inclusion of the multimedia resources for the preparation and realization of the laboratory sessions, which agrees with the evidence suggesting that student satisfaction and performance are correlated.
Finally, we can also remark that, on top of the benefits associated to m-learning, such as immediate access, interaction, customization or the individualization of learning, this experience has resulted in an improvement of the autonomy of the students in the acquisition of experimental skills, since they have always access to an active source of assistance that is particularized to the instrument and measurement process that is being used.
Conclusions
This work presents the use of QR codes in a laboratory of Electronics to provide additional and contextualized information that can be consulted by the students when they need it.
With this goal, three types of QR codes have been developed: Type 1 codes are placed directly on the instruments, and they offer hyperlinks to manuals, data-sheets and other generic information, which facilitate the access to information relative to the operation of the instruments.
Type 2 QR codes are found in the documentation of every laboratory session, and they provide access to practical demonstrations of the measurement process of certain parameters in the most complex phases of the realization of each session.
Type 3 QR codes, developed in a later stage, allow to access contents relative to the history of a basic component used in the sessions, the operational amplifier, and to the beginning of the companies that have pioneered the field as well as to simulation tools, application notes and self-assessment exercises.
After the realization of the proposed activity, we can conclude that the students have achieved a better performance in the laboratory both from the point of view of the practical realization of the sessions and the reports presented.
The assessment of the multimedia resources has been also done from the point of view of a software product, adapting the ISO 9126 standard to fit in the goals of the activity and the resources generated. For this, the six major points to evaluate a software product, as indicated in the standard, have been used to create a survey that has shown that the general appreciation of the quality of the resources is high.
The general impression of the students has also been investigated, since the literature shows that it is correlated with their performance. In general, it has been found that students are satisfied with the activity and the resources, which seems to agree with the fact that their performance has been better than when the resources were not available. In this respect, it is noteworthy that no test group was set up, and all students had access to all multimedia materials for the realization of the laboratory sessions, so the comparison has been made with the results obtained from previous editions of the laboratory sessions.
In general, thus, it has been seen that by the use of the multimedia resources designed and their access by QR codes, a reduction in the realization time of the practical sessions has been achieved. Also, attending to the performance of the students, we can conclude that it has contributed to achieve a deeper analysis of the laboratory results and their relationship with the theoretical concepts of the course, and thus a more significant learning.
Finally, it can be highlighted that, although the experience is particularized to the field of expertise of the authors, with an appropriate re-design and adaptation of the contents linked, the general nature of the methodology presented in this work makes it easily transferable to improve the learning of experimental skills in other scientific and technical disciplines.
Footnotes
Acknowledgements
Acknowledgements
The authors thank the BEAGLE research group (Universidad de Zaragoza) for their assistance in this work.
Declaration of conflicting interests
The author(s) declared no potential conflicts of interest with respect to the research, authorship, and/or publication of this article.
Funding
The author(s) disclosed receipt of the following financial support for the research, authorship, and/or publication of this article: This work has been partially supported by the Universidad de Zaragoza under grants PIIDUZ_17_065, PIIDUZ_15_001, and PIIDUZ_14_021.