






Abstract
Renewable energy sources are replacing other energy sources to minimize the cost of due to the conventional sources of energy. Solar and wind are readily available sources which will minimize the cost of electricity if implemented properly. Considering the weather and other relevant advantages, solar energy is a favorable option for a particular site. But it is extremely difficult for the implementation of the suggested renewable energy in a site which already has specific resources and existing infrastructure to replace. Several factors should be counted in for the selection and implementation of appropriate renewable source for fulfilling the demand. As a possible energy option, on-grid infrastructure is selected looking at its low necessity of development and hardware cost. This paper aims to impart the detailed designs of alternative energy options that will offset the annual irrigation costs of the Rainbow Youth Golf Education Program in Klamath County. Using simulator, a practical modeling of the system is performed to look at the cost associated with each case. After selecting a combination with the minimum cost, it is shown that the model decreases the irrigation cost compared to previous year. Other technological implications are also evaluated. Finally, worst case scenario is modeled using the simulator to show that even in the bad weather, the site’s energy supply model serves well both electrically and economically.
Introduction
Managing reliable and cost-effective power supply through renewable energy requires a complete analysis of the possible energy outcome. Since renewable energy sources are intermittent in nature, they require proper planning and supplementary support in order to be implemented. Additionally, looking at their excessive set up cost, their electricity generation for using them in microgrid requires a lot of future planning. In order to make generation constant through them, they also require proper energy storage systems as well. At the same time, future power generation cost at rural and remote areas could easily be alleviated using well-planned renewable energy sources. Possible alternatives are always being explored in order to minimize electricity usage cost in different sectors. Here, we also analyze the feasibility of a particular site in terms of its suitable renewable energy source and energy storage system with a view to minimizing irrigation cost.
A lucrative alternative 1 to deliver power to areas are renewable energy sources. They have shown excellent potential to supply power to compliment current power system as a microgrid. To meet the constant power demand of a load under varying natural condition, one would need to incorporate different energy sources and converters. 2 The system design involves evaluation of specific equipment that could be used to include different modules, mount racks, and power transmission systems. A proper simulation is also needed to be done using selected arrangements.3,4 Additionally, due to different uncertainty related to renewable energy sources, our first choice to power any site with renewable energy sources such as the wind and solar would be an evaluation of weather. Weather analysis of the sunshine, wind speed, water availability is one of the primary concerns of feasibility analysis of any particular site. 5 Different site optimization method has been previously analyzed by many including Banos et al. 6 By solely considering price, Evans et al. and Ersan et al. 7 compared wind power, hydropower, photovoltaic and geothermal energy with success. 8 Lund 9 took into account technological changes such as energy saving, efficiency improvement, and implementing renewable energy. Other studies such as Hepbasli 10 and Varun and Bhatt 11 include energy, economics and environmental impacts of renewable energy. Now definitely wind and solar energy technologies are the front runners amongst the renewable sources.12,13 Improvement of solar cell efficiency in recent years 14 clearly indicates that it would be a reasonable option for many designs. Solar and wind energy is the most popular choice for various advantages that they pose over others. All of these factors have been previously scrutinized with greater details. 15
Additionally, a design consideration with renewable energy sources must include a proper cost analysis and energy storage systems. Since they are intermittent in nature, they require storage support to supply power during periods of low generation. Lithium ion batteries, hydrogen fuel cells, flywheels, pumped hydro storage are some of the popular choices among the storage options which have various kinds of disadvantages and advantages.16–20 By considering all the aspects of the energy system, storage capability, and proper cost analysis, it would be possible to depict a complete picture of feasibility analysis.21,22
The Rainbow Youth Golf Education Project (RYGEP) is located on 44 acres of land located along Agency Lake. The irrigation costs for the golf facility consist of the mainly electrical expenses. Figure 1 shows the annual usage of energy over the months for three areas, namely Pump-Willy’s house, Willy Sr and Karen’s place, and Agency Lake Pump. The summation of the monthly kWh usage indicates that the first area contributes the most in the total kWh.
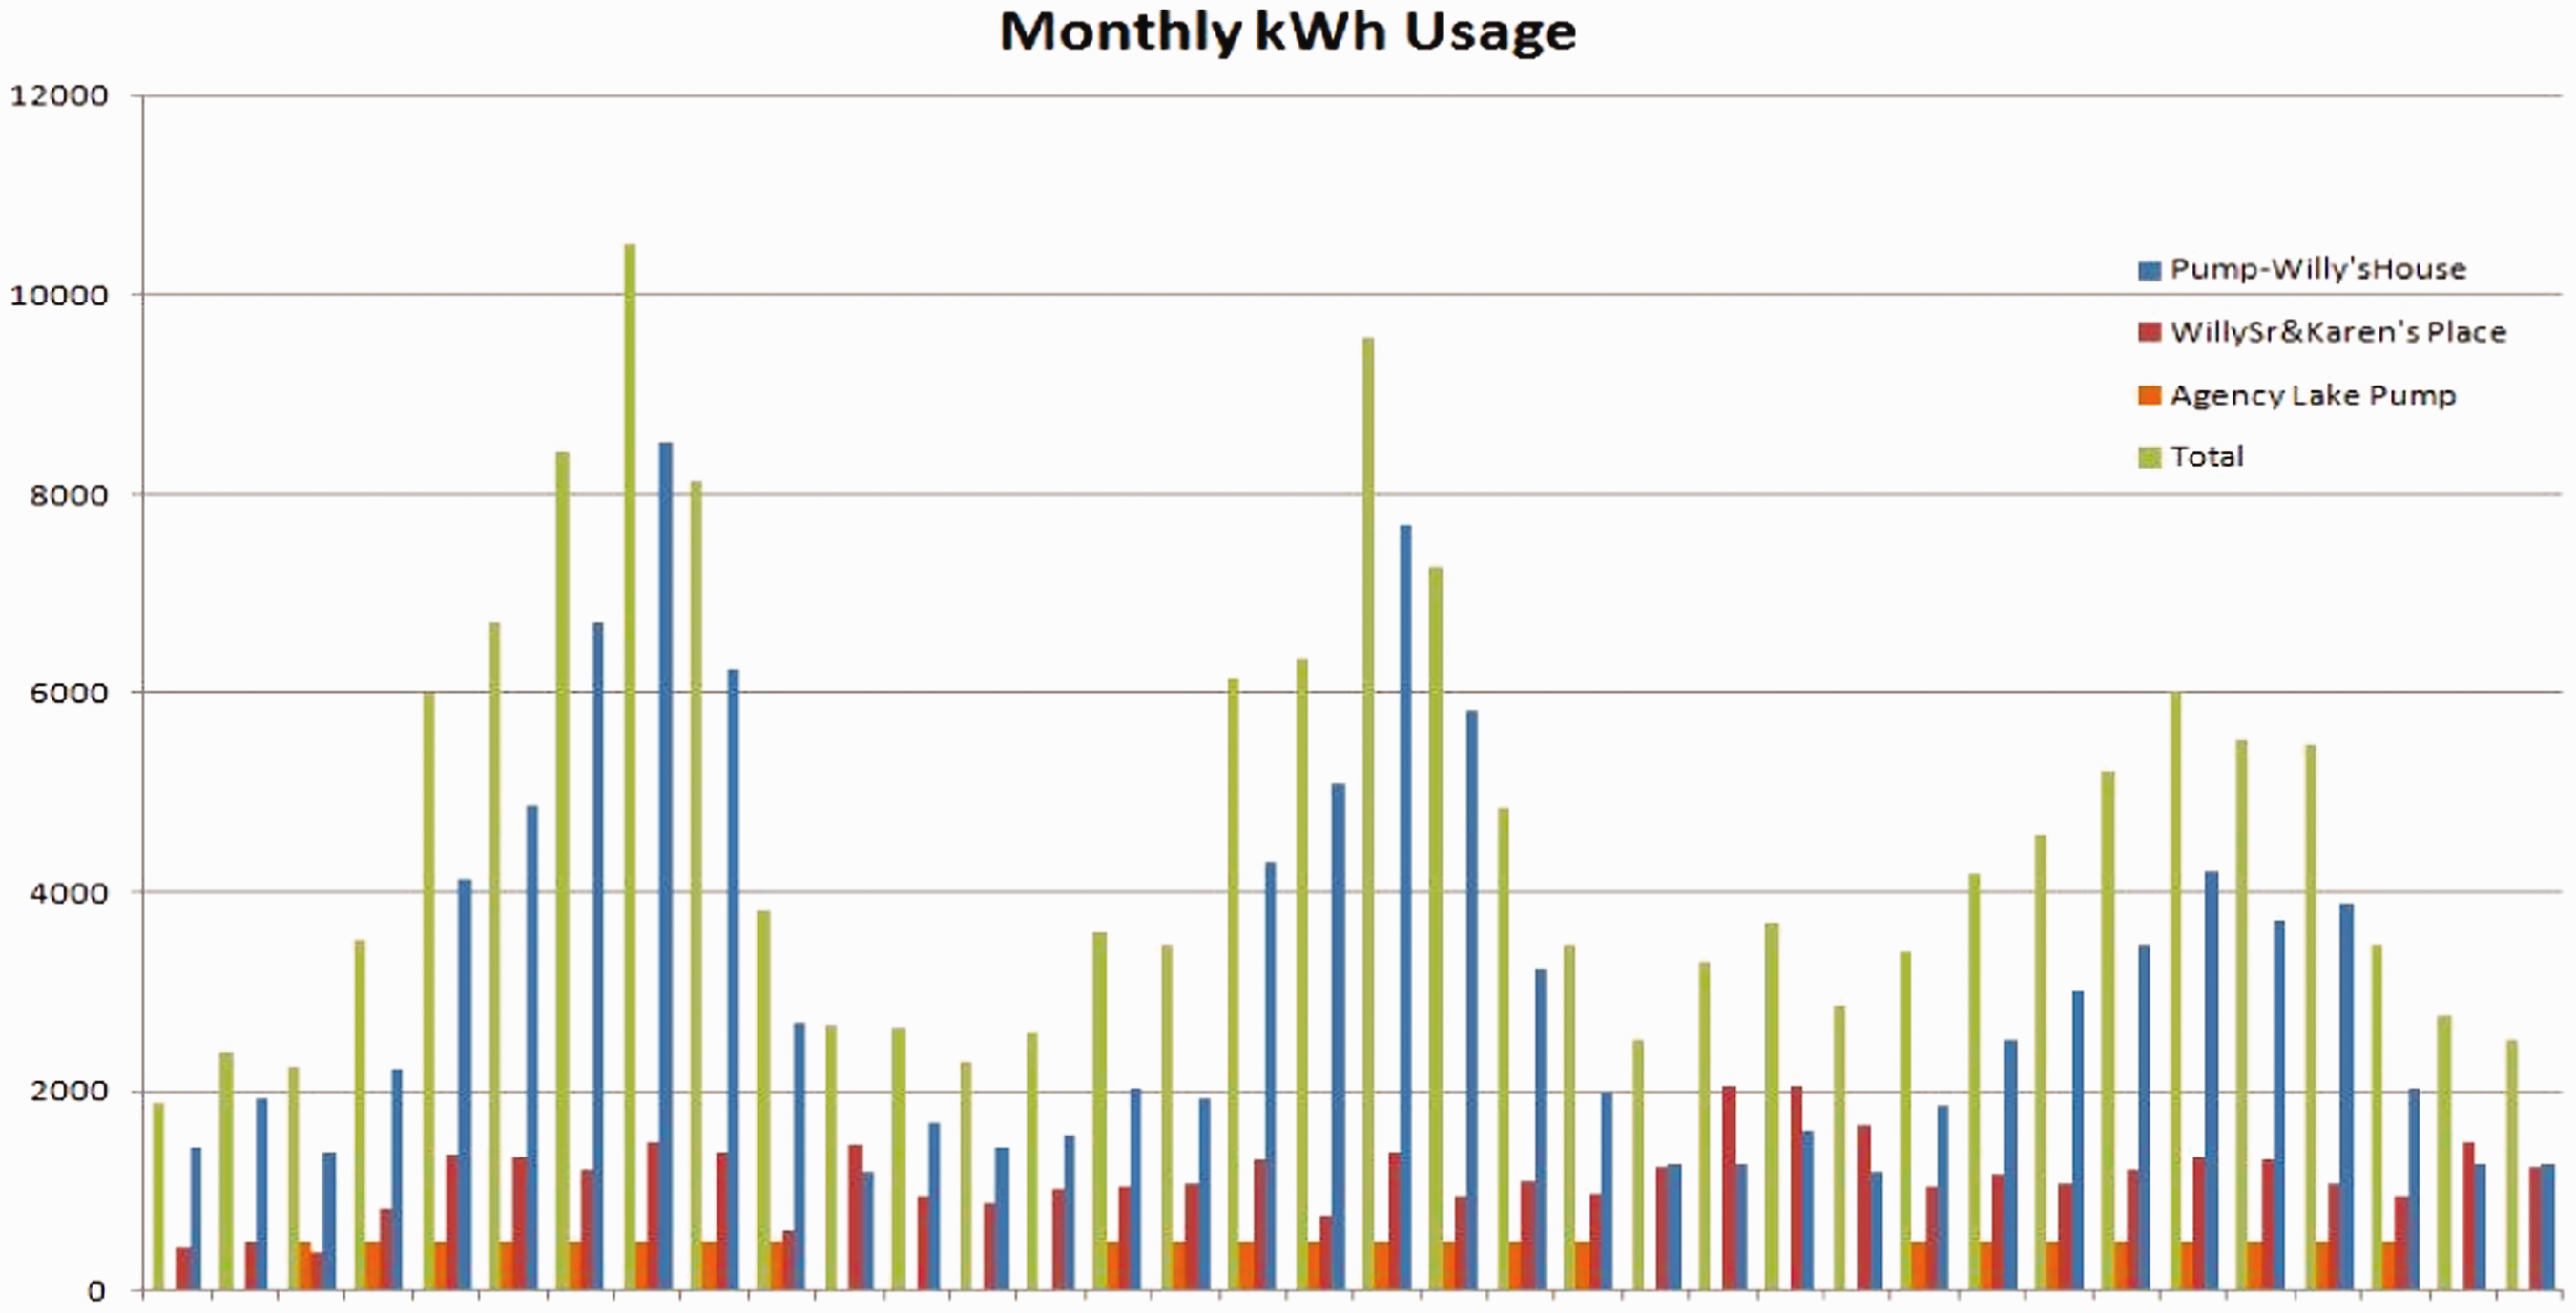
Annual kWh usage by month will give an overview of the task ahead.
The most promising renewable energy is solar because of a large percentage of sunny days in the area which made sure that enough radiation is achieved. Even though data collected show that not enough wind is present to justify the building of a wind turbine. As part of the strategy to help the RYGEP offset, its cost, energy storage options are evaluated. Considering all the options, the grid is selected as the best option for energy storage. Remaining on the grid allows the RYGEP to use pacific power corporation’s (PPL) existing infrastructure, saving development and hardware costs. A topographic map created by the U.S. Geological Survey is imported into Revit Architecture software and is used as a guideline for tracing the topographic lines. Once the RYGEP property is mapped, it is used as a template for various energy generation and storage equipment layouts. Using that software-generated simulation, proper cost optimization of the site is conducted.
The main purpose of the work is to provide detailed designs of alternative energy options that will offset the annual irrigation costs of the Rainbow Youth Golf Education Program in Klamath County. Figure 2 shows the current cost of energy usage. That is why several design options will be evaluated emphasizing the most cost-effective method. The rest of the paper is organized as follows: the next section explains the educational benefit of the concept the paper has for the students of electrical engineering department. In the subsequent section, functional modeling of the feasibility analysis is done. Using those data and framework of the previous section, our proposed sites evaluation is then described. The result of the analysis and final decision is represented in the penultimate section. Finally, the study of the paper is summarized in the last section.
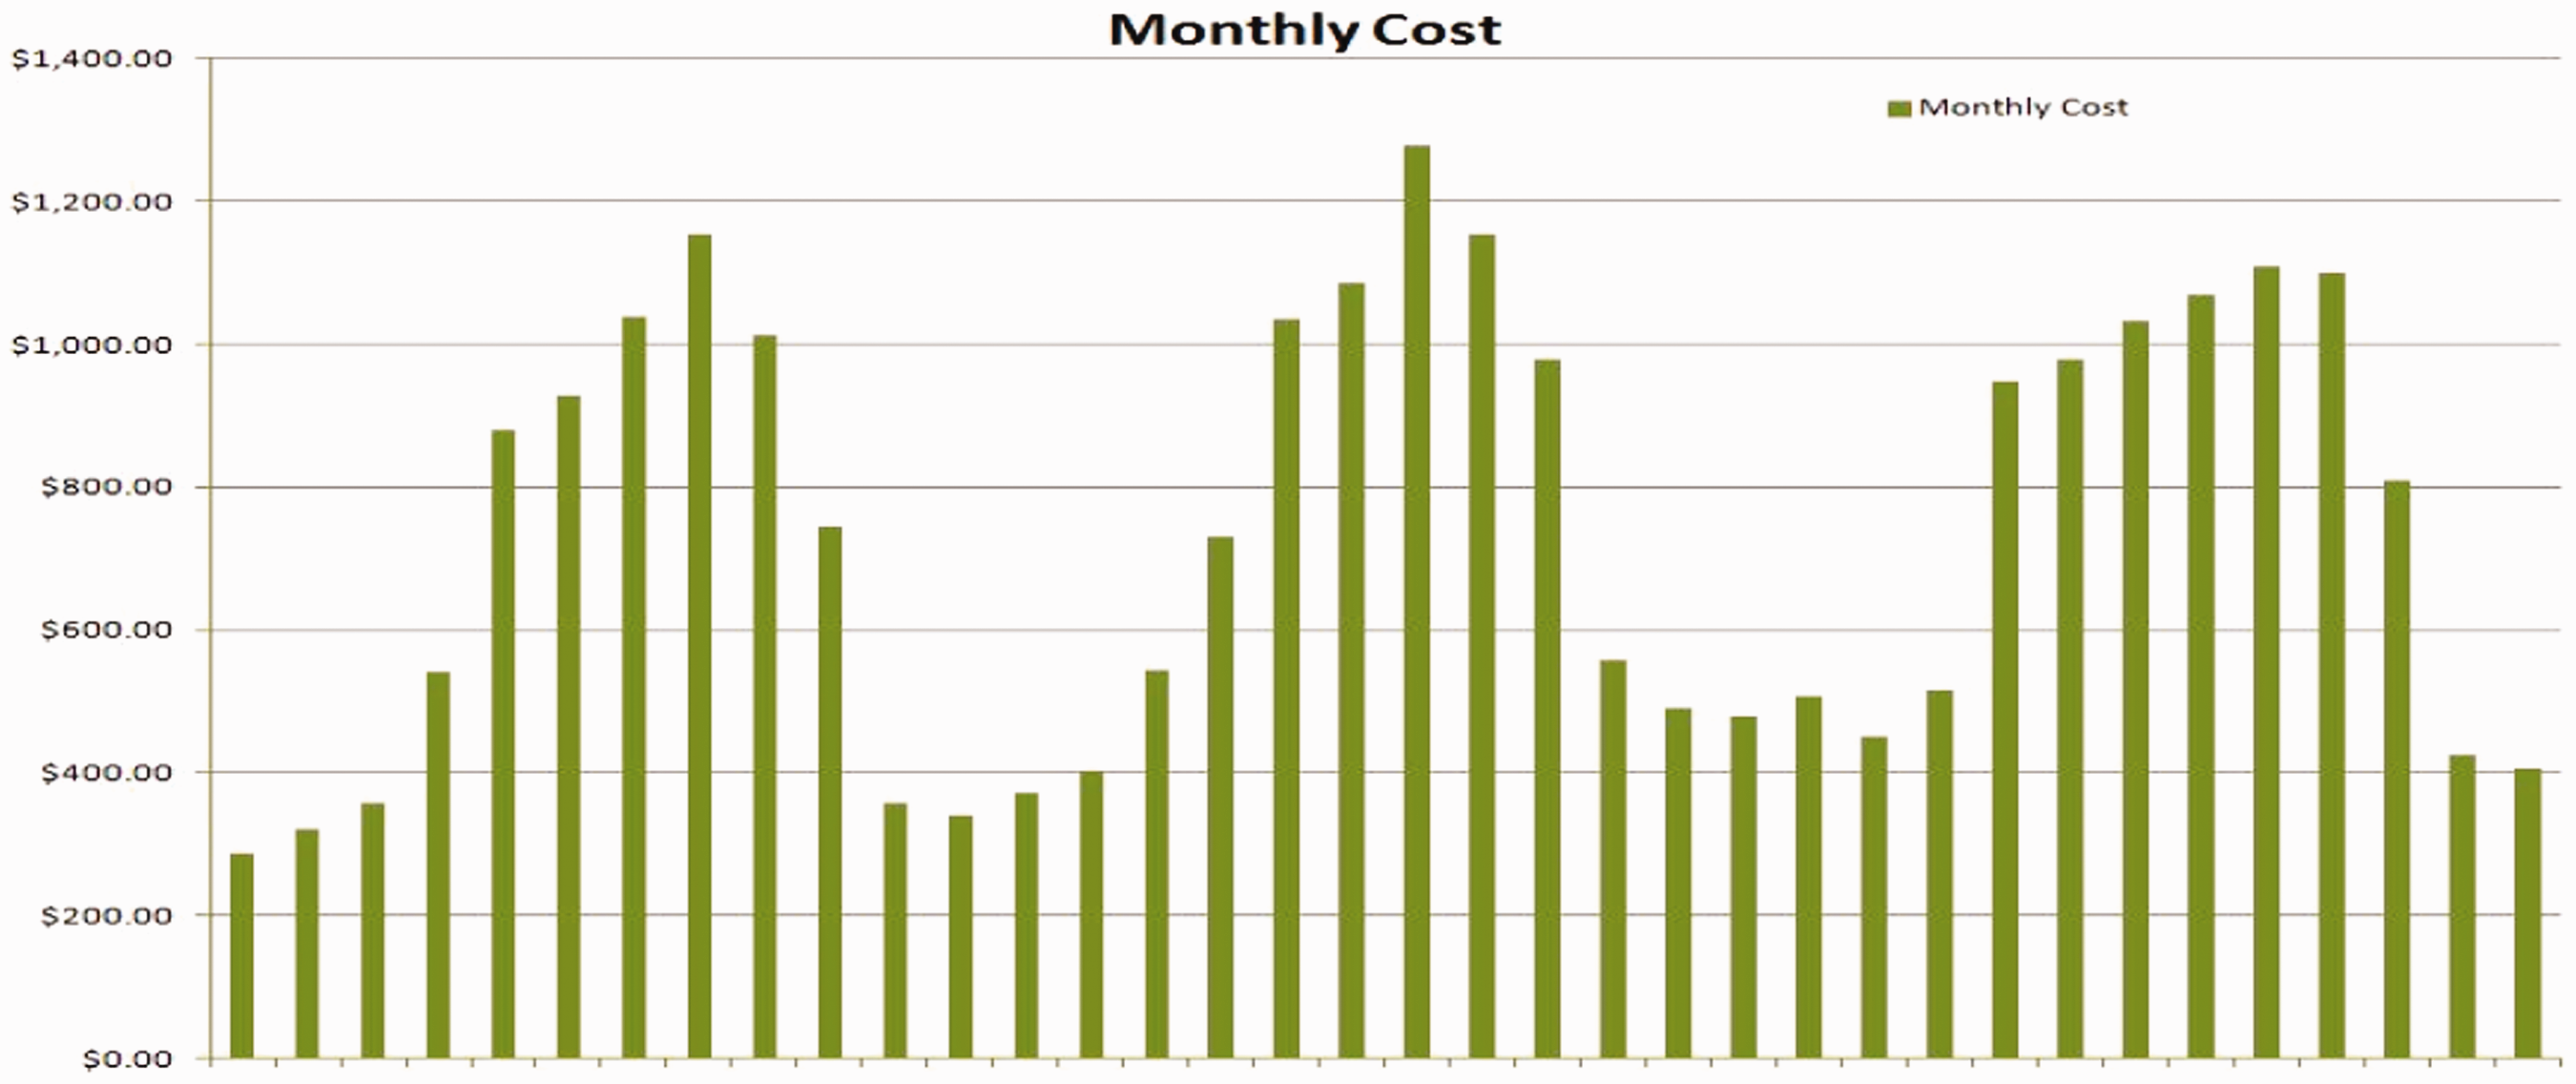
Monthly cost of energy usage which is beyond the capability of the authority.
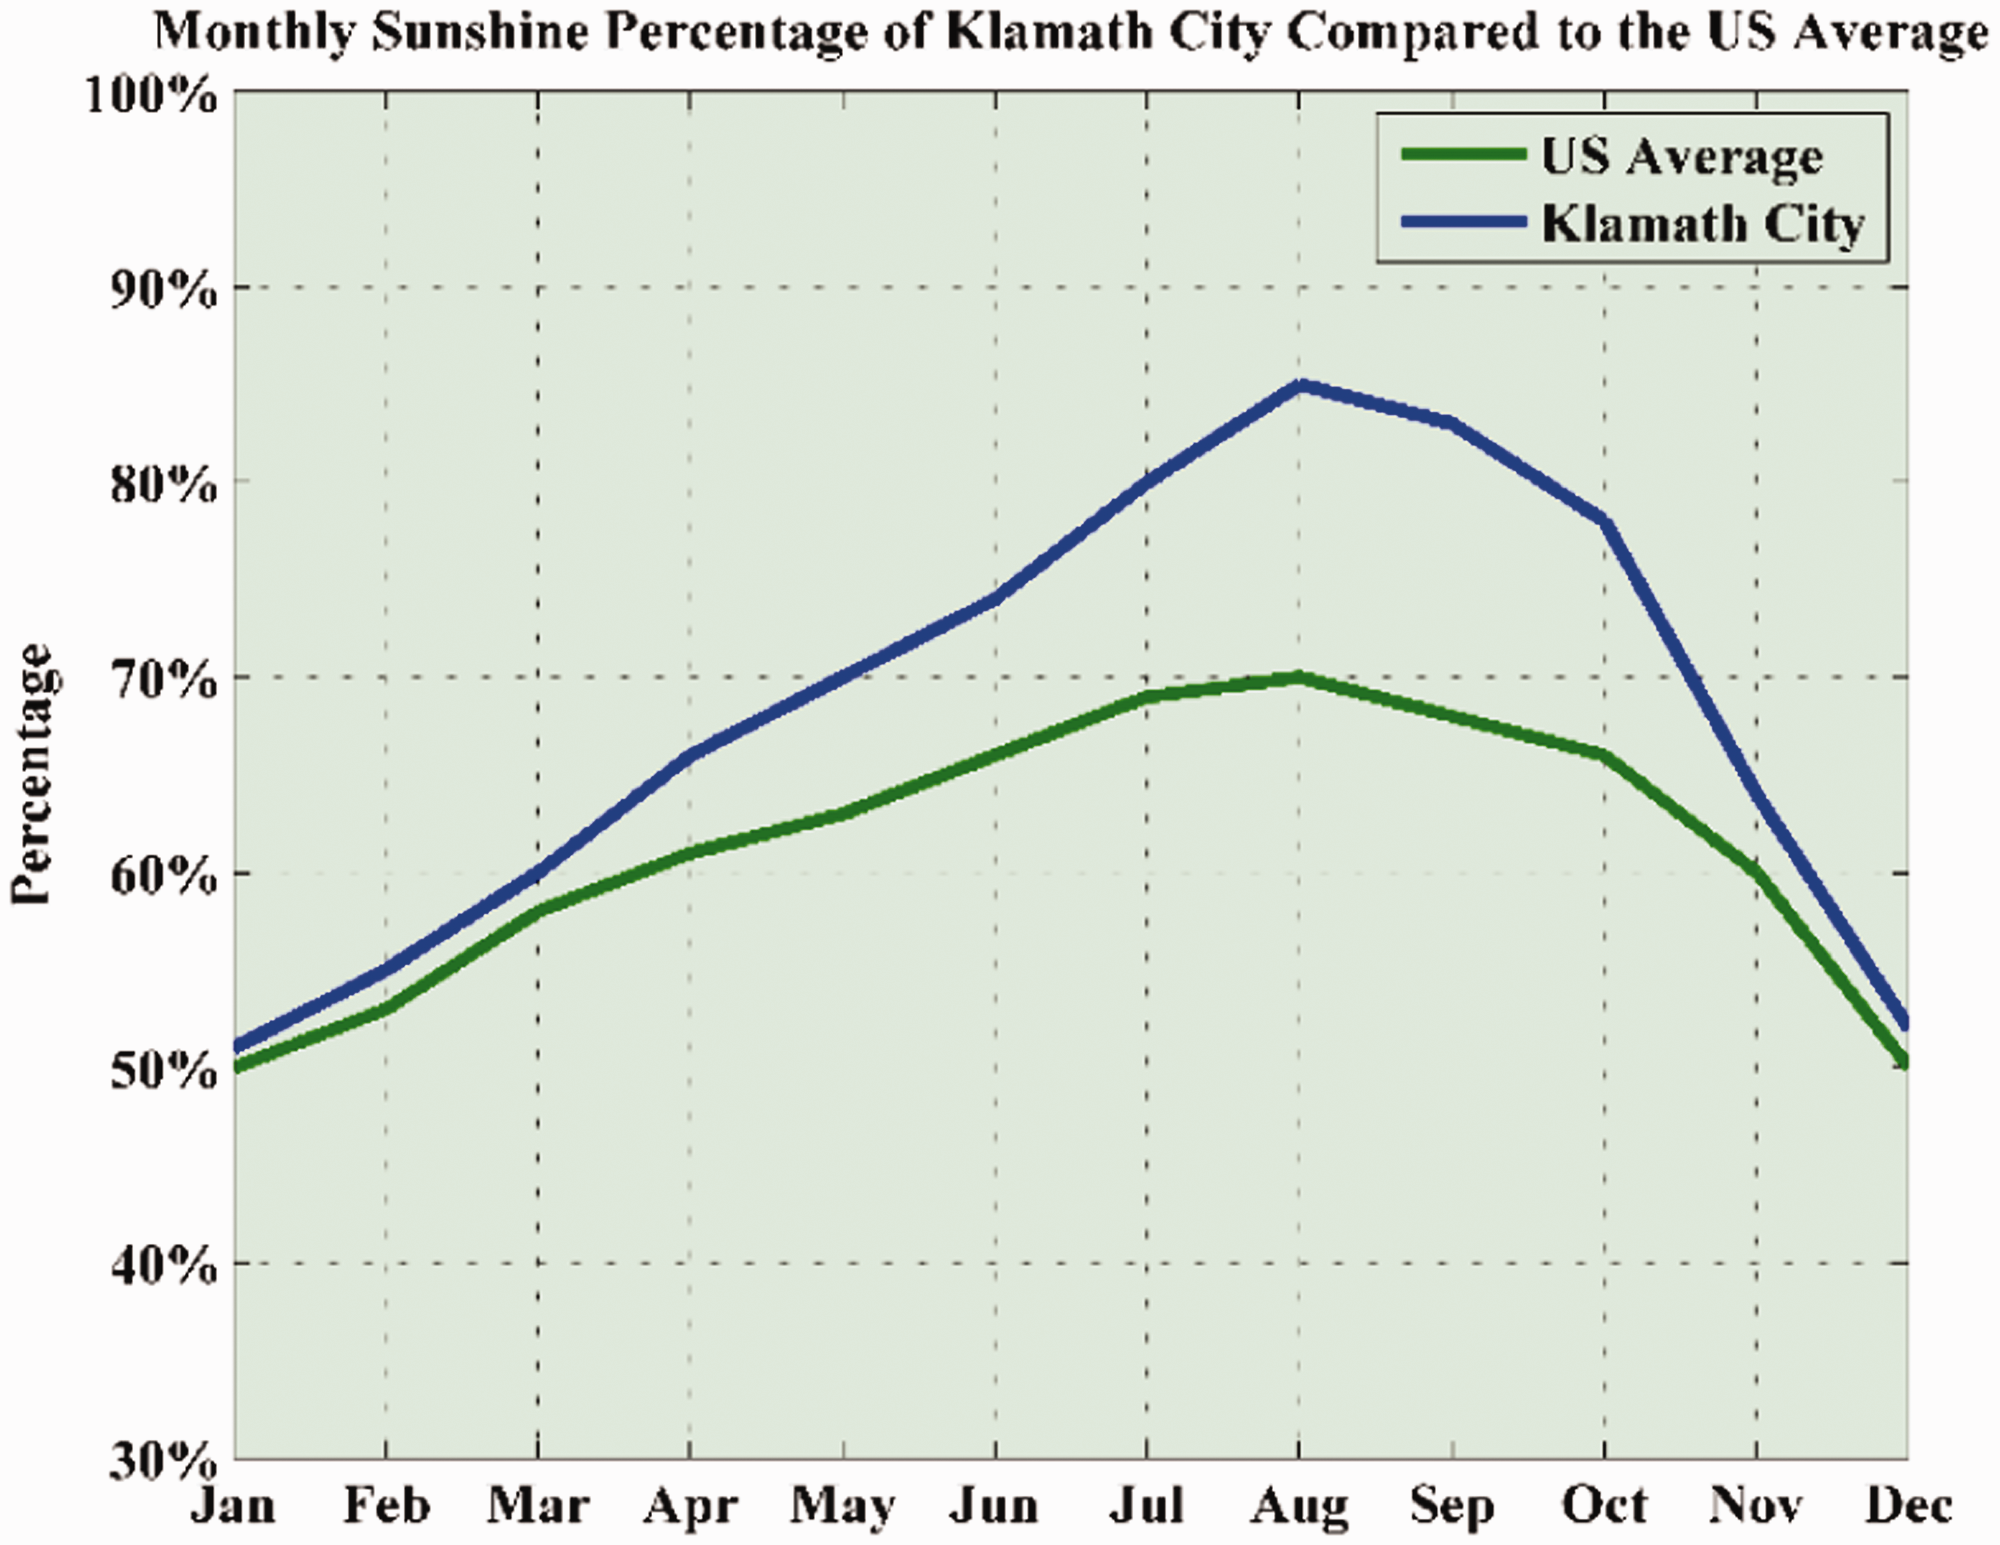
Monthly sunshine percentage of Klamath city compared to the US average.
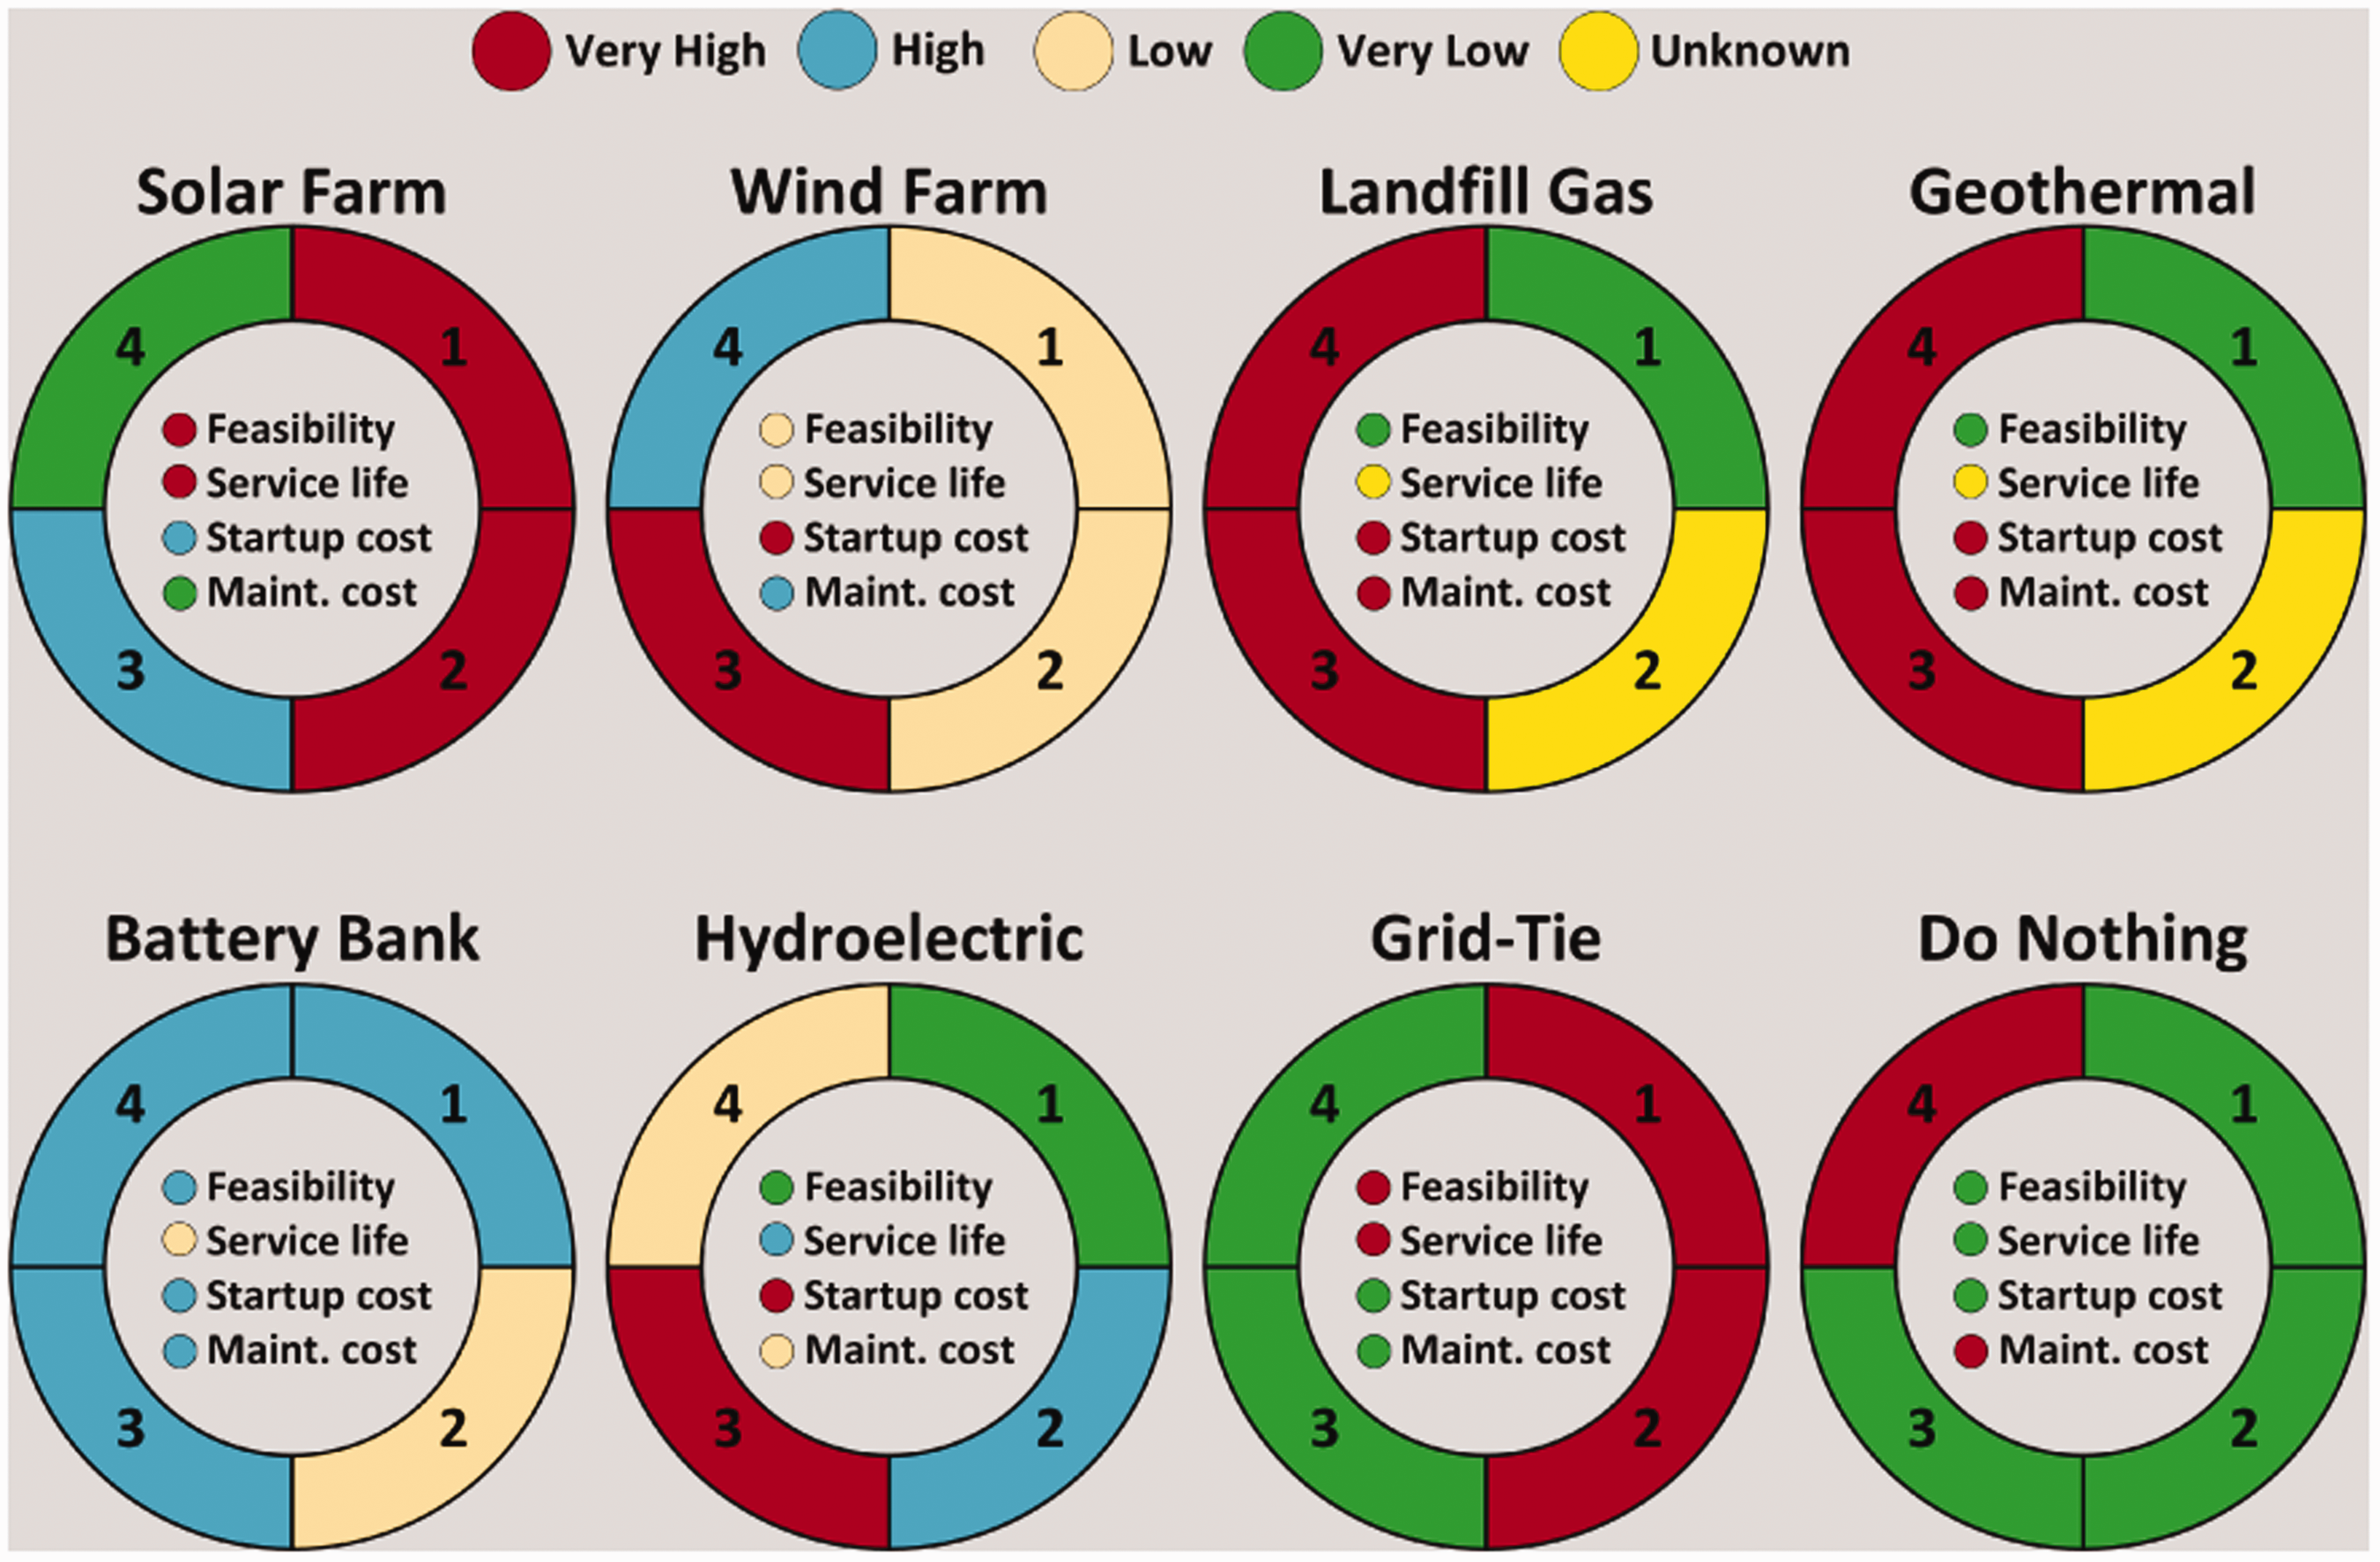
RYGEP system design decision matrix indicating solar and grid-tie with the two most feasible options.
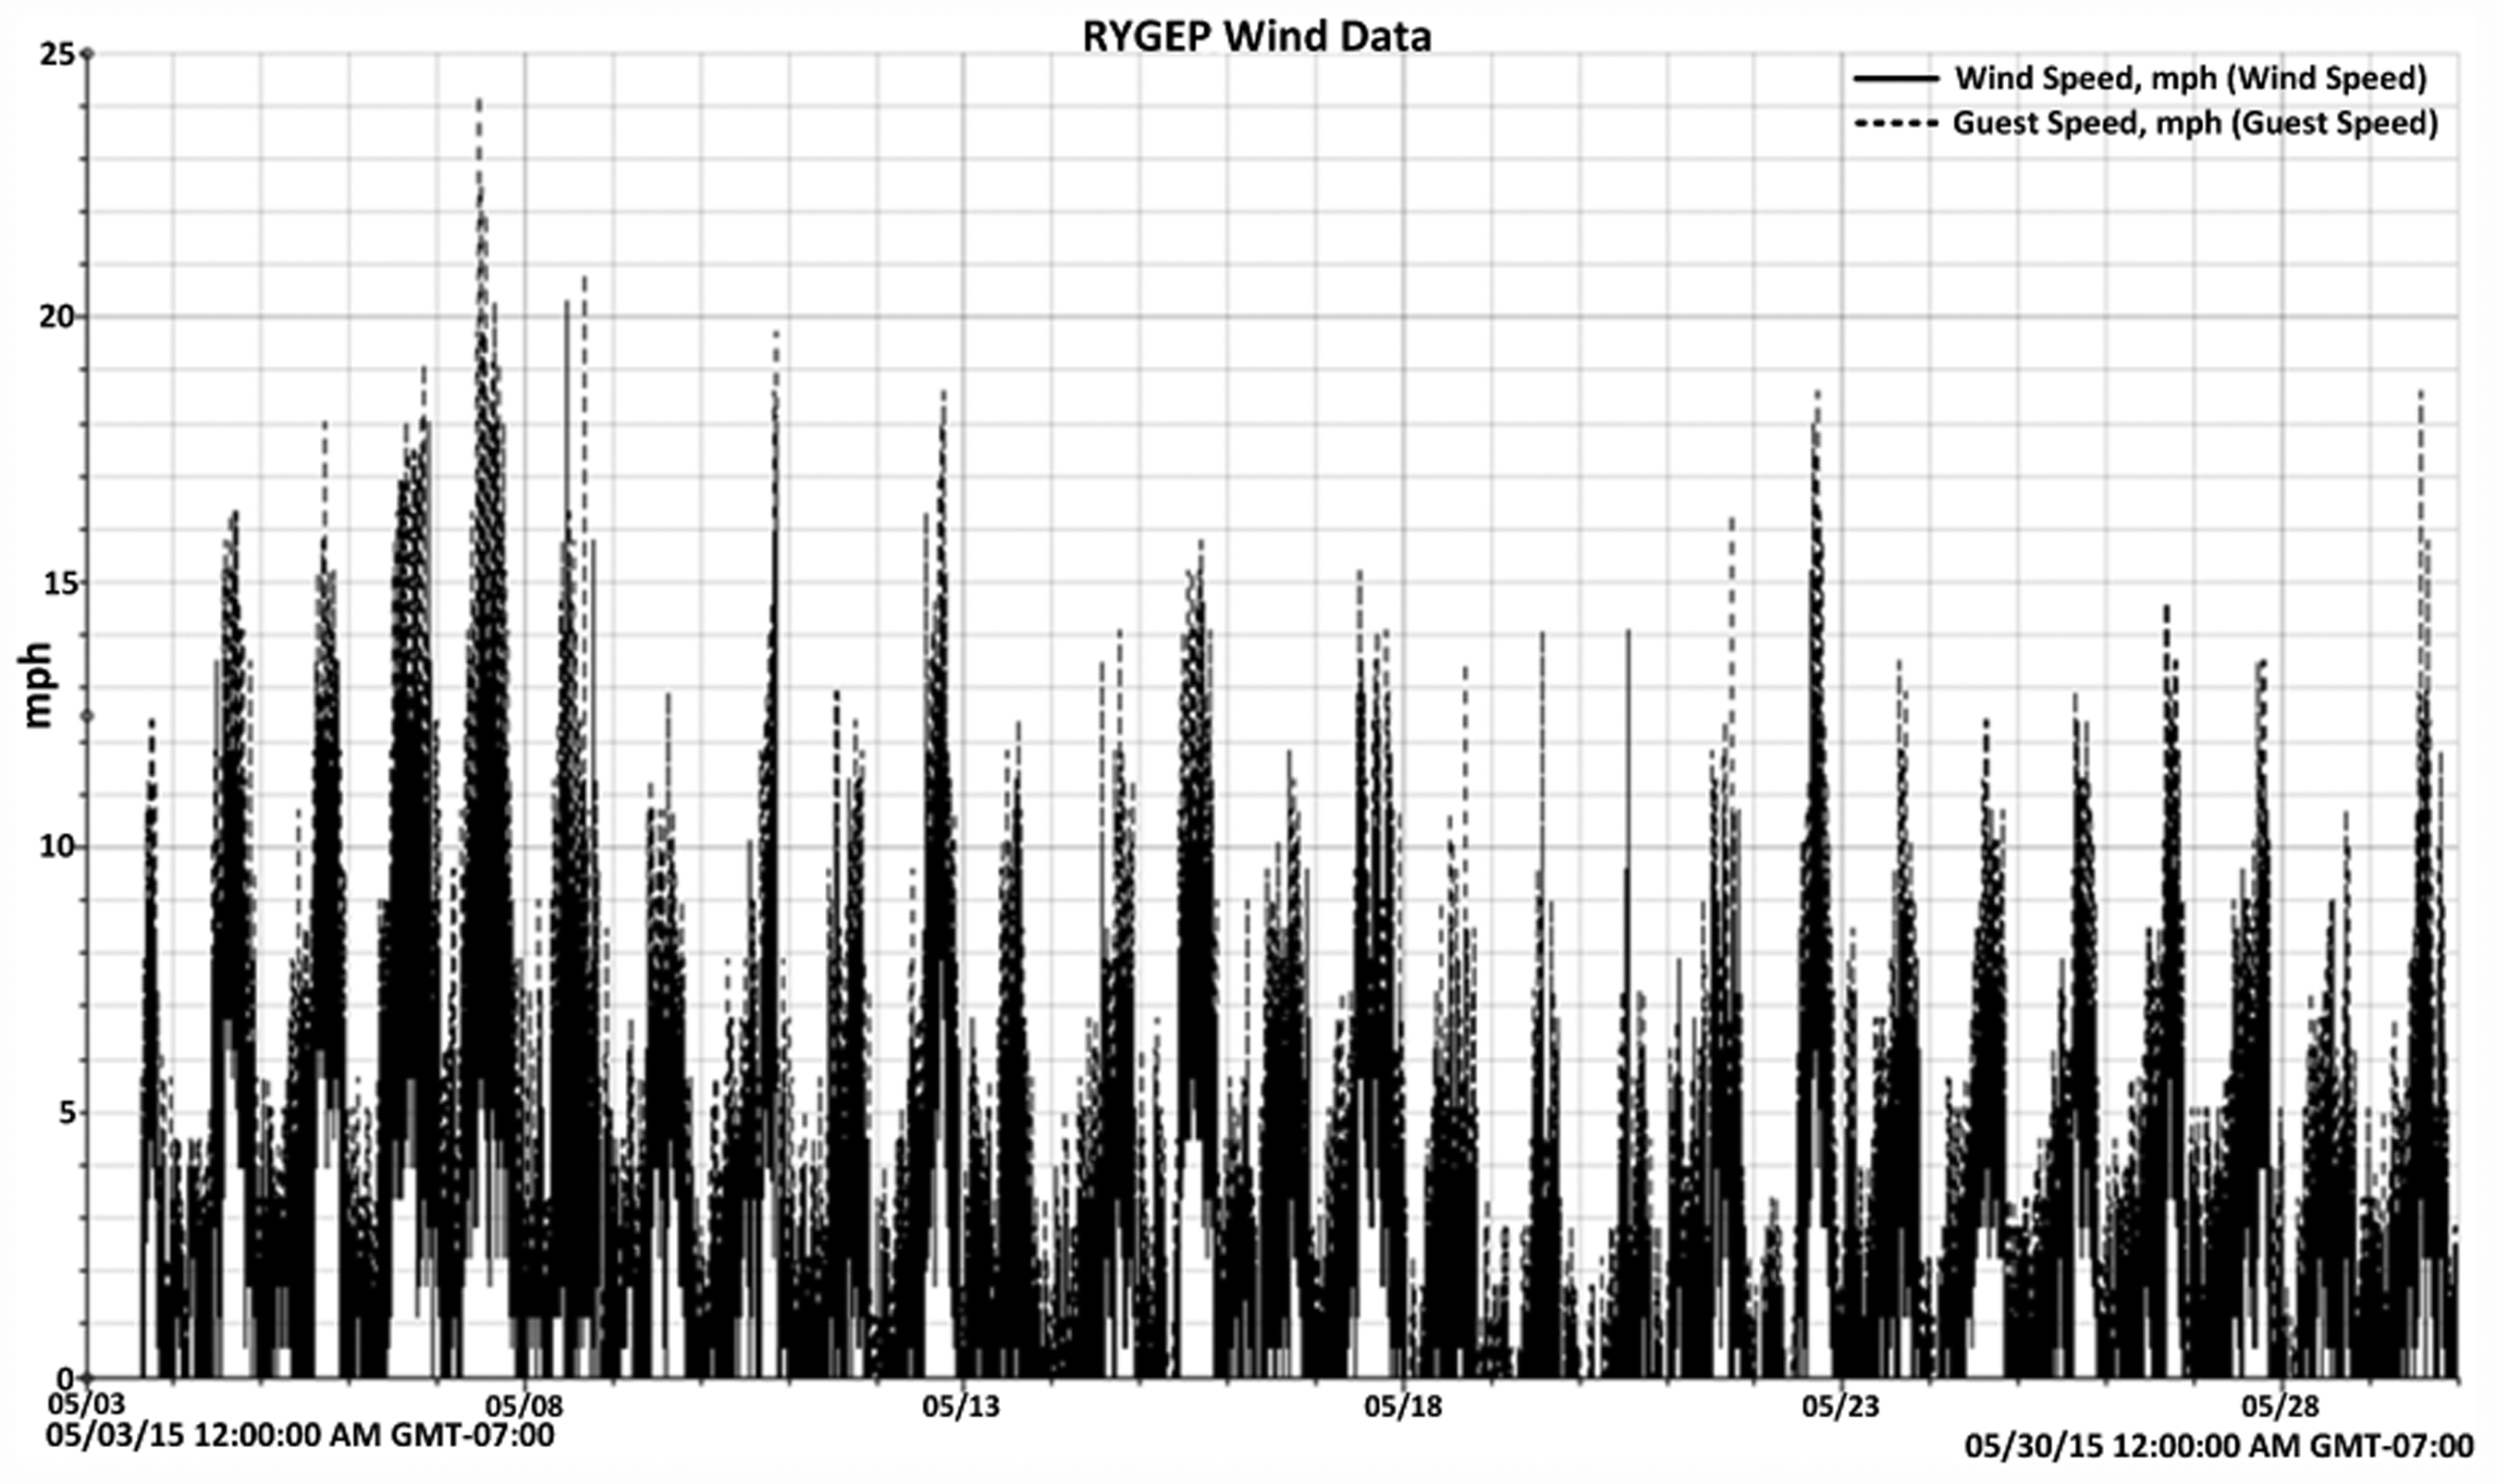
Data received from the availability of wind.
Educational benefit
This paper is aimed towards providing the under graduate and post graduate students of electrical and renewable energy engineering department a clear idea on how to examine the viability of a site for a particular selection of a renewable source. Power system analysis courses in the department specifically deal with the similar topic and teach the students numerous optimization techniques for site selection and cost minimization. Among several options available, one might have difficulty in choosing the most optimum source of energy to meet the demand-load imbalance at a leveled cost. The physical implementation of the system can be too expensive, and therefore a simulation based environment can bring about an easy solution for a feasibility check. The paper provides an opportunity for the students to gather knowledge on how to perform the feasibility analysis based on the functional model. By analyzing the accumulated weather data from the previous days, students will be able to select a probable source for the location based on the simulation. They are further expected to choose the combination with the minimum cost for specific applications. The system modelling presented in the paper will directly help the senior students in implementing the projects related to the site selection and validation of the choice for the completion of their graduation.
It is further seen that the elaborated design of the renewable options will also be applied in an educational program (Rainbow Youth Golf) in Klamath County. With the purpose of offsetting the irrigation cost, the paper represents a complete layout along with the study of extreme cases for the particular educational program. This signifies the direct relation the concept of this paper has with the educational aspects.
Functional model
In order to implement the project, different available energy sources are identified and evaluated for cost, maintenance, feasibility and service life. The location of the property allows for two potential generation sources, solar and wind. Promising of the two is solar because the area that the system is to be implemented has no trees in the immediate vicinity, allowing for potentially no shading of the panels. Klamath area has a large percentage of sunny days, and solar is chosen to be the primary mode of generation. Figure 3 shows the monthly sunshine percentage of Klamath City compared to the US average, making solar a promising source for the zone.
After analyzing different energy sources through the decision matrix demonstrated in Figure 4, solar and grid-tie were determined to be the two most feasible options. Even though sites authority wanted an off grid system to avoid the hassle of the generation company, the grid-tied system would bring their own benefits which are extremely crucial. Being grid-tied allows electricity to always be available even if there are long periods of bad weather. Despite the metering hassle, it may actually prove to be beneficial to the system. If the working site is able to reach an agreement with the utilities, it can be something that adds to the property’s value. Another benefit of the grid-tied system is that it greatly reduces the equipment cost. There are several separate meters, one for each agency lake pump and the irrigation pumps, and another for each of the properties in the location near the site. The concerned power generation company’s regulation would require a new meter to be installed, as the net meter and all existing meters run through it. Off grid system has a lot of benefits on their own as well. One of them would be that, there is no regulation associated with the generation company. After installation costs, all power generated by that farm is free for the system and would add to an already positive public image more so than a grid-tied system. Relying solely on its own system can be both a benefit and a problem at the same time. However, there are some pretty significant drawbacks to such a system, mainly the increased cost. An off grid system requires more expensive equipment like transformers, larger inverters, cable, and conduit. It would also require a sizeable battery backup system due to the varying weather condition and intermittent nature of the renewable energy system. For the agency lake pump alone, it would take 12 deep cycle 80 Ah batteries just to run it for a day without any backup. So clearly it would require a grid tied system to ensure more reliability and stability to the system.
A mobile system for the pumps would sound as a better prospect. It also allows for places where water is not easily accessed to have a way to pump the water closer without having electricity. A mobile system could be useful for the RYGEP because they could move the pump at the lake to locations along the lake where it is easier to pump from. The drawbacks to a mobile system may lie in the fact that it would be too heavy to be easily maneuvered to different locations. It would have to rest on a trailer that could be towed by a vehicle. A system like this must have additional equipment such as the pump, batteries, inverters, transformers, and solar panels to charge the batteries. It would also take a lot of time to design a feasible system that rested on a trailer and even then it would be extraordinarily expensive. The non-mobile system is more conventional and is really more practical for the site as well. Non-mobile systems are cheaper and easier to develop. The only real downside is that if a battery backup system was to ever be implemented, more on-site construction would be required to build an energy storage building. If this system was to be off the grid, there had to be energy storage in order to compensate for days where the weather is less than ideal and supply any shortage of power.
The two methods of energy storage that stand out are battery storage and hydro storage. When sizing for storage of energy from a solar farm, it is typical to plan for periods ranging from three to five days without any usable sunlight. In the case of our investigation site, it will only run their pumps during mid-spring to mid-fall. In this range of time, there will not be many periods where the sun is not strong. Since the pumps make up most of the load usage by the RYGEP, it would be unreasonable to size a storage system for winter considering these factors.
To address the concern of energy storage, and to offset the wide variability of the power available in a customer-generated system, batteries are considered to store enough power to run the pumps and homes at the RYGEP. Since the power consumption of the pumps is very high, a separate building would need to be constructed to house all the necessary batteries. The batteries would need to be large enough to store and provide enough power for several days of low generation due to unfavorable conditions such as windless or cloudy days. After proper elevation of the property and the costs of the construction of a pond at the highest point of the property, it was determined that this method not only had low feasibility with high environmental impact, maintenance and startup cost but also incapable of providing a significant amount of stored energy due to a very poor conversion of energy. 1
Solar systems also have a very long service life with low maintenance costs due to the limited number of moving parts included in the most common systems. As part of the design process, several sources of power generation were reviewed, including wind power. The site in question is located on the shore of a lake which was thought to have some potential for cold/warm fronts that could be harnessed by wind turbines as an additional form of power generation. A HOBO unit was installed on the property in the month of May for wind Data collection.
Figure 5 shows the data received from the availability of wind in the Rainbow Youth Golf Education Project. An average wind speed of 2.6 mph translates to 1.3 m/s. This speed is too low for most turbines to generate power, proving the wind to be an infeasible source for power for the RYGEP.
In addition to the HOBO modeling, a wind energy analysis was completed in RET Screen Clean Energy Analysis software. Wind data were used from the Klamath Falls International airport acquired from NREL. The results from the modeling verified an average wind speed of 2.5 to 3.5 mph. The higher wind values are associated with occasional peak wind speeds in the area. Figure 6 shows the outcomes of this modeling. All of them clearly indicate that solar energy would be a perfect fit for the proposed site.
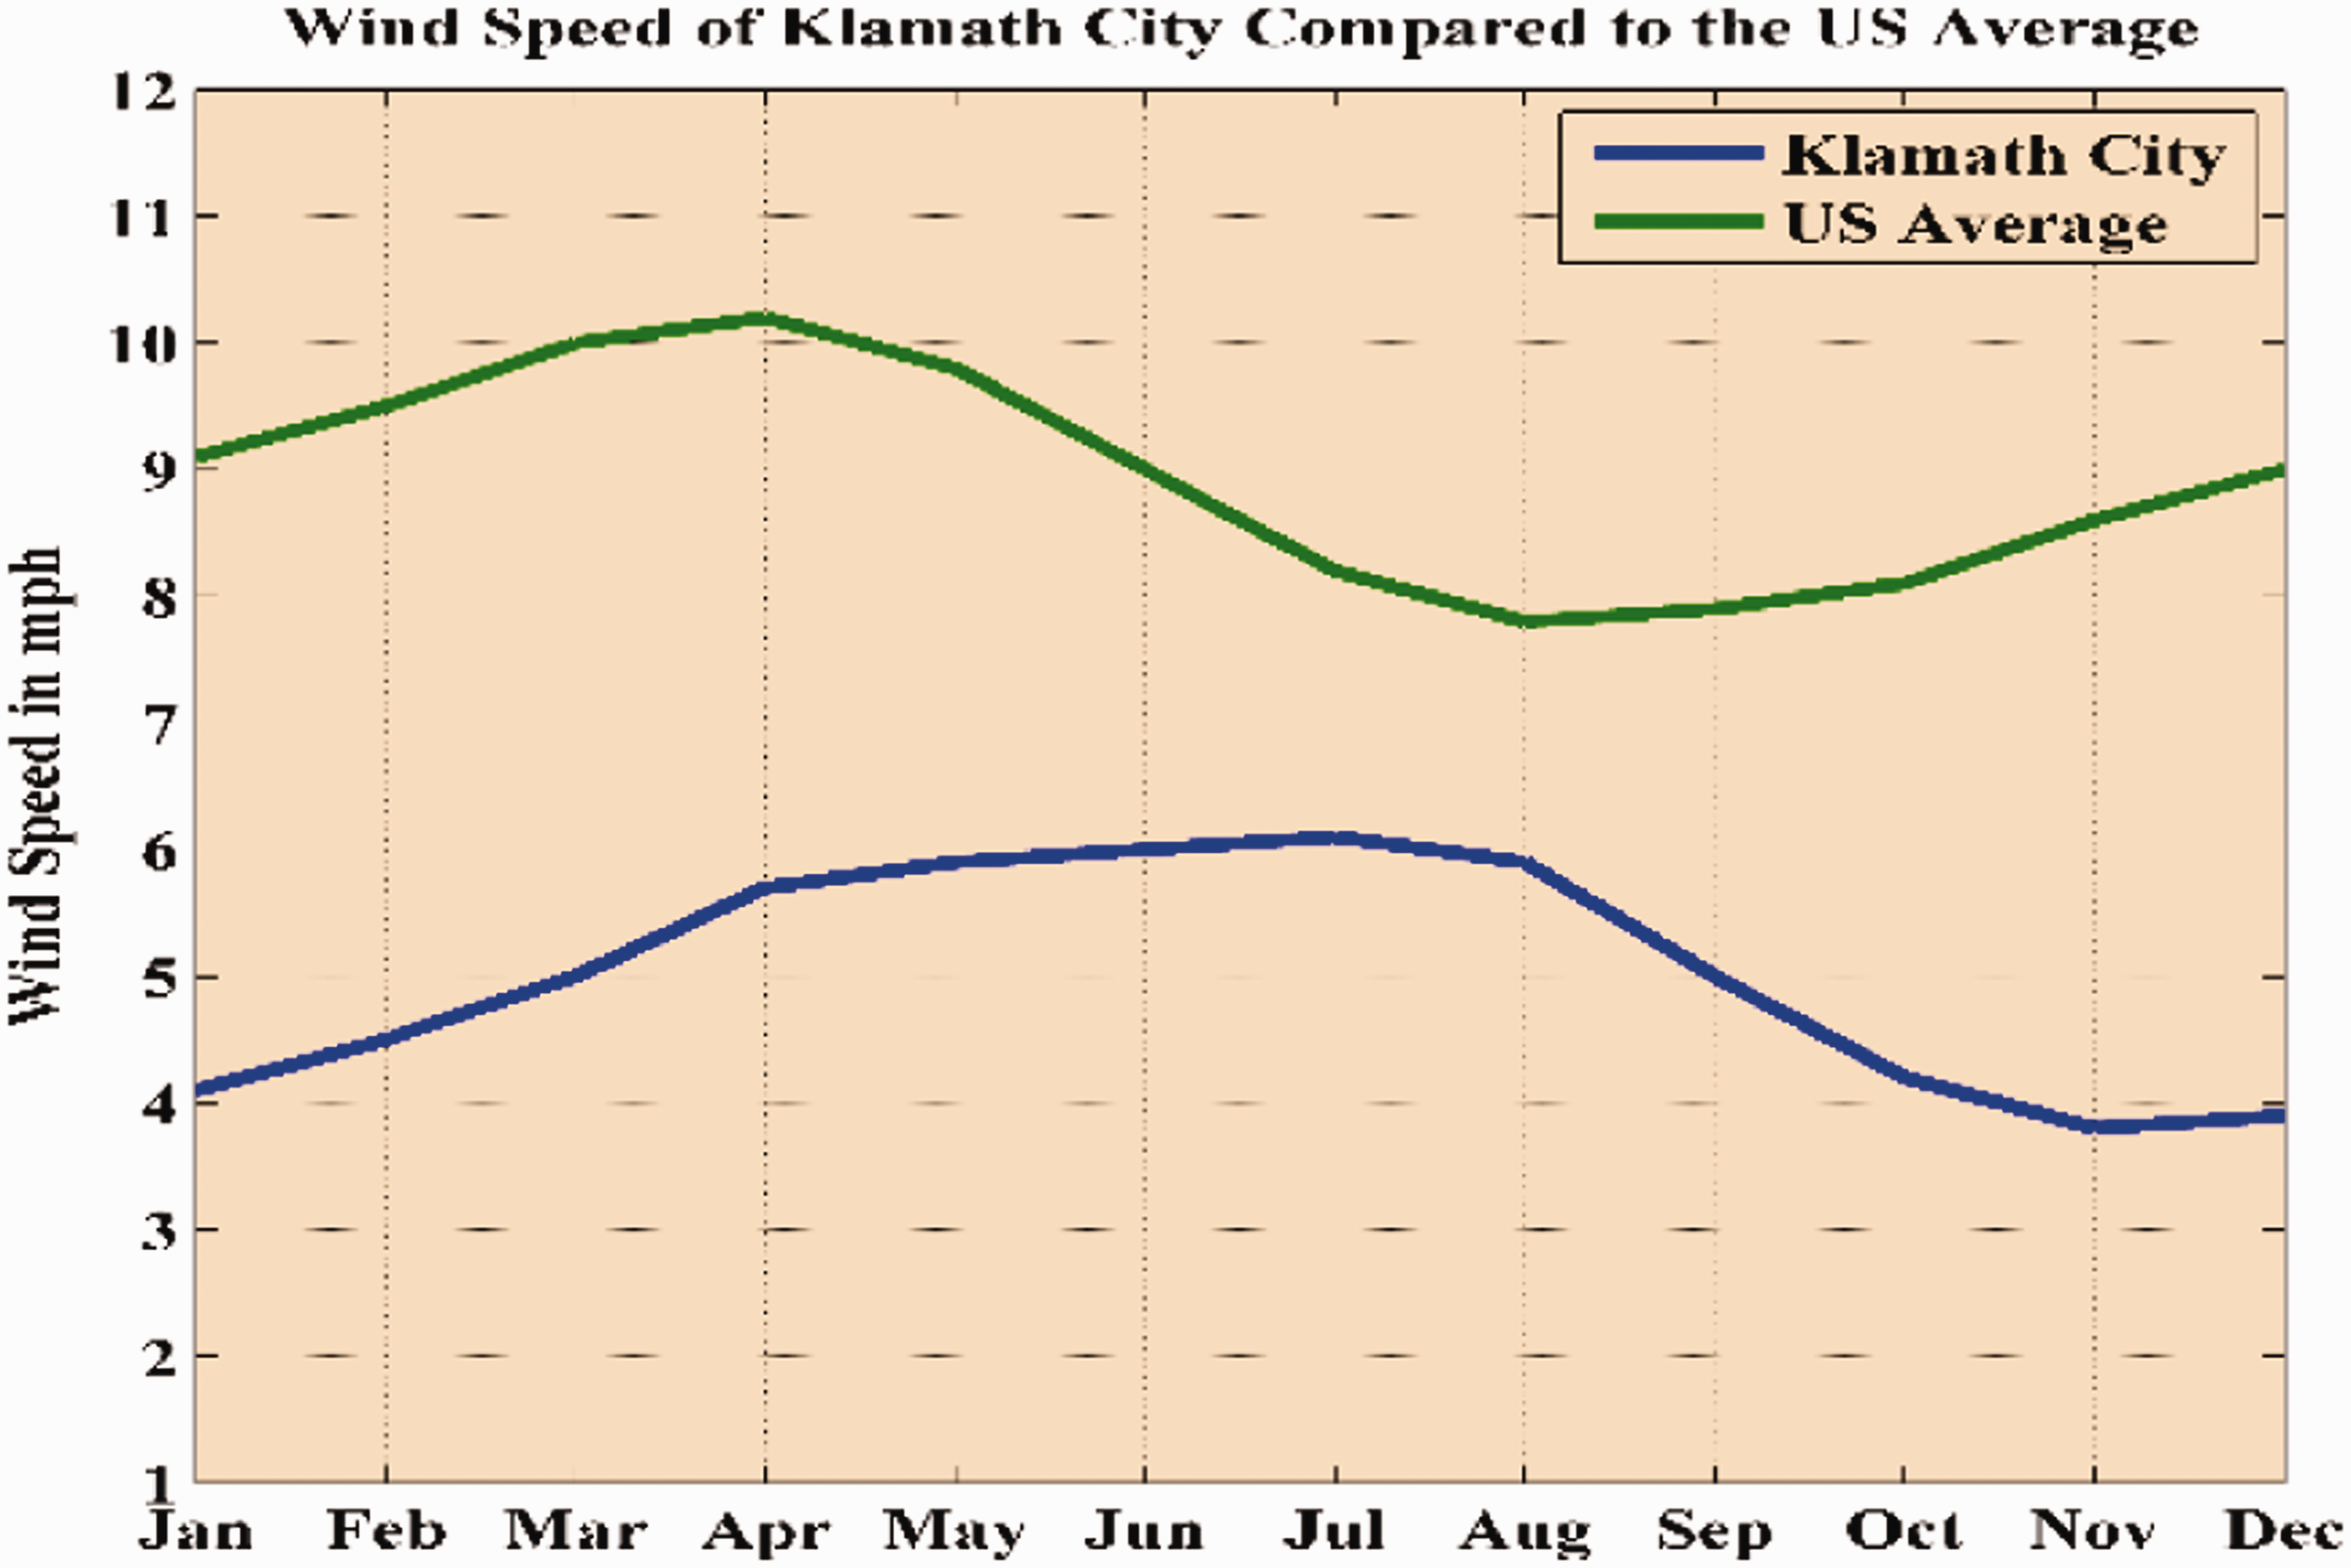
Wind energy data showing a minimum amount of wind speed required to generate the power.
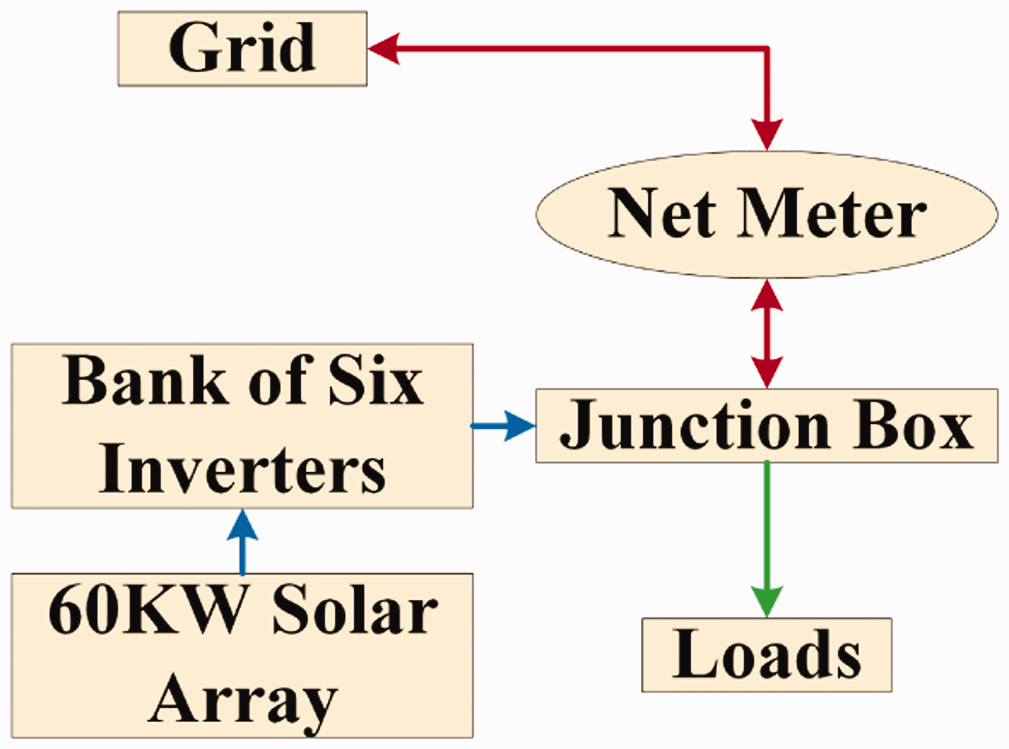
Main system tie-in to grid.
Feasibility analysis
In this section, the currently proposed energy solution for the RYGEP system has been proposed. It is a grid tied, non-mobile 60 kW system with a DC output of 480 V. Because the system itself is 480 V DC, it can be inverted directly to a 480 V AC signal which could tie into the grid directly after some phase synchronization. This eliminates the need for a transformer at the tie-in point which helps keep the costs down. The panels will be mounted at an angle of 30° in order to maximize irradiation during the summer, which is when the pumps will need to be running the most. Our analysis indicated that no energy storage system needs to be implemented for now at least. The reason for this is that if a net metering agreement is reached, no energy storage would be needed because it is a system meant solely to offset the irrigation costs. The diagram in Figure 7 shows how the main system tie-in to the grid connection and loads, with the power, flows shown in red. The junction box serves as the main two-way distribution point between generation, supply, and loads. It also acts as a natural control system by automatically distributing power from or to the grid based on the load demand. A net meter would be installed between the junction box and the grid. This is a special device owned by the power company which measures power flows in both directions separately. The net meter can also be used in conjunction with aggregate meters downstream. In this way, consumption billed at different rates can be accounted for which is economical when a residence shares a line with a device such as a commercially rated pump, as is the case at the RYGEP.
The tracker tracks the maximum power point within the 60 kW block, which keeps the solar array operating at the optimal point of the I-V curve. The inverter bank serves to convert and synchronize the DC output of the solar array to 3-phase AC compatible with the grid and ensures that quality in terms of amplitude and distortion is within grid operator’s minimum specifications. It can be seen how the loads will vary simply because the pumps will not always be running. It is predicted that while the pumps are not running, power will flow into the grid from the junction box, but when the pumps run power, it will be drawn from the grid to meet the demands of the load. This design is a 60 kW solar farm that is grid-tied at the same time. The power generated should be sufficient to cover the amount required by the site. While the initial goal was to design a 60 kW system to offset the power requirements, the actual capacity would be 74 kW when fully constructed. The panels will be mounted at a tilt angle of 30° and facing due south. This is to optimize the system for the summer months, as that is when the heaviest usage occurs for the RYGEP. The racks have been spaced so that the solar panels do not shade one another during any time of the year. This is especially important because sharing a panel can cause current limiting in the rest of the strand, drastically reducing power output. Because of this, the total footprint of the solar farm is less than a ¼ acre. The inverters will sit in boxes behind the racks to help keep them cool during the summer months, improving efficiency during the winter months. The simulation software used in the testing phase are Easy Power, Revit, EES and Solar Edge Designer. Naturally, each program represents a different level of the system.
Test results and validations
In Figure 8, six photovoltaic panels named PVC-1_A to PVC-1_E and PVC-1 are interconnected with the utility UTIL-1 by a common bus BUS-1, which allows bidirectional power flow from three houses. The bus is again connected with the agency lake pump. For three simulation cases, the Agency Lake pump is the first case, which will be replaced by irrigation pump for the second case. The motivation of the simulation is to test the usage and excess in generation of the system so that it can meet the pertaining demand and can have an excess of energy to deliver it to the utility in nominal situation. According to the setup, the simulations are defined into three general cases: first keeping only the Agency Lake pump on, then only the irrigation pumps are kept on, and then no pumps are on. The case where no pumps were running is considered the normal operating case. To make this case successful, the system must feed power back to the utility during normal operation.
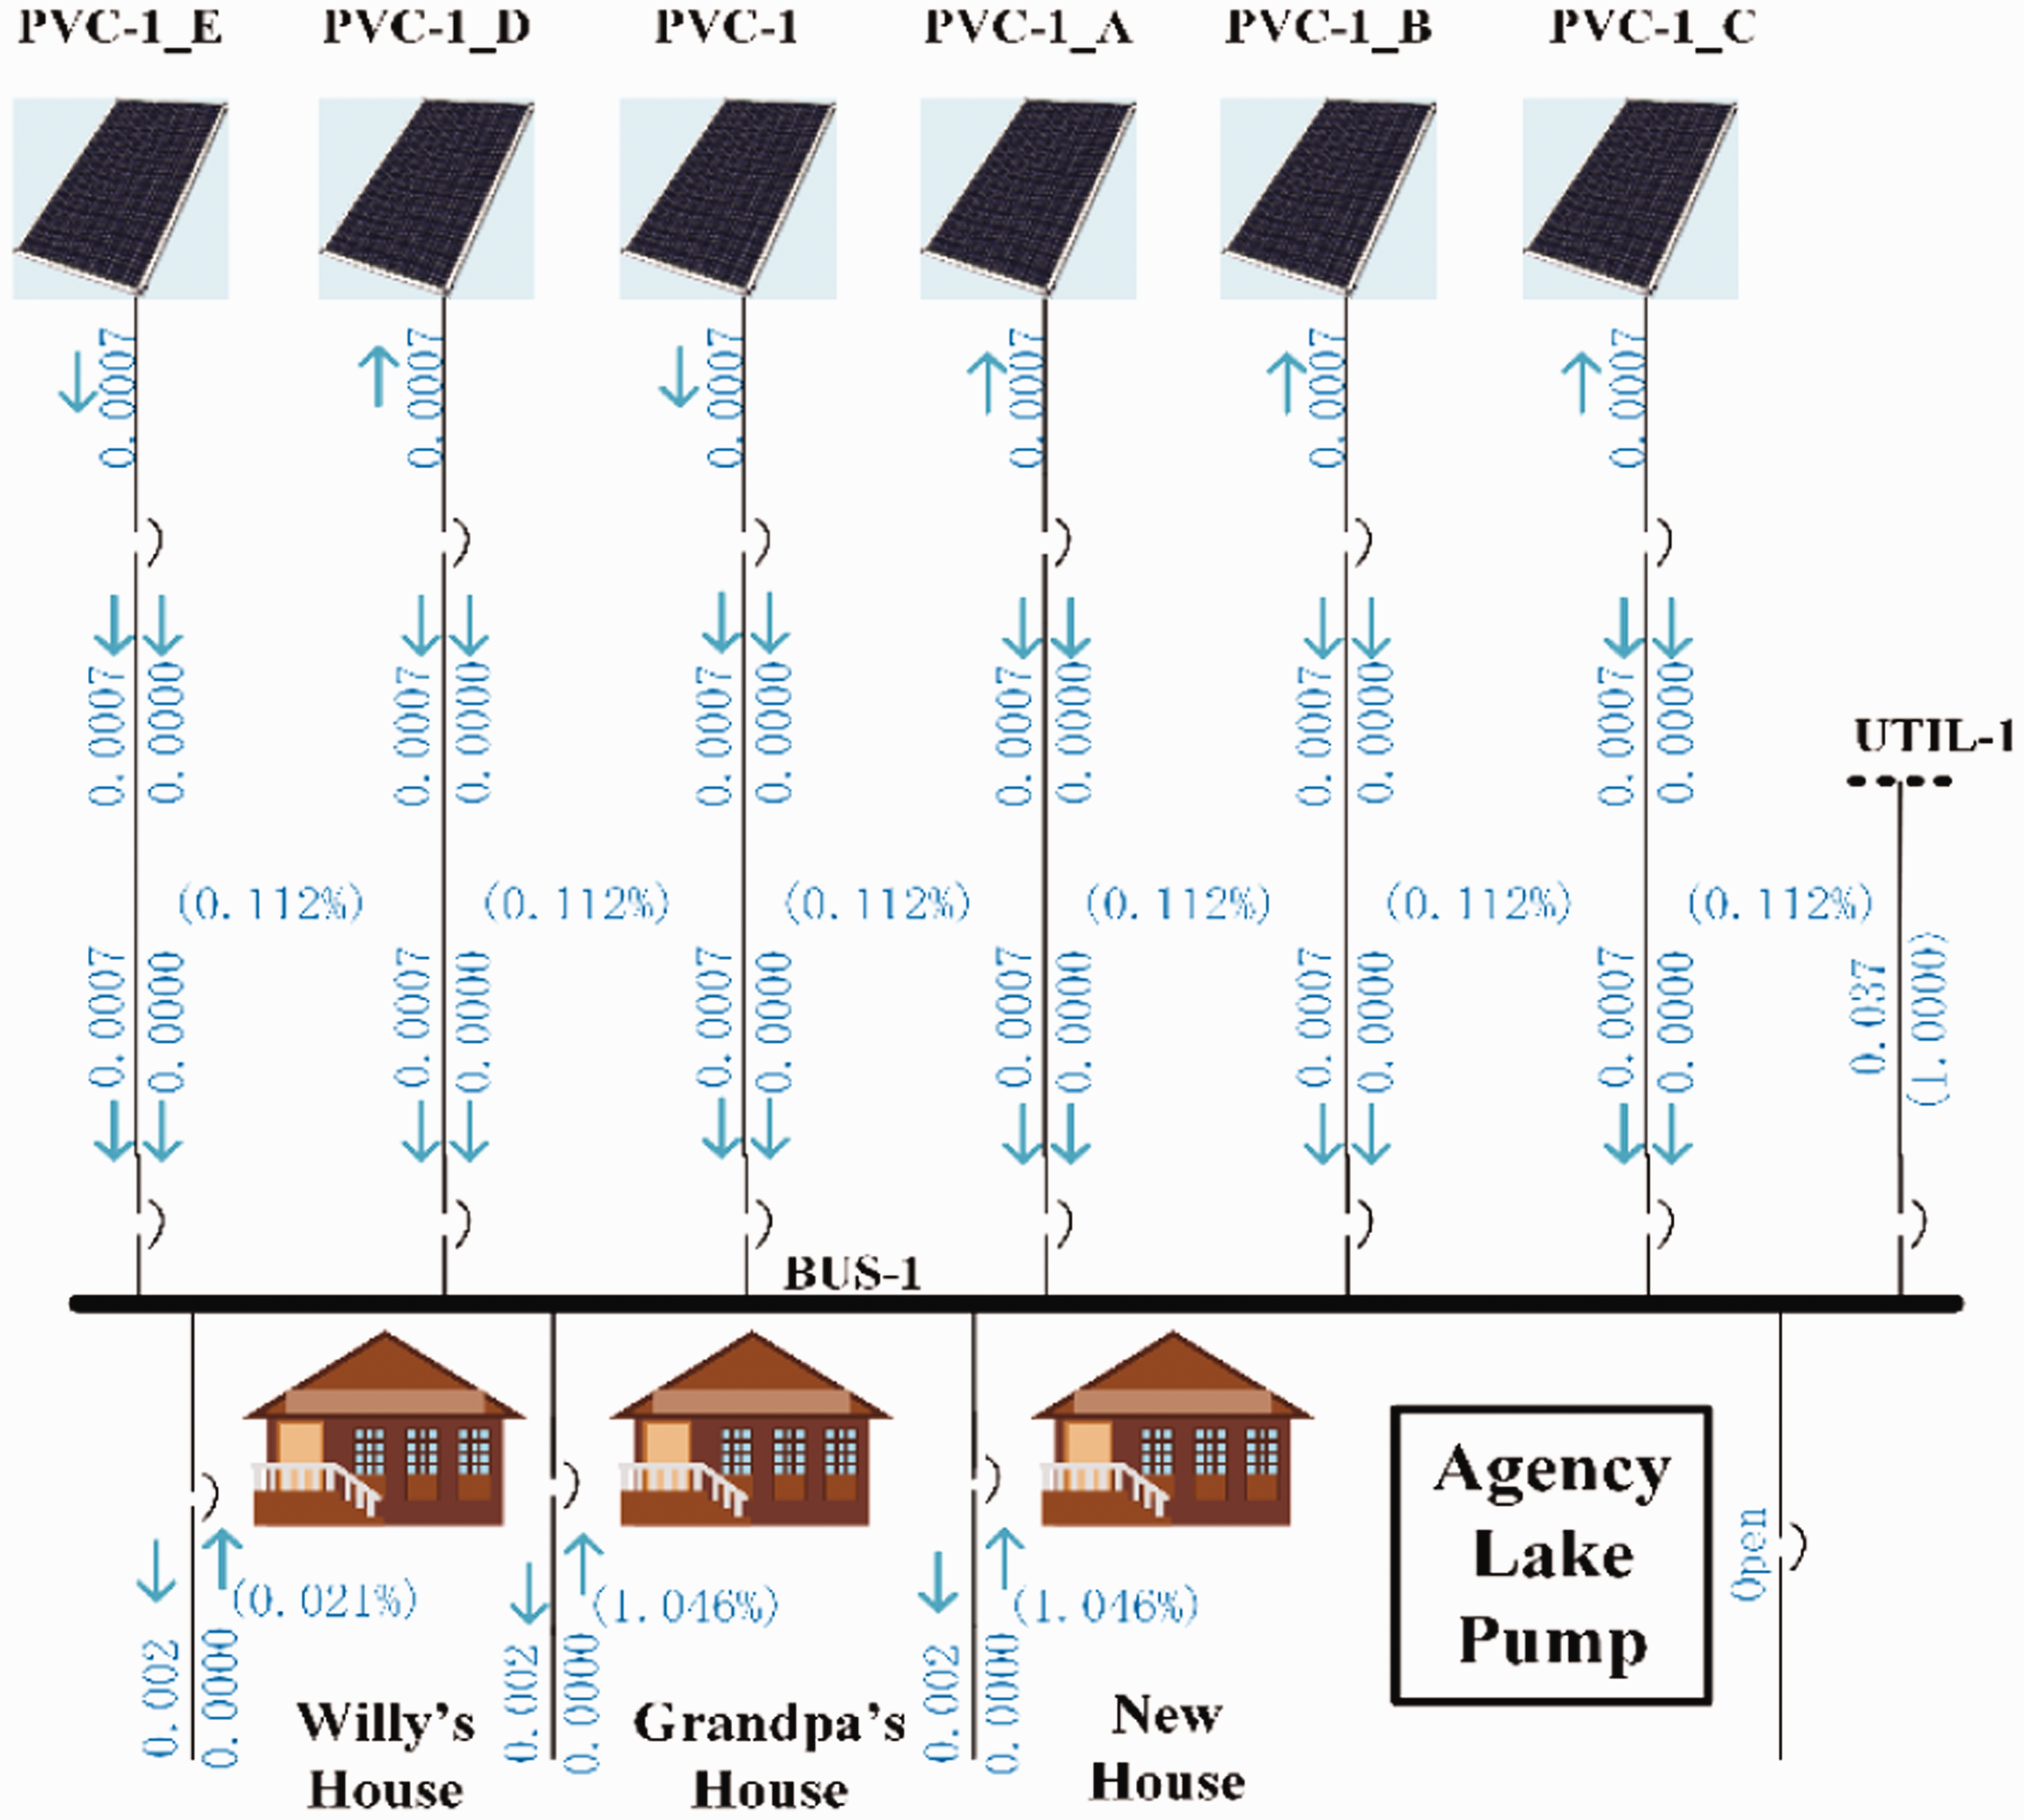
Simulation setup and result for the connection with Agency Lake pump.
On the other hand, power is consumed from the utility for the other two cases, i.e. when either of the pumps is utilized. This is expected as each pump draws a lot of power. The cases presented in those figures are also the rarest, as the pumps are expected to run at night when a solar generation will be zero. As the cases do not usually occur for the particular site, the generation of the system can be considered to be good enough for the verification of the experiment. The results of the analysis of the Solar Edge software are shown in Figure 9. It shows that the proposed system is estimated to generate close to 113.5 MW of energy a year, given weather conditions are good. The figure also shows that there is a significantly small amount of clipping MWh only at the end of May (0.42%).
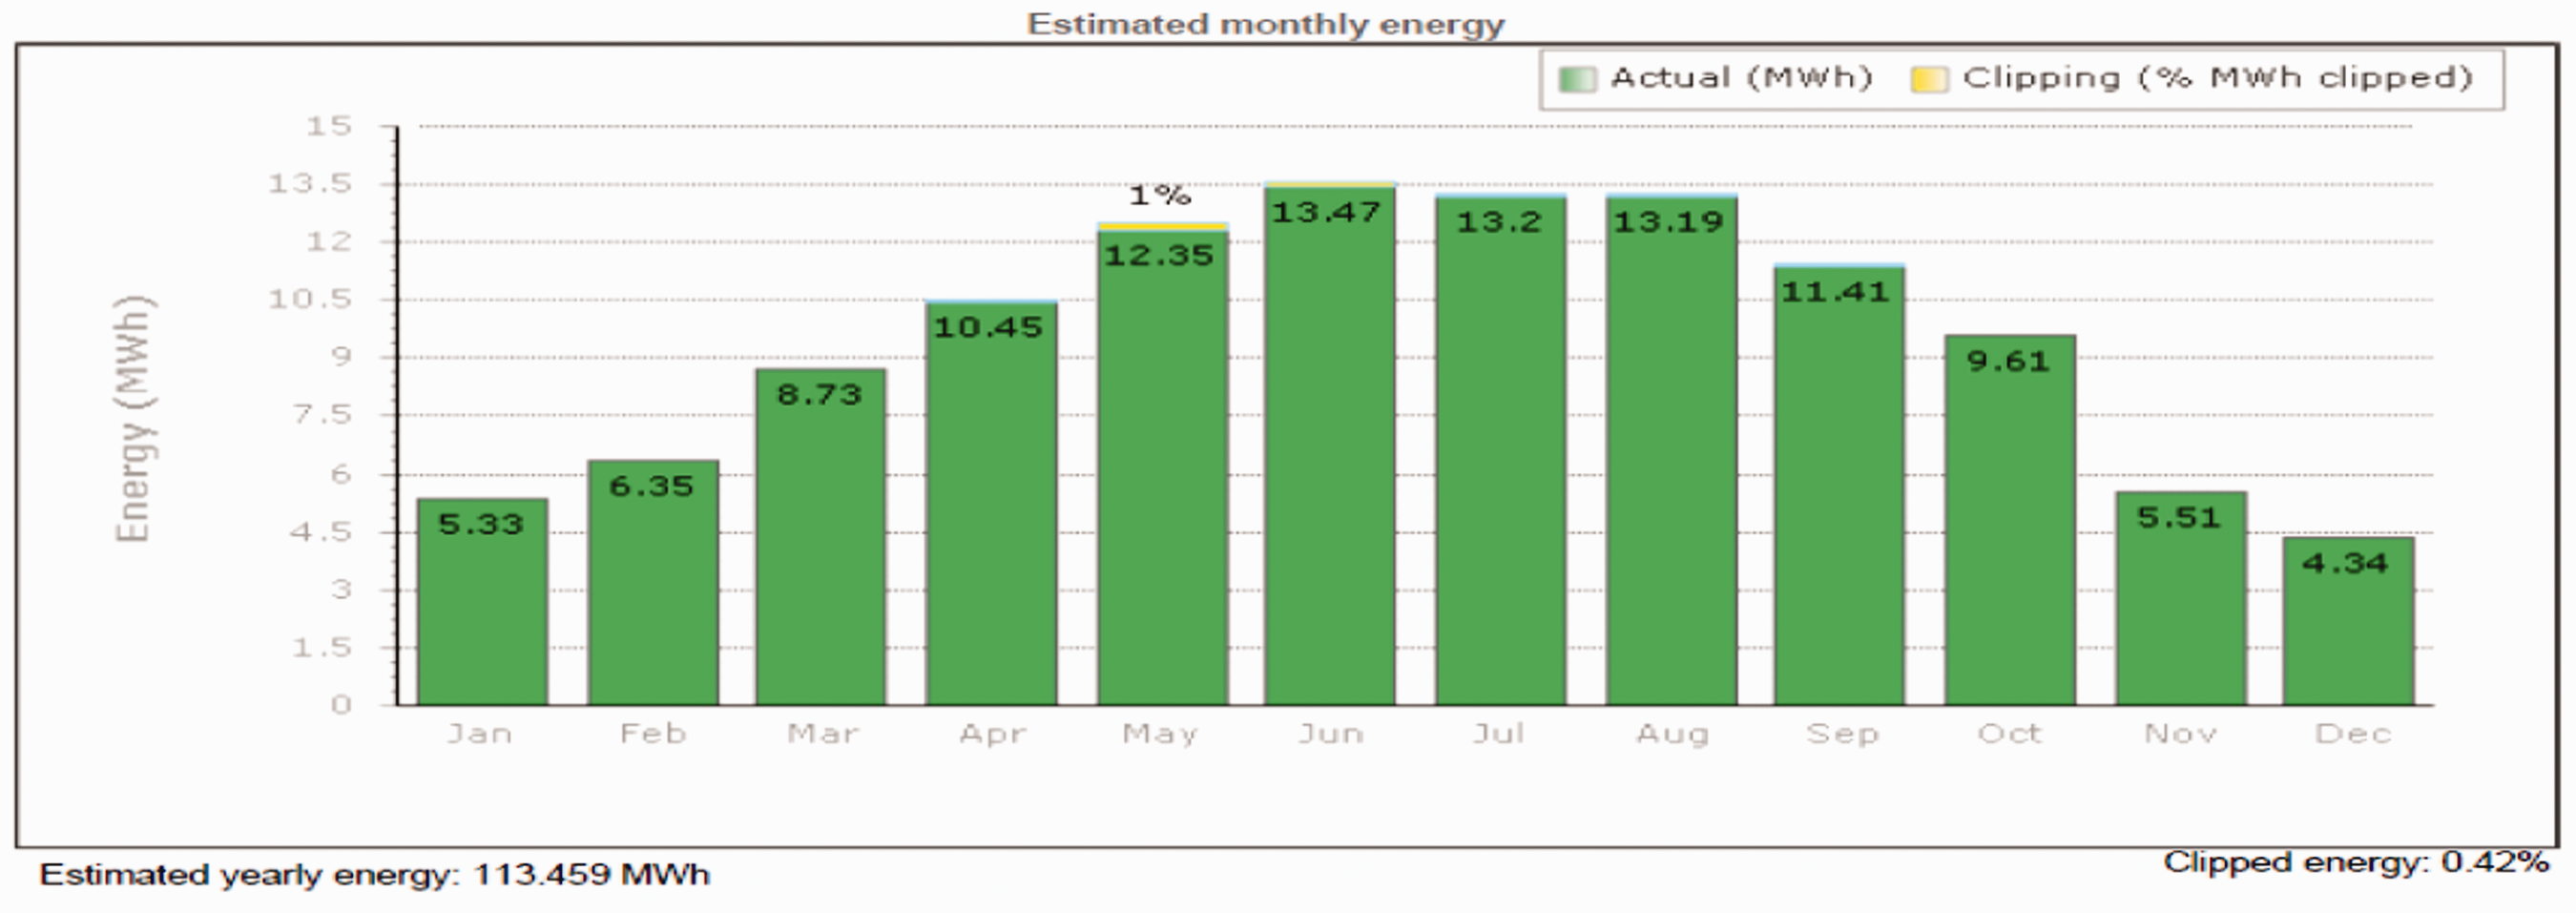
Estimated energy output month by month.
This is very promising as the month-to-month analysis of the property’s energy usage shows that most months the property is estimated to produce more than it will use most months. Tracking systems have to be used with the solar array which is also evaluated for their cost-effectiveness. 23 By modeling them in EES, it can be determined whether 1-axis or 2-axis tracking systems will provide a significantly elevated power production. Additionally, since the irrigation pumps only run in the spring and summer months, the angle to set the panels can be optimized for those months using the solar position algorithm provided by National Renewable Energy Laboratory for the position of the sun. The data show a consistent pattern of high costs associated with aggressive usage during the spring and summer months with relatively low usage in the winter months. Fortunately, this pattern coincides with the pattern of generation by a PV system as well. A budget is developed to include the basic materials and installed cost including estimates for labor taken from national databases of common current construction costs, such as trenching, metal fabrication, and pier construction. In most cases, raw materials from which to construct things such as the ground-mounted racks are preferred over the more expensive manufactured components in order to present an optimized investment scheme for the site. Manufactured components such as solar panels and inverters are included in the budget. A complete system is naturally available at substantial wholesale discounts, so the budget includes two complete systems with components added to supply the additional power needed. The budget also includes a new transformer to be installed near the Agency Lake pump with basic necessary electrical components such as cabling and switchgear. A cost analysis per kWh of several types of storage is presented in Figure 10, showing waste vegetable oil and Pacific Power Grid tie taking most of the portions of the chart. Lead-acid batteries and Tesla power wall-liquid cooled Lithium-ion battery pack also contribute to the cost, providing little room for the hydroelectric storages.
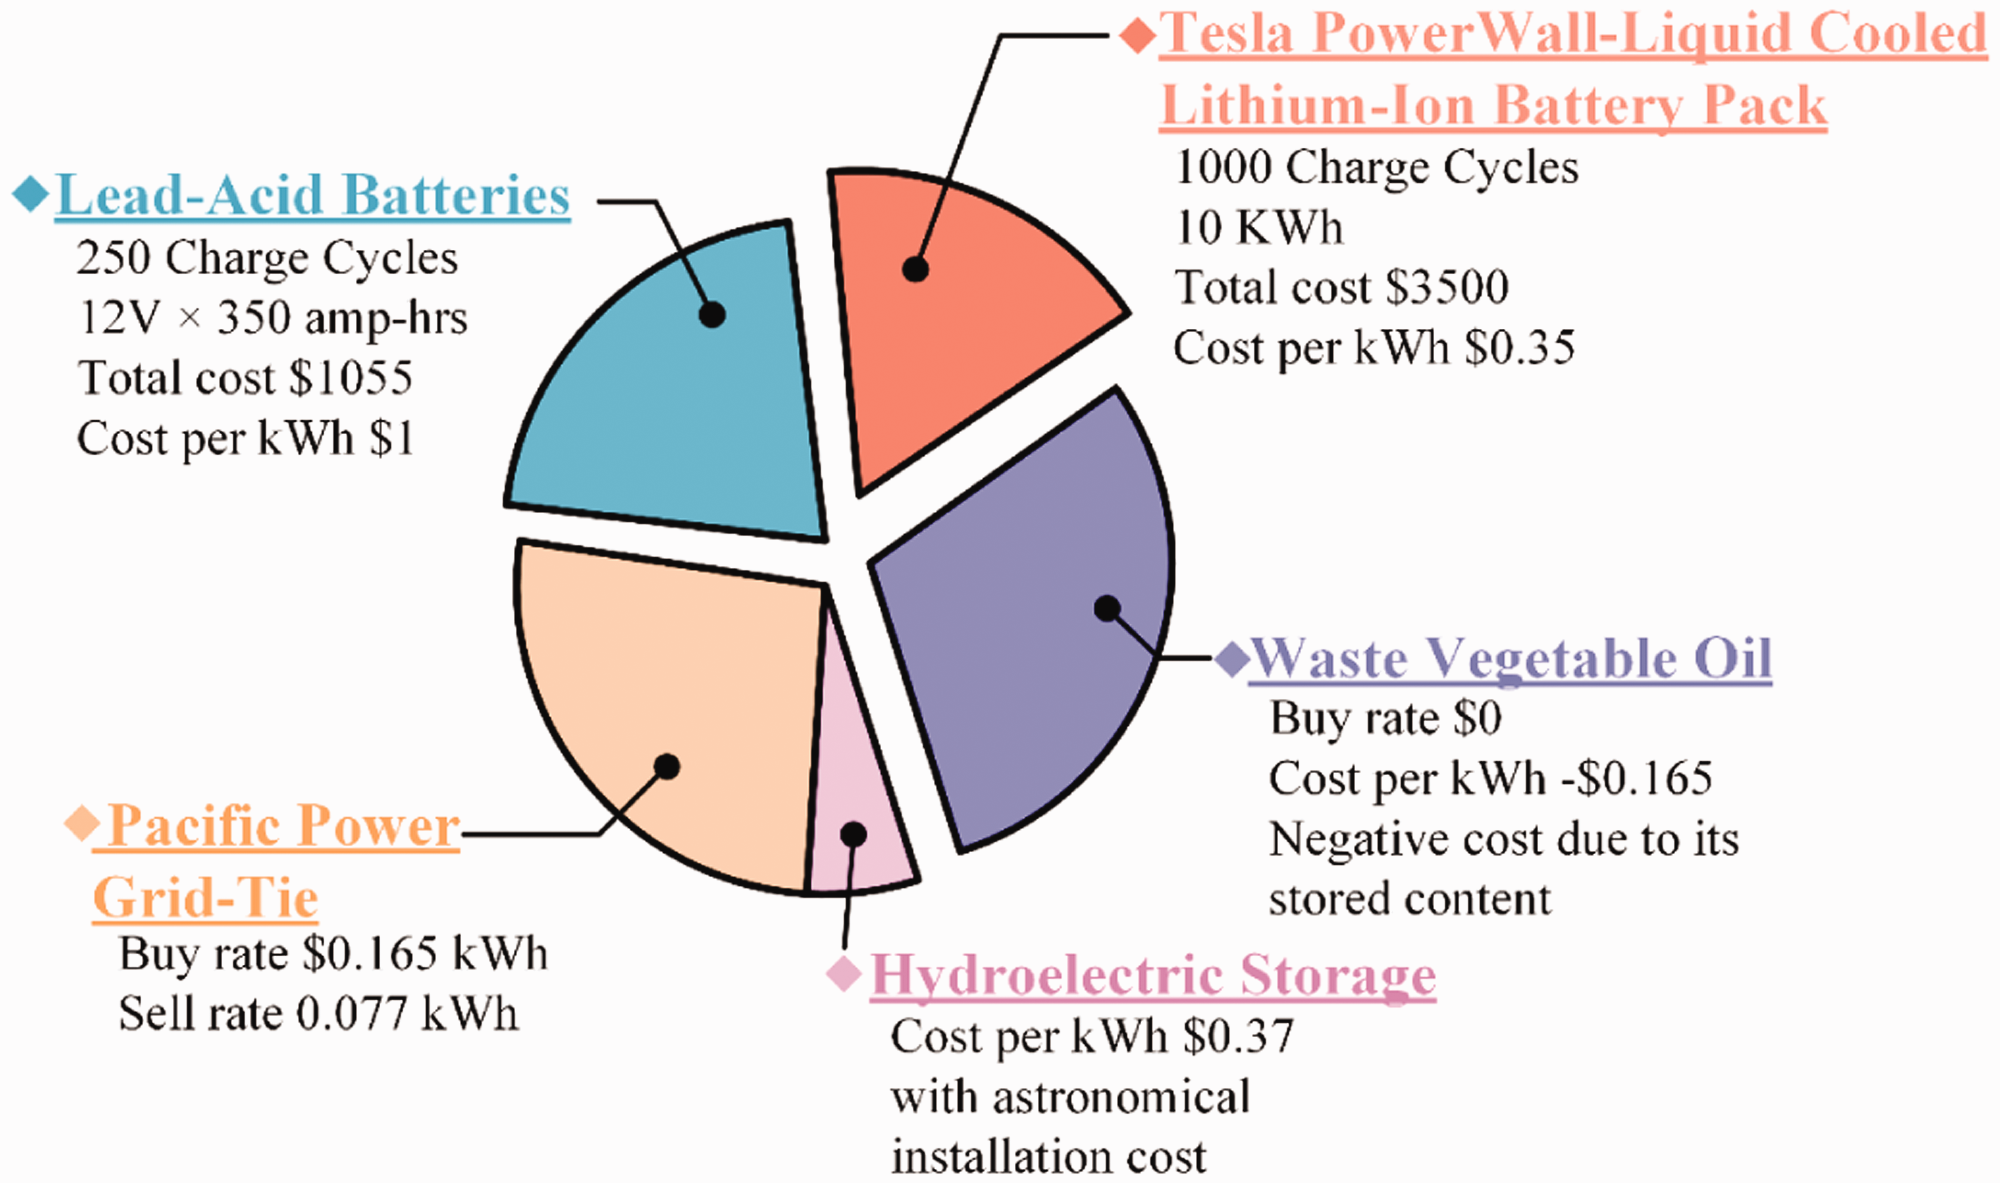
Cost analysis showing both worst case and battery scenario.
The long-term yields of a sizable project are key to understanding how financially viable a project is over a period of time, and whether it is worth the initial cost. Using the projected initial cost, a present worth analysis is performed to determine what the internal rate of return is and if the project would pay dividends, what the payback period is. It is to be noted that the first analysis shown below reflects the worst possible conditions – that is 100% of the power generated is stored and credited $0.08 and retrieved later at a cost of $0.16. In that case, no power would be used during times of peak generation which is slightly unrealistic but provides an extreme worst case scenario.
Worst case scenario
Power buyback rate is $0.08
All power generated is fed to the grid during the day, and bought back at night or times of no generation. Storage capacity is thus 50%
Simple payback: $165.5k/$750/mo = 18 years, 4 months
IRR: $165.5k = $750 × 12×(P/A, i, 20yrs), i ≈ 1%
Ideal case scenario – Loads increase
All 113 MW per year is used only during periods of a generation or is stored with no losses.
Power is valued at the minimum utility price −$0.15
Simple payback: $165.5k/(113 MW×$0.15/kW)/yr = 9 years, 9 months
IRR: $165.5k = $16,950×(P/A, i, 20 yrs), i ≈ 8% (data representation)
The ultimate goal of the design is to simply provide enough power to allow the facility to break even with the power they consume from the local utility. Keeping that in mind, the primary pass condition is to determine that during normal operation, and the system will deliver power back to the grid. The easy power simulations show that roughly six times the power used during the normal operation without the pumps running is delivered back to the grid when all panels are connected at normal operating conditions. The solar edge simulation gives a complete estimation of the total power generated. Obviously, the system is so robust to deliver six times the power back to the grid as there are many factors to take into account, like periods of time when the panels generate nothing. There are also several less-than-sunny days in the area. Even so, the energy estimates from solar edge show that for every month, the estimated generated power is still higher than what the demand was over the past several years. So based on power generation requirement, this design would be considered as a success.
Conclusion
Since different sites have varying potential for the implementation of renewables, different factors are to be taken care of in order to enhance the viability of the construction. In this paper, the site of Rainbow Youth Golf Education Program in Klamath County has been evaluated for the implementation of solar energy to meet the energy demand for irrigation. One of the major challenges of the proposed site has been the investigation of the best engineering solutions to meet the energy demands of the organization. Different energy generation options have been explored including grid-tied photovoltaic, off-grid photovoltaic, wind, and a waste vegetable-powered generator model. Energy storage possibilities have been examined for hydroelectric storage, lead-acid, and lithium ion batteries. The most cost-effective option has been found to be a 60 kW grid-tied photovoltaic solar farm. Using software tools, the theoretical models of each design have been scrutinized, and a determination of the best possible configuration of renewable energy system has been evaluated. An economic analysis of the project has been completed to illustrate the costs, payback, return on investment, and the breaking even point. The investigation, estimating of the total cost of $165,000 dollars, will further provide a better conceptualization to the electrical engineering students, specifically in the domain of power system analysis, of how to design the layout, select parameters, perform simulations to evaluate similar sites and estimate best possible renewable options. It is expected that the possible fund to incorporate this project will be available and implementation of this design will meet the necessary requirement keeping the cost of irrigation well within reach.
Footnotes
Declaration of conflicting interests
The author(s) declared no potential conflicts of interest with respect to the research, authorship, and/or publication of this article.
Funding
The author(s) received no financial support for the research, authorship, and/or publication of this article.
