
Abstract
Aerospace vehicles undergo rigorous qualification tests to protect against lightning strikes. The military standard recommends subjecting test specimens to three specific high-voltage waveforms (types A, B and D). A comprehensive study analyses these waveforms regarding their energy content. Utilising experimentally obtained breakdown voltages (BDV) from the published literature, the magnitude of energy for specific time durations was computed for these waveforms in the present study. Type D exhibits the highest magnitude of energy, while its BDV is the lowest. The plot of the reciprocal of energies against their specific time durations resembles V-t characteristics of a typical insulation configuration. The magnitude of energy computed using equal voltage-peak for simulated waveforms exhibits a trend resembling the experimental results. Similarly, the computed voltage-peaks of these waveforms with equal energy are plotted as a function of time durations and resemble the experimentally obtained V-t characteristics. A waveform with higher energy content requires lower voltage-peaks from the breakdown point of view. This observation would help determine the voltage test magnitudes for the test waveforms specified in the military standard. This energy-based comparison, probably attempted for the first time, could lead to a critical evaluation and understanding of these test waveforms.
Keywords
Introduction
Aerospace vehicles, including spacecraft, helicopters, aircraft and missiles, are often susceptible to lightning strikes. These strikes can result in various physical damages, such as burning, erosion, blasting, structural deformation and the generation of high-pressure shock waves. The stroke can involve fuel, structural and electrical hardware. Therefore, comprehensive hardware testing of these vehicles is carried out to meet the necessary lightning qualification before installation as per the military standard. 1
To achieve these testing goals, high-voltage and high-current test waveforms are recommended in the relevant standard. 1 These laboratory-simulated test waveforms are specifically proposed to reproduce the stresses and effects on test objects, providing an accurate lightning test environment. The current study focuses on military standard high-voltage waveforms 1 : type-A, type-B, type-C and type-D. While testing aerospace vehicles using these waveforms, type-A and type-D waveforms are generally used to examine lightning flash attachment points and dielectric punctures. In contrast, type-B waveform is employed to assess corona and streamers associated with the test specimens.1,2 Type-C waveform, traditionally utilised for scale model testing, is no longer recommended by the military standard. 1
A brief review of the pertinent literature on the usage and analysis of these test waveforms is given in this paragraph. Reference 3 shows that type-B waveform is applied to commercial unmanned aircraft vehicles (drones) to evaluate their immunity against the electrical components of electromagnetic fields generated during lightning discharge. In another study, 4 type-D waveforms are utilised to analyse the influence of vehicle net charge on the triggered lightning of aircraft in strong atmospheric electric fields through laboratory experiments. Through laboratory experiments, using all three high-voltage waveforms of types A, B and D, lightning protection of an aircraft radome (radar-dome) is evaluated, 5 simulating a direct lightning stroke. In another study, 6 type-B and type-D waveforms are employed for high-voltage initial leader attachment tests on a full-scale aircraft radome.
Type-B represents a standard lightning impulse voltage waveform (1.2/50 μs) commonly utilised in electrical insulation engineering for conducting dielectric tests.7–10 In addition to the type-B waveform, which is widely recognised as the standard in insulation engineering, nonstandard waveforms such as type-A and type-D are considered to be military standard high-voltage test waveforms. 1 In a research effort, 11 transformer-invading nonstandard lightning impulse waveforms are evaluated by converting them into the above-mentioned standard waveform after quantitatively comparing the insulation characteristics under these waveforms. There have also been efforts made to represent nonstandard oscillatory lightning impulse waveforms in terms of standard lightning impulse waveforms using wavelet-multiresolution analysis. 12 Looking at these research efforts, it is felt that it would be valuable to analyse and compare the standard lightning impulse waveform (military standard type-B) with other military standard waveforms, namely, type-A and type-D.
The primary objective of the present study is to conduct a comparative analysis of the military standard high-voltage waveforms (types – A, B and D) 1 concerning their energy content. Towards this aim, experimentally obtained breakdown voltages (BDV) reported in the literature 5 are utilised to compute the magnitude of energy associated with these three waveforms. To develop a theoretical framework for understanding the trend variation of energy magnitudes associated with the three waveforms, two series of numerical experiments were carried out as follows: (i) The energy magnitudes of the three distinct waveforms were calculated using equal voltage-peak amplitude, and specific time durations, and were subsequently compared. (ii) An effort is made to compare the voltage-peaks of these waveforms to achieve an equal magnitude of energy for specific time durations. This energy-based comparison of military standard high-voltage waveforms is probably attempted for the first time. It may contribute to a more critical evaluation of the test waveforms and the test results thereof.
Voltage waveforms used for lightning qualification test
Commonly used high-voltage waveforms in lightning qualification tests of aerospace vehicles are type-A, type-B and type-D. 1 The type-A waveform, also called the basic lightning waveform, features a linear rate of rise of 1000 kV/μs and is applied across the test object (e.g., an aircraft nose radome) until interrupted by a breakdown (flashover or puncture). According to the IEEE standard, 7 the front time of a lightning impulse waveform refers to the duration for the waveform to reach its peak amplitude, while the tail time indicates its duration to decline to 50% of its peak amplitude. Type-B is a full standard lightning impulse voltage waveform with a front time of 1.2 μs and tail time of 50 μs, denoted as 1.2/50 μs. 8 In this research, the wave front time is defined as the actual wave front time from the voltage-zero point to the peak value 11 and not the virtual wave front time. 7 Similarly, the wave tail time is defined as the duration from the instant of voltage-zero till it reaches 50% of the peak value in the wave tail and not the virtual wave tail time. In laboratories, type-D waveforms are typically generated with a front time ranging from 50 to 250 μs and a tail time of 2000 μs to apply to test objects.4–6 Three typical type-D waveforms with front times of 50, 150 and 250 μs are used in the present study. All three types of military standard high-voltage waveforms are generated in MATLAB simulation software using a sampling frequency of 100 GHz to analyze and compare the waveforms in the time domain. The type-A waveform with peak amplitude of 1 MV is depicted in Figure 1(a), which is a ramp high-voltage reaching its peak in 1 µs. Figure 1(b) illustrates the type-B and type-D waveforms with their front and tail times on a comparable time scale. An effort is made to compare these waveforms by computing their energy magnitudes in the time domain.
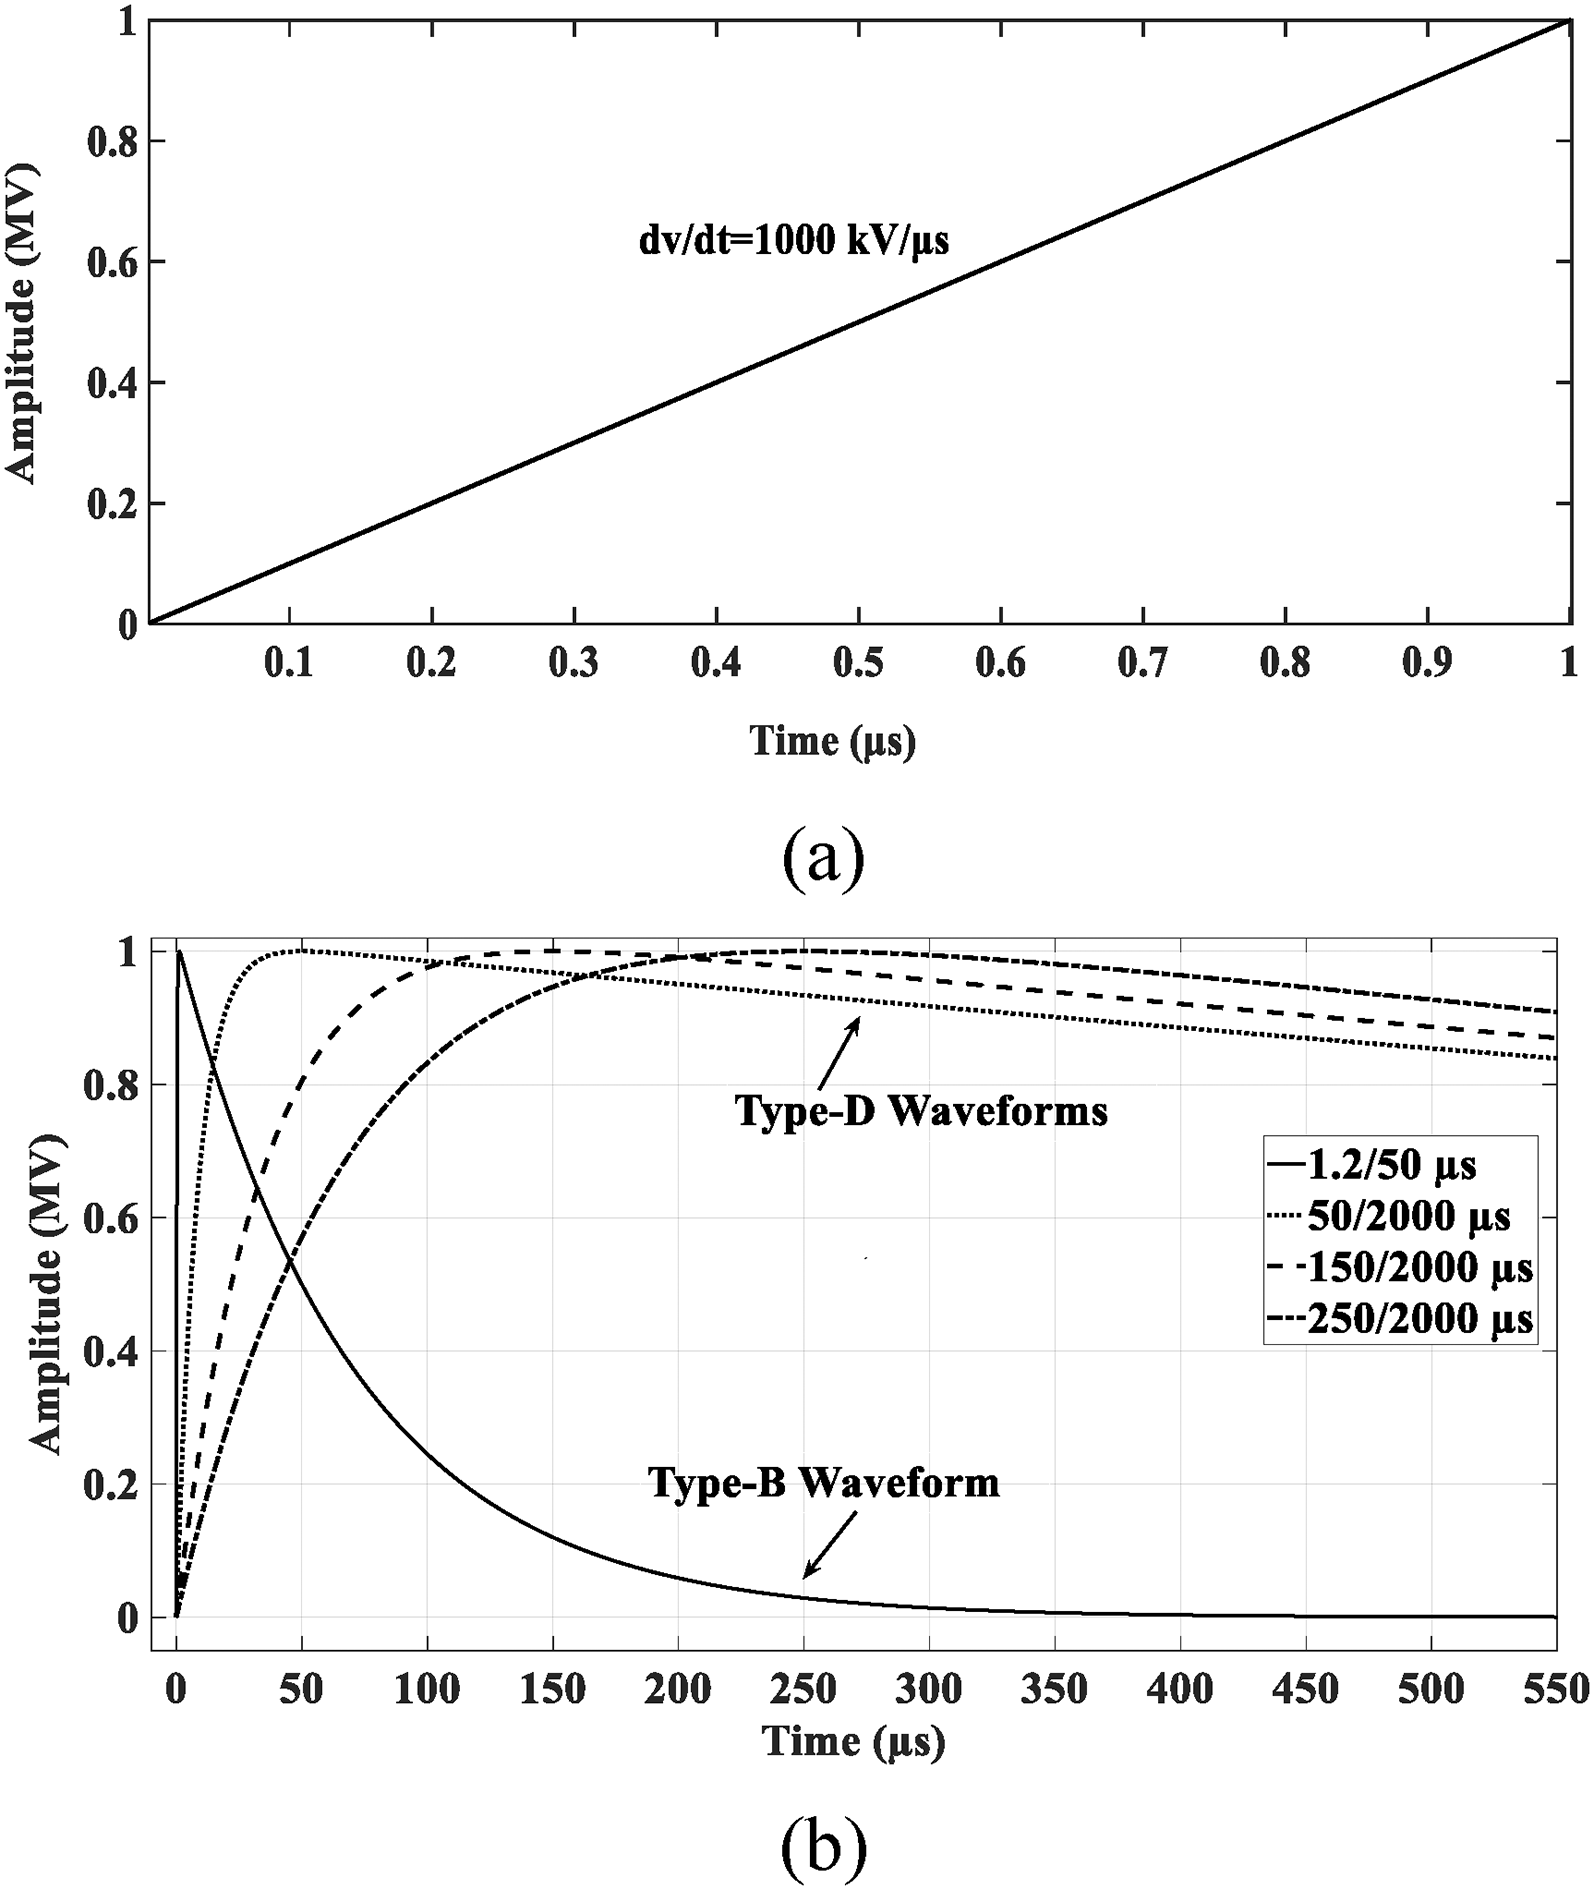
Military standard high-voltage waveforms. 1 (a) Type-A, (b) Type-B and Type-D.
Disruptive effect and energy associated with test waveforms
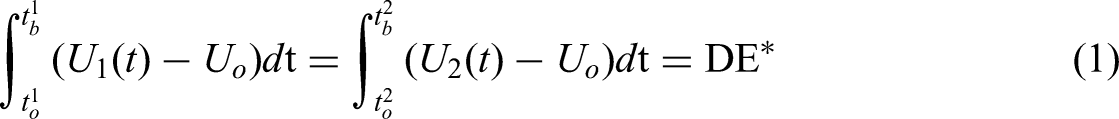
Dieter Kind developed the disruptive effect (DE) method for predicting the strength of insulation under nonstandard lightning impulse waveforms.13,14 The technique utilises the V-t characteristic plot of insulation obtained from test results of a 50% probability of BDV (V50) for various front times of lightning impulse waveforms with a fixed tail time of 50 μs. The DE of the applied overshooting impulse waveform describes the processes leading to the breakdown of insulation. The DE magnitude represents the area under the voltage curve above the onset voltage (UO) from the time instance where the voltage surge first crosses UO (to) to the breakdown time (tb). According to the preposition, each insulation configuration has two distinct features: the critical value of DE, designated as DE* and the onset voltage (UO). Considering any two points on the V-t curve, the two empirical constants, DE* and UO, can be determined using the equal area criteria defined by (1).
15
For an incoming nonstandard waveform to cause insulation breakdown, its DE value must exceed DE*:
Unlike the traditional method of determining the area above the onset voltage UO to predict the breakdown V-t characteristics of waveforms attaining DE*, the present study considers the energy above the zero-reference voltage. Calculating energy magnitudes under the curve has advantages for bi-directional nonstandard waveforms compared to area-based methods. In the time domain, the summation of the square of the voltage signal over a definite time duration given in (2) is a measure of energy. Here, N represents the number of sampling instances, T signifies the time duration of the waveform under consideration, k denotes the individual sampling instant, and x[k] represents the amplitude of the waveforms at a kth instant:

The energy magnitudes above (a) onset voltage (UO) and (b) zero-reference voltage are compared with the DE values. DE values are calculated by integrating the area above the onset voltage (UO) under the voltage curve. For illustration, the experimental voltages reported in the literature 5 are used for this comparison. The logarithmic plot of both energy magnitudes against their respective DE values for the three waveforms is depicted in Figure 2. Type-D waveform exhibits the lowest average BDV determined for two test cases as part of experimental results reported in the literature. 5 Hence, the lower limit of the average BDV (with one standard deviation) of the type-D waveform is assumed to be UO. As seen in Figure 2, the energy magnitudes above the zero-reference voltage exhibit a similar trend to those above the onset voltage (UO) and positively correlate with respective DE values. Therefore, in the present work, a comparative analysis of military standard high-voltage test waveforms focuses solely on the energy magnitudes above the zero-reference voltage, as explained in ‘Methodology adopted in comparing the test waveforms’ section.
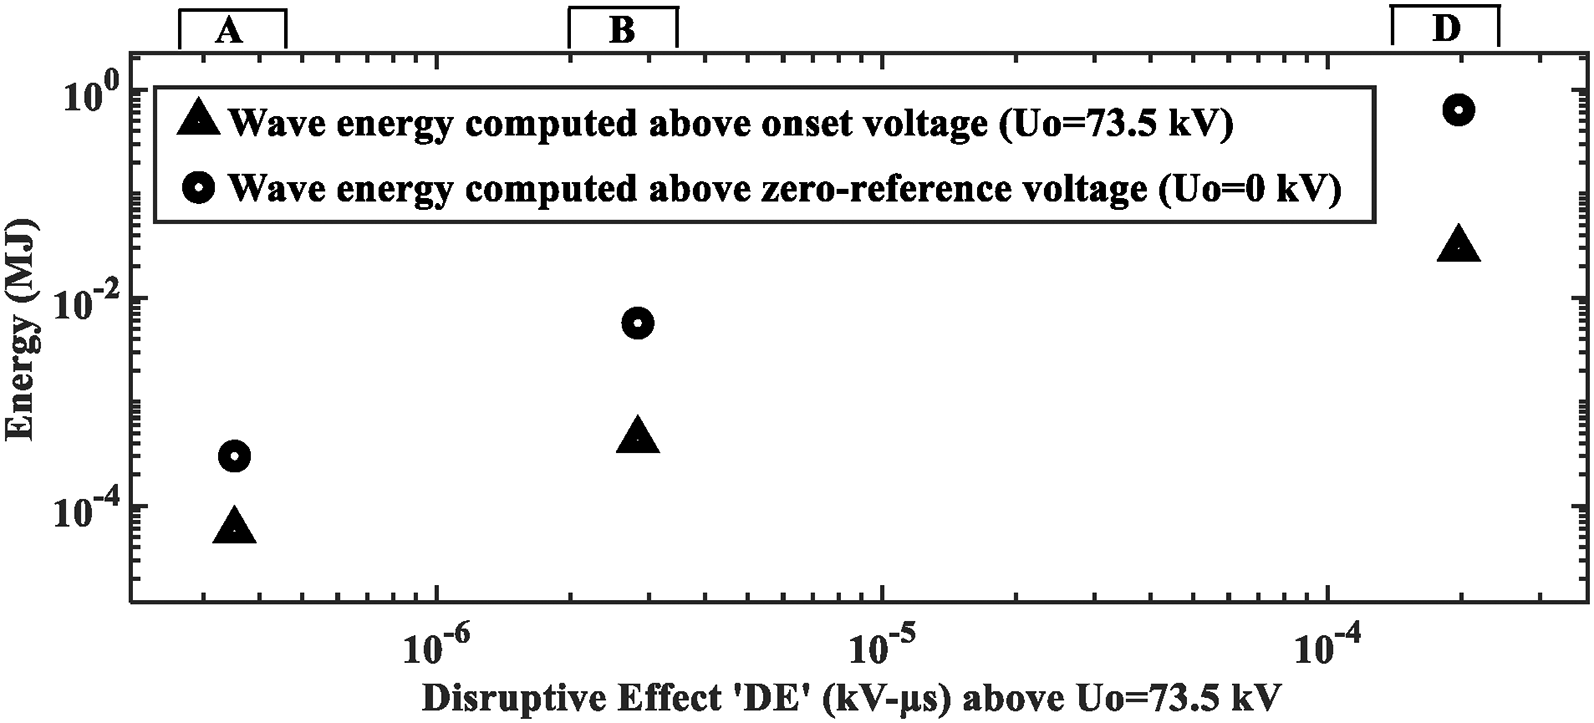
Energy under the curve (above zero-reference voltage and onset voltage) versus disruptive effect (area under the curve above onset voltage).
The energy of the waveform method emphasises the total kinetic energy imparted to the dielectric material, that a specific amount of energy must be absorbed to establish a conducting pathway. 16 The DE method describes that breakdown occurs when the integral of the voltage, surpassing a critical threshold, accumulates over time to reach a constant value DE*. 14 In general, V-t curves illustrate that as the applied voltage peak increases, the time to breakdown decreases. Unlike the DE method, in V-t curves, only the voltage peak and the timestamp are significant. 9 A comparison between the DE-based method and the proposed energy-based method is shown in Figure 2, which indicates a positive correlation between the two methods. In signal processing applications, the energy associated with a curve (waveform) is emphasised.17,18 The energy imparted by the electric fields of high-voltage waveforms results in an avalanche of electrons and further insulation breakdown. Therefore, it is more appropriate to use energy-based methods rather than the DE method.
Methodology adopted in comparing the test waveforms
The waveforms of lightning qualification voltage tests can be compared in the time-domain or frequency-domain (through wavelet transform). These waveforms 1 do not have oscillations either on the front or on the tail portion of the wave, and hence, wavelet-based analysis yields little information, unlike what is reported in reference. 12 Therefore, in the present study, the energy comparisons of test waveforms are attempted only in the time domain. The energy imparted by the applied electric field induces electron avalanches, resulting in the dielectric breakdown of an insulating material. Therefore, the energy magnitude of the applied voltage waveform is closely associated with the BDV value. 13 The time duration over which this needs to be computed is crucial in energy estimation. In type-A waveform, the time duration is up to flashover or puncture. Type-B and type-D would require the estimation of a 50% probability of BDV (V50) as the BDV, the phenomena being statistical. In the present study, in type-B and type-D, the wave front time (time to peak) is considered as the time instant of breakdown. For the type-B waveform, a front time of 1.2 μs (of SLI) is selected and also used as the time duration for calculating the energy magnitude. Type-D waveforms with front times representative of both extremes and a midpoint within the specified range (50–250 μs)—namely, 50, 150 and 250 μs are used as the wave front time in computing the energy magnitude. Using experimentally obtained BDV values reported in the literature, 5 the magnitude of energy of three different waveforms 1 is computed using (2) for comparison purposes.
Energy comparison with experimentally obtained BDV values
Reference 5 says the authors evaluated lightning protection for aircraft radome wall structures using three distinct military standard high-voltage waveforms in the laboratory. In their study, the radome walls are constructed of sandwich panel structures with cores made from reinforced honeycomb. The BDV values under three waveforms were determined for two test samples with different thicknesses of honeycomb cores. Breakdown tests are performed at various locations on the samples. Therefore, average BDV values and standard deviations (given in brackets) for both test samples are shown in Table 1. In the present work, these average BDV values are considered for computing energy magnitudes.
Computed energy magnitudes of types – A, B and D waveforms with experimentally 5 obtained BDV values.
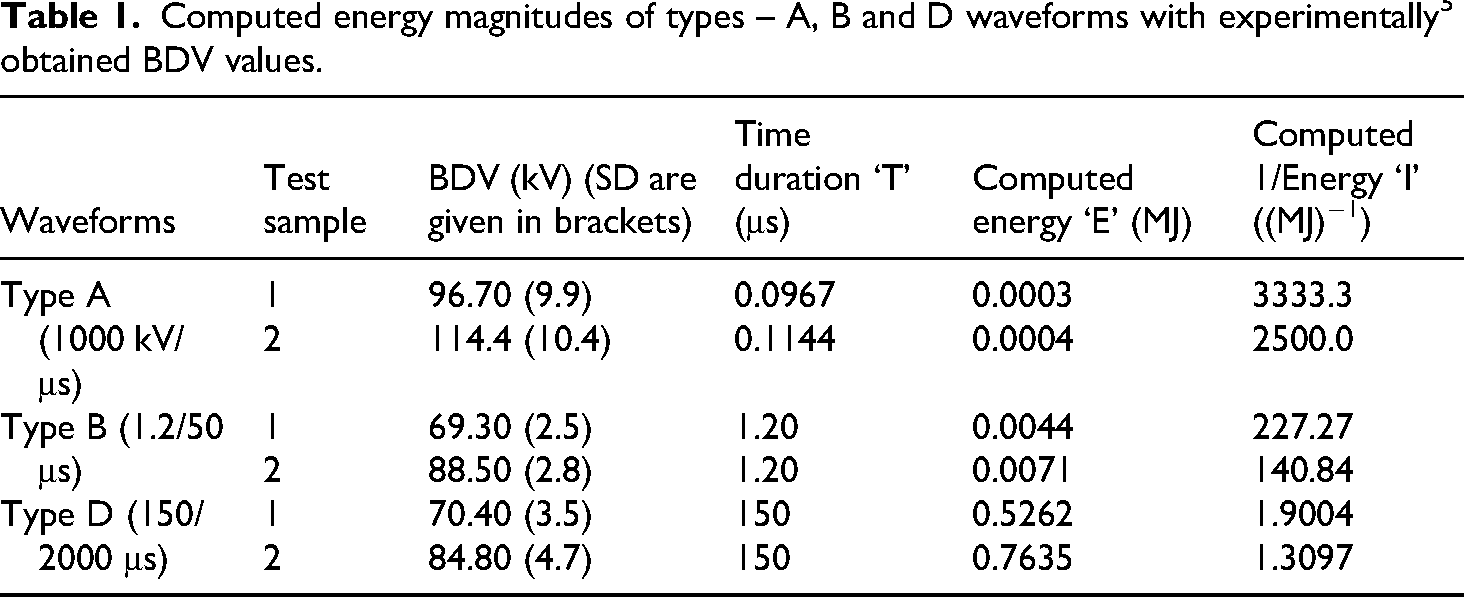
When applying a type-A waveform to sample 1, the breakdown occurred at 96.70 kV, indicating time-to-breakdown to be 0.0967 μs (based on the waveform's 1000 kV/μs rate of rise for type-A). Similarly, sample 2 experienced a breakdown at 114.4 kV, indicating time-to-breakdown to be 0.1144 μs. Since type-A is a ramp waveform that continues rising until breakdown, the energy calculation up to the instant of time to breakdown is appropriate. Hence, in the energy estimation, the energy integration stops exactly at the instant of breakdown. The front times are considered for the computation of the magnitude of energy associated with the type-B and type-D waveforms, implying an assumption that the breakdown of test objects occurs at its peak. Hence, for type-B waveform, its front time of 1.2 μs is considered as the waveform time duration for computing energy associated with it. In computing the energy associated with the type-D waveform, along with the experimentally obtained BDV (voltage-peak) value given in reference, 5 the front time of 150 μs is used as the waveform time duration. The energies thus obtained are presented in ‘Energy compaison with experimentally obtained BDV values’ under results section for comparison.
Simulation-based comparison of wave shapes
The trend in the energy magnitudes associated with the three waveforms and their relationship with the respective BDV values reported in the literature 5 is validated through the two numerical experiments in ‘With equal voltage-peak’ and ‘With equal energy’ under methodology sections. The magnitudes of energy associated with these three distinct waveforms are calculated with equal voltage-peak amplitude. This assumes the breakdown occurs at the same peak. The comparative study is detailed in ‘With equal voltage-peak’ under methodology section. Conversely, for the equal magnitude of energy of these waves, a comparison of their voltage-peaks is performed, as this is of interest from the breakdown or withstand point of view. This assumes the breakdown occurs for the same energy. This is explained in ‘With equal energy’ under methodology section. Since the actual BDVs are highly stochastic and may not occur at the same peak across the three types of waveforms studied, simulations are limited in their ability to mimic the actual situation.
With equal voltage-peak
The voltage-peak is kept constant to compare the magnitude of energy associated with the three waveforms. 1 In this process, the type-A waveform is used as a reference with a voltage-peak of 1 MV, having a slope of 1000 kV/μs. This results in a time duration of 1 μs for type-A waveform. The same voltage-peak amplitude is used for type-B and type-D waveforms. Three typical type-D waveforms are considered in the present study with front times of 50, 150 and 250 μs. In each case, the front time is the time duration for computing the associated energy magnitudes. Thus, for a fixed peak amplitude of 1 MV, corresponding time durations of 1 μs, 1.2 μs, and 50, 150 and 250 μs are chosen to compute the energy magnitudes using (2) associated with type-A, type-B and type-D waveforms, respectively. The energies thus obtained are presented in ‘With equal voltage-peaks’ under results section for comparison.
With equal energy
In the present study, energy criterion is considered instead of the area-based criteria. Hence, the present work compares waveforms used in lightning qualification tests of aerospace vehicles by maintaining equal energy magnitude for all three waveforms to evaluate the required voltage-peaks. For this comparison, the energy of the type-A waveform (slope of 1000 kV/μs 1 ) with a duration of 0.1 μs reaching a peak value of 100 kV is chosen as a reference. The voltage-peak that would give the same reference energy for type-B for the time to front of 1.2 μs is determined. Similarly, the voltage-peak for the three typical type-D waveforms with front times of 50, 150 and 250 μs is computed, resulting in the same reference energy considering up to their peaks. The voltage-peaks thus obtained are presented in ‘With equal energy’ under results section for comparison.
Results and discussion
Correlating energy with BDV
The process of insulation breakdown mechanisms begins with the application of a voltage waveform, which generates electric fields (force per unit charge) that can accelerate free electrons to high velocities. As these electrons gain energy (momentum) in the free path, they traverse between two collisions with the atoms of the insulating material and may liberate an electron if the impact energy is greater than the ionisation potential of the gas molecule. Such a cascading effect results in an avalanche of charge carriers. As the number of charge carriers increases, a conductive plasma channel forms, leading to dielectric breakdown.19,20 This phenomenon primarily hinges on the energy provided by the applied electric field, leading to electron avalanches. The energy required for this transition is crucial, as it transforms the dielectric material from its stable insulating state to a condition that results in breakdown, often occurring almost instantaneously. 15 In this context, the energy associated with the voltage wave becomes an important factor influencing the breakdown process. Each insulation configuration has a specific channel-energy threshold that determines when breakdown might begin occurring. 13 Therefore, the energy associated with the voltage waveform is closely correlated with the deterioration of insulating properties, increased conductivity and the eventual breakdown of the insulating material.
Given the importance of the energy associated with the voltage wave, energy comparisons for type-A, type-B and type-D waveforms are presented in the following sections.
Energy comparison with experimentally obtained BDV Values
As discussed in ‘Energy comparison with experimentally obtained BDV values’ under methodology section, utilising the experimentally obtained BDV values reported in the literature, 5 the magnitude of energies ‘E’ is calculated and presented in Table 1. In addition, the reciprocal of energies ‘I’ calculated for all three waveforms for both samples is given in Table 1. As per Dieter Kind's preposition,13,14 BDV is supposed to have an inverse relation with the time to breakdown, resulting in typical V-t curves. Hence, the reciprocal of energy (and also the energy) as a function of waveform time durations ‘T’ (on a log scale) is plotted for both the sample cases, as shown in Figure 3.
Computed energy ‘E’ and the reciprocal of energy ‘I’ versus time duration ‘T’ for types – A, B and D waveforms (based on two radome test sample results given in Reference 5).
The data points evaluated using the BDV values of experimental results 5 are fitted using the power curve for both test samples. The power curve fitting is used as it yielded the lowest error and highest correlation coefficient. The energy magnitudes for the three distinct types of waveforms are calculated based on their respective wave durations. Experimental BDVs for the analysis are taken from the reference. 5 Considering the statistical variation of 1-standard deviation from the average BDV for each waveform, the maximum percentage change in energy with respect to their average BDV values is 33.94%, 7.04% and 11.39% for type-A, type-B and type-D waveforms, respectively. The type-A waveform exhibits higher BDV values as well as higher dv/dt values compared to the type-B and type-D waveforms, resulting in greater energy spread for the type-A waveform. It is observed that the type-D waveform possesses the highest magnitude of energy among all the waveforms, due to which the BDV value is the lowest. The BDV values with respective standard deviations (in Table 1) are essential in comparison, as the breakdown is statistical. Therefore, it is evident that the waveform with the highest energy has the lowest BDV value and vice versa. In essence, the BDV values follow the reciprocal of the energy magnitude curve. Also, the plots of reciprocal energy magnitudes resemble the V-t characteristic curves of any typical insulation.
In various signal processing applications and statistical analyses,17,18 an energy-based approach is often preferred for characterising signal wave shape. The present study introduces, likely for the first time, an energy-based comparison of military standard lightning impulses. The findings indicate that type-D has the highest energy and the lowest BDV and may serve as the critical waveform for testing purposes.
Simulation-based comparison of wave shapes
With equal voltage-peaks
As described in ‘With equal voltage-peak’ under methodology section, with the waveform time durations of 1 μs, 1.2 μs, and 50, 150 and 250 μs for the three waveforms (types A, B and D), the magnitude of energies ‘E’ is calculated by setting a constant 1 MV peak, as detailed in Table 2. In addition, the reciprocal of energy magnitudes ‘I’ is also computed. From Table 2, it is evident that the type-D waveform exhibits the highest magnitude of energy. In general, as the front time increases, the energy increases. The trend in energy magnitudes is similar to that of the experimentally obtained BDV reported in the literature 5 case. The magnitude of energy ‘E’ and the reciprocal of energy magnitude ‘I’ calculated for all three types of waveforms are plotted against their respective waveform time durations ‘T’ (on a log scale), as shown in Figure 4. The data points evaluated and given in Table 2 are fitted using the power curve. The power curve fitting is used as it yielded the lowest error and the highest correlation coefficient. The trends in this plot (Figure 4) are similar to those shown in Figure 3.
Energy ‘E’ and reciprocal of energy ‘I’ versus time duration ‘T’ for all three waveforms with 1 MV peak.
Computed energy magnitudes of types – A, B and D waveforms for equal voltage-peak.
With equal energy
As described in ‘With equal energy’ under methodology section, the energy associated with type-A waveform (333.3 J) is considered as a reference, with its time to breakdown being considered as 0.1 μs. The time duration opted aligns with the published data 5 in Table 1. Corresponding voltage-peak amplitudes are determined by equating the energy magnitudes of type-B and D waveforms with their reference energy (type-A). The time duration for type-B and D waves is considered up to their front times. The results are given in Table 3. A comparison is made between the computed voltage-peak values and the experimentally obtained BDV values reported in the literature 5 (given in Table 1). The computed voltage-peak values, given in Table 3, are normalised using min–max normalisation to the range of maximum and minimum BDV values (with one standard deviation) reported in the literature 5 (given in Table 1). These normalised voltage-peaks are plotted against the waveform time durations ‘T’ (on a log scale), as shown in Figure 5. The experimentally obtained BDV values with a spread of 1 standard deviation (given in Table 1) are plotted for both the test sample cases for comparison purposes. The BDV data points of experimental results 5 and computed voltage-peaks given in Table 3 are fitted using the power curve. The power curve fitting is used as it yielded the lowest error and highest correlation coefficient. Figure 5 shows that the BDV of experimental results 5 and computed voltage-peaks exhibit a similar trend.
Comparison between computed voltage-peak values and experimentally obtained breakdown voltage (BDV) values for two radome test samples.
Computed voltage-peak amplitudes of three military test waveforms for equal energy.
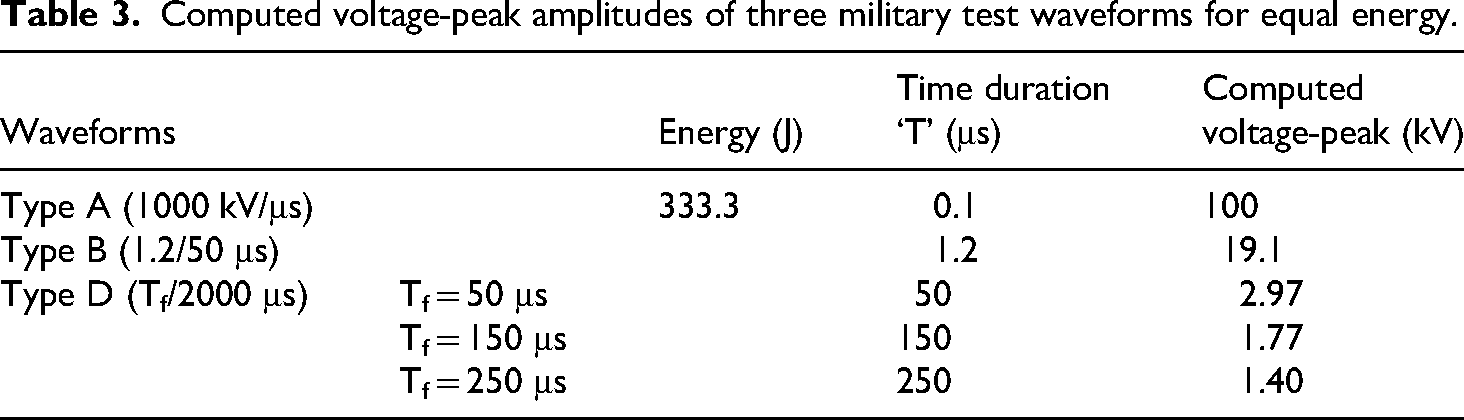
The comparison results in Sections ‘With equal voltage peak’ and ‘With equal energy’ suggest an inverse relationship between the magnitude of energies and voltage-peaks of waveforms in causing insulation breakdown. Higher energy content in a waveform requires a lower BDV value to cause a breakdown of the test object. BDV values follow a reciprocal pattern of the energy magnitudes. Simulation-based computed results validate the experimentally obtained BDV values reported in the literature. 5
The energy magnitudes for the three distinct waveform types are determined using both experimental BDV values 5 and simulation methodologies. It is noted that the trends in energy magnitudes, when plotted as a function of time duration, are consistent across the different waveforms. The type-D waveform exhibits the highest energy magnitude among all the waveforms, resulting in the lowest BDV value. This finding suggests that the type-D waveform can serve as a critical waveform for testing purposes, having the lowest BDV.
An energy-based approach focuses on the total stress rather than merely the peak voltage (height). Dieter Kind's proposed equal-area criteria provide guidelines for comparing BDV with the area under the voltage waveform. 14 As in many signal processing applications,17,18 energy is a better comparison parameter than the area under the curve. Thus, the proposed method with energy-based comparison has generality. The inverse relationship between energy input and BDV is widely applicable for various dielectric materials, 21 namely solids, liquids and gases. In the case of aerospace structures, lightning strikes and attachment to the radome occur through the atmospheric air.
Conclusion
An energy-based comparison of military standard high-voltage test waveforms used in lightning qualification test techniques for aerospace vehicles and hardware is carried out.
The experimental data published in the literature, when viewed based on the wave's energy, show that the type-D waves have the highest energy and exhibit the lowest BDV. The analysis indicates that the reciprocal of the energy-time plot resembles the V-t characteristics applicable to insulating materials. The slower the front time, the higher the energy associated with the wave and the lower the BDV. The above observations of V-t characteristics are validated by computing the reciprocal of the energies for the simulated test waves having equal voltage-peaks. The V-t characteristics obtained for the simulated test waves with constant energy for all three test waves also have a similar trend, as shown by the V-t curve derived from the published data of BDVs.
In summary, among the military standard voltage test waves, the higher the front time, the lower the BDV. Lower voltage-peaks are needed for test waves with slower fronts when deciding the test voltages. This may help determine the voltage test magnitudes.
Footnotes
Acknowledgements
The first author thanks the Ministry of Education, Government of India, for providing scholarship through the National Institute of Technology Karnataka, Surathkal, Mangalore, Karnataka 575025, India, for doctoral research.
Author contributions
Shanmukha Reddy Vippala contributed significantly in terms of the literature survey, mathematical modelling, implementation, simulation and final draft preparation of the article. Gururaj S. Punekar, as a corresponding author, supported in conceptualisation, data curation and result analysis and provided decisive comments and technical supervision for the article. Krishnan Chemmangat supported in providing decisive comments on signals point of view and contributed technically to the article.
Funding
The authors received no financial support for the research, authorship and/or publication of this article.
Declaration of conflicting interests
The authors declared no potential conflicts of interest with respect to the research, authorship and/or publication of this article.