
Abstract
Capacitor banks play a vital role in modern power systems by improving power factor and minimizing energy losses. Their reliable operation is essential for system stability and energy efficiency, especially in industrial and high-demand environments. While machine learning is increasingly used in power system optimization, predictive modeling of capacitor module status remains a relatively underexplored area, particularly in complex, mission-critical settings. This study proposes a novel application of the Random Forest algorithm, enhanced with the Synthetic Minority Oversampling Technique (SMOTE), to predict the activation status of 12 capacitor modules in a 500 kVAR bank at the Radioactive Waste Management Installation (RWMI). In contrast to traditional approaches focused on placement or capacity optimization, our method utilizes real operational data and explicitly addresses severe class imbalance, a common yet often neglected issue in predictive modeling. By integrating SMOTE, the model achieves a balanced classification performance with a prediction accuracy of up to 96%, along with high precision, recall, and F1-score. These results confirm the effectiveness of the proposed method in supporting more informed operational decisions and improving power system stability. The study highlights the value of data-driven approaches for optimizing energy management in critical infrastructure.
Introduction
The integration of capacitor banks in electrical systems has become essential for improving power factors and minimizing energy losses. 1 In industrial settings, capacitor banks are widely used to reduce operational costs and stabilize electrical networks. 2 Inductive loads such as motors and transformers reduce power factor, which capacitor banks correct by supplying reactive power. These banks are automatically controlled by power factor relays using the C/k value, based on the capacitor rating and current transformer ratio. However, continuous operation under heavy non-linear loads can cause overheating, leading to failures and reduced lifespan. Accurate prediction of capacitor bank status is essential for ensuring system reliability and efficiency. It supports timely switching, prevents voltage instability, avoids penalties, and enables effective maintenance planning to extend equipment life and minimize downtime.
Traditionally, capacitor parameters have been estimated using physical models and heuristic algorithms. 3 For example, Ahmad et al. utilized zero-crossing detection of voltage and current for parameter estimation, 4 while Shwehdi et al. optimized capacitor placement using genetic algorithms. 5 More recently, advanced analytics, especially machine learning, have emerged as powerful tools for power system management.1,6,7 Research in this area has explored predictive modeling for energy storage, system optimization,8,9,10,11 and equipment lifespan estimation,12,13 using methods such as neural networks.
Machine learning techniques have also been increasingly applied in power system monitoring and reactive power management. For instance, Panoiu et al. 14 applied machine learning models to predict power factor variations in industrial power systems, while Amaral et al. 15 employed a Random Forest classifier for fault detection in DC-link capacitors. In addition, machine learning approaches have been explored for predicting capacitor performance and lifetime in energy storage systems.11,13 In industrial applications, machine learning has been applied to predict power factor dips and initiate timely capacitor switching, 14 and to optimize reactive power dispatch using hybrid evolutionary and machine learning algorithms.16,17 Additionally, analytical models have been used to simulate thermal coupling effects between capacitors. 18 While machine learning has been widely applied in power system studies, existing research has predominantly focused on capacitor condition monitoring, parameter estimation, optimal placement, and system-level tasks such as load prediction, fault detection, and reactive power optimization using aggregated indicators (e.g., power factor or equipment condition). These approaches do not adequately capture the discrete and sequential characteristics of capacitor bank switching, where control actions are executed at the level of individual modules. Consequently, their applicability to predicting module-level activation behavior under real operating conditions remains limited, particularly in the presence of imbalanced and event-sparse data.
To address this gap, this study formulates capacitor module activation as a data-driven imbalanced classification problem using historical operational data from a 500 kVAR capacitor bank at RWMI. A Random Forest model, integrated with SMOTE, is developed to classify the activation status of 12 capacitor modules while effectively handling the rarity of switching events. The model is deployed via a web-based interface to support efficient capacitor bank management.
Random Forest handles high-dimensional data well but offers limited interpretability despite providing feature importance. Nonetheless, its proven performance across various domains, including fault detection, 15 legal text classification, 19 early warning systems, 20 image recognition, 21 and geotechnical modeling, 22 makes it suitable for this application. Previous study in transformer fault diagnosis 23 notes that Random Forest model enhanced by synthetic minority over-sampling technique has shown high accuracy at 96%.
This research develops a predictive model for capacitor bank operation using 2023 data from RWMI. Integrated into Main Panel 1-10-001, the system uses analog filters for power factor correction. The model forecasts module activation, addresses class imbalance, and supports energy efficiency, equipment reliability, and system stability in critical facilities.
Methodology
Data collection
This study was conducted at the RWMI, National Research and Innovation Agency (BRIN), Serpong, focusing on forecasting the activation status of 12 modules in a 500 kVAR capacitor bank located in Panel 1. Key variables recorded include power factor, voltage, current, active and reactive power, frequency, temperature, harmonics, and total harmonic distortion. Data were collected from daily operation logs between January and December 2023, specifically from 12:00 to 13:00 WIB on working days, resulting in 181 data points. RWMI operates two capacitor banks, both commissioned in 2009. One of them is a 500 kVAR unit and is specifically utilized to control the power factor (Cos φ) supply from Transformer 1 to the chiller system and administrative spaces. The system operates continuously for 8 h daily, Monday through Friday, employing 12 capacitor sets, 50 kVAR each, in the form of two 25 kVAR capacitors in parallel, except 1, 2, and 12. Automatic step control of the capacitor bank is executed by the BR6000 Module and varies depending on power factor demand, and the status of the system appears on the display of the BR6000 Module as shown in Figure 1.
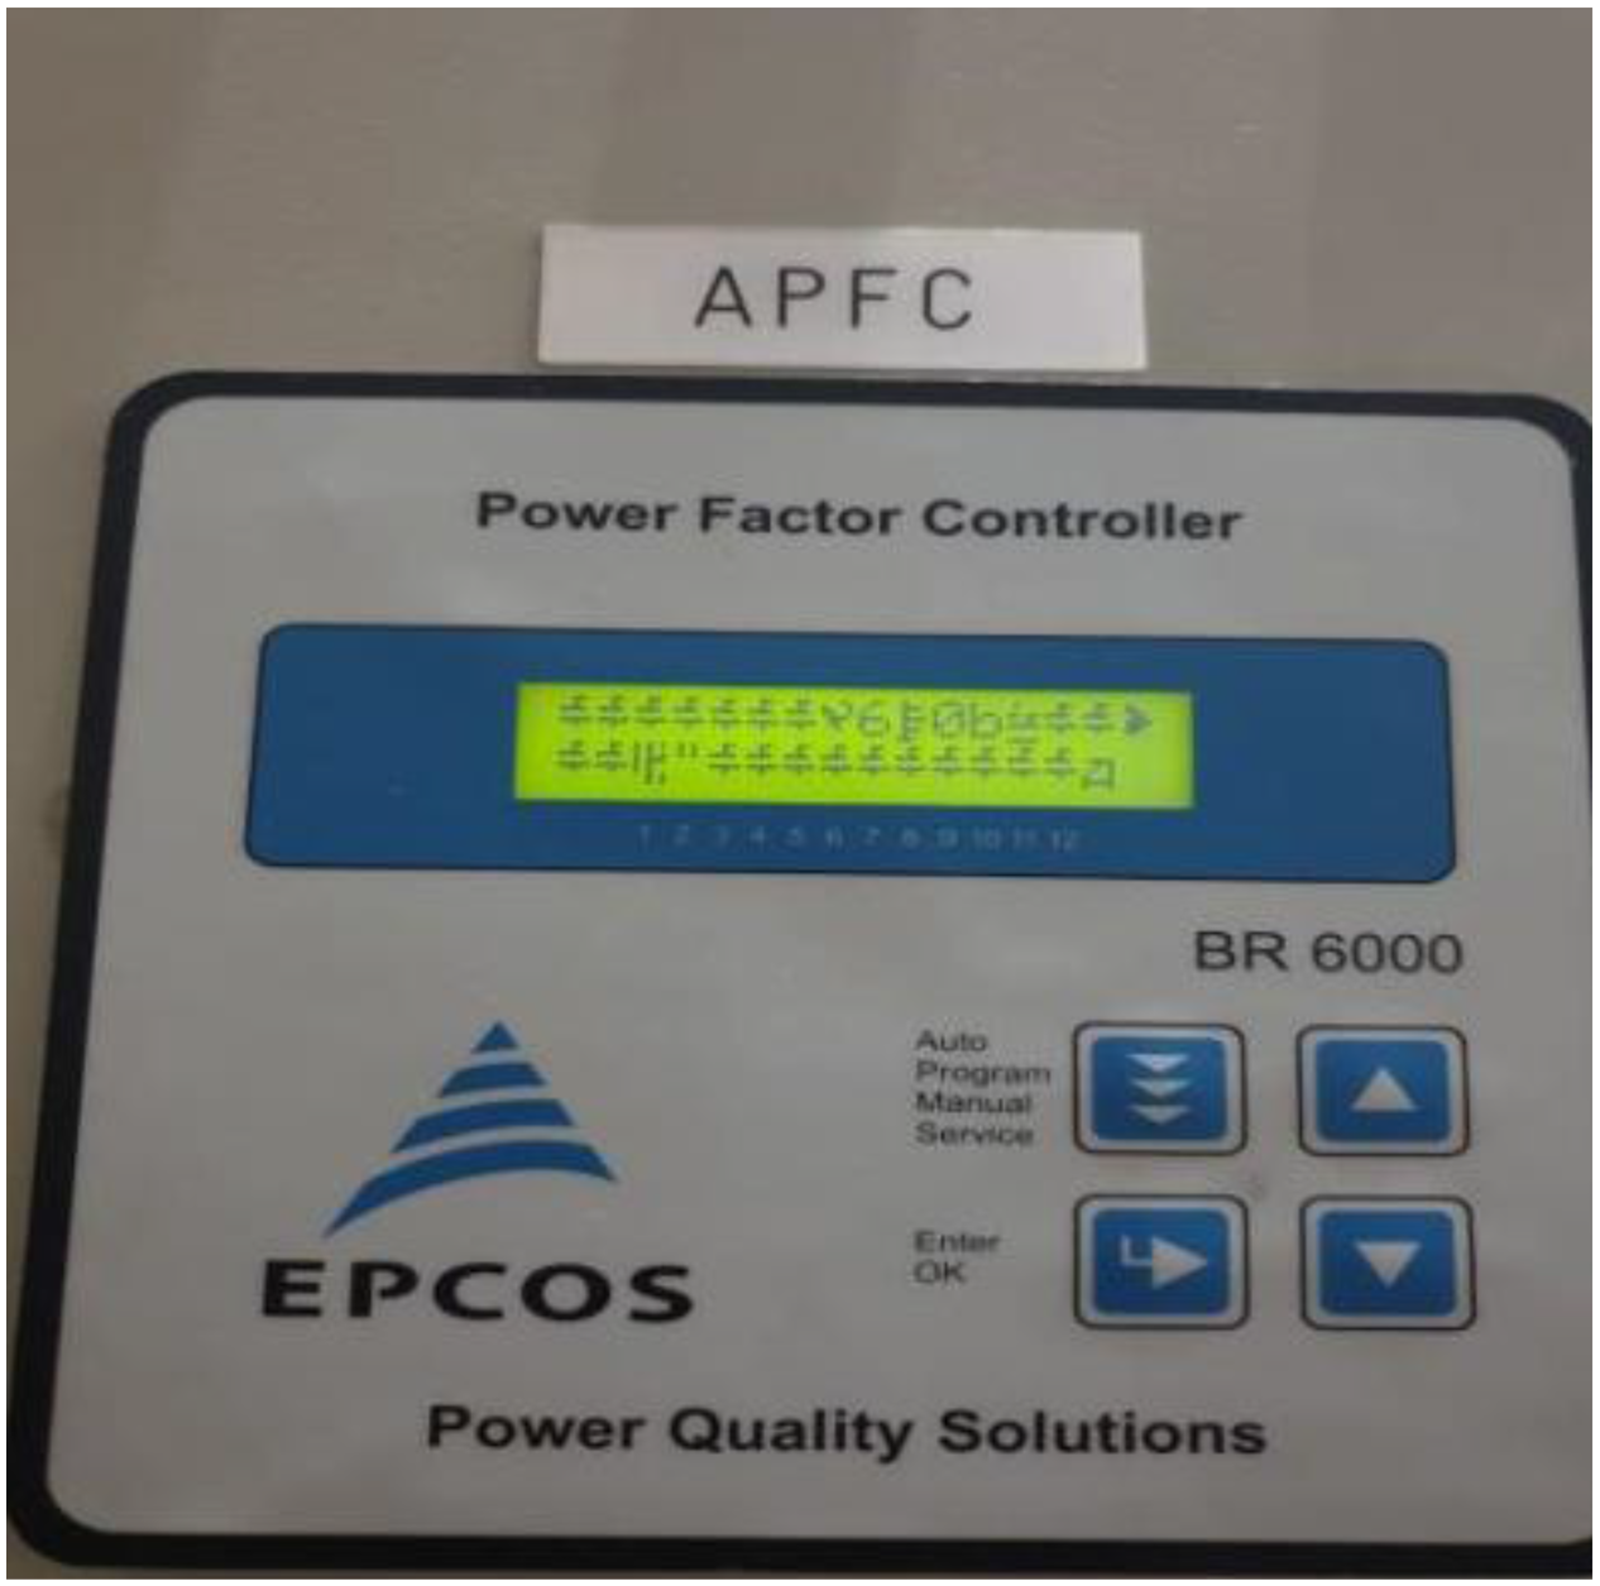
BR6000 module capacitor bank.
Data preprocessing
The implementation began with data preprocessing, including cleaning missing values, removing outliers, and normalizing variables for consistency. NaN rows or columns were dropped, and missing values were imputed using mean values where appropriate, though such imputation may introduce bias in small datasets. Feature scaling ensured uniformity across variables. Correlation analysis was then performed to identify variables significantly linked to capacitor module activation. A correlation matrix was used to visualize relationships and select key features for model prediction. This data processing was performed with pandas and NumPy library.
Model development
Random Forest is an ensemble learning algorithm developed by Breiman to deal with complicated and non-linear data and enhance the accuracy of prediction. 24 Random Forest uses ensemble learning through bagging and random feature selection. It builds multiple decision trees from bootstrapped training subsets, while out-of-bag samples are used to estimate model performance. In Random Forest, each tree is built by selecting a random subset of m predictor variables from a total of p variables (since m < p) at each node. Each split selects features based on metrics such as Gini impurity, Entropy, or Information Gain. Splitting continues until further division is not possible or the minimum node size is reached. Final predictions are obtained by aggregating all tree outputs, using majority voting for classification and averaging for regression. The performance of the Random Forest model is mainly influenced by the number of features considered at each node and the total number of trees in the forest, as shown in Figure 2.
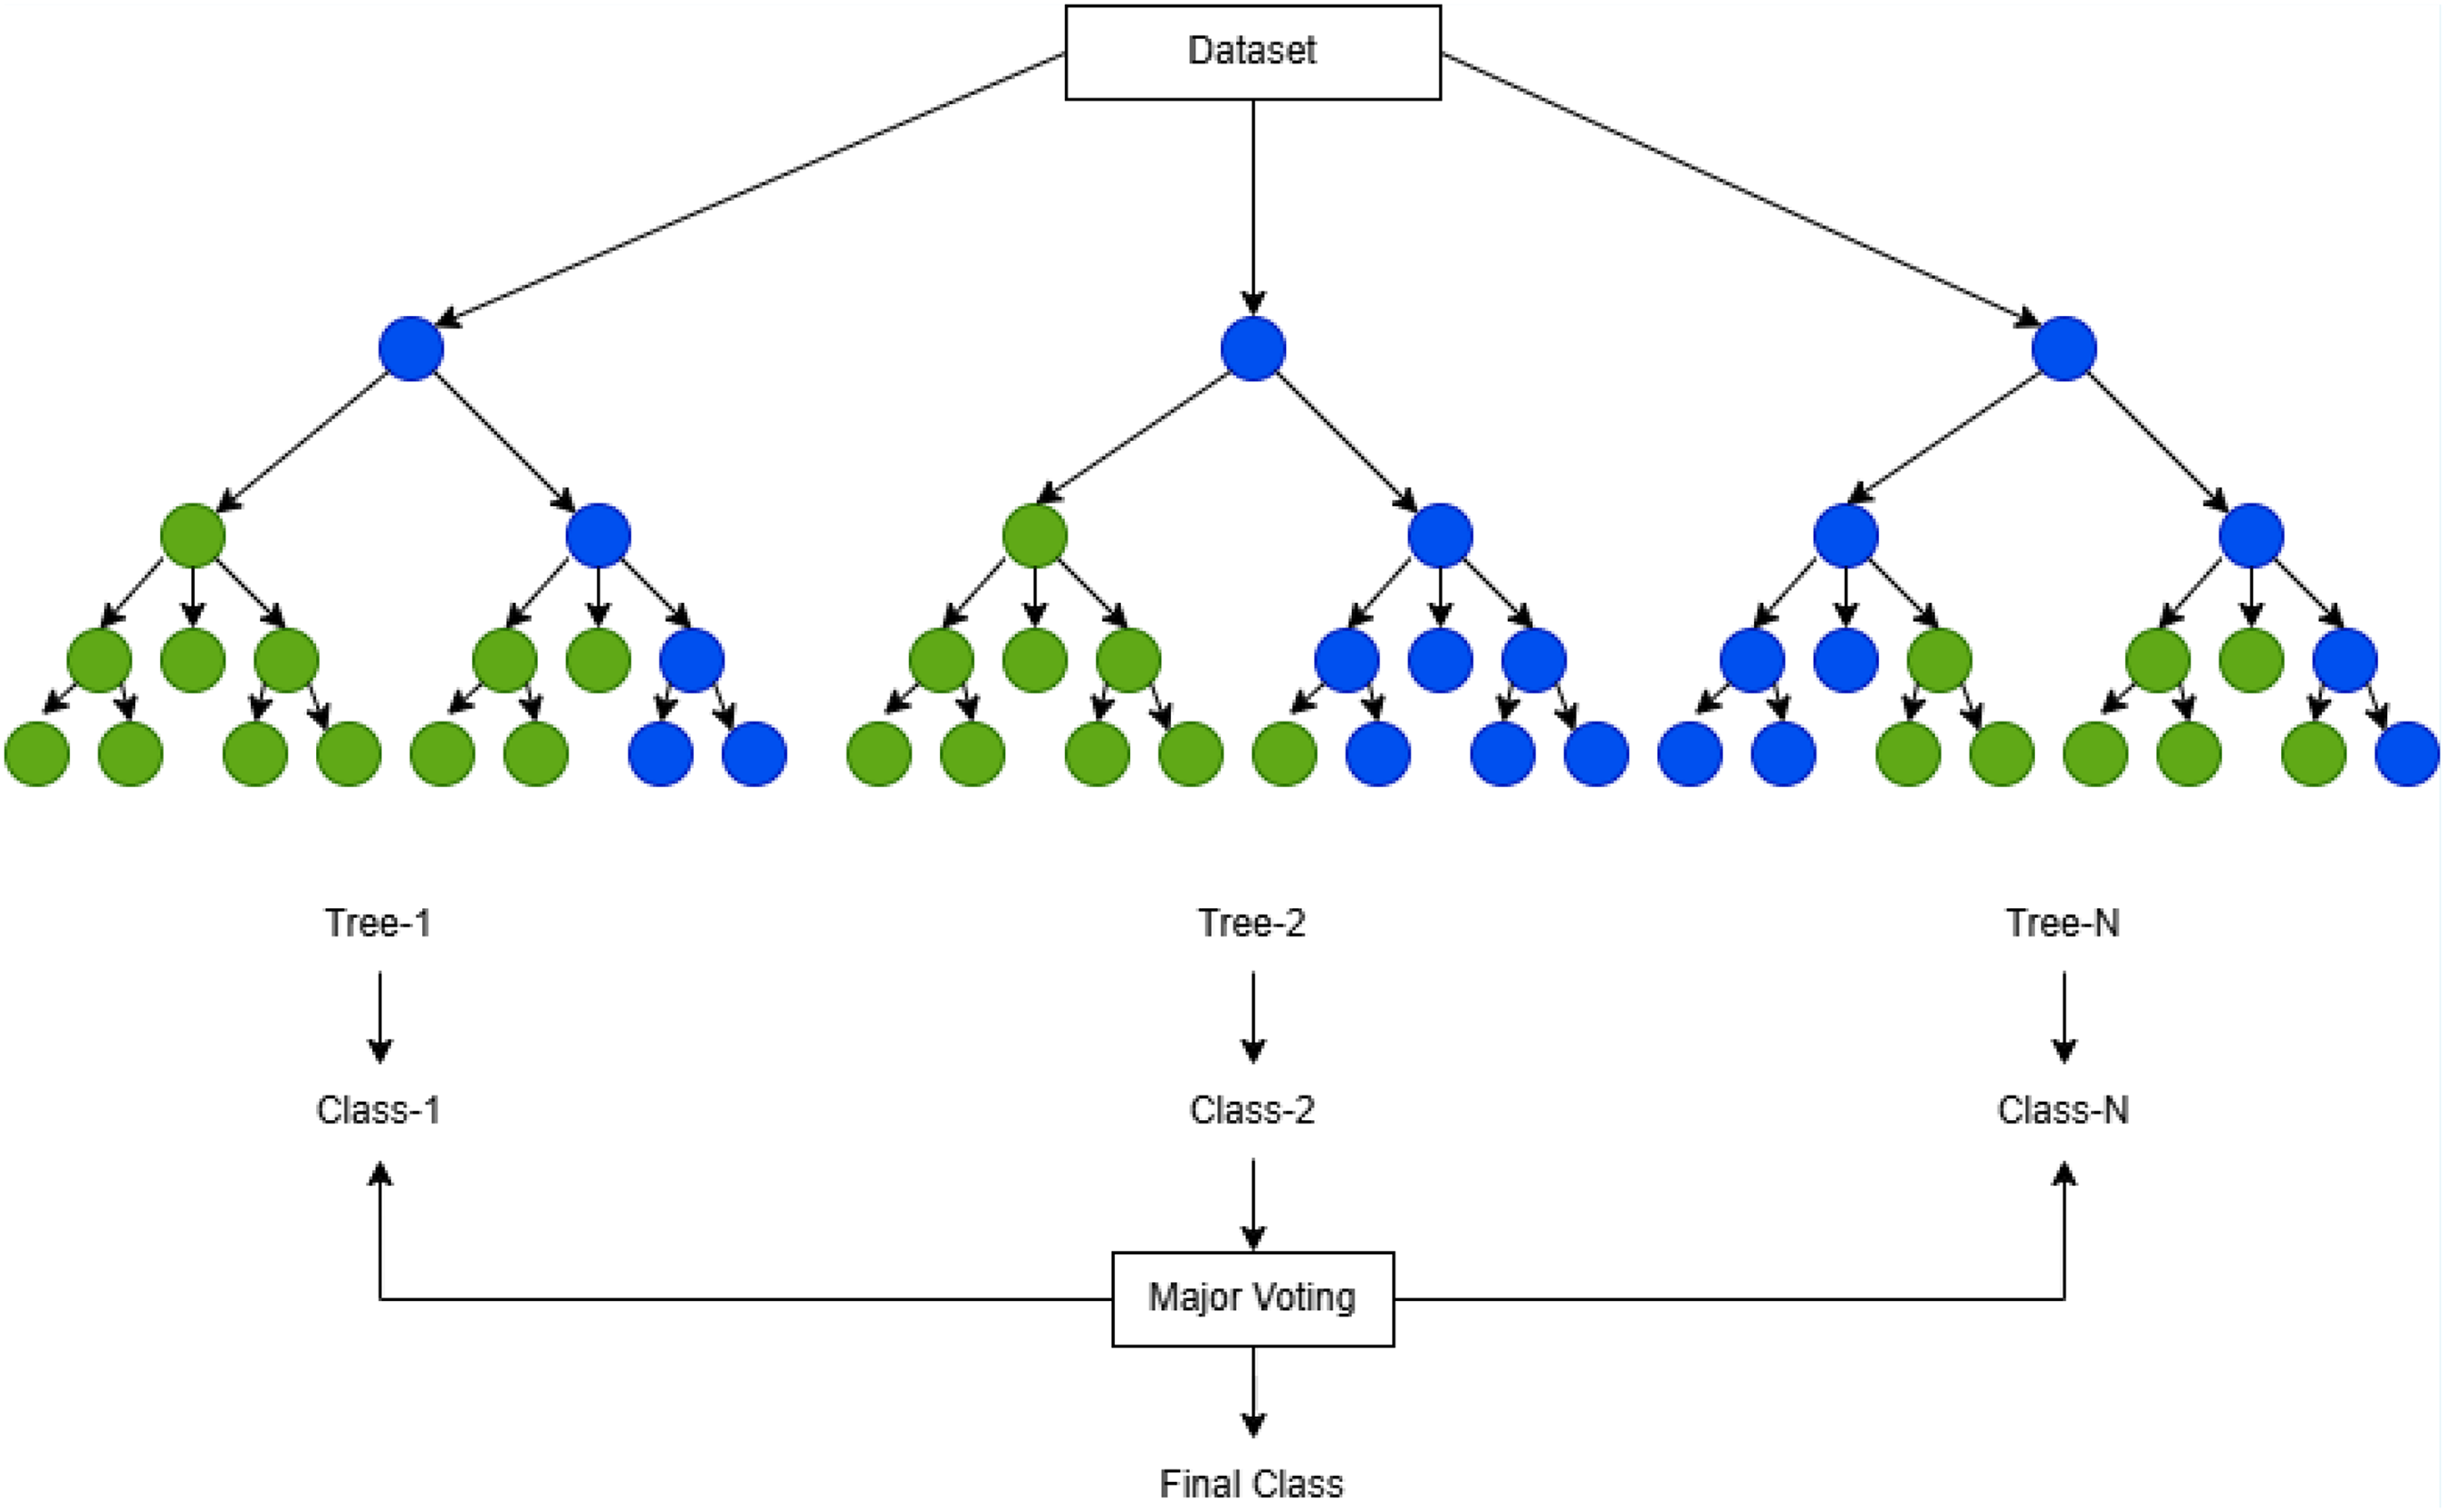
Random forest structure.
Prediction involves anticipating future outcomes based on facts and analysis, supporting rational decision-making. This study developed a model to predict the on/off status of 12 capacitor modules, using historical operational data collected from the capacitor bank system. The prediction task is performed in an offline predictive modeling framework. To address class imbalance, SMOTE was used to generate additional minority class samples from the Python imbalanced-learn library. These data were used to train and evaluate the predictive model. The dataset was divided into 80% training data and 20% testing data to assess the generalization performance of the model. During training, the Random Forest classifier learns patterns between electrical operational variables and the activation status of each capacitor module. The trained model is then evaluated on the unseen testing dataset to measure prediction metrics. Hyperparameter tuning was systematically performed using grid search. The Random Forest model was configured using the optimal hyperparameters obtained from grid search. The final model employed 100 decision trees, with a maximum depth of 10 and a minimum of two samples required to split an internal node. To address class imbalance, the SMOTE was applied with k-nearest neighbors set to 5. These configurations were selected to balance model complexity and generalization performance, particularly given the relatively limited dataset size. Model performance was evaluated using accuracy, F1-score, precision-recall curves, and log loss. The machine learning model was developed in Python using Google Colab, while the Random Forest classifier was implemented using scikit-learn. Visualization was conducted with Matplotlib and Seaborn, and the trained model was deployed in a web-based interface using Streamlit. Compared with Logistic Regression, Decision Tree Classification, and K-Nearest Neighbors Classification, the Random Forest Classifier achieved superior performance. 15 To ensure reproducibility, all experiments were conducted in a consistent Python environment.
Evaluation metrics
The model's performance was evaluated using accuracy, F1-score, and confusion matrix across all capacitor modules. Feature importance analysis revealed the most influential predictors. The dataset exhibited significant class imbalance, with far fewer active than inactive statuses, especially in modules 3‒12. To mitigate this, SMOTE was used to generate synthetic samples for the minority class, improving model balance and reducing bias, as illustrated in Figure 3. Data preprocessing involved numeric extraction, transformation, imputation, and data splitting. The Random Forest model was trained on the SMOTE-adjusted data and assessed using accuracy, F1-score, and log loss.
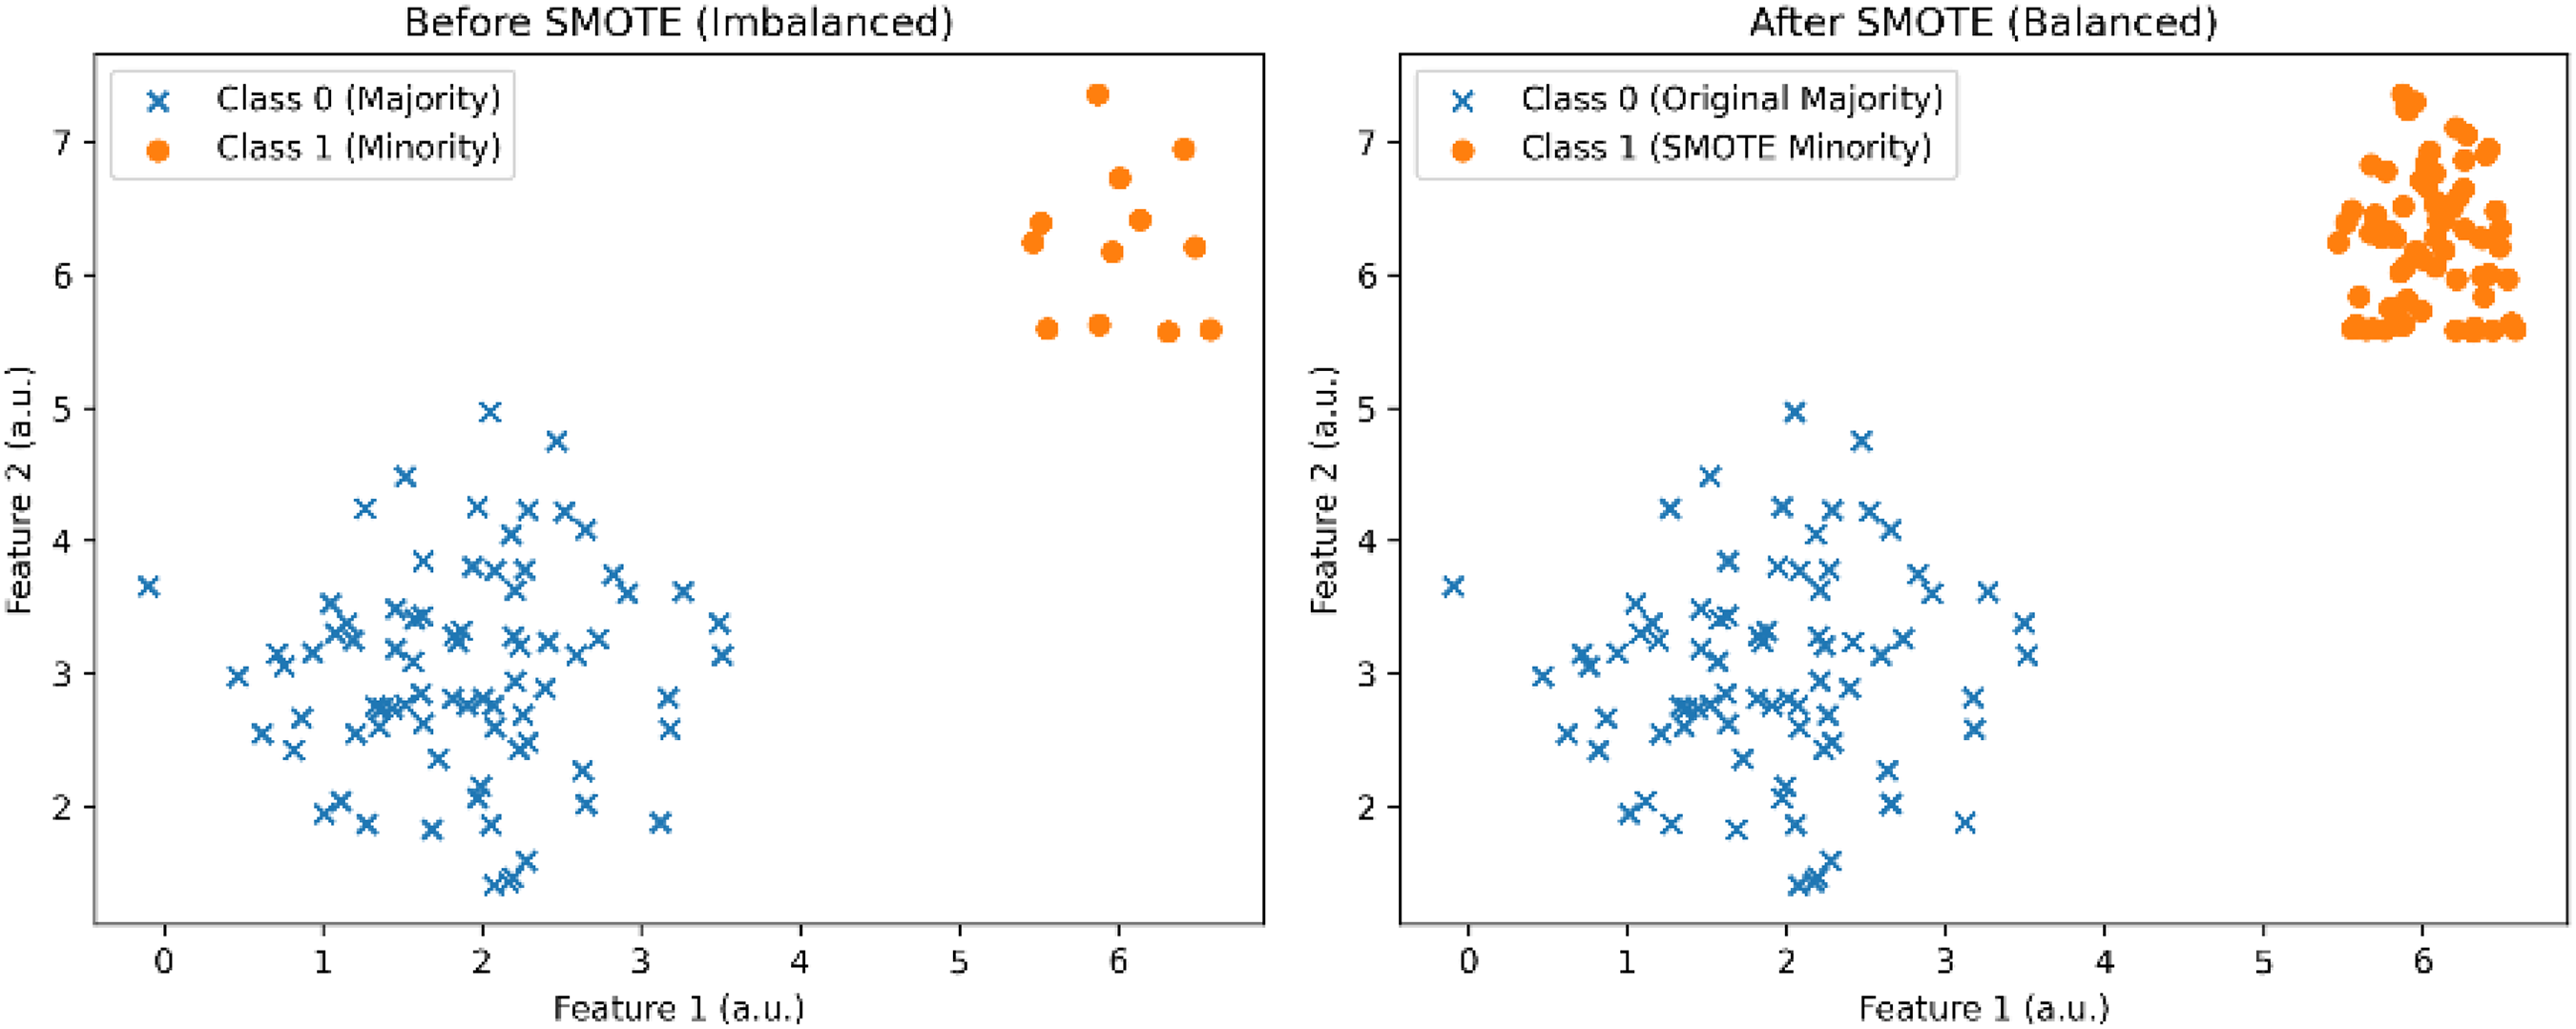
SMOTE illustration.
Accuracy (1) is the proportion of correct predictions out of all the predictions made by the model.

TP (True Positive): the model accurately predicts the positive class. TN (True Negative): the model accurately predicts the negative class. FP (False Positive): the model misclassifies a negative class as positive. FN (False Negative): the model misclassifies a positive class as negative.
Precision (2) specifies the number of correct predicted positive instances divided by all predicted positive instances.

Recall (3) specifies the number of actual positive cases well classified by the model.

In this study, the F1-score (4), the harmonic mean of Precision and Recall, is employed to balance both metrics.

Log loss is a measure of prediction error as a probability measure that charges for error more where the error is farther away from actual. The equation for log loss is as follows:

Where yi is the actual binary outcome (0 or 1) for the i-th observation. pi is the predicted probability that the i-th observation belongs to class 1.
Log loss (5) is utilized in this study to measure the performance of the model in predicting the active and inactive states of the capacitor modules, particularly under unbalanced data. Wherever the value of log loss is lower, the predictions are more precise, indicating the ability of the model to handle class imbalances. The overall workflow of the proposed predictive modeling framework is illustrated in Figure 4. The process begins with data collection and preprocessing, followed by class balancing using the SMOTE technique. The processed data are then divided into training and testing datasets to train the Random Forest model and evaluate its performance before generating capacitor module activation predictions.
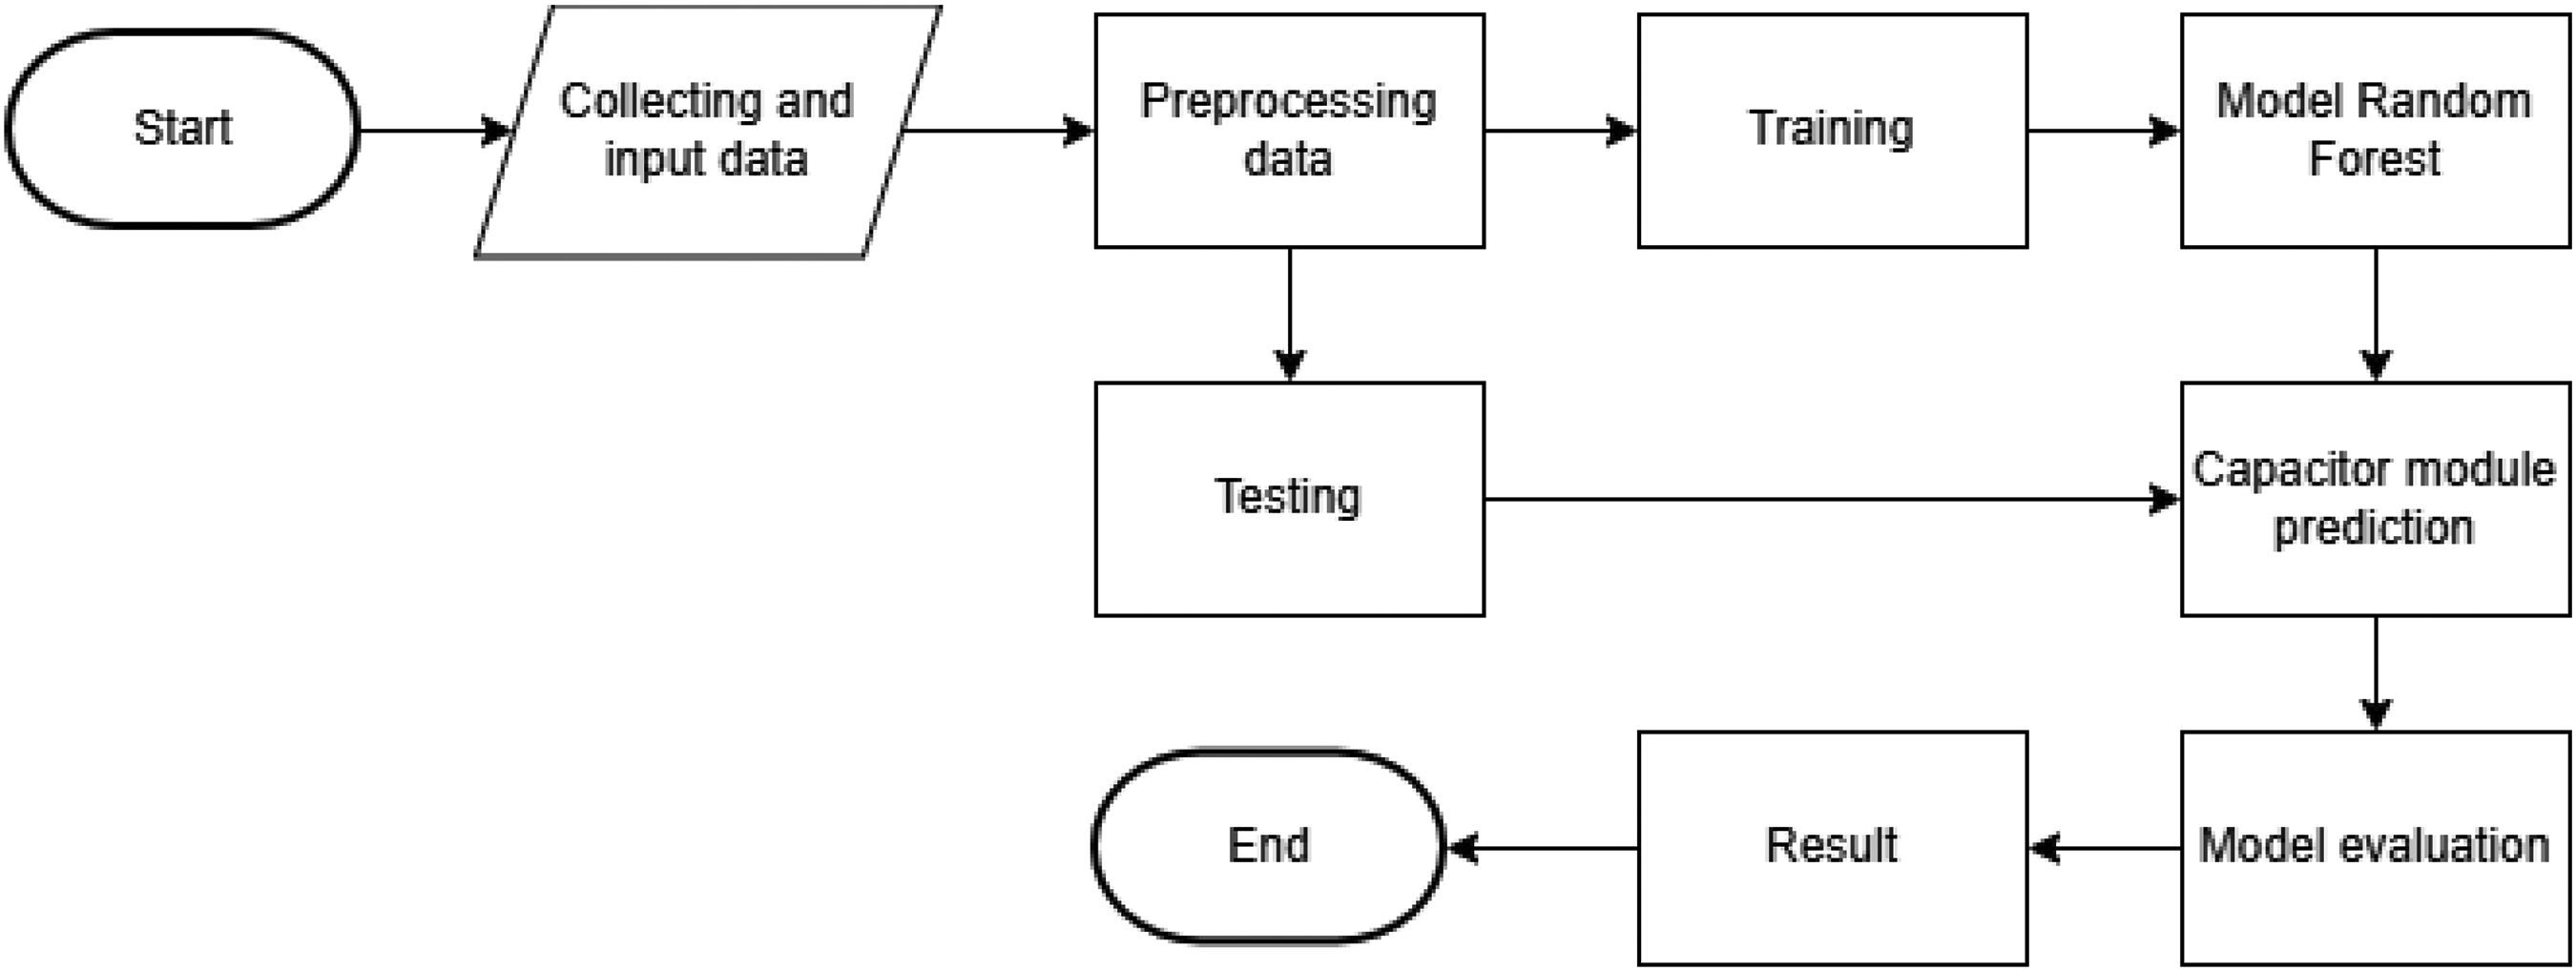
Research methodology.
Results and discussion
The results indicate a significant imbalance between active and inactive capacitor module states, as illustrated in Figure 5. The figure shows the distribution of activation status for modules 1–12, where inactive states occur much more frequently than active states. For instance, module 12 was active a mere 11 times, yet there were 170 occasions of idleness in 2023 as indicated by the BR6000 Module readout on the 500 kVAR bank of capacitors.
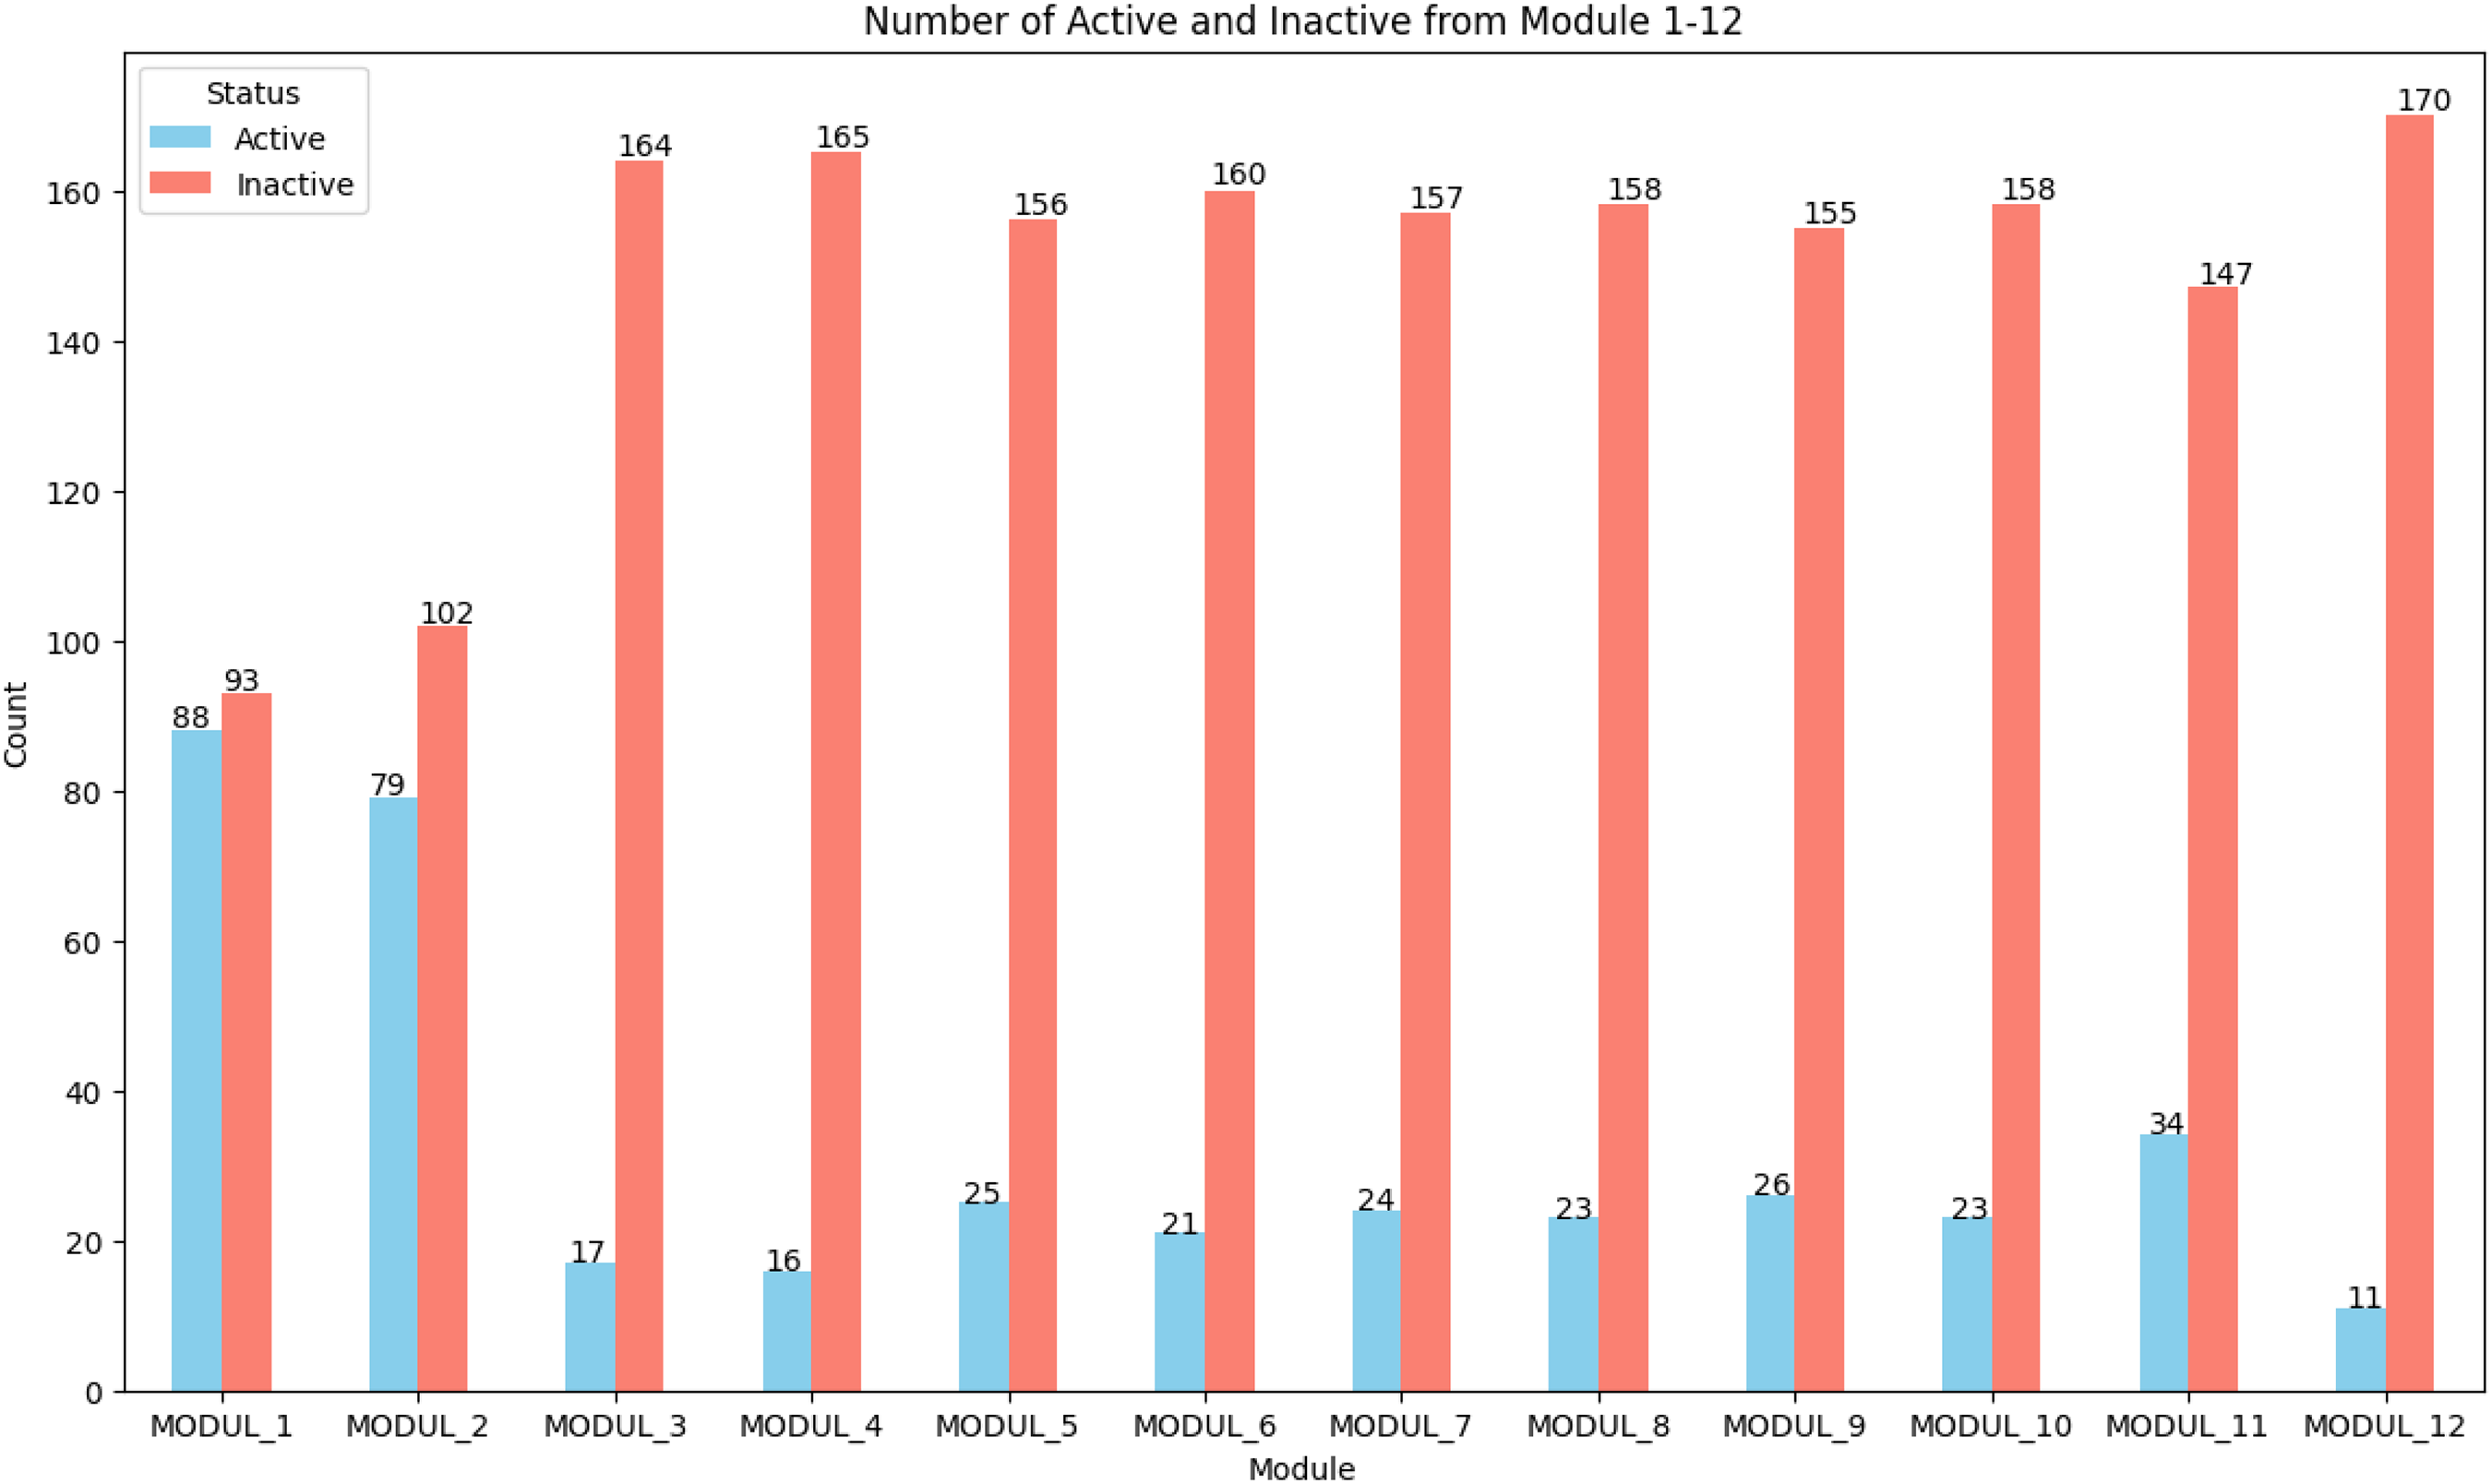
Number of active and inactive modules per module.
The graphs illustrated share a uniform pattern in most of the modules, with active status much less than inactive status. This type of class imbalance is a challenge to the modelling process, as the model tends to be biased towards more accurately predicting the majority class (inactive) and is less sensitive to the minority class (active). As a result, model failure to effectively indicate the active status would lead to a high prediction error rate. Oversampling by the SMOTE technique or majority class under-sampling should be undertaken to solve the issue. This action is intended to enhance representation of the minority class to make it easy for the model to identify and predict the active status and ultimately the overall performance and accuracy.
Statistical analysis
Descriptive statistical analysis was performed to draw inferences from the characteristics. As seen from Table 1, high variability was observed in some of the operational parameters of the capacitor modules. Apparent current and reactive power had high standard deviations of 37.06 and 12.92, respectively, which indicate high fluctuation during operation, influencing the pattern of module activation. On the other hand, power factor had a low standard deviation of 0.014, showing that the power factor is consistent with an average value always being close to 0.977. It shows the consistency of the system in being power efficient.
Statistical analysis.
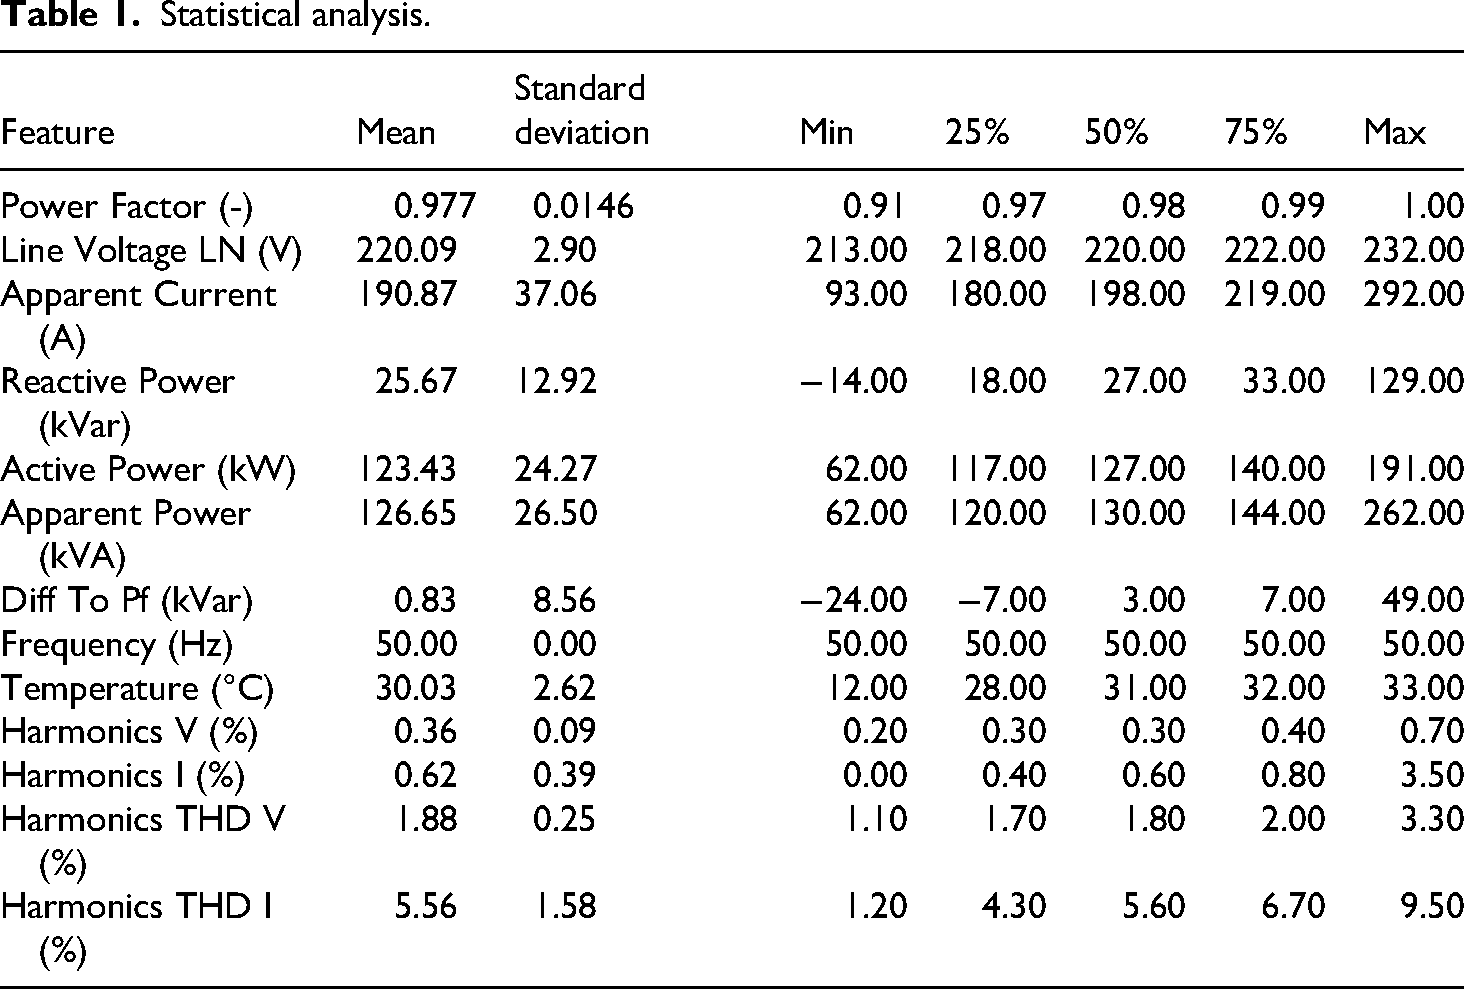
The L-N line voltage is between 213 V and 232 V, an average of 220.09 V, indicating minimal deviation and stable voltage supply. Reactive power, however, fluctuates in a broad range of −14 kVAR to 129 kVAR, averaging 25.67 kVAR. Negative values of reactive power are the symptoms of potential capacitivity states that can impact the efficiency of the system as a whole. These fluctuations in reactive power are closely related to the variable Diff To Pf which represents the difference between the measured power factor and the target power factor defined by the capacitor bank controller. This parameter indicates the deviation that must be corrected through reactive power compensation. Larger values of Diff To Pf occur when the system operates under highly inductive load conditions, such as during increased motor or chiller operation, which temporarily lowers the power factor. In response, the capacitor bank controller activates additional capacitor modules to supply reactive power and restore the desired power factor. The maximum observed Diff To Pf value of 49 reflects periods of significant deviation between the actual and target power factor, typically during peak load operation, particularly when large inductive loads such as chillers are simultaneously operating. The total harmonic distortion (THD) of current also reaches 9.5%, which reflects serious distortion of harmonics during certain operating modes. The apparent power and active power data distribution has a median close to the mean, meaning there is no skewness in the data distribution. The operating environment temperature, however, is fairly uniform with an average of 30.03°C and a variation of 12°C to 33°C, representing effective temperature control within the system. Although harmonic voltage and harmonic current display extremely low variability, they might still have an impact on some of the harmonic distortion-sensitive modules to a significant degree.
Correlation analysis
The correlation analysis in Figure 6 reveals linear relationships among operational variables influencing capacitor module activation. A moderate negative correlation of −0.41 between power factor and apparent current suggests that higher current levels are generally associated with reduced power factor, reflecting decreased power system efficiency. A strong positive correlation of 0.84 between apparent current and active power confirms that increases in current align with increases in active power, indicating close interaction in power distribution. Similarly, the 0.76 correlation between apparent current and apparent power underscores their direct relationship within the electrical system. Additionally, a moderate positive correlation of 0.55 between reactive power and the difference to power factor indicates that greater reactive power contributes to increased deviation from the desired power factor. This highlights the importance of reactive power regulation for system stability. It is also noted that the frequency variable yields non-numeric (NaN) results across correlation tests, as its value remains constant at 50 throughout the dataset, preventing any statistical variation or meaningful correlation with other variables.
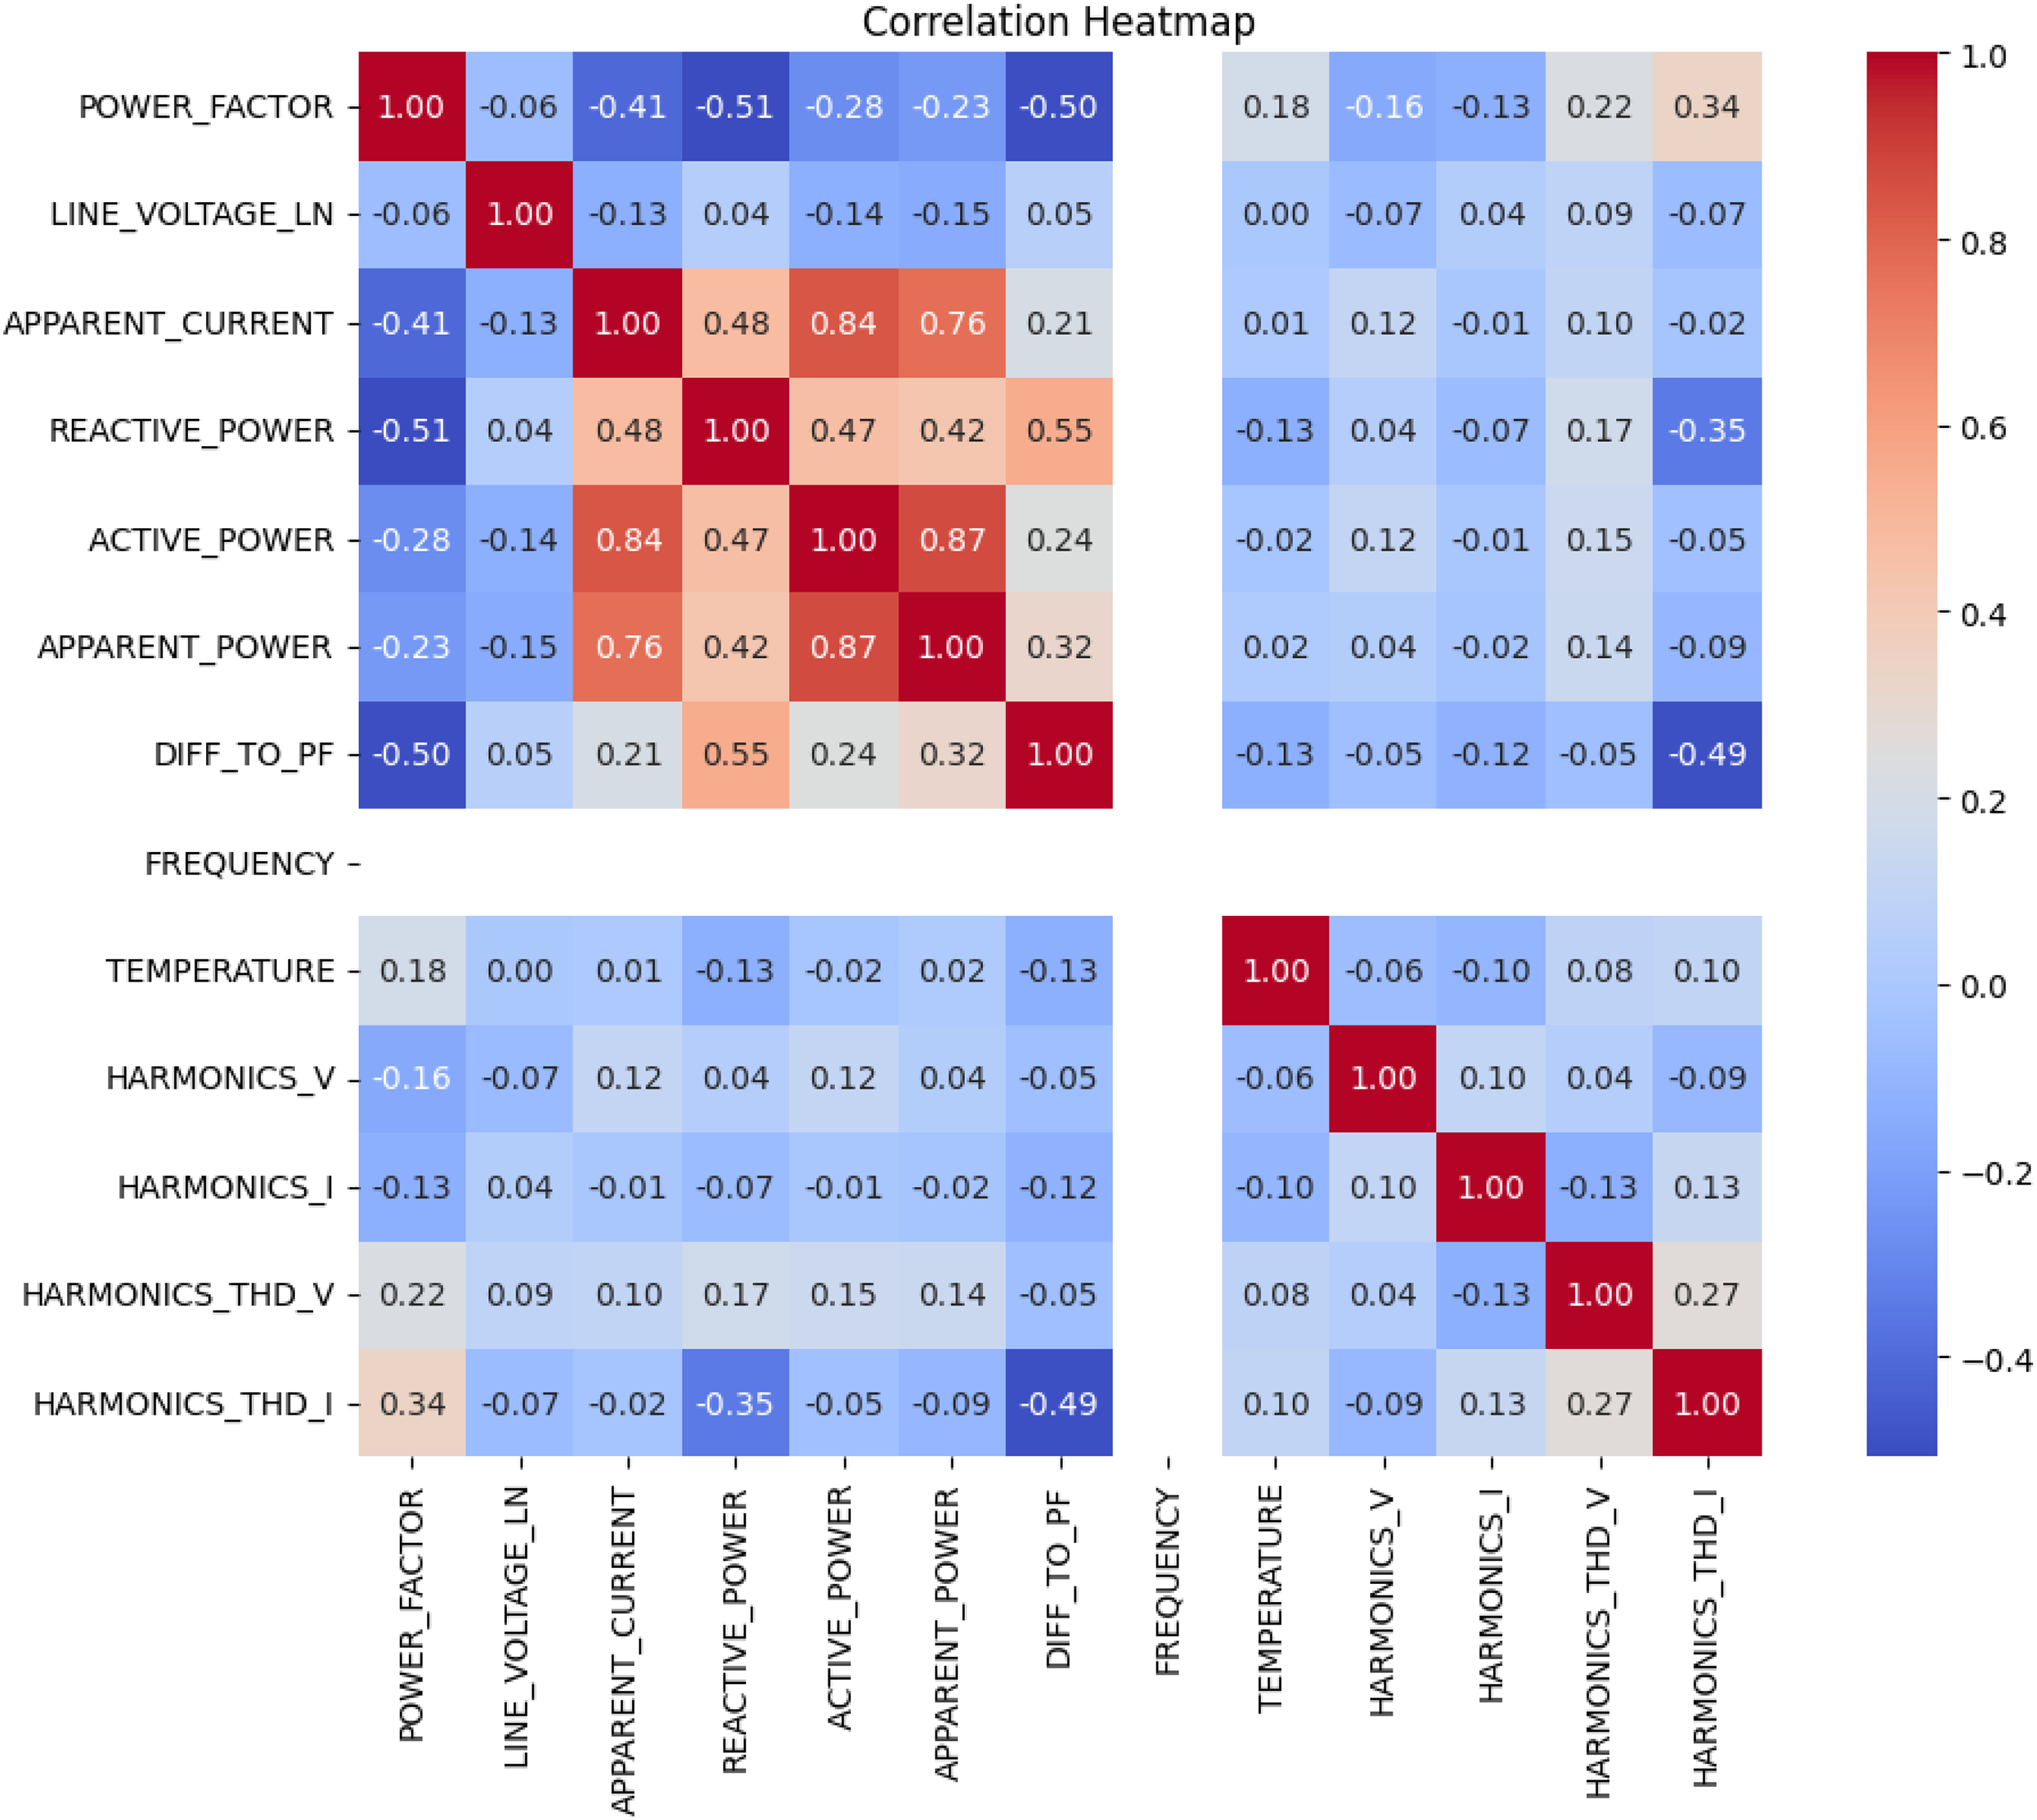
Correlation heatmap of features.
Model performance
The Random Forest model demonstrates strong predictive performance across all 12 capacitor modules. During training, the log loss value of 0.0942 indicates a high degree of alignment between the predicted probabilities and actual outcomes, with minimal prediction error. In the context of binary classification, this suggests that the model effectively distinguishes between active and inactive statuses, despite the imbalance in class distribution. These results confirm the model's ability to accurately predict activation status while maintaining sensitivity to the minority class, which represents the less frequent active state. Overall, model accuracy ranges from 78% to 96%, as presented in Table 2.
Performance of the random forest model with SMOTE for each capacitor module.
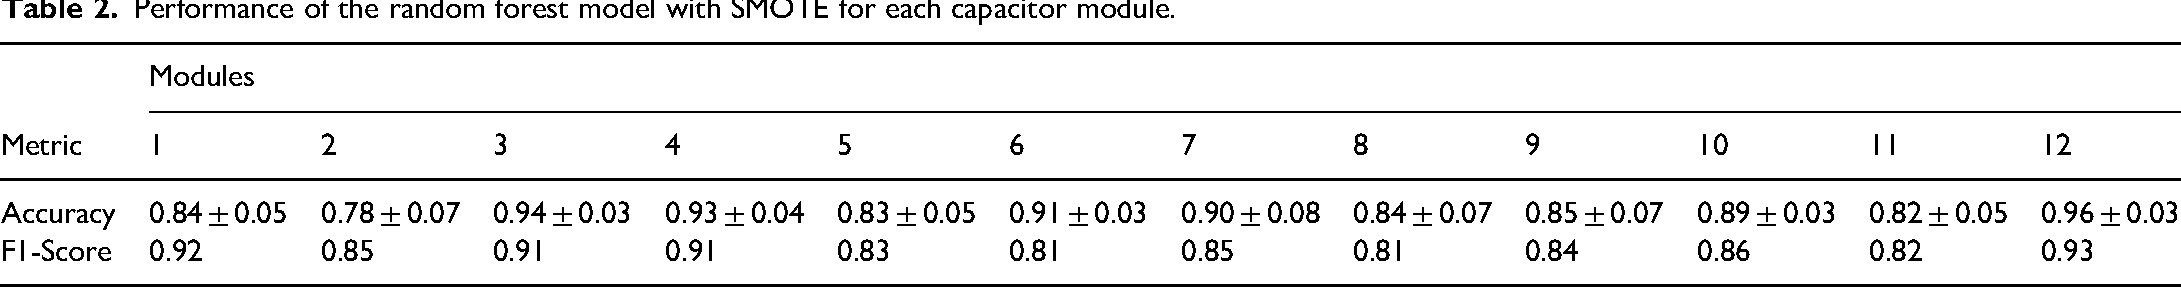
As shown in Table 2, the best accuracy is module 12 at 96% ± 3%, while the worst accuracy is module 2 at 78% ± 7%. The majority of modules have accuracy above 80%, indicating that the model has a tendency to predict accurately in general. Modules 3, 4, 6, 7, 10, and 12 achieved accuracy above 90% with low standard deviations, indicating stable and consistent model performance. This stability likely results from clearer data patterns or more relevant predictive features. The F1-score, as the harmonic mean of precision and recall, further confirms the model's effectiveness in balancing true positive detection and minimizing false classifications across these modules. Modules with higher classification accuracy, specifically Modules 3, 4, 6, 7, 10, and 12, also exhibit strong F1-scores, ranging from 0.81 to 0.93. These results indicate not only a high proportion of correct predictions but also a well-balanced trade-off between identifying true positives and minimizing false positives. Conversely, Modules 2, 5, and 11 demonstrate comparatively lower F1-scores, despite reasonable performance, suggesting greater variability and less reliable classification outcomes. For example, Module 2 recorded an F1-score of 0.85, accompanied by higher fluctuations in prediction accuracy.
The presence of elevated standard deviations in accuracy for Modules 2, 7, 8, and 9 further reflects prediction uncertainty, potentially due to class imbalance, data complexity, or suboptimal feature representation. In contrast, Modules 3, 6, 10, and 12 show both low variability and consistent predictive performance. These findings underscore the necessity of evaluating both accuracy and F1-score to gain a more robust understanding of model performance, particularly in imbalanced classification contexts.
Overall, the model is more accurate in class 0 compared to class 1. Therefore, as in Figure 7 for web deployment, the model under SMOTE was used, as it yields more balanced and accurate prediction results for both classes. This way, both the majority and minority classes are represented well in the model's predictions.
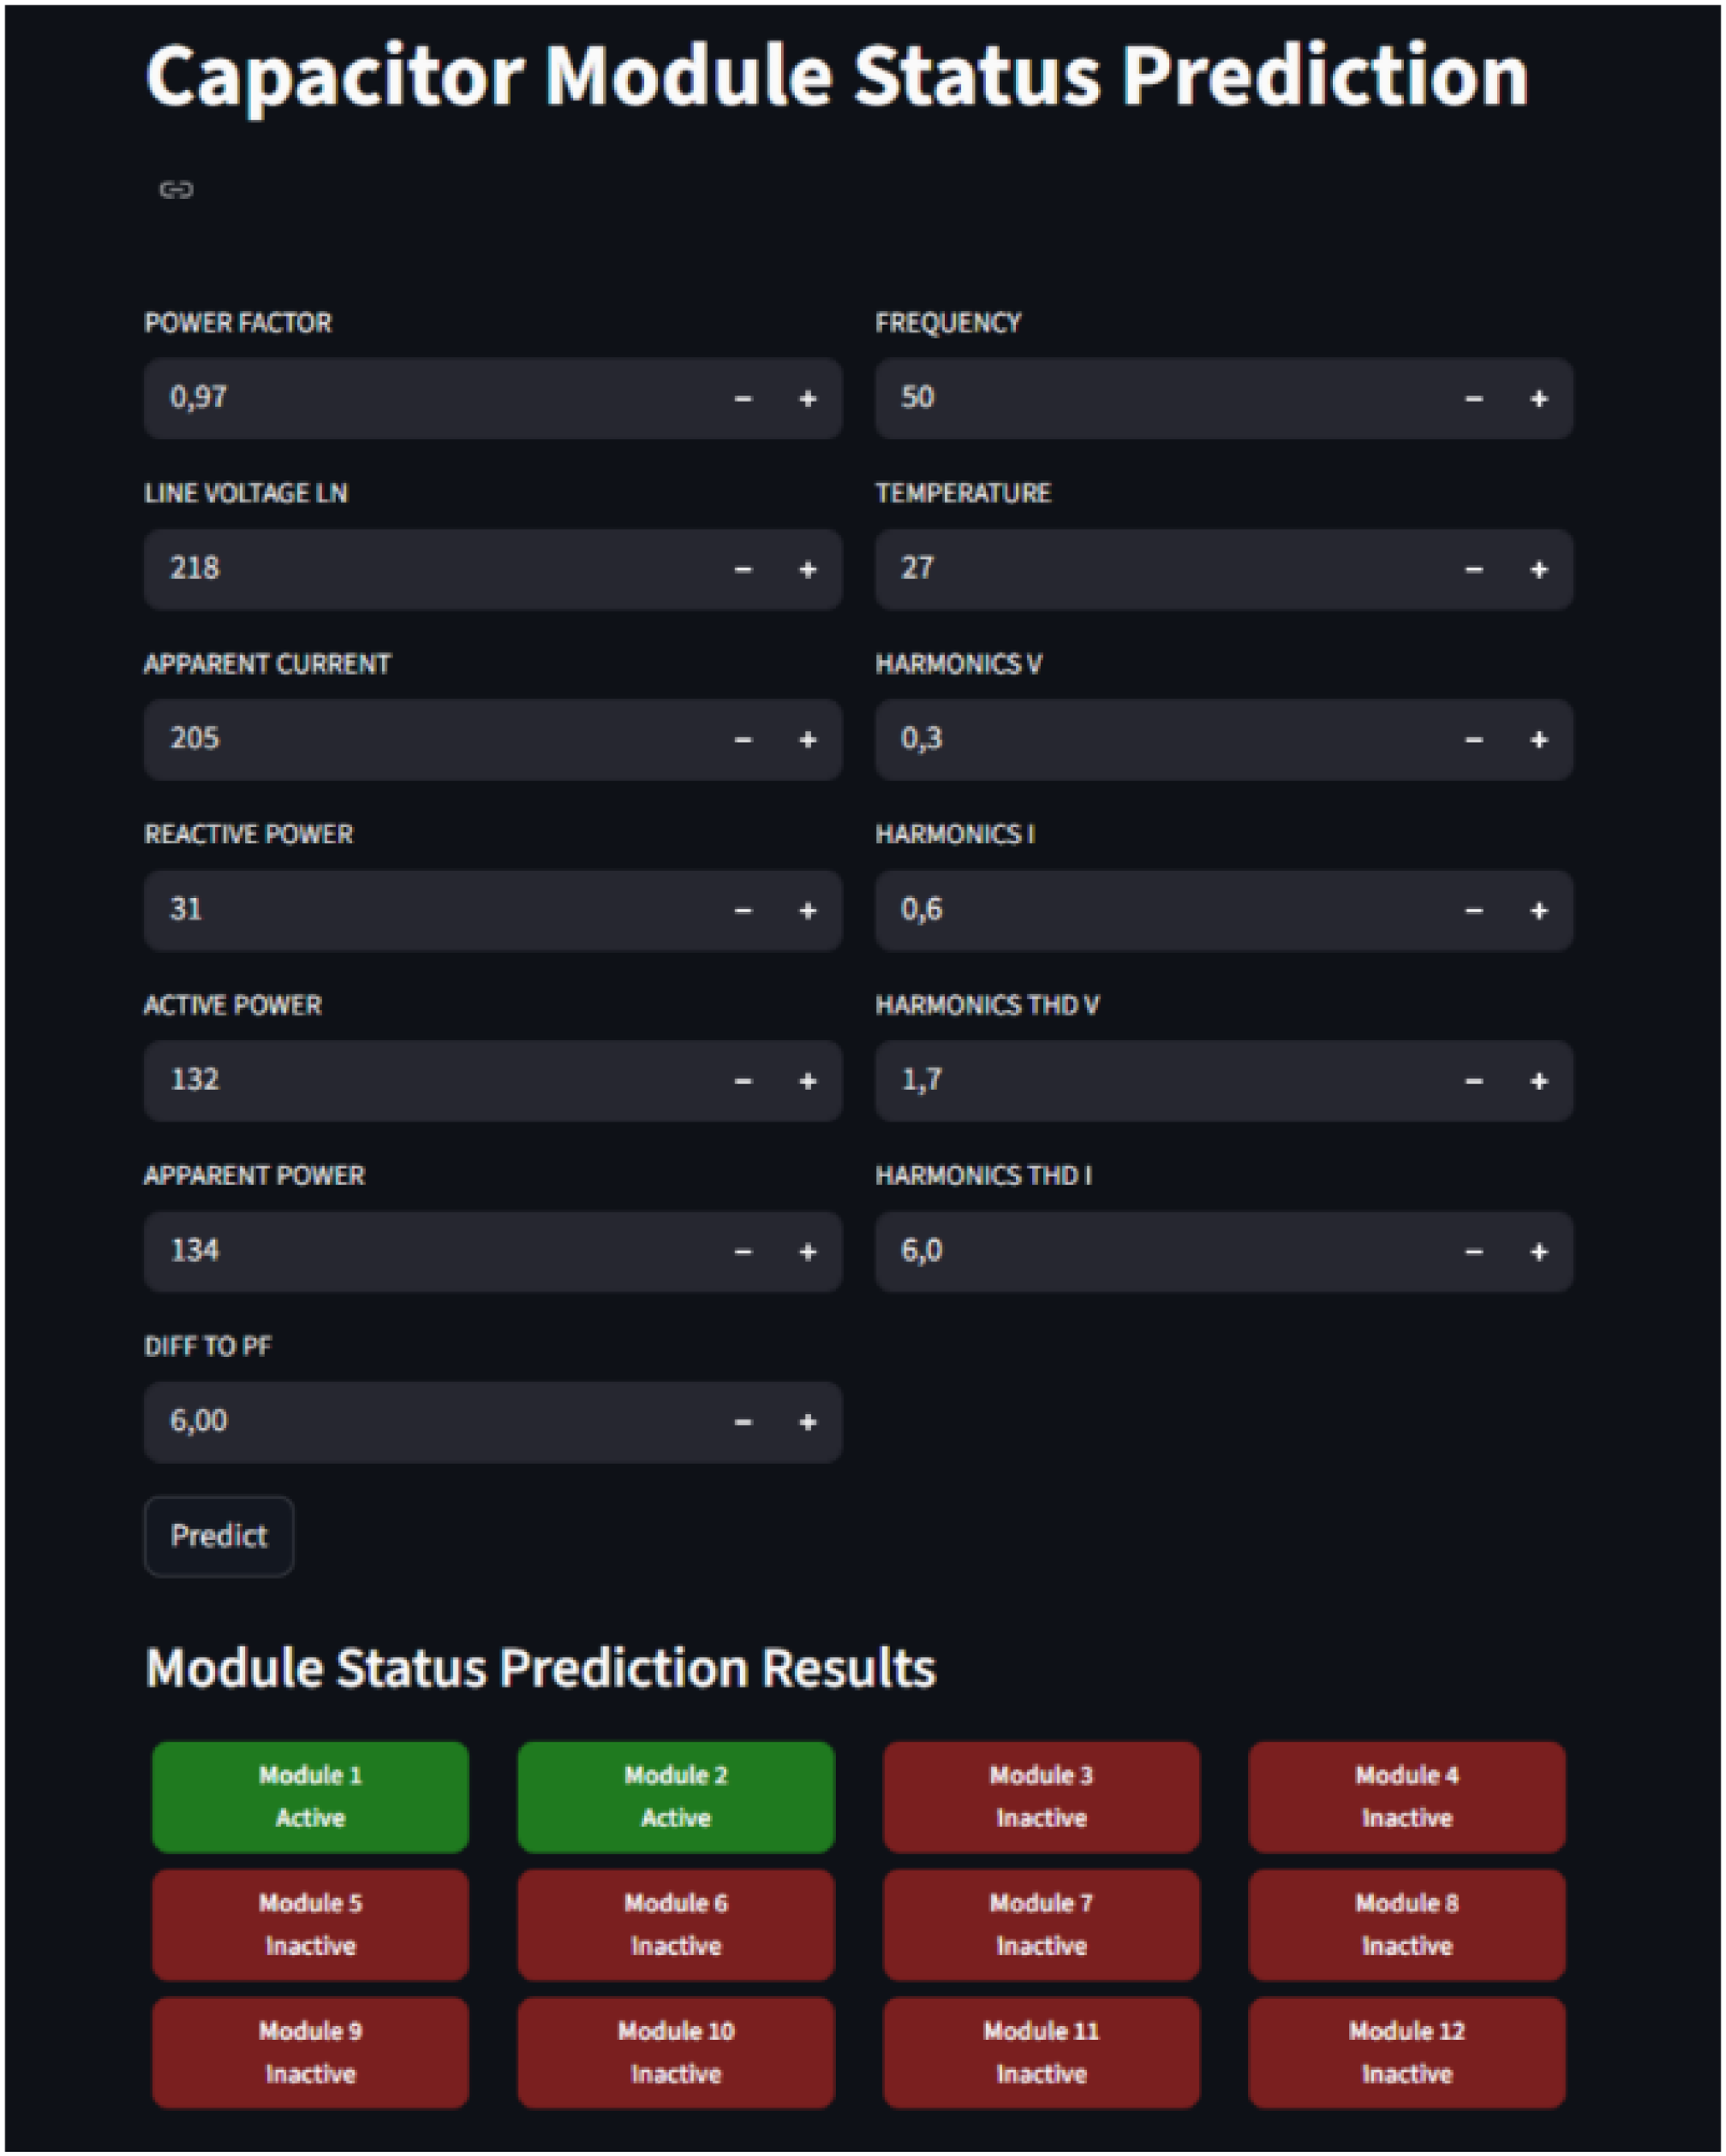
Prediction in web app Streamlit.
Value analysis
The results of this study confirm that the Random Forest algorithm is capable of accurately predicting the activation status of capacitor modules in a 500 kVAR capacitor bank. The feature importance analysis presented in Figure 8 demonstrates that each module contributes individually to improving system efficiency and stability. The activation of capacitor modules plays an important role in maintaining power quality and operational performance. When inductive loads increase, the power factor decreases due to higher reactive power demand. The capacitor bank compensates by activating appropriate modules to inject reactive power into the system, which reduces current flow, minimizes power losses, and stabilizes voltage levels. Through this coordinated activation, the system effectively regulates reactive power, power factor, harmonics, and voltage, to maintain reliable operation.
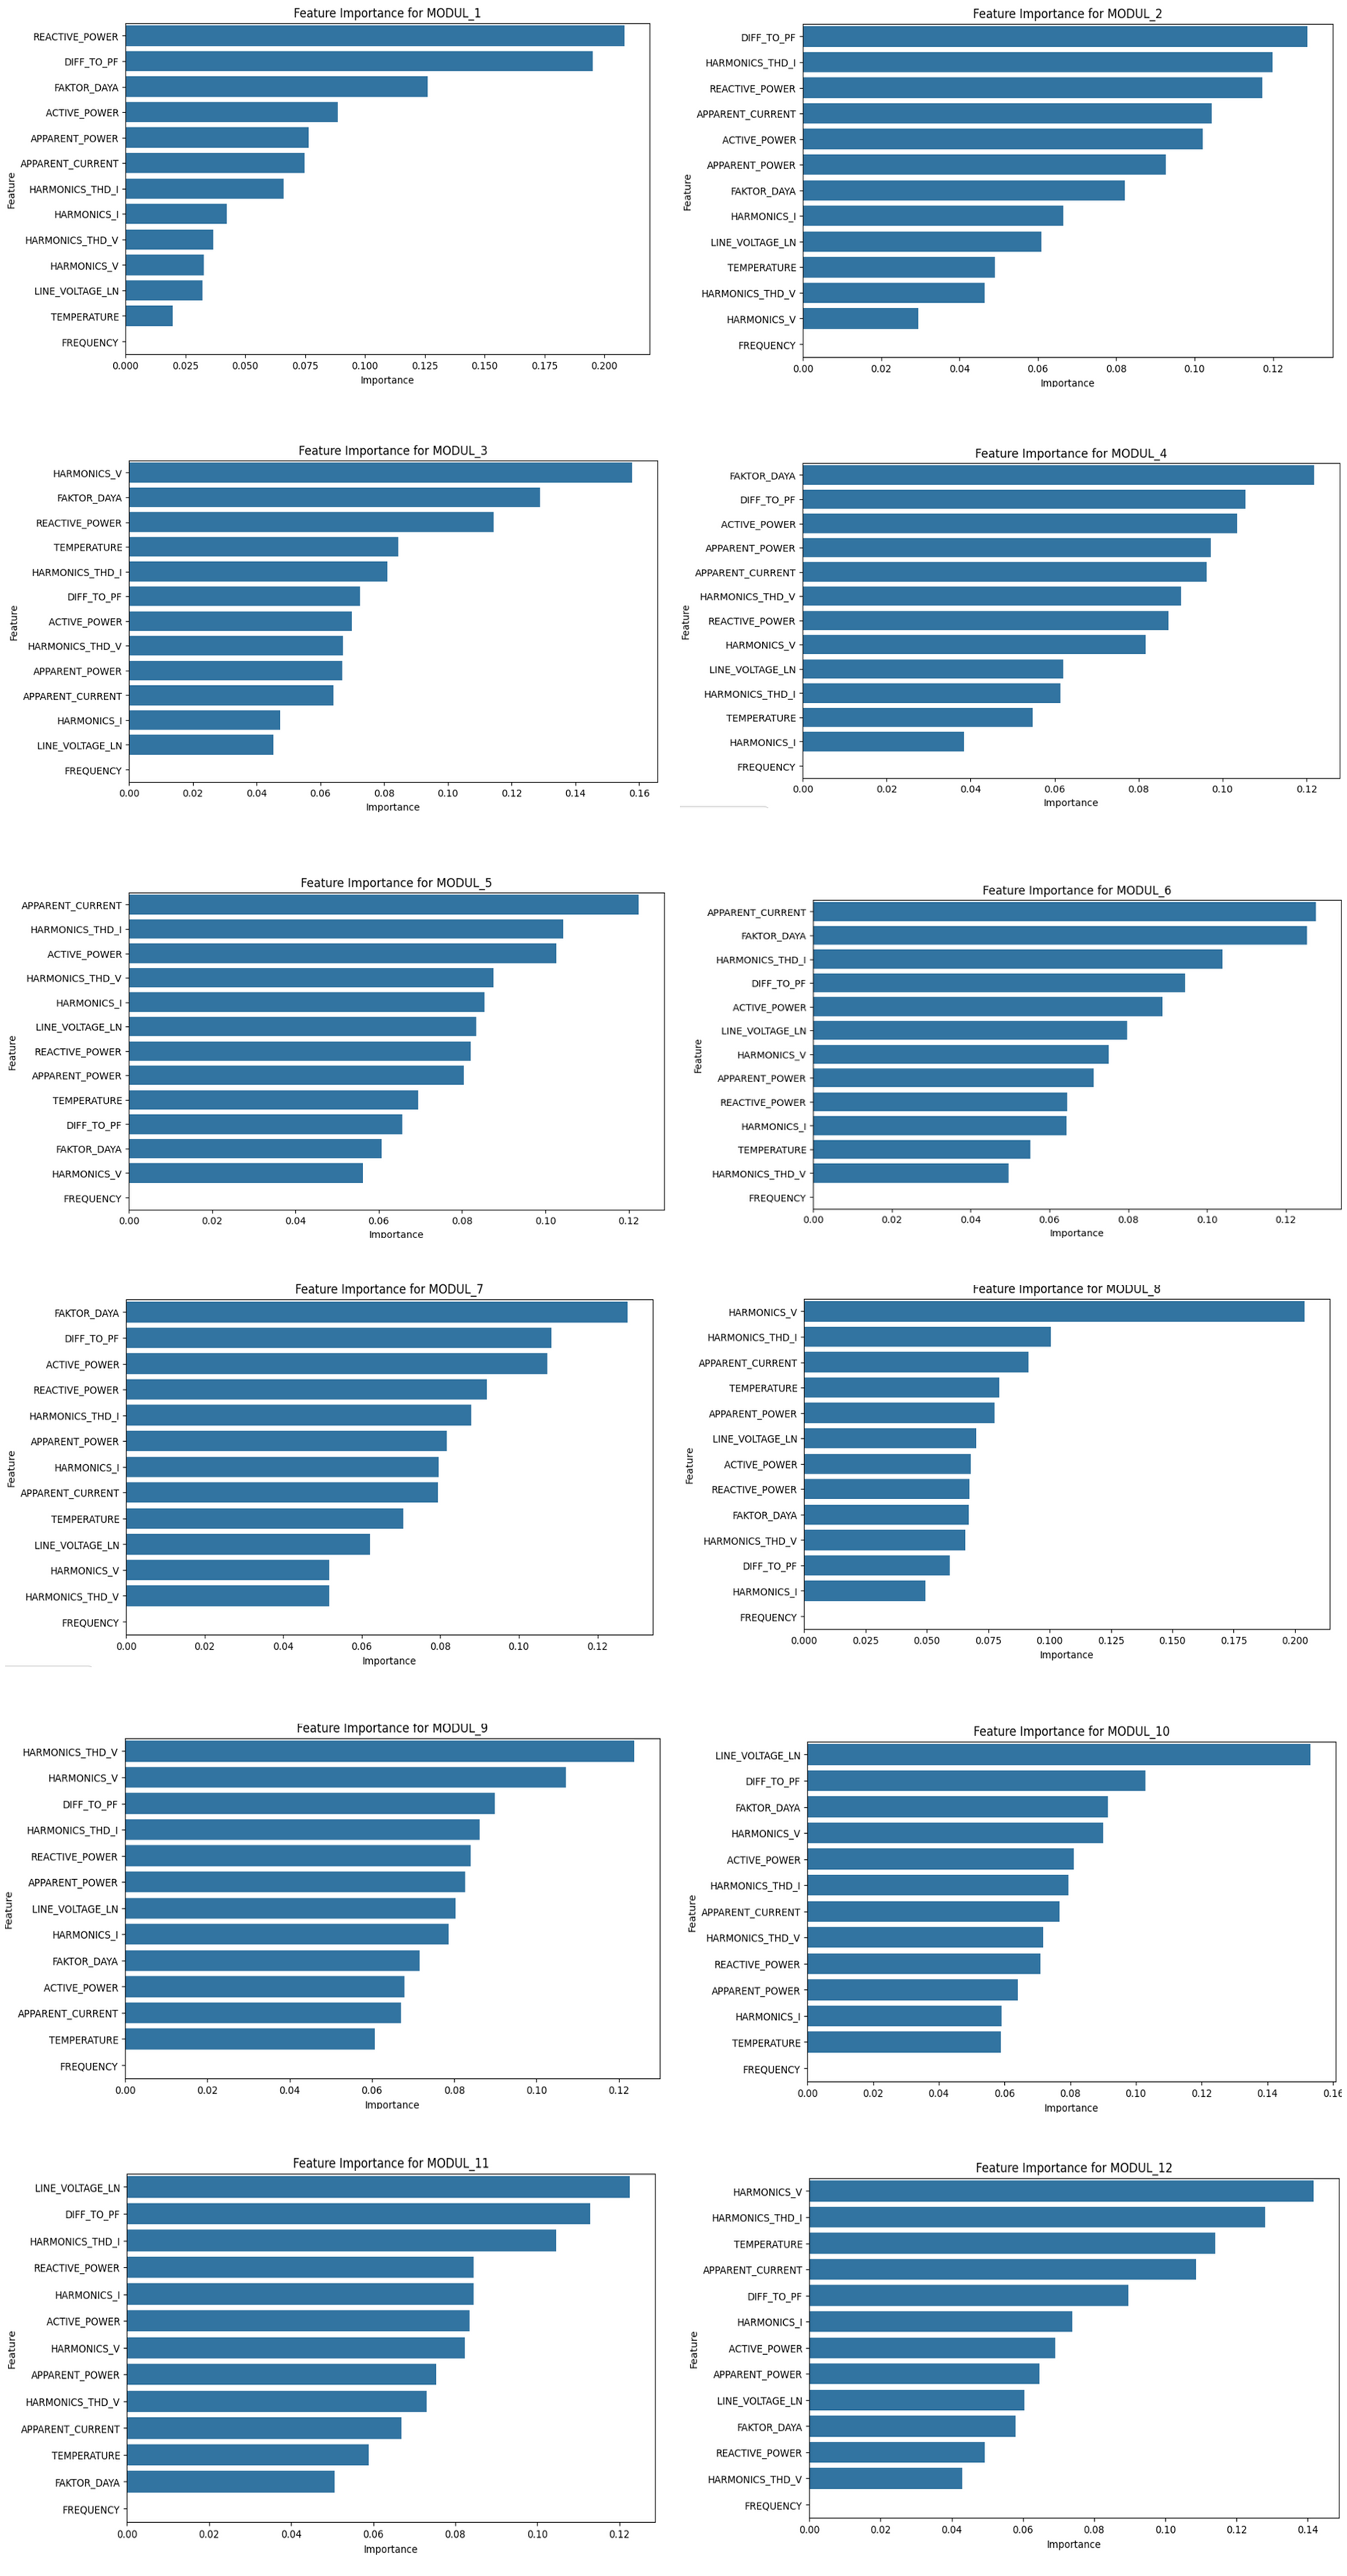
Feature importance graph of capacitors 1–12.
Each capacitor module responds to distinct electrical variables. Module 1 is driven by reactive power, helping stabilize the system under inductive loads. Module 2 is influenced by the difference between desired and actual power factor, aiming to improve efficiency. Modules 3, 8, and 12 monitor voltage harmonics to maintain power quality. Modules 4 and 7 respond to power factor levels, reducing reactive power to enhance efficiency. Apparent current is key for modules 5 and 6, which manage system current and prevent overloading. Module 9 is sensitive to THD, ensuring harmonic levels remain within limits. Modules 10 and 11 rely on line-to-neutral voltage to maintain stable and safe operating conditions.
Even though the capacitor modules have similar electrical ratings, their activation patterns may vary due to the control strategy of the BR6000 controller, which switches modules sequentially based on real-time measurements such as power factor, voltage, current, and harmonic distortion. Consequently, certain modules may respond more strongly to specific electrical variables depending on their switching order and operating conditions. The high model accuracy indicates the reliability of the monitoring data, confirming its suitability for predictive analysis in capacitor bank operation.
Although this study focuses on a single 500 kVAR capacitor bank at RWMI, the proposed modeling approach can be adapted to other capacitor bank systems because it uses commonly monitored electrical parameters. However, differences in system configuration and operating conditions may require retraining the model using site-specific data, and future studies should evaluate its scalability across multiple installations.
Conclusion
This study presents a novel application of the Random Forest algorithm enhanced with SMOTE to predict the activation status of 12 capacitor modules in a 500 kVAR capacitor bank at the Radioactive Waste Management Installation (RWMI). It addresses two main challenges in current research: handling highly imbalanced operational data and applying predictive modeling in an industrial environment. Using a full year of operational data, the model achieved prediction accuracies ranging from 78% to 96%, with balanced precision and recall for several modules. The use of SMOTE successfully addressed class imbalance by generating synthetic samples for underrepresented classes, enhancing model performance. Modules 3, 4, 6, 7, 10, and 12 showed strong performance, while modules 2, 5, and 11 had lower F1-scores, suggesting the need for additional data or improved feature selection. A low log loss value of 0.0942 confirmed the model's reliability in probabilistic prediction.
The most influential variables included reactive power, power factor, harmonic distortion, and line-to-neutral voltage. The proposed model operates within an offline predictive modeling framework using historical operational data and provides prediction results. The ability to predict the activation status of individual capacitor modules also provides practical benefits for system operation. Predictive information allows operators to anticipate reactive power compensation needs, identify modules with excessive switching cycles for preventive maintenance, and optimize capacitor switching strategies through intelligent energy management systems. These capabilities improve system efficiency, extend equipment lifespan, and are particularly valuable in critical infrastructure, such as radioactive waste management facilities, where reliable power system operation is essential for safety and operational continuity. A key outcome is the deployment of the trained model in a user-friendly web application that supports monitoring and decision-making. This tool helps prevent overuse or underuse of modules and improves equipment lifespan.
Future work should consider expanding the dataset and applying advanced feature engineering. In practical deployment, the model can be periodically retrained using newly collected operational data to adapt to changes in load patterns, equipment aging, or operational conditions. Further integration with deep learning approaches may also improve the model's capacity for managing complex power quality challenges in industrial settings.
Footnotes
Acknowledgments
Authors contribution
Maulana R. Riziq: software, formal analysis, and writing–original draft. Titik Sundari: conceptualization, writing–original draft, project administration. Sugianto: data curation and resources. Yuli Purwanto: writing–review and editing and visualization. Suryantoro: resources and conceptualization. Fajar R.I. Mariati: formal analysis and writing–review and editing. Ni P.D.A. Martini: writing–review and editing.
Funding
The authors disclosed receipt of the following financial support for the research, authorship, and/or publication of this article: This work was supported by the DIPA BRIN 2024 (grant number DIRI 2024).
Declaration of conflicting interests
The authors declared no potential conflicts of interest with respect to the research, authorship, and/or publication of this article.