
Abstract
We assessed the impact on physician prescription behaviors of an outpatient prescription incentive program providing financial rewards to primary care physicians for saving prescription costs in South Korea. A 10% sample of clinics (N = 1,625) was randomly selected from all clinics in the National Health Insurance claims database for the years 2009–2012, and all claims with the primary diagnosis of peptic ulcer or gastro-esophageal reflux diseases were extracted from those clinics’ data. A clinic-level random-effects model was used. After the program, clinics in general medicine showed a lower prescription rate (by 0.8 percentage points), lower number of medicines prescribed (by 0.02), lower prescription duration (by 0.15 days), and lower drug expenditure per claim (by 740 won). Small clinics on the <25th percentile of a regional sum of monthly drug expenditure had shorter prescription duration (by 0.76 days), while large clinics on the ≥75th percentile and clinics in group practice had a higher prescription rate (by 1.5 and 2.5 percentage points, respectively) and a higher number of medicines prescribed (by 0.03 for group practice only) after the program. The outpatient prescription incentive program worked as intended only in certain subgroup clinics for the target medicines.
Keywords
Pharmaceutical expenditure in Korea increased rapidly by 13.2% annually between 2001 and 2010, while total health expenditure increased approximately 10.5% annually for the same period. 1 The outpatient prescription incentive program was promulgated in October 2010 to contain pharmaceutical spending by motivating physicians to reduce unnecessary prescriptions through professional judgment, without undermining the quality of their medical services. The program, applied to clinics, estimates prescription drug expenses for one-half of the current year for each clinic based on its drug expenditures during the same period of the previous year. If a clinic achieves savings by incurring fewer actual expenses than estimated expenses and it records lower pharmaceutical expenditures than other clinics, it is paid an incentive of 20%–40% of the savings, directly out of the National Health Insurance Service (NHIS) budget.
Financial incentives have been introduced in many countries to promote cost-effective prescriptions and contain pharmaceutical spending.2–6 Policies offering financial incentives for performance with the intention of health expenditure control are in place in the United Kingdom and United States, where quality assurance for health services is of concern.7–9 The outpatient prescription incentive program in Korea was introduced as a tool for prescription expenditure control rather than quality control. Financial incentive programs in other countries often include tools to alter prescription behaviors, such as building information infrastructure to effectively assess the outcome of the program or running education programs for providers. 10 However, the outpatient prescription incentive program in Korea does not include such information systems, which helps researchers parse out the influence of financial incentive on changes in prescription behaviors despite the potentially limited policy impact.
We assess the effect of an outpatient prescription incentive program on not only drug expenditure, but also non-drug expenditure to comprehend both the expected policy effect and any spillover effect on other components of health resource utilization. 11 We also investigate whether the program affected prescription behaviors of physicians in terms of quantity and content. Further, we explored the heterogeneity in the effect of the program by physician characteristics and determinants for prescription behaviors. 12 Clinical environments, including physicians’ practice patterns, vary by region and by country. Therefore, it is important to assess policy and find implications in local contexts.13–14 Our study adds global evidence in understanding the impact of financial incentive programs on physicians in the areas of prescription behaviors and expenditure.
Materials and Methods
Data
The study sample was drawn from four years of NHIS claims data (January 1, 2009, through December 31, 2012). Almost all Koreans (nearly 95% of the population) are members of NHIS in Korea. All medical institutions in Korea mandatorily provide medical services to NHIS members and file claims to NHIS electronically. The treatment details within claims data include prescriptions for each patient on each visit. Providers are reimbursed by fee-for-service, except for prescription drugs dispensed in pharmacies. We assessed the data after removal of personal identification information.
The study included only clinics that were continuously open in the same location between 2009 and 2012 because we sought to analyze changes in the prescribing patterns of physicians relative to policy changes. The following exclusion criteria were applied to the list of eligible medical institutions to select the final sample of clinics that filed claims to the NHIS in 2009–2012 (143,267 clinics):
Closed, opened, or changed geographic locations during the study period (20,118 distinct clinics remained) With specialties other than family medicine, internal medicine, anesthesiology, nephrology, obstetrics and gynecology, pediatrics, orthopedics, dermatology, or general medicine (17,566 distinct clinics remained) Clinics run by corporations (16,248 distinct clinics remained)
Of the remaining 16,248 clinics, a 10% random sample (1,625 clinics) was drawn.
We focused on drugs for peptic ulcer and gastro-esophageal reflux disease (Anatomical Therapeutical Chemical code: A02B) because they are frequently used and could be overprescribed or mis-prescribed (Johns et al., 2001; Health Insurance Review and Assessment Service, 2012). To identify sample patients, we extracted all claims with the primary diagnosis codes of peptic ulcer according to the International Classification of Diseases, Version 10 (ICD-10, code: K25) or gastro-esophageal reflux diseases (ICD-10 code: K21) filed by the 1,625 sample clinics. We aggregated the claim-level data to monthly averages for each clinic. There were 9,821 clinic-month observations included in the final analyses.
Variables
Prescription pattern and expenditure are the dependent variables to be analyzed. Prescription pattern was calculated with the following three variables at the clinic-month level: 1) the average prescribing rate as the percentage of claims with drugs for peptic ulcer and gastro-esophageal reflux disease in claims for the target diseases, 2) the average number of days for which drugs for peptic ulcer and gastro-esophageal reflux disease were prescribed, and 3) the average number of different drugs for peptic ulcer and gastro-esophageal reflux disease. Drug expenditure was calculated as the average of total prescription costs at the clinic-month level. Average non-drug expenditure by month and clinic was used in addition to drug expenditure to examine whether the financial incentive only for reduced prescription of medications had any spillover effects on non-medication expenses.
The main independent variable is the outpatient prescription incentive program implemented in October 2010. A dummy variable indicates the periods after the policy implementation, with periods prior to the policy as the reference group.
We controlled for a monthly time trend. We also included a dummy indicator for the universal price cut in April 2012, which cut the listed price for 47.1% of listed drugs by approximately 21%, in estimation of drug and non-drug expenditures to control for the impact of drug price cuts. The following provider characteristics influencing prescriptions were controlled for in all estimations: physician gender (men, with women as the reference); physician age (45–54 years old, 55–64, 65 years or older, with <45 as the reference); geographic locations of the clinics (rural, small city, with large city as the reference); specialty of the physician (general medicine, internal medicine, with other specialties as the reference); practice type (group practice with two or more physicians, with solo practice as the reference); duration of operation (≥5 and <10 years, >10 and <15, >15 and <20, ≥20 years, with <5 as the reference); and the location of each clinic on the distribution of monthly drug expenditure at county-level as a proxy variable for clinic size (at the ≥25th and <50th percentile, ≥50th and <75th, ≥75th, with <25th percentile as the reference). For clinics with multiple physicians, average values of demographic information for all physicians were used.
Statistical Methods
Prescription behaviors were regressed on policy variables and characteristics of physicians and clinics using ordinary least squares (OLS) models, as in equation (1).


We modified equation (1) to control for time-invariant clinic characteristics (μ) in the clinic-level random-effects model. All other variables in equation (2) have the same meaning as equation (1).
The unit of analysis is clinic-month. We performed subgroup analyses by selected clinic characteristics, including practice type (solo and group), rank (percentile) in the regional distribution of total claim amount as a proxy for clinic size (<25th and ≥75th percentiles), and specialty (general medicine, internal medicine, and other specialties). We assume that small clinics in the <25th percentile of regional distribution of total claim amount are more responsive to the payback incentive given that the payback amount is additional income for the clinics. Large clinics in ≥75th percentile of regional distribution of total claim amount could be more responsive to the program, as the payback amount is proportionate to total claim size. Practice type may matter if prescription behaviors vary by physicians in group practice. Physician specialty is related to total claim size for our target disease, and we assume clinics in general or internal medicine have more patients with the target diseases and thus are likely to have higher payback amount from the program. Therefore, we ran separate estimations as in equation (2) for each subgroup of interest.
STATA 12.1 was used for all statistical analyses (StataCorp, College Station, Texas).
Results
Descriptive Statistics.

Note: During 2009–2012 all claims for 1,625 sample clinics with primary diagnosis codes of ulcer and gastro-esophageal reflux diseases were extracted and then aggregated into 9,821 clinic-months. The unit of observation is clinic-month. ICD-10 codes were used to identify target disease of ulcer (K21) and gastro-esophageal reflux diseases (K25). ATC codes were used to identify target medicines of peptic ulcer and gastro-esophageal reflux diseases (A02B).
The Impact of the Outpatient Prescription Incentive Program on Drug and Non-Drug Expenditures From a Clinic-Level Random-Effects Model.
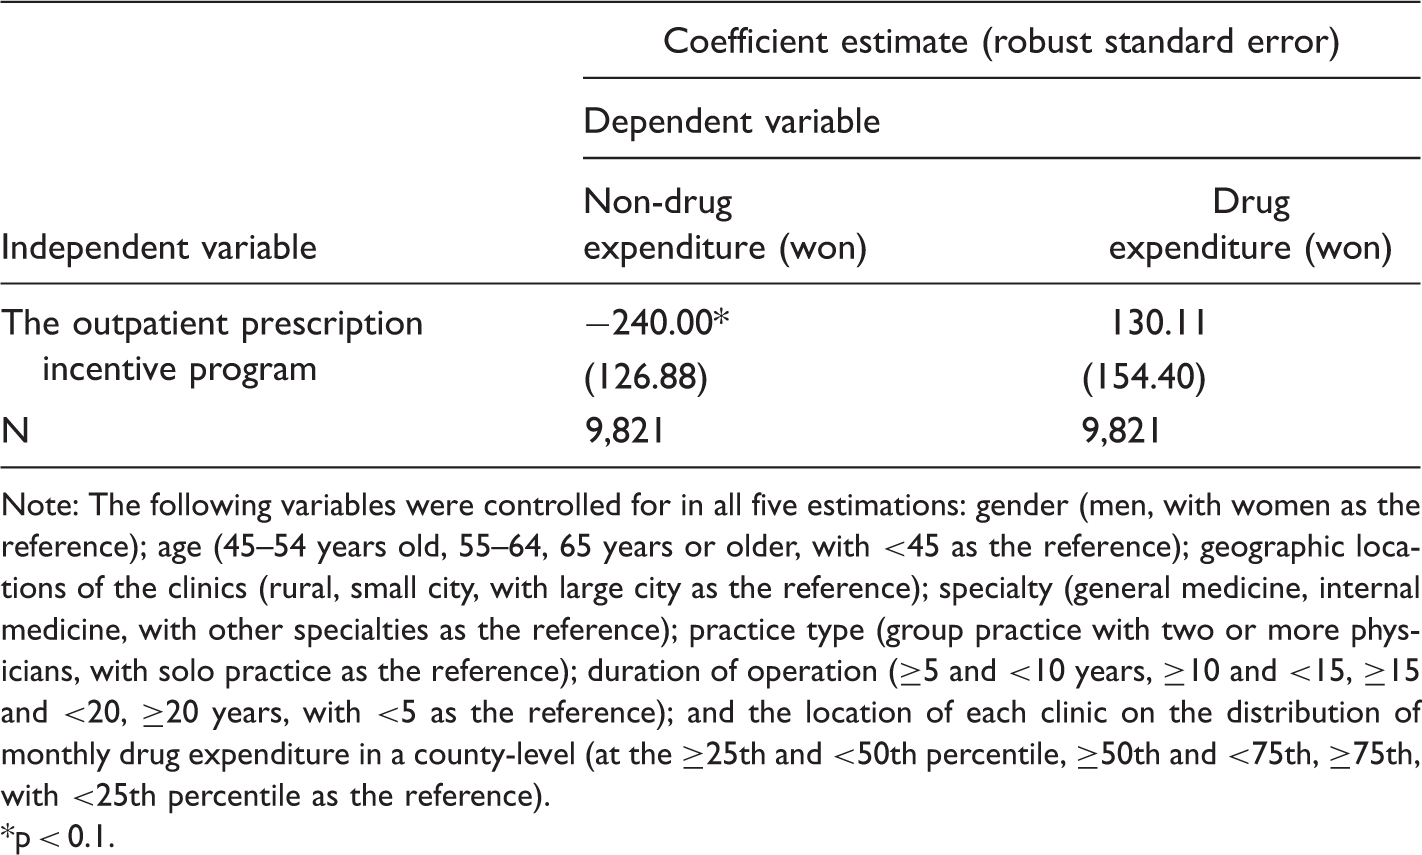
Note: The following variables were controlled for in all five estimations: gender (men, with women as the reference); age (45–54 years old, 55–64, 65 years or older, with <45 as the reference); geographic locations of the clinics (rural, small city, with large city as the reference); specialty (general medicine, internal medicine, with other specialties as the reference); practice type (group practice with two or more physicians, with solo practice as the reference); duration of operation (≥5 and <10 years, ≥10 and <15, ≥15 and <20, ≥20 years, with <5 as the reference); and the location of each clinic on the distribution of monthly drug expenditure in a county-level (at the ≥25th and <50th percentile, ≥50th and <75th, ≥75th, with <25th percentile as the reference).
p < 0.1.
The Impact of the Outpatient Prescription Incentive Program on Prescription Behaviors From a Clinic-Level Random-Effects Model.
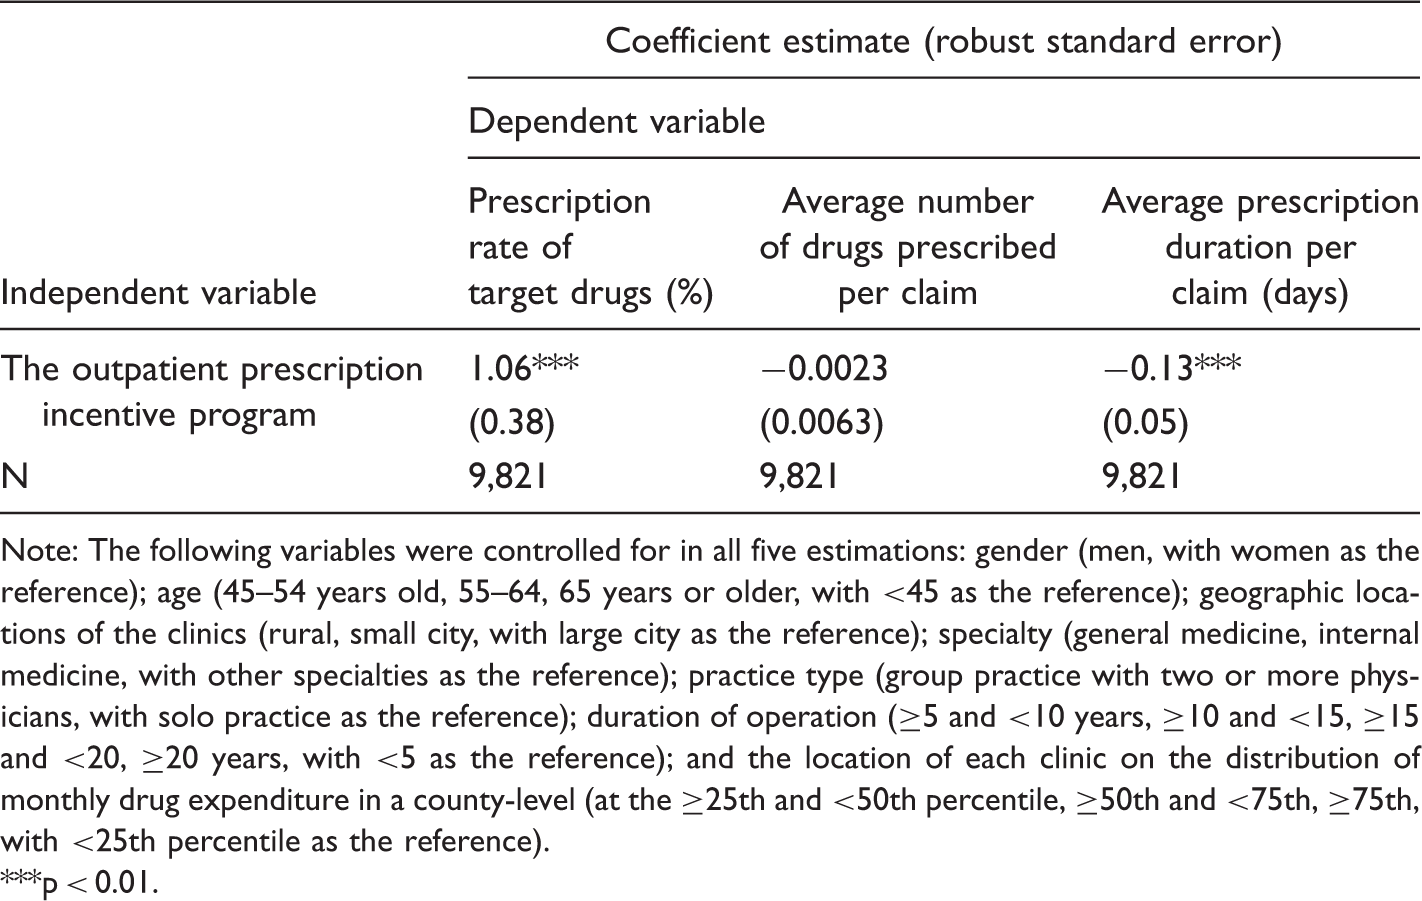
Note: The following variables were controlled for in all five estimations: gender (men, with women as the reference); age (45–54 years old, 55–64, 65 years or older, with <45 as the reference); geographic locations of the clinics (rural, small city, with large city as the reference); specialty (general medicine, internal medicine, with other specialties as the reference); practice type (group practice with two or more physicians, with solo practice as the reference); duration of operation (≥5 and <10 years, ≥10 and <15, ≥15 and <20, ≥20 years, with <5 as the reference); and the location of each clinic on the distribution of monthly drug expenditure in a county-level (at the ≥25th and <50th percentile, ≥50th and <75th, ≥75th, with <25th percentile as the reference).
**p < 0.01.
The Impact of the Outpatient Prescription Incentive Program on Drug and Non-Drug Expenditures From a Clinic-Level Random-Effects Models Separately by Subgroups of Interest.

Note: The table displays coefficient estimate for the outpatient prescription incentive program and the global price cut of listed drugs since April 2012 from a series of separate clinic-level random effect model for each subgroup. Each estimation controlled for the following variables: gender (men, with women as the reference); age group (45–54 years old, 55–64, 65 years or older, with <45 as the reference); geographic locations of the clinics (rural, small city, with large city as the reference); and duration of operation (≥5 and <10 years, ≥10 and <15, ≥15 and <20, ≥20 years, with <5 as the reference). The variables used for generating subgroups were also controlled for in all subgroup analyses except for its own.
p < 0.1, ***p < 0.01.
The Impact of the Outpatient Prescription Incentive Program on Prescription Behavior: Coefficient Estimates From a Clinic-Level Random-Effects Model Separately by Subgroup.

Note: The table displays coefficient estimate for the outpatient prescription incentive program and the global price cut of listed drugs since April 2012 from a series of separate clinic-level random effect model for each subgroup. Each estimation controlled for the following variables: gender (men, with women as the reference); age group (45–54 years old, 55–64, 65 years or older, with <45 as the reference); geographic locations of the clinics (rural, small city, with large city as the reference); and duration of operation (≥5 and <10 years, ≥10 and <15, ≥15 and <20, ≥20 years, with <5 as the reference). The variables used for generating subgroups were also controlled for in all subgroup analyses except for its own.
p < 0.1, **p < 0.05, ***p < 0.01.
Discussion
This study assessed the impact of the outpatient prescription incentive program on prescription expenditure and pattern, using administrative insurance claims data from the NHIS in South Korea. We found no significant impact of the program on drug expenditure overall. Such results could be partly attributed to different directions of the policy impact on the prescription rate of target medicines (in the direction of increase) and the average prescription duration per claim (in the direction of decrease). The NHIS of Korea reimburses physicians under the fee-for-service system; therefore, physicians have little motivation to reduce prescription volume. Previous studies report a high number of drugs per prescription, a habit of prescribing unnecessary medicine for the digestive system, 15 and preferences for higher-cost drugs. 16 Our results imply that the fee-for-service system as a reimbursement of physician services in NHIS is too influential. 17
There is no financial penalty in the outpatient prescription incentive program against those who prescribed more than expected, which could partly limit the program’s effect on quantity control. However, subgroup analyses demonstrated that the program significantly lowered the prescription rate of target medicines, average number of medicines prescribed, average prescription duration, and drug expenditure for the target claims for non-specialty clinics. Small clinics (the <25th percentile of monthly drug expenditure in a county level in a given region) had lower drug expenditure and shorter prescription duration for target claims after the policy. These findings imply that clinics with fewer patients responded more positively to the outpatient prescription incentive program than those with more patients. The amount of financial incentive may constitute a larger portion of total income for those with fewer patients, although the absolute level of incentive may be smaller compared to their larger counterparts. Therefore, we conclude that the program worked as intended only in smaller clinics for the target medicines.
Provisions of financial incentives to physicians only for prescription reduction may induce substitution of prescription for other treatment options if possible. Treatment of ulcer and gastro-esophageal reflux diseases relies mainly on drug therapy; thus, such substitutions seem less likely. Our findings do not imply such substitution, given that non-drug expenditure declined after the outpatient prescription incentive program for the whole sample and did not change significantly by subgroups. Some subgroups of the target medicines may be more suited for serious conditions and would be less likely to be altered by non-clinical conditions such as policy steering. Investigation of such potential variations by sub-categories of target medicines may provide robust evidence for both the intended and unintended effects of the outpatient prescription incentive program.
The reduction in prescription duration and the number of prescribed medicines in target claims in selected subgroups implies some margin for prescription adjustments. Several studies report that the quality of services with lower financial incentives declines, whereas the quality of other services with higher financial incentives improves.18,19 Those results suggest that physicians reallocate resources according to financial incentives.20,21 Evaluation of financial incentive programs on the quality of health services are mixed; some report overall improvement following the incentive program,14,21,22 whereas others report the opposite.23,24 Our data, based on administrative claims, do not have the detailed clinical information needed to accurately assess the validity of prescription patterns. Caution is also needed to interpret the results of this study because physicians’ prescriptions are influenced not only by reimbursement policies but also by environmental and patient factors, such as changes in medical technology or patients’ needs over time.25–27 Differences in such contextual environments across the time period, other than the implementation of the outpatient prescription incentive program, are not separately identified in the current study.
The current study assesses the impact of the outpatient prescription incentive program for only two years after policy implementation. Physician response increased immediately after the implementation of the policy.28,29 Physicians would adapt their prescription behaviors to find the optimum balance between clinical outcomes for patients’ interests and their own financial gain under the program. Such adaption beyond the short-term period should be explored in future studies.
Footnotes
Acknowledgments
We acknowledge research support from the Korea Institute for Health and Social Affairs. Han also acknowledges research support from the Korea National Research Foundation (NRF-2014R1A1A3A04049984). The funding source was not involved in the study design; the collection, analysis, and interpretation of data; writing of the report; nor the decision to submit the article for publication.
Declaration of Conflicting Interests
The authors declared no potential conflicts of interest with respect to the research, authorship, and/or publication of this article.
Funding
The authors disclosed receipt of the following financial support for the research, authorship, and/or publication of this article.