
Abstract
Background:
Research suggests that patients with a severe mental illness (SMI) are among the most social excluded in society. However, comparisons of social network composition and relationship satisfaction between SMI patients and a control group are rare.
Aims:
Our aim was to compare differences in size, satisfaction and composition of the social network between patients with SMI and a control group. Potential sociodemographic and clinical risk factors in relation to social network size in SMI patients were explored.
Methods:
The sample consisted of a control group (N = 949) and SMI patients (N = 211) who were under treatment in Dutch mental health care institutions. In these groups, network size, relationship satisfaction, sociodemographic and clinical (patients only) characteristics were assessed.
Results:
Social network size was 2.5 times lower in SMI patients, which was also reflected in a lower relationship satisfaction. The composition of the social network of SMI patients differs from that of controls: patients’ network seems to consist of a smaller part of friends. Different risk factors were associated with the impoverishment of the social network of family, friends and acquaintances of patients with SMI.
Conclusion:
SMI patients have very small networks compared to controls. This may be a problem, given the ongoing emphasis on outpatient treatment of SMI patients and self-dependence. This outcome advocates for more attention to social isolation of SMI patients and involvement of family in the treatment and aftercare of SMI patients.
Introduction
Half of the patients with severe mental illness (SMI) experience feelings of loneliness or social isolation compared to one-third of the general population (Clinton, Lunney, Edwards, Weir, & Barr, 1998; Corrigan & Phelan, 2004; Lauder, Sharkey, & Mummery, 2003). Social networks are very important because they can assist SMI patients in a practical and emotional way to face setbacks in their lives (Beels, 1981; Hatfield, 1979; Thompson & Doll, 1982). By providing mental and physical support when necessary, social networks seem to influence (mental) health outcomes. In the general population, social isolation is associated with heightened morbidity, mortality and experience of stress (Cacioppo & Hawkley, 2003; Holt-Lunstad, Smith, Baker, Harris, & Stephenson, 2015). In SMI patients, social network is also related to an earlier onset of psychosis (Gayer-Anderson & Morgan, 2013), a poorer recovery (Pernice-Duca, 2010; Perry & Pescosolido, 2015) and a lower quality of life (Becker et al., 1998; Eklund & Hansson, 2007; Goldberg, Rollins, & Lehman, 2003; Lam & Rosenheck, 2000). Since contemporary society is becoming more individualized, social networks may become even more important in mental health outcome (Verhaeghe & Tampubolon, 2012).
Studies agree upon the fact that social networks are smaller in SMI patients compared to other patients and the general population (Brugha, Wing, Brewin, MacCarthy, & Lesage, 1993; Goldberg et al., 2003; Horan, Subotnik, Snyder, & Nuechterlein, 2006; Macdonald, Hayes, & Baglioni, 2000; Meeks & Murrell, 1994). Estimates of social network size range from 3 to 13 in SMI patients and from 5 to 40 in the general population. Unfortunately, these studies in social network size are often outdated. Therefore, it seems important to further explore this topic in detail with more recent data (Eklund & Hansson, 2007).
Various factors have been suggested to be associated with network size in patients with schizophrenia and other severe mental disorders. A larger network size seems to be associated with females (Evert, Harvey, Trauer, & Herrman, 2003; Thorup et al., 2006; Walsh, 1996), younger individuals (Macdonald, Jackson, Hayes, Baglioni, & Madden, 1998), a higher education (Goldberg et al., 2003), more severe symptoms (Angell & Test, 2002; Bengtsson-Tops & Hansson, 2001; Goldberg et al., 2003; Hamilton, Ponzoha, Cutler, & Weigel, 1989; Solankangas, 1997; Sörgaard et al., 2001; Thorup et al., 2006), a higher Global Assessment of Functioning (GAF) score (Sörgaard et al., 2001), less previous psychiatric admissions (Fraser, Fraser, & Delewski, 1985; Lipton, Cohen, Fischer, & Katz, 1981), inpatients (Borge, Martinsen, Ruud, Watne, & Friis, 1999; Hansson et al., 2002), non-minority groups and patients without substance use disorders (Trumbetta, Mueser, Quimby, Bebout, & Teague, 1999; Westermeyer & Neider, 1988 as cited by Trumbetta et al., 1999). However, these findings have not consistently been replicated (Angell & Test, 2002; Cresswell, Kuipers, & Power, 1992; Eklund & Hansson, 2007; Goldberg et al., 2003; Hamilton et al., 1989; Holmes-Eber & Riger, 1990).
Previous research have suggested that social networks in SMI patients and control groups differ not only in size but in composition as well: the networks of these patients mainly consist of co-habitants, staff and other acquaintances from the health care system and less family and friends (Goering et al., 1992; Holmes-Eber & Riger, 1990; Meeks & Murrell, 1994). However, Hirschberg (1988) suggests that in patients with schizophrenia, a larger proportion of their social network consists of family members.
Even though the amount of research on this topic is quite extensive and a lot of promising factors associated with social network size are identified, the results are inconclusive. This was the first study to examine a large number of variables and their relationship with social network divided into different categories.
In this study, we compare differences in size, satisfaction and composition of the social network between SMI patients and a control group. Furthermore, we explore potential sociodemographic and clinical risk factors in relation to social network size in SMI patients. We expected that SMI patients have a smaller network size, a lower relationship satisfaction and a different network composition than the control group. For both groups, we expect that social network satisfaction will be positively related to the size of the social network. Finally, we expect SMI patients with more symptoms to have a smaller network size.
Method
Research design
For patients, data were derived from a longitudinal study between 2005 and 2011 among SMI patients treated by mental health care institutions of Arkin and GGZ inGeest in Amsterdam, The Netherlands (Dekker et al., 2010; Theunissen, Duurkoop, Kikkert, Peen, & Dekker, 2013). Six years after the baseline measurement in 2005, participants were invited for follow-up assessment in 2011. This article is based on data obtained in 2011. Assessments were face-to-face interviews and took approximately 1.5 hours. Interviews were conducted by trained psychologists and senior researchers. Patients received €15 for participation. The study was approved by the Dutch Association of Medical-Ethical Appraisal Committees (NVMETC). The comparison group consists of healthy individuals who participated in 2013, 2014 and 2015. Control participants were recruited through convenience sampling performed by psychology students of the Free University in Amsterdam.
Patients, inclusion and exclusion criteria
The cohort of this study included patients with SMI defined as a Diagnostic and Statistical Manual of Mental Disorders, fourth edition (DSM-IV) diagnosis of schizophrenia, a psychotic disorder, substance use disorder or a severe mood or anxiety disorder receiving continuous intensive mental health care during the two previous years (American Psychiatric Association (APA), 1994). The diagnosis was made by the attending psychiatrist. Exclusion criteria were inadequate control of the Dutch or English language, otherwise deficient levels of understanding or communicative abilities and the unwillingness to give informed consent (de Mooij et al., 2015).
In order to match the age of the SMI patients, the majority of controls were selected in the age group of 40–60 years. Assessment of mental health issues in the control group was not performed.
Measures
Social networks size and composition were measured with the Social Network Questionnaire (SNQ). A number of social contacts in the categories of friends, family members and acquaintances are questioned and a number of social contacts during 1 month are assessed. The SNQ gives a reliable (α = .82) and valid impression of network size and frequency of social contacts (Duurkoop, 1991).
Satisfaction with social relationships was measured with question 12 of the Manchester Short Assessment Quality of Life (MANSA): ‘How satisfied are you with your social relationships?’ This question is rated on a 7-point Likert scale where 1 represents very unsatisfied and 7 represents very satisfied. Convergent validity of the MANSA is .94, and internal consistency ranges from .74 to .81, defining the MANSA as a suitable instrument to measure the quality of life (Björkman & Svensson, 2005; Priebe, Huxley, Knight, & Evans, 1999).
Psychopathology was measured with the Brief Psychiatric Rating Scale–Expanded (BPRS-E). The BPRS-E consists of 24 items rated on a 7-point Likert scale. The symptoms are grouped into four subscales: positive symptoms, negative symptoms, symptoms of disorganization and symptoms of depression and anxiety. This instrument has a good interrater reliability (.74; Andersen et al., 1989).
Alcohol and substance use was measured by the Measurements in the Addictions for Triage and Evaluation (MATE). It measures the quantity and frequency of alcohol and drug use in the past 30 days and examines whether DSM-IV criteria for substance misuse and dependence are met. The interrater reliability ranges between .75 and .92, and the interviewer reliability ranges between .34 and .73 (Schippers, Broekman, Buchholtz, Koeter & van den Brink, 2010).
Social, occupational and psychological functioning was measured with the GAF scale (Jones, Thornicroft, Coffey, & Dunn, 1995). The GAF scale is a valid and reliable instrument to measure dysfunction in this population.
Data analysis
Analyses were conducted using SPSS Statistics 20.0, and a significance level of α = .05 was employed. To compare social network size, composition and satisfaction between patients and the control group, Mann–Whitney tests were conducted because assumptions for independent-samples t-tests were violated. Because demographic characteristics differed significantly between both groups, an analysis of covariance (ANCOVA) was employed to control for these characteristics when analyzing differences in social network size. Although assumptions of the ANCOVA were violated, we continued this analysis for lack of an alternative analysis. The association of network size and satisfaction with social relationships was determined by using correlation analyses and the chi-square test. To analyze the influence of sociodemographic characteristics on network size and satisfaction, regression analyses were conducted. Assumptions of the regression analysis were violated: a Poisson regression was conducted instead.
Social network composition was defined as the proportion of contacts in the categories family (partners were also included in this category), friends and acquaintances. Furthermore, the following sociodemographic and clinical characteristics were analyzed as potential determinants of social network size: age, sex, ethnicity and level of education. Ethnicity was divided into two categories: Western cultural background (Europe, United States, Canada, Australia, New Zealand, Japan and Indonesia) and non-Western cultural background (other Asian countries, Central America, South America and Africa). These categories were based upon classification by the Dutch Central Bureau of Statistics (CBS, 2016). For SMI patients, housing facility, substance use, GAF score and presence and severity of psychiatric symptoms were also included as potential determinants.
Results
In this study, 876 patients were randomly selected from a total caseload of 2,846 patients who were treated by outpatient teams or living in sheltered housing facilities or inpatient care facilities. The aim was to include equal numbers of patients from these three care settings. A total of 553 patients (63.1%) were not included in the study. Some patients refused to participate (25.9%), and others did not participate for unknown reasons (25.5%). Some patients (2.9%) were excluded because their clinician feared participating in this study could have a negative effect on the patients’ wellbeing. Patients who no longer received treatment (8.9%) were also excluded. The remaining 323 patients (36.9%) were included for the baseline assessment (Dekker et al., 2010; de Mooij et al., 2016). In 2011, we were able to follow up 211 patients from the original sample. Some patients could not be traced (2.5%), had passed away (9.0%), refused to participate (14.6%), were unable to do the interview (3.4%), gave no consent (1.8%), had their patient file removed (.3%) or left the country (1.2%). For analyses in this study, 1.5% of patients were regarded as outliers because of improbable social network size and therefore excluded. In conclusion, we were able to analyze data of 211 patients in this study.
A total of 949 individuals participated in the study and filled in the questionnaires. Characteristics of SMI patients and the control group are shown in Table 1. This table provides a summary of differences between SMI patients and the control group. As expected, the groups differed significantly on all characteristics. Most SMI patients were diagnosed with schizophrenia or other psychotic disorders. A minority of the SMI patients were severe alcohol, cannabis or hard drugs users.
Comparison of age, gender, ethnicity and level of education of SMI patients (N = 211) and the control group (N = 949).
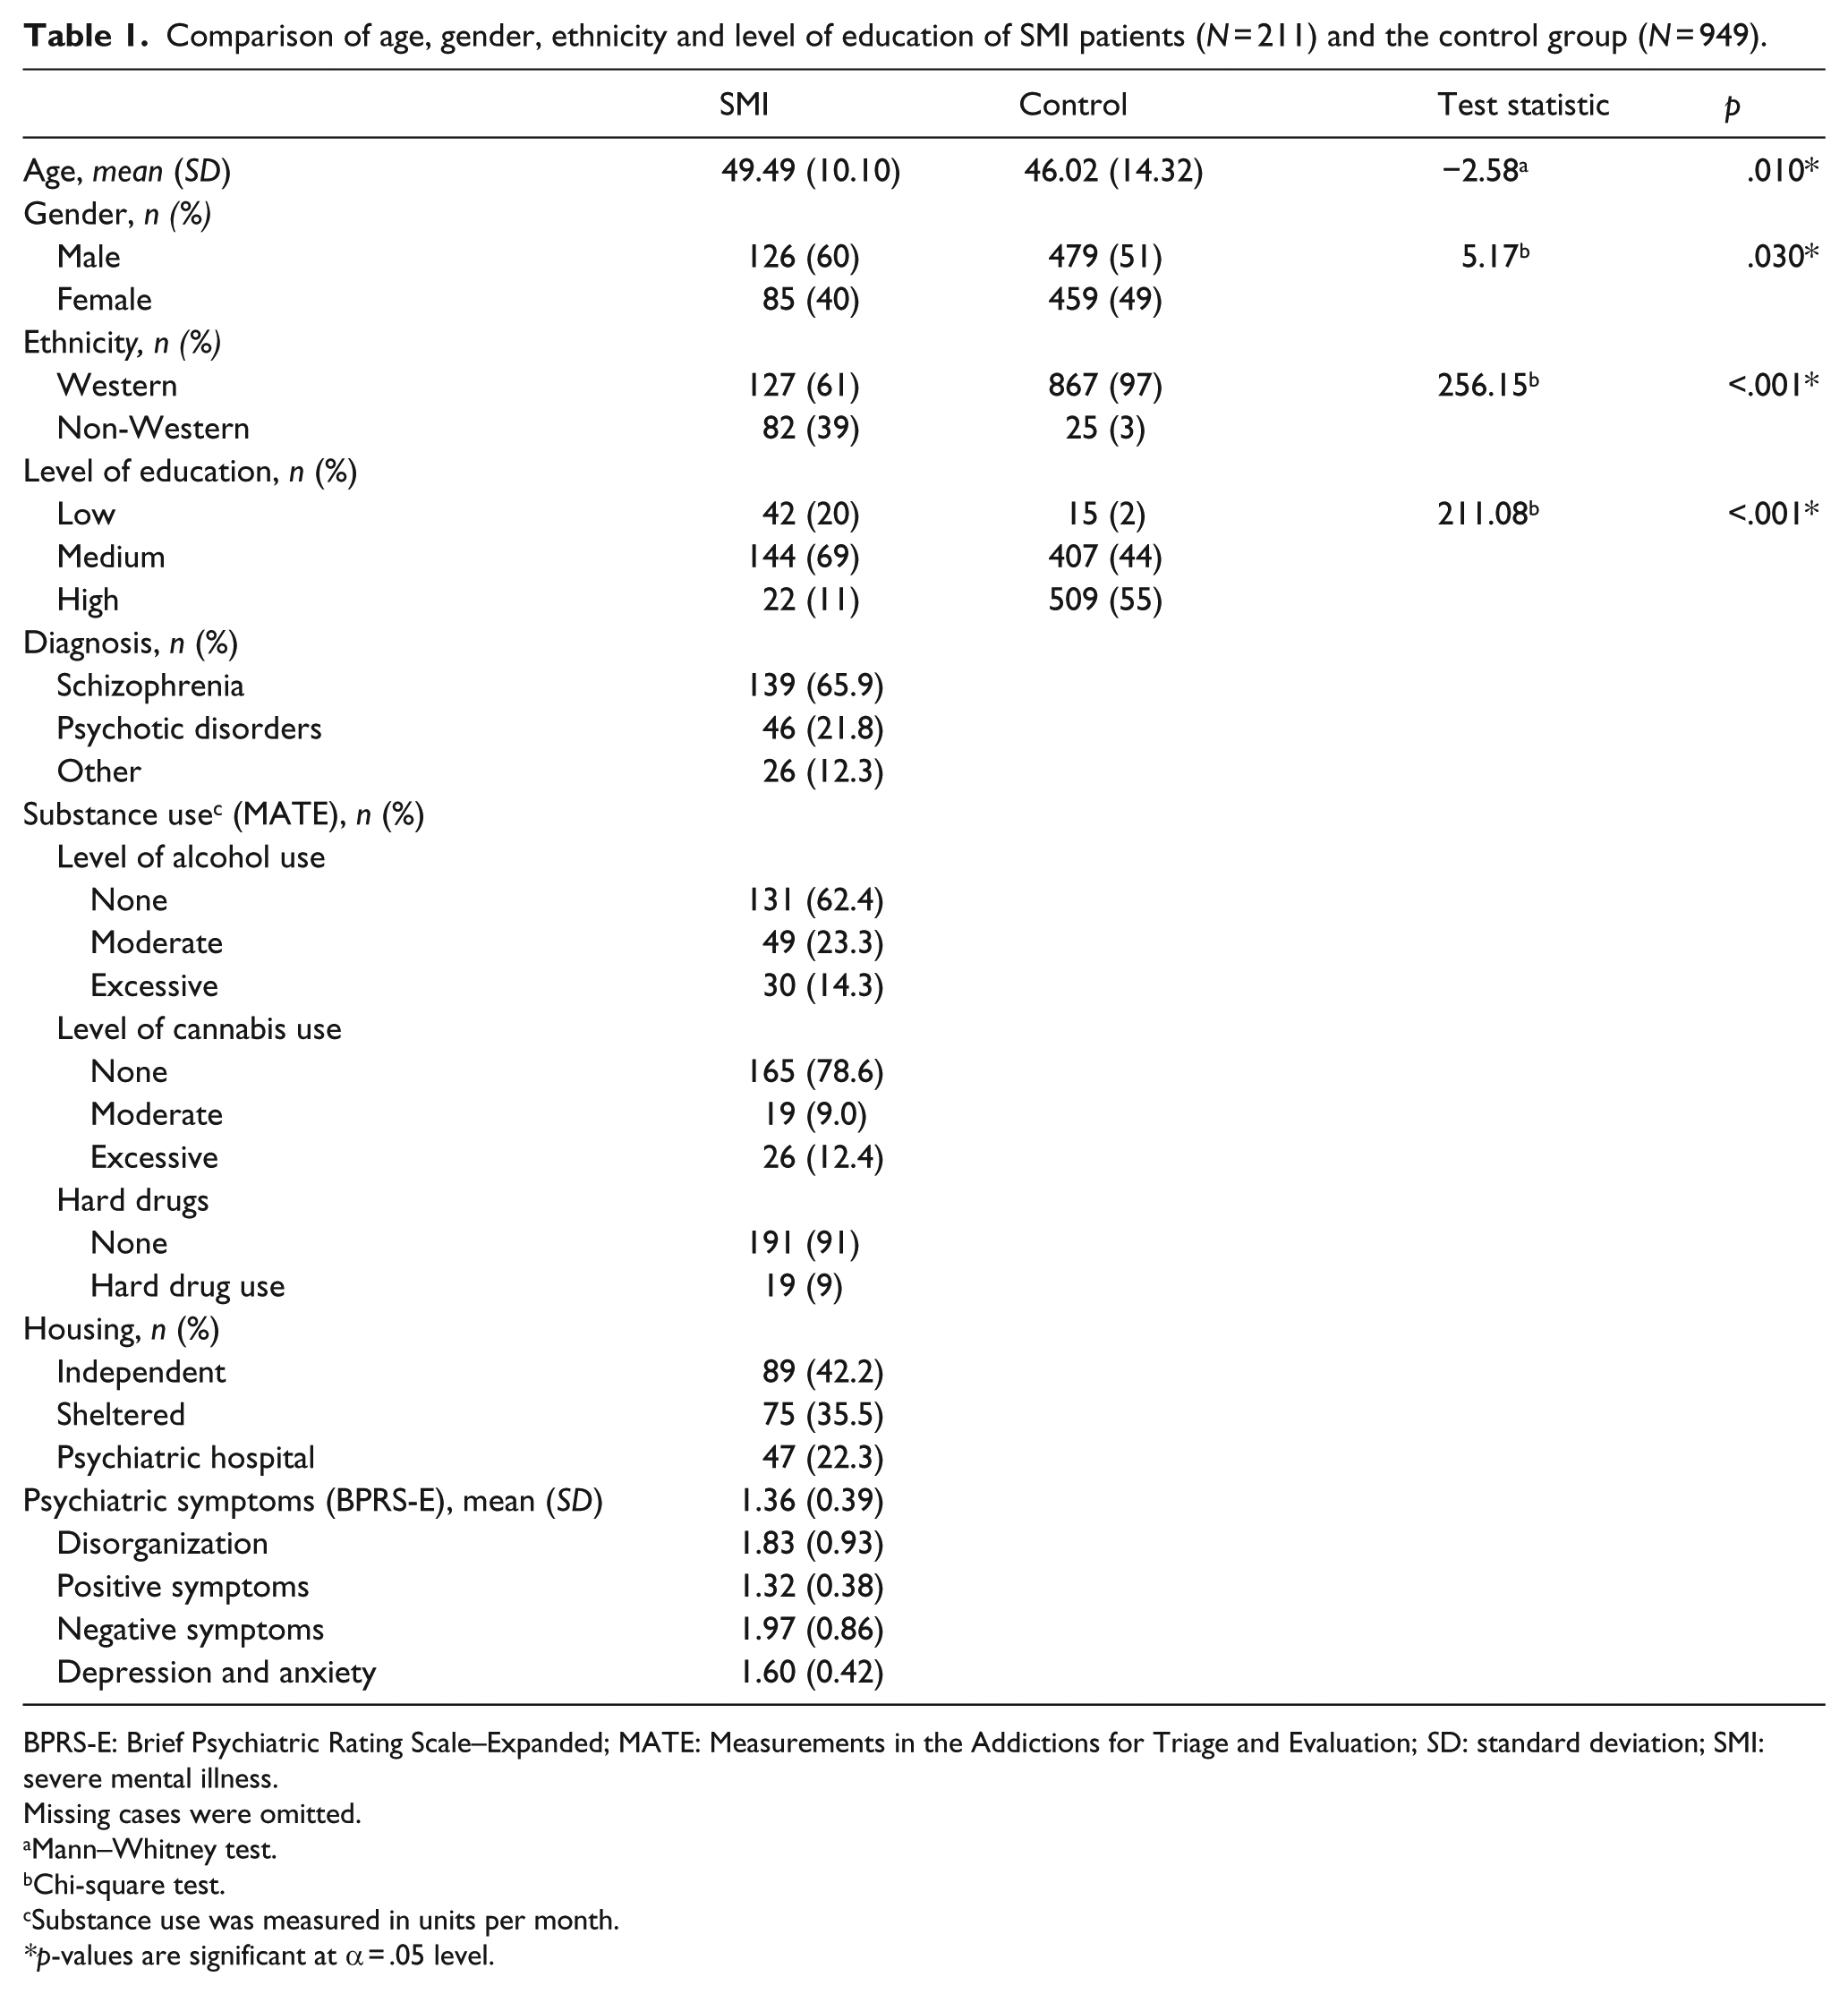
BPRS-E: Brief Psychiatric Rating Scale–Expanded; MATE: Measurements in the Addictions for Triage and Evaluation; SD: standard deviation; SMI: severe mental illness.
Missing cases were omitted.
Mann–Whitney test.
Chi-square test.
Substance use was measured in units per month.
p-values are significant at α = .05 level.
Differences between SMI patients and the control group in social network size, as well as in satisfaction, were examined. Table 2 shows that the control group has more social contacts with family, friends and acquaintances and a higher overall network size. Effect sizes range between medium and large effects. Furthermore, SMI patients were less satisfied (M (SD) = 4.50 (1.73)) with their social relationships compared to controls (M (SD) = 5.78 (1.00), z = –10.18, p < .000, r = .30).
Network sizes of both SMI patients (N = 211) and the control group (N = 949) controlled for age, gender, ethnicity and level of education.
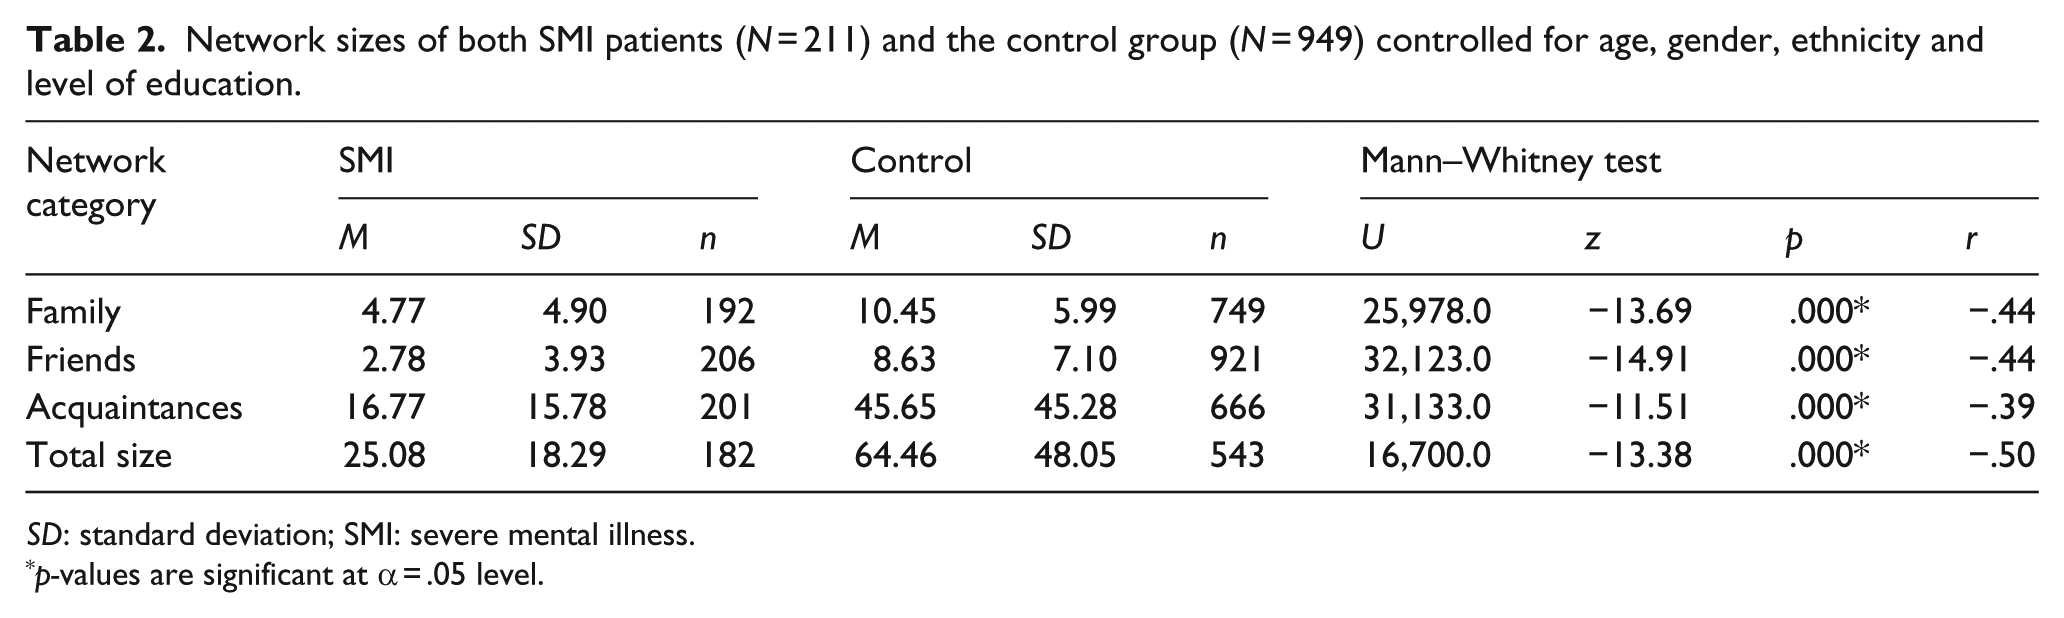
SD: standard deviation; SMI: severe mental illness.
p-values are significant at α = .05 level.
To control for differences in age, gender, ethnicity and level of education, the same analysis was conducted using an ANCOVA. The results in Table 3 confirm that SMI patients have a smaller social network of family members, friends and acquaintances than the controls. Furthermore, this analysis also confirms that SMI patients were less satisfied (M (SD) = 4.48 (1.74)) with their relationships compared to the control group (M (SD) = 5.79 (0.99), F(1) = 130.13, p = < .000, η2 = .109). Effect sizes are small to medium.
Network sizes of both SMI patients (N = 211) and the control group (N = 949) ANCOVA.
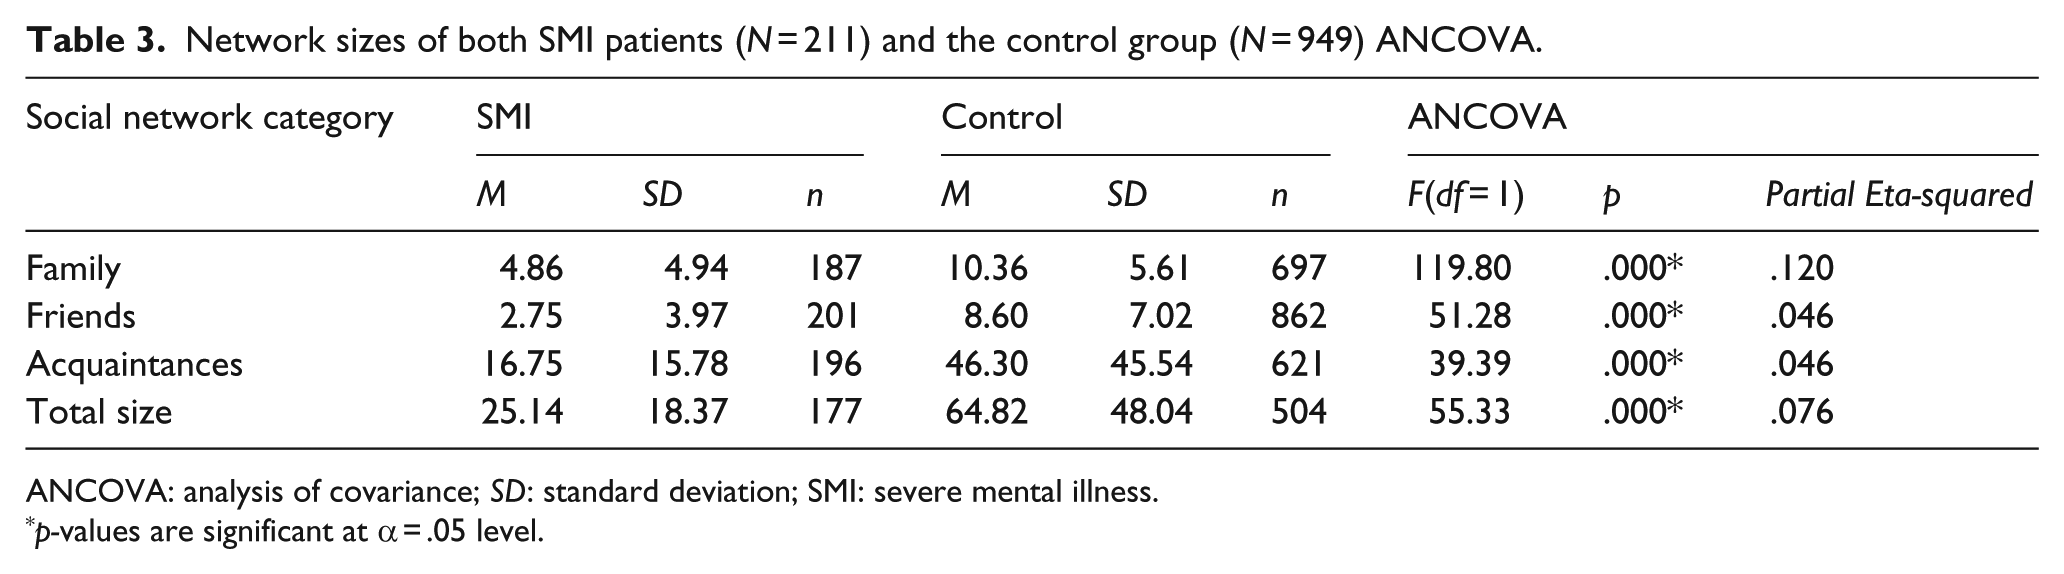
ANCOVA: analysis of covariance; SD: standard deviation; SMI: severe mental illness.
p-values are significant at α = .05 level.
Second, the contribution of different network categories to the total network size was compared between SMI patients and the control group. Since none of the dependent variables were normally distributed, Mann–Whitney tests were performed. Table 4 shows that the control group has a higher percentage of friends contributing to their total network size compared to SMI patients. There is no difference in the proportion of family members and acquaintances between both groups.
Contribution of the different network categories to total network size of both SMI patients (N = 211) and the control group (N = 949).
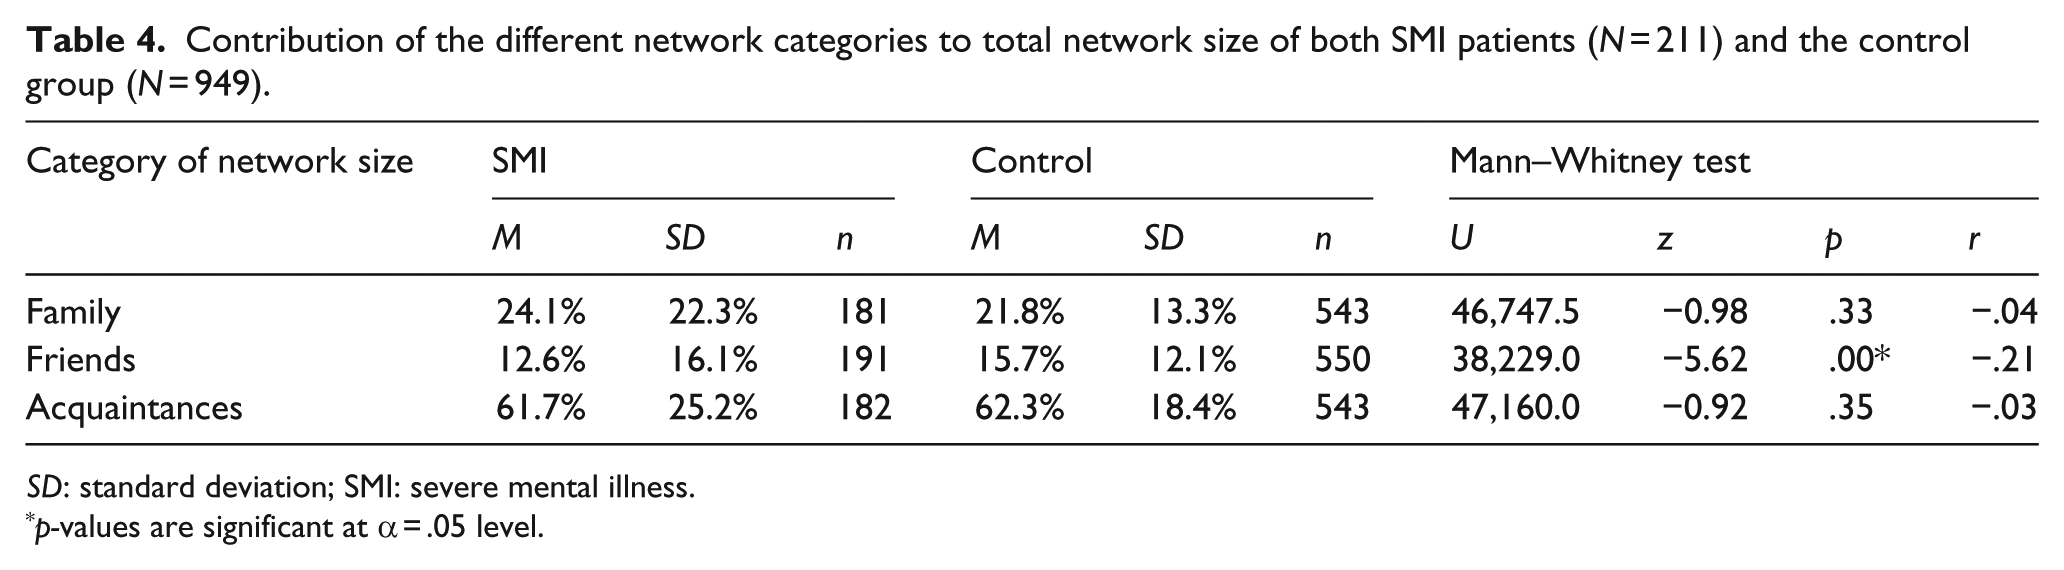
SD: standard deviation; SMI: severe mental illness.
p-values are significant at α = .05 level.
Third, it was assessed whether satisfaction with social relationships is related to the total network size. Since none of the dependent variables were normally distributed, Spearman correlations were calculated. For SMI patients, absolute network sizes of the categories family, friends and acquaintances were all related to satisfaction with social relationships (r (n) = .25 (190), .37 (204) and .20 (198), respectively; p ≤ .001 for all categories). For the control group, network sizes of friends (r (n) = .29 (911)) and acquaintances (r (n) = .18 (660)) are significantly related to experienced relationship satisfaction (p < .00 for both). The network size of family is not related to experienced satisfaction with social relationships (r (n) = .06 (742), p = .13).
A Poisson regression was performed to assess which variables are related to network size and satisfaction with the social network of SMI patients (Table 5). We found that female patients, non-Western patients and patients who were living independently had a larger family network (χ2(4) = 21.38, p < .000), whereas male patients had a larger network of friends (χ2(1) = 5.21, p = .022). A larger network of acquaintances was associated with a younger age, more severe symptoms of disorganization, less negative symptoms and less symptoms of depression and anxiety (χ2(5) = 22.16, p < .000). Patients living in sheltered housing or in psychiatric hospitals had smaller family networks. Finally, this model reveals that female SMI patients and patients with less symptoms of depression and anxiety reported higher satisfaction with their social relationships.
Association of different variables with social network size and satisfaction with social relationships in SMI patients.
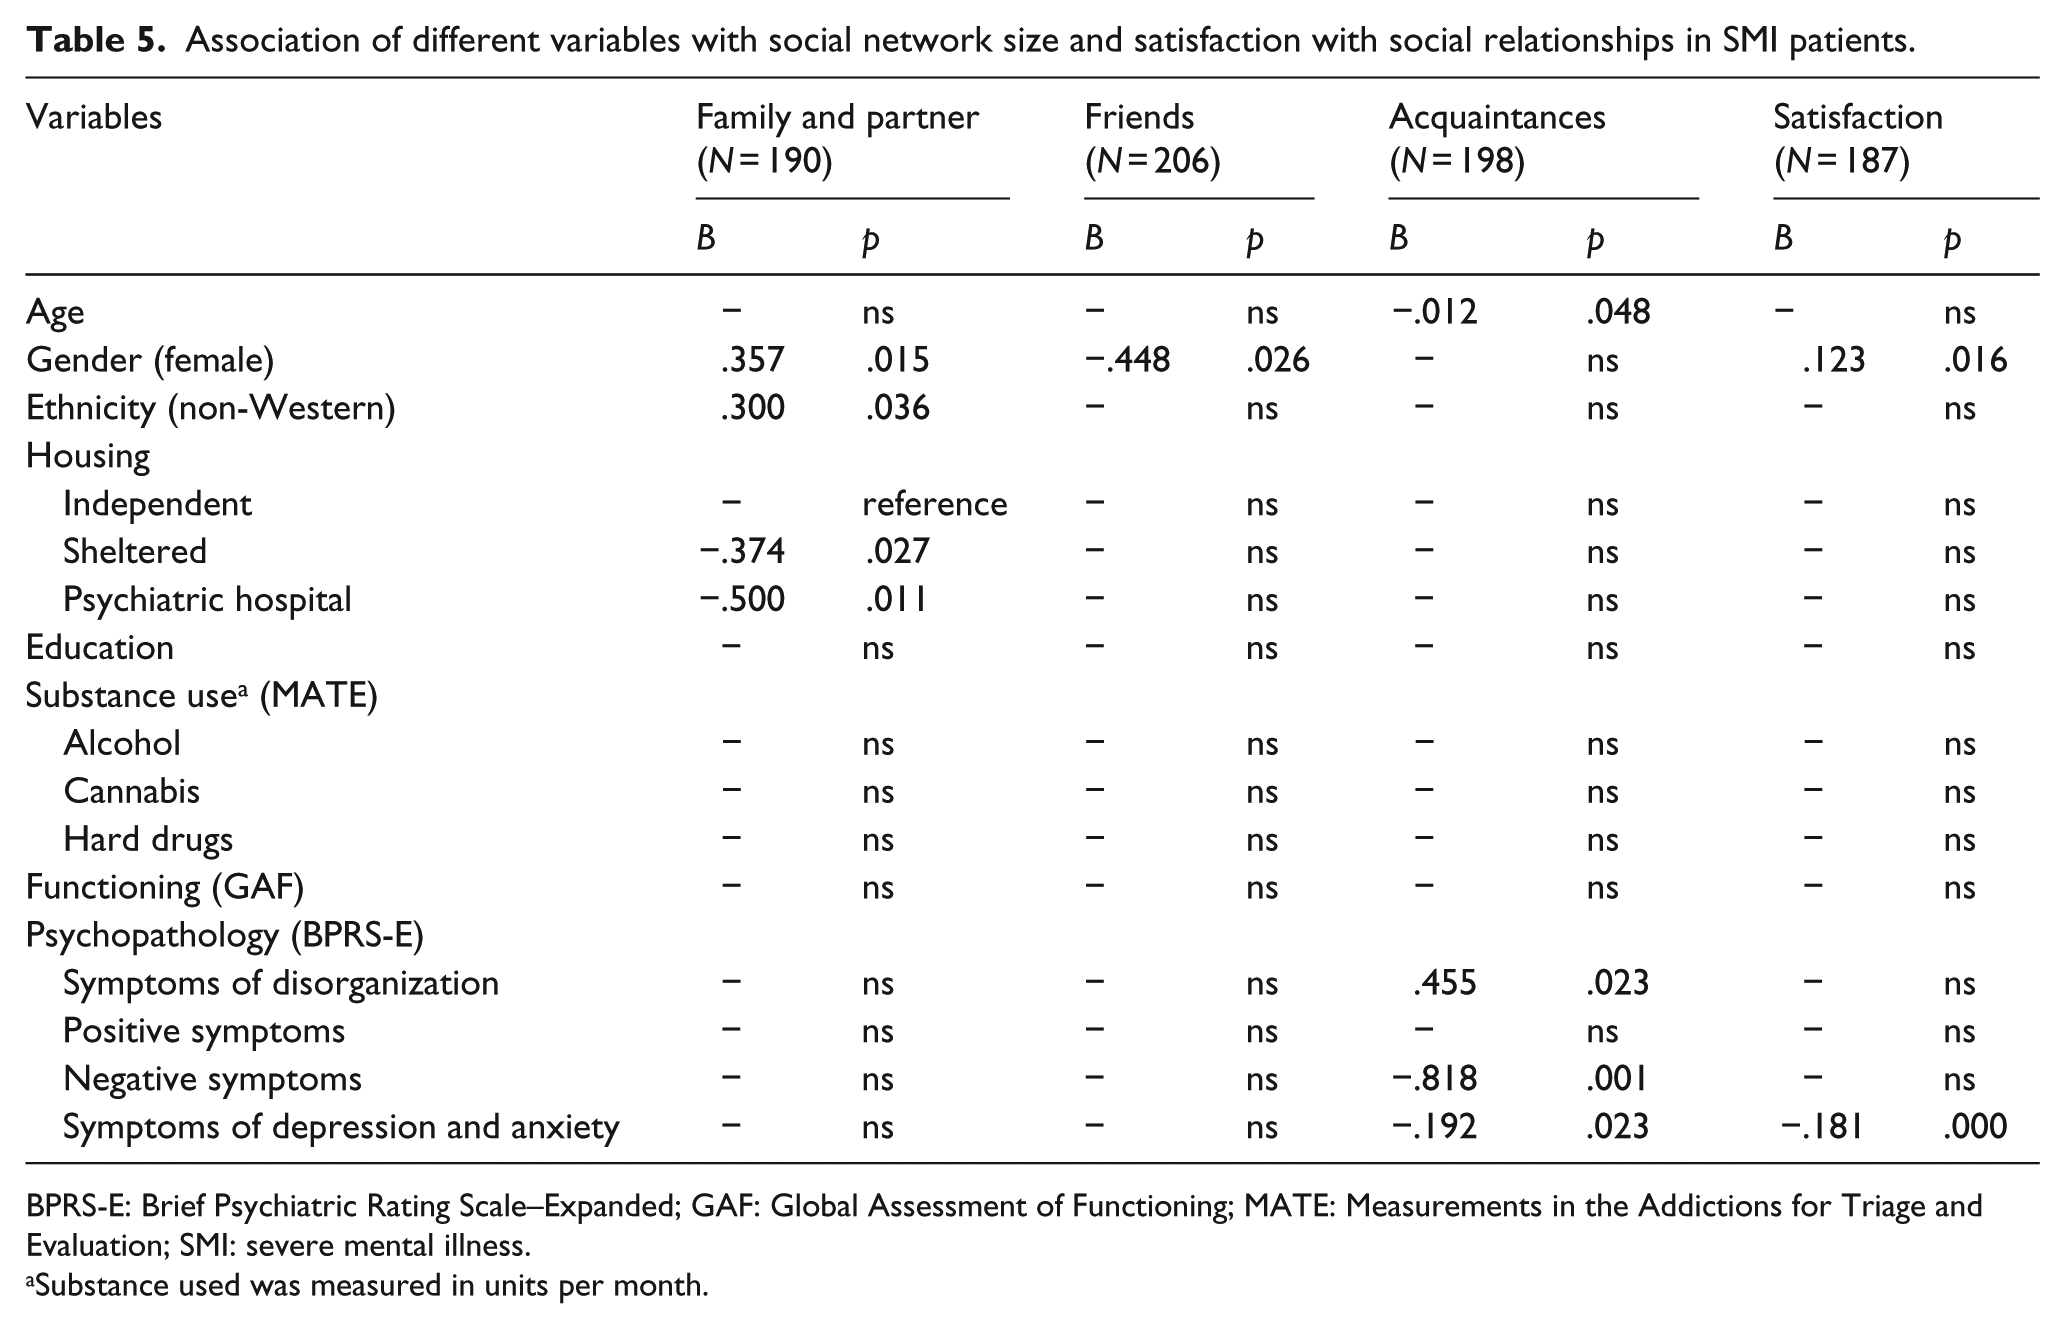
BPRS-E: Brief Psychiatric Rating Scale–Expanded; GAF: Global Assessment of Functioning; MATE: Measurements in the Addictions for Triage and Evaluation; SMI: severe mental illness.
Substance used was measured in units per month.
Discussion
The results of this study show that SMI patients have a 2.5 times smaller social network than the control group and patients are less satisfied with their social relationships. Furthermore, the composition of the social network of SMI patients and controls does not seem to differ much, although SMI patients’ network seems to consist of a smaller part of friends. For SMI patients, larger network sizes of family, friends and acquaintances were all related to higher satisfaction with social relationships. For the control group, network size of family was not related to relationship satisfaction.
Patients who were female, had a non-Western ethnical background and lived independently had a larger family network. Patients who were male had a larger network of friends. Patients who were younger, had less symptoms of depression and fear, and had less negative symptoms but more symptoms of disorganization had a larger network of acquaintances. Furthermore, patients who were female, had less symptoms of depression and anxiety and had larger networks of both family and friends were more satisfied with their social relationships. It seems both gender and the presence of psychiatric symptoms are related to both social network size and satisfaction.
Conform our expectations and in accordance with previous research, we found that SMI patients have a smaller network size compared to the control group (Brugha et al., 1993; Goldberg et al., 2003; Horan et al., 2006; Macdonald et al., 2000; Meeks & Murrell, 1994). Becker et al (1998) suggested that quality of life increases with network size up to 20 social connections (mainly friends and family were taken into account). In SMI patients, we found a mean of 7.61 friends and family members combined, while this was on average 18.96 in the control group. The mean of the control group is closer to the optimum number of connections, which is consistent with the finding that they experience more satisfaction in their social relationships.
Our findings shows that the social network of SMI patients consists of a lower percentage of friends compared to the control group. This is in line with Hirschberg’s (1988) study. These contradicting results may be due to the housing situation of patients. We performed an additional analysis to check this assumption and found that although sample sizes were relatively small, outpatients had in comparison with controls larger family networks (31% vs 22%) and smaller acquaintances networks (56% vs 62%), while this was reversed in inpatients. Inpatients had smaller family networks (17% vs 22%) and larger acquaintances networks (69% vs 62%). Furthermore, SMI patients’ network size of family is related to relationship satisfaction, while this seems not to be the case for the control group. Possibly family members might be more actively involved in the lives of SMI patients, and this involvement is rated as more satisfactory compared to the control group. It could be hypothesized that this greater involvement exists because SMI patients require more care. We did not find any relationship between education level, substance use, GAF score, positive symptoms and different social network categories.
Furthermore, contrary to our expectations we found that symptoms of disorganization were related to a larger network of acquaintances. Perhaps the relation between symptoms of disorganization and larger network of acquaintances can be understood by these acquaintances being other patients in the mental health care system. This might be particular for disorganization compared to other symptoms since symptoms of disorganization are more present in admitted patients; however, this remains a hypothesis.
Weaknesses of this study are the fact that the control group may not be representative for the normal population since students often selected individuals in their own network. This could have caused the control group to have a higher level of education and possibly a higher social economic status than the population average. Furthermore, we did not assess mental health problems in the control group. Since the prevalence of SMI in the general population is only 1.6% (Delespaul, 2013), it seems unlikely that SMI in the control group would have affected our results. In addition, based on prevalence rates in the general Dutch population, we assume that approximately 15% of our controls may have suffered from a DSM-IV disorder (World Health Organization (WHO), 2004). This could have decreased the contrast between our study groups. Larger differences may be found when a comparison is made with controls without psychiatric disorders.
Also, data in this study did not follow the normal distribution; therefore, the power of this study was decreased and relationships that do in fact exist might have been missed. Because of the non-parametric data, a correction for covariates could not be conducted. To address this problem, an ANCOVA was conducted. This analysis showed that even when covariates were taken into account, differences between SMI patients and the control group still remained significant. Although this is not an appropriate analysis for this type of data, because of the large sample size we believe these results are still valuable. Finally, the Poisson model used to determine the contribution of different variables to social network size and satisfaction was overdispersed. To correct for overdispersion, a Pearson correction was employed. Even though we corrected for overdispersion, the model did not fit the data perfectly.
Regarding future research it would be advised to match the control group to the sample of patients. This way psychological health will be the most distinctive characteristic between both groups, which will make analyses easier to interpret. Furthermore, future research could analyze the effects of network interventions like (a) improving the role of the social network in the care for patients with SMI and (b) implementation of methods to expand the social network for a better social inclusion of patients with an SMI.
In conclusion, SMI patients have very small networks compared to control participants. This may be a problem, given the ongoing emphasis on outpatient treatment of SMI patients and self-dependence. In order to cope successfully with daily life, the majority of patients require some support from close others. The reality is that patients have between seven and eight friends and family members on average to rely on, which is 2.5 times less compared to healthy controls. This is also reflected in reduced relationship satisfaction. This outcome advocates for more attention to social isolation of SMI patients and involvement of family in the treatment and aftercare of SMI patients.
Footnotes
Acknowledgements
The authors thank all patients, mental health workers, students and control participants for their participation in this study.
Funding
The author(s) disclosed receipt of the following financial support for the research, authorship, and/or publication of this article: This work was supported by Stichting tot Steun VCVGZ (grants ST13102.Me2).