
Abstract
Aims:
Young adults with serious mental illness (SMI) are thought to be socially excluded. However, psychometric measures of social inclusion have not been employed to examine group differences relative to peers from the general community. The aim of this study was to employ such a measure to determine differences in social inclusion between young adults with SMI and peers from the general community.
Methods:
A cross-sectional hierarchical logistic regression was conducted to identify which dimensions and individual indicators from the Filia Social Inclusion Measure (F-SIM) discriminated between n = 152 young adults aged 18–25 from the general community (M = 21.36, SD = 2.16) and n = 159 young adults aged 18–25 with SMI (M = 21.13, SD = 2.21).
Results:
Group membership was accounted for by Interpersonal Connections (Nagelkerke R2 = .32), Vocational & Financial Security (Nagelkerke R2 = .32) and Healthy Independent Lifestyle (Nagelkerke R2 = .08) dimensions of the F-SIM. Relative to young adults from the general community, those with SMI were five times less likely to feel they had friends who would call on them in a crisis, odds ratio (OR) = .19 (95%CI = .04, .53), p = .04, almost five times more likely to live with their parents, OR = 4.79 (95%CI = 1.98,11.15), p = .004, almost four times less likely to have worked/studied any time over the past 12 months, OR = .27 (95%CI = .11,.64), p < .001, and three-and-a-half times more likely to report unstable accommodation, OR = 3.58 (95%CI = 1.14, 11.15), p = .03.
Conclusion:
Young adults with SMI are socially excluded relative to peers from the general community in terms of interpersonal connections, vocational engagement, autonomy/independence and housing stability. In addition to the well-established focus on vocational engagement, interventions to improve social inclusion in this population must promote reciprocity within social relationships and healthy autonomy/independence (including stable housing).
Hallmark characteristics of social inclusion, for example, high-quality interpersonal relationships, are robustly associated with better health (Holt-Lunstad, Robles, & Sbarra, 2017). There is no unanimously agreed definition of social inclusion, but it is broadly considered to comprise objective and subjective factors (Berry & Greenwood, 2018). It has been defined as a sense of belongingness/acceptance in relation to opportunities to participate in valued social roles (Gardner, Filia, Killackey, & Cotton, 2019). Social inclusion initially emerged in antithesis to the established social exclusion construct (Spandler, 2007), which may be defined as a sense of loneliness/isolation in relation to dissatisfaction with opportunities to participate in such roles. This typically involves active processes of exclusion by society, for example, enforced lack of participation (Morgan, Burns, Fitzpatrick, Pinfold, & Priebe, 2007). Social inclusion and exclusion are widely considered to be dimensional opposites (Baumgartner & Burns, 2014). They are also widely agreed to be multidimensional (Huxley, Evans, & Munroe, 2006). Commonly cited dimensions include the following: social relationships, employment/education, leisure activities, housing and accommodation, financial situation and health (Filia, Jackson, Cotton, Gardner, & Killackey, 2018; Huxley et al., 2012). The particular roles that are valued across these dimensions likely differ throughout the lifespan. Focusing on subgroups defined by developmental stage may therefore be helpful – particularly during key transitions such as young adulthood (Hayes, Gray, & Edwards, 2008).
The terms youth and young adulthood have been applied somewhat interchangeably to the transition from childhood to adulthood for people in their late-teens to mid-20s (UNESCO, 2017). It is important to examine social inclusion during this stage because it appears to be a sensitive period for related processes, for example, peer group acceptance (Blakemore & Mills, 2014). Mental illness onset typically occurs during this stage and may complicate such processes (McGorry et al., 2013). Serious mental illness (SMI) is often defined by diagnosis (e.g. schizophrenia) but may be defined as any mental illness that makes it difficult for a person to complete everyday activities without assistance (Australian Bureau of Statistics, 2015).
Young adults with SMI are considered socially excluded (Social Exclusion Unit, 2005). This is largely based on evidence from objective indicators, for example, lower vocational engagement relative to peers from the general community (Iyer et al., 2018). However, subjective indicators are under-researched in this population (Sündermann, Onwumere, Bebbington, & Kuipers, 2013), where loneliness remains poorly understood (Lim, Gleeson, Alvarez-Jimenez, & Penn, 2018). Psychometric measures of social inclusion combine objective and subjective indicators (Shepherd & Parsonage, 2011). Such measures have not been used to examine group differences in social inclusion between young adults with SMI and peers from the general community: there is a lack of research targeting young adults in the social inclusion literature (Evans-Lacko et al., 2014). This makes it difficult to adequately assess group differences between young adults from the general community and those with SMI. That is, to move beyond gross discrepancies in for example, vocational engagement toward a more granular understanding that incorporates subjective perceptions of social opportunities. It is at this granular level where individual interventions may be most effective (Australian Mental Health Outcomes Classification Network, 2016).
The primary aim of this study was to examine group differences between young adults aged 18–25 with SMI and those from the general community on a newly developed measure of social inclusion. The secondary aim was to identify particular dimensions and individual indicators of social inclusion that discriminated between groups.
Method
This cross-sectional study involved analysis of baseline data from studies exploring the psychometric properties of a social inclusion measure among 18–25 year olds with SMI (Gardner, Cotton, O’Donoghue, et al., 2019) and from the general community (Gardner, Cotton, Killackey, et al., 2019). This age range was selected for reasons explained above (i.e. it appears to be a sensitive period for social inclusion).
Setting and Sample
Clinical sample
Participants were recruited from (a) Orygen Youth Health, a public mental health service for people aged 15–25 in the northwest of Melbourne, Australia; and (b) Mind Australia, youth psychosocial rehabilitation services for people aged 16–25 across Melbourne, Australia. Both services support young adults with diverse manifestations of SMI. This study employed a transdiagnostic conceptualization (Hartmann et al., 2019), reflecting the diagnostic instability endemic of early-stage SMI (Menezes & Milovan, 2000). Diagnoses of mental illness were recorded via self-report, a method used in genome-wide studies of depression (Hyde et al., 2016). Participants were approached in consultation with clinical staff from these services. Exclusion criteria were clinician-assessed symptom severity precluding informed consent (e.g. florid psychosis) and lack of fluency in English (due to pragmatic reasons).
General community sample
Participants were living in Melbourne, Australia and were recruited from a range of settings (e.g. universities, restaurants/cafés, public housing, shopping centers). Recruitment techniques included advertisement (e.g. social media, flyers/posters) and snowballing. Exclusion criteria were lack of sufficient fluency in English, and diagnosis of SMI. As this was a general community sample (not ‘healthy controls’), a diagnosis of mental illness per se did not necessarily exclude participants. Anxiety and depression are highly prevalent among the general population of young adults (Gustavson et al., 2018). General community participants reporting a lifetime mental illness diagnosis were asked followup questions to help determine whether this ought to be considered SMI. For example, they were asked whether the illness made it difficult for them to manage everyday tasks by themselves and whether they had ever accessed psychiatric services.
Measures
The Filia Social Inclusion Measure (F-SIM) is a 72-item self-report measure of social inclusion over the past month. Item creation was based on a thematic analysis identifying indicators of social inclusion (Filia et al., 2018) and a Delphi study seeking consensus on which indicators to include in the measure (Filia, Jackson, Cotton, & Killackey, 2019). The F-SIM employs dichotomous-, ordinal-, nominal- and ratio-level items to assess objective (e.g. How many of the past 12 months did you work/study for?) and subjective (e.g. I often feel unwelcome, like I don’t belong) aspects of social inclusion. Like other social inclusion measures (Coombs, Reed, & Rosen, 2016), frequencies/percentages can be used to examine responses to individual items. This maximizes clinical utility by targeting specific areas of social inclusion (Australian Mental Health Outcomes Classification Network, 2016). Items are grouped into three dimensions: Interpersonal Connections (Cronbach’s α = .94), Vocational and Financial Security (Cronbach’s α = .87) and Healthy Independent Lifestyle (Cronbach’s α = .82). The F-SIM is one of the only measures to demonstrate reliability and validity specifically among young adults aged 18–25 with SMI (Gardner, Cotton, O’Donoghue, et al., 2019). Demographic information and self-reported lifetime mental disorder diagnosis were obtained via the F-SIM. Participants were asked whether they had ever received a diagnosis from the following DSM-5 categories: depressive disorders, anxiety disorders, schizophrenia spectrum & other psychotic disorders, bipolar and related disorders, eating disorders, obsessive-compulsive and related disorders, trauma-related disorders, substance-related and addictive disorders or personality disorders. Participants who indicated that they had been diagnosed with a mental disorder at some point in their lives were asked a series of follow-up questions (e.g. history of accessing psychiatric services and/or psychiatric hospital admissions).
Ethics
This study received ethical approval from the Melbourne Health Human Research and Ethics Committee (HREC/16/MH/325) and was endorsed by the Mind Australia Research and Evaluation Committee. The Youth Research Council at Orygen, the National Centre of Excellence in Youth Mental Health, provided consumer perspective and feedback on the study plan and design. Data were collected via online surveys. Informed consent was implied by survey submission, which was explained via the participant information form. Participants received a retail voucher for their participation.
Data analyses
Analyses were conducted using IBM® SPSS® Statistics Version 25. Little’s Missing Completely at Random (MCAR) test was used to assess missing data. Descriptive statistics were inspected for accuracy of input and compared between groups. Such comparisons were conducted via bivariate logistic regressions, with group membership as the outcome variable. This method was selected so as to produce the same type of test statistic (i.e. Wald) and effect size (i.e. odds ratios) reported in the primary analysis of interest outlined below.
A four-block hierarchical logistic regression was conducted to predict membership to one of two groups: young adults aged 18–25 from the general community and young adults aged 18–25 with SMI. Logistic regression was chosen because many variables were non-continuous. There should be ⩾10 cases for each predictor variable in a logistic regression model (Vittinghoff & McCulloch, 2007). With N = 311, this afforded the inclusion of ⩽31 predictor variables. To avoid over-fitting of the model, 22 predictor variables were included. Therefore, not all F-SIM items (n = 72) could be included in the analysis. A rationale for the selection of F-SIM items is provided below.
Age and gender were entered into the first block to control for the potentially confounding effect of these variables. The dimensional structure of the F-SIM has been reported in a study examining its psychometric properties among young adults aged 18–25 with SMI (Gardner, Cotton, O’Donoghue, et al., 2019). This dimensional structure was used as a rationale for the hierarchy of the final three blocks in the model. The seven best-performing items (i.e. those with the highest dimension loadings) from the Interpersonal Connections dimension were entered as predictors in Block 2 (dimension loading range = .64–.80). The seven best-performing items from the Vocational and Financial Security dimension (loading range = .48–.80) were entered as predictors in Block 3. Finally, the seven best-performing items from the Healthy Independent Lifestyle dimension (loading range = .46–.70) were entered as predictors in Block 4. Figure 1 depicts the four blocks of the hierarchical logistic regression and details the individual F-SIM items included within each block.
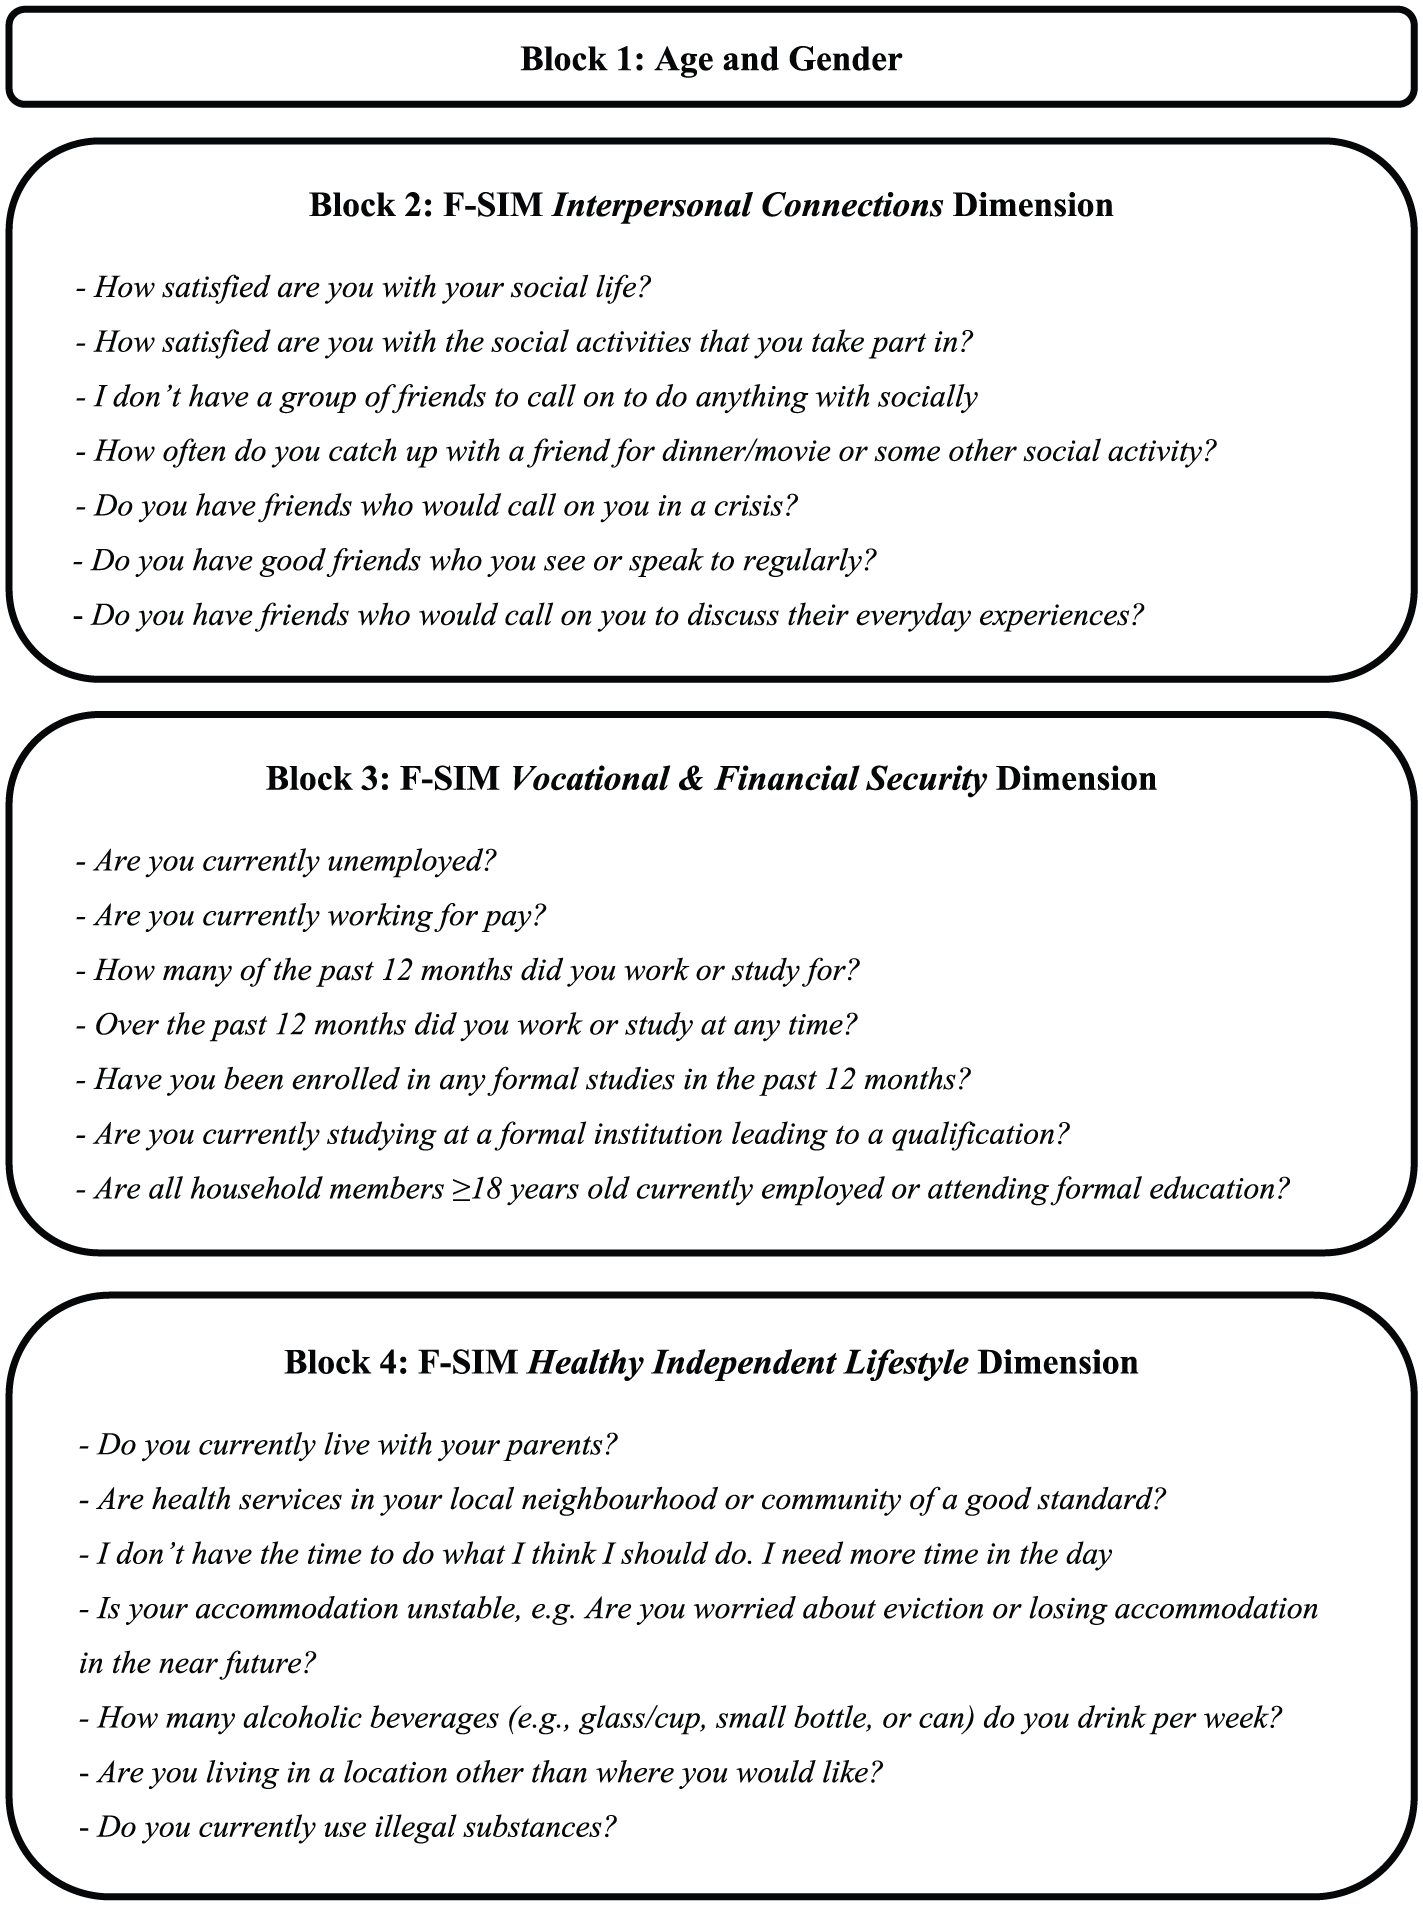
F-SIM dimensions that comprise each block, and the individual F-SIM item indicators within each dimension, for the hierarchical logistic regression with group membership (general community = 0, serious mental illness = 1) as the outcome variable.
From the logistic regression model, we were able to determine how each block contributed to the explanation of group differences. Omnibus tests of model coefficients were examined to determine chi-square change between blocks (
Results
Cohort characteristics
Between April 2017 and August 2018, N = 311 participants (general community n = 152; SMI n = 159) completed surveys. Table 1 describes the two samples. In the SMI group, seven people identified as transgender and seven did not identify as female, male or transgender. In the general community group, one individual identified as transgender. There were no significant differences in age or binary gender (male/female) between groups. Young adults with SMI were six times less likely to have access to the Internet at home (OR = 0.16, 95%CI [0.04, 0.74], p = .02) and two-and-a-half times less likely to have a current drivers license, (OR = 0.38, 95%CI [0.23, 0.62], p < .001). Young adults with SMI were three times less likely to receive income from work/study (OR = 0.34, 95%CI [0.22, 0.55], p < .001), six-and-a-half times more likely to receive government payments (OR = 6.54, 95%CI [3.92, 10.87], p < .001) and almost four times less likely to receive money from family members (OR = 0.27, 95%CI [0.15, 0.46], p < .001). The most commonly self-reported diagnostic categories in the SMI group were depression (53%, n = 84), anxiety (43%, n = 69) and schizophrenia spectrum disorders (30%, n = 48). Comorbidity was common: 64% (n = 103) in the SMI group reported more than one diagnosis of mental illness. In the general community group, n = 7 reported the following lifetime diagnoses: anxiety disorders (2.63%, n = 4), depressive disorders (1.32%, n = 2), eating disorders (1.32%, n = 2), trauma-related disorders (0.66%, n = 1) and obsessive-compulsive-related disorders (0.66%, n = 1). None of these seven participants reported that the illness made it difficult for them to complete everyday tasks by themselves or that they had ever accessed psychiatric services. Hence they were retained in the general community sample.
Demographic and other characteristics of (a) a sample of young people aged 18–25 from the general community (GC) and (b) a sample of young people aged 18–25 with serious mental illness (SMI).
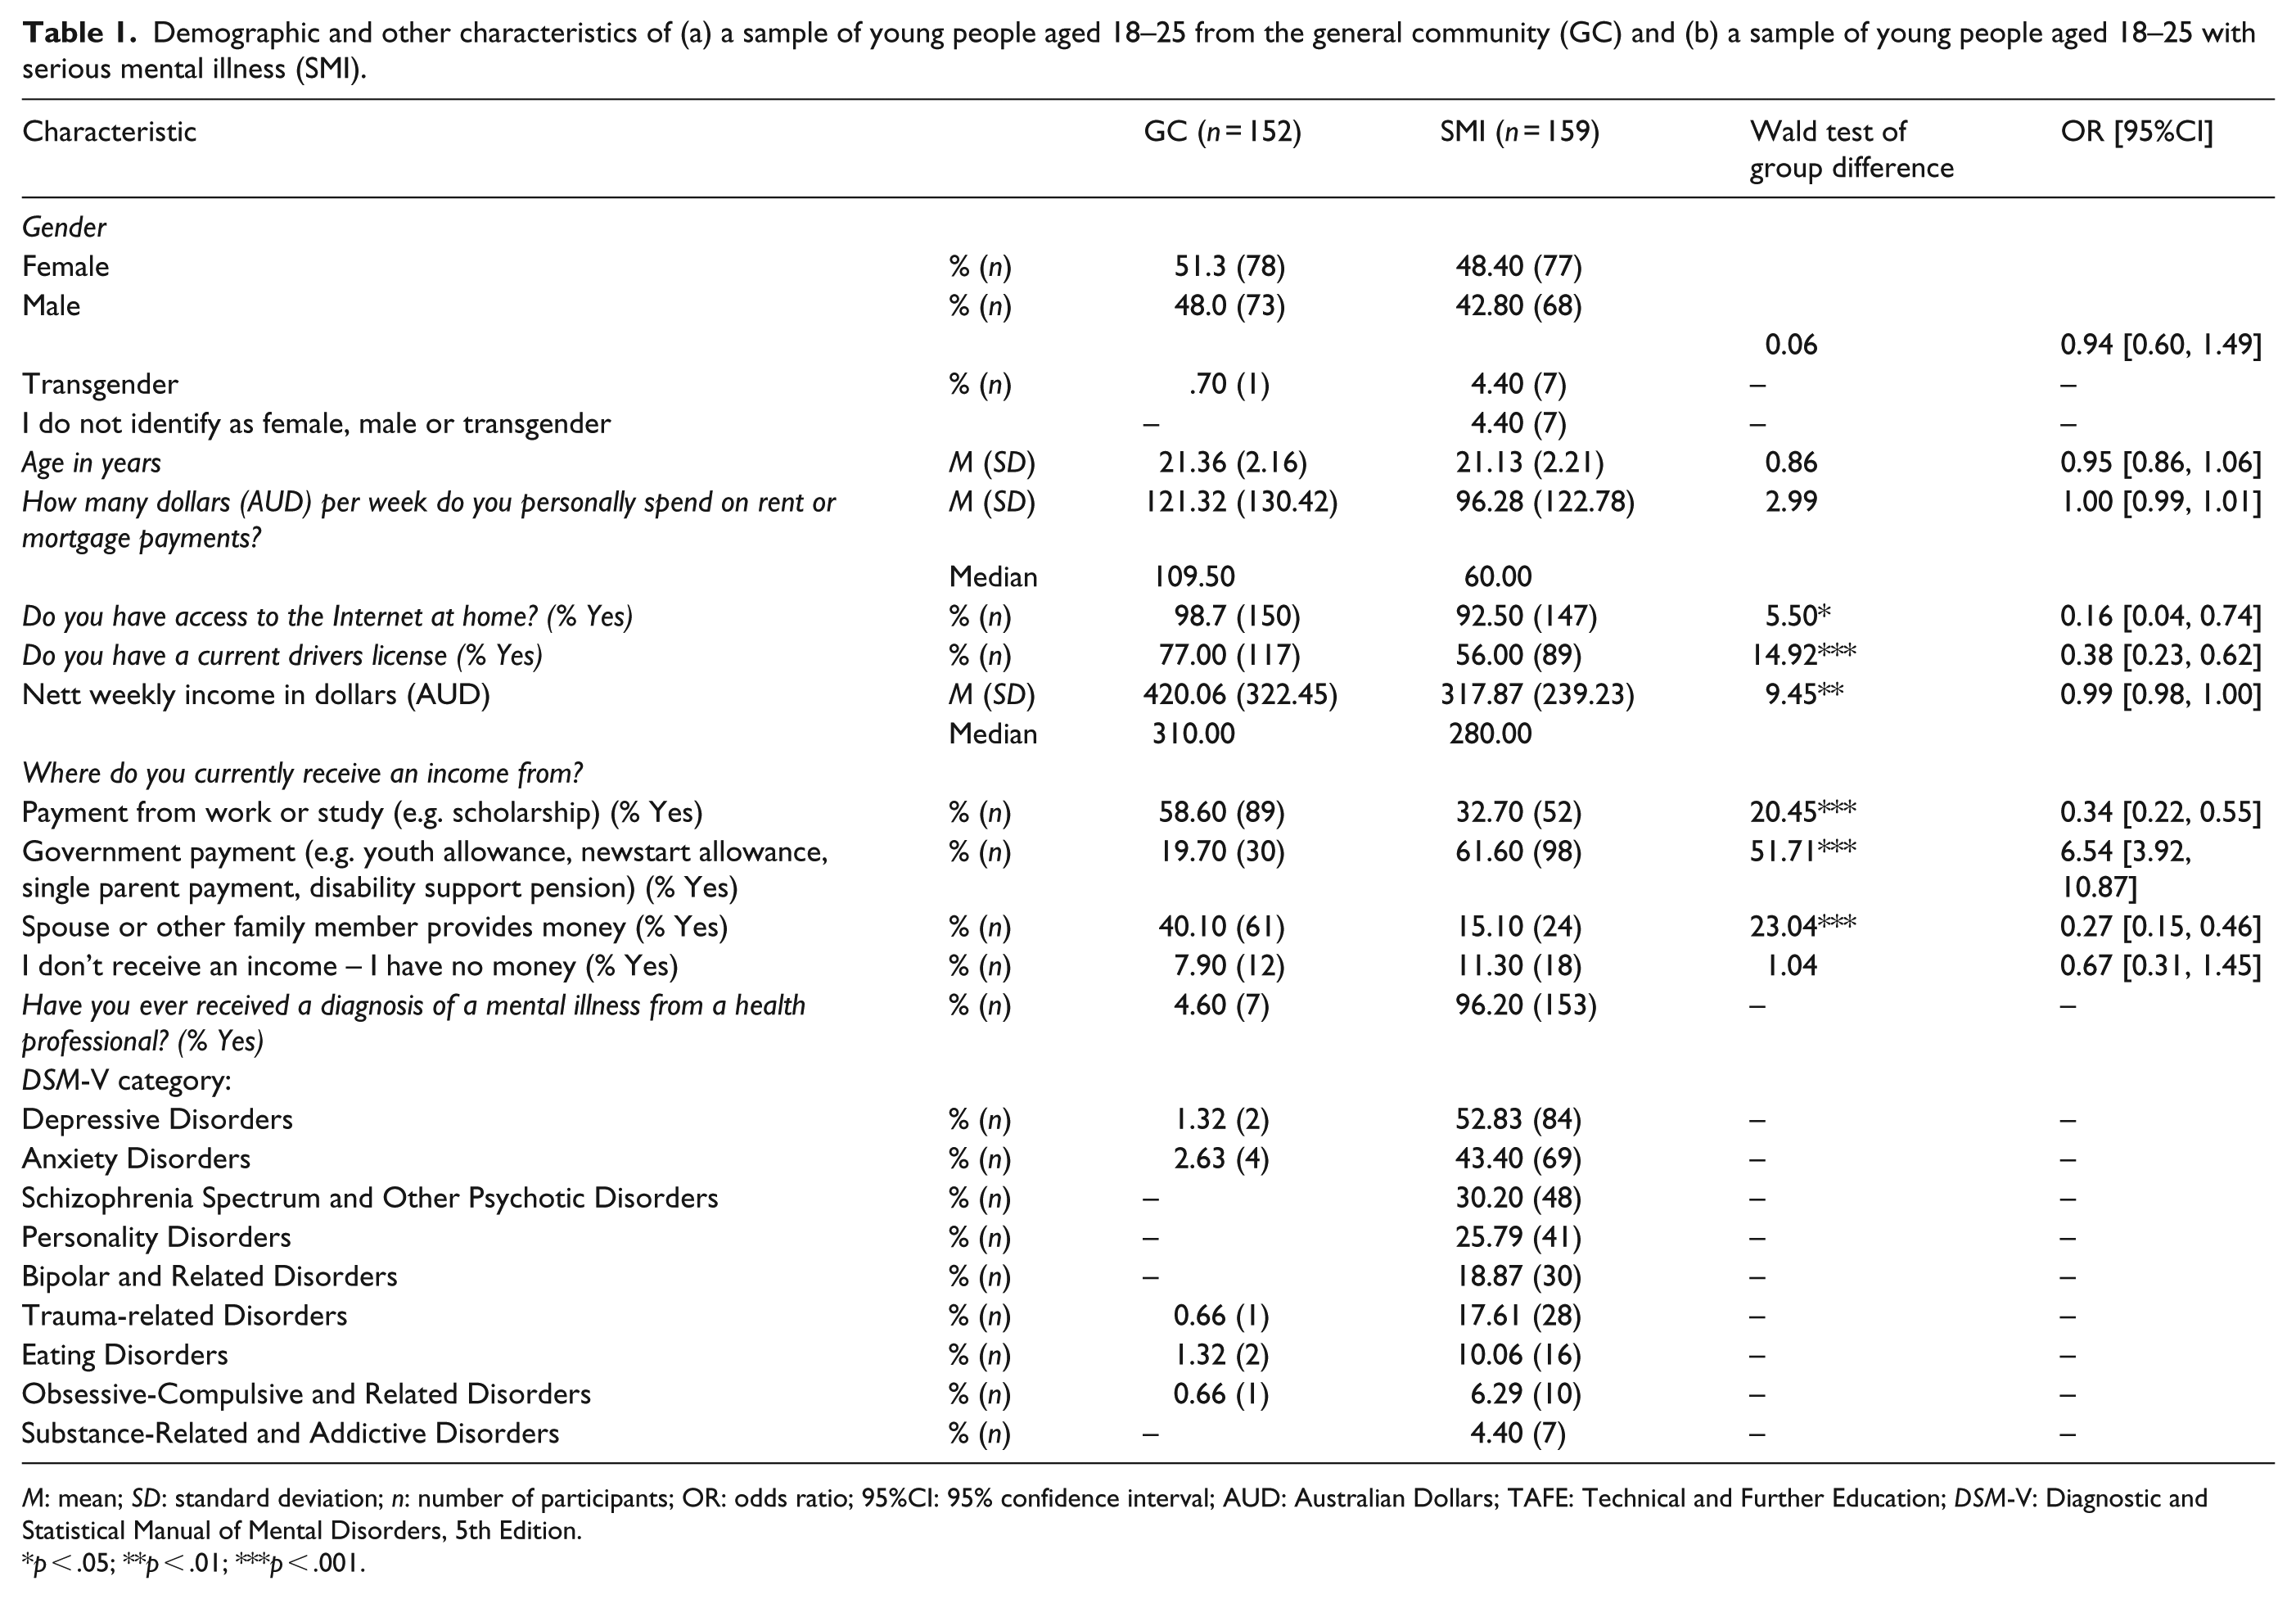
M: mean; SD: standard deviation; n: number of participants; OR: odds ratio; 95%CI: 95% confidence interval; AUD: Australian Dollars; TAFE: Technical and Further Education; DSM-V: Diagnostic and Statistical Manual of Mental Disorders, 5th Edition.
p < .05; **p < .01; ***p < .001.
Logistic regression to predict group membership
Statistical assumptions require ⩾5 observations in 80% of cells for χ2 analyses (McHugh, 2013). Hence two logistic regressions were performed: one without n = 15 participants who did not identify as male or female and one including these participants but dropping the gender variable from the analysis. Binary gender did not predict group membership. The two analyses produced near identical results (e.g. statistically significant individual predictors of group membership were exactly the same). In the spirit of inclusion, results of the logistic regression that excluded the gender variable and included all participants are reported here.
Age was entered in Block 1 of the hierarchical logistic regression, explaining <1% of variance in group membership, over and above that which was explained by the constant in Block 0. Seven items from the Interpersonal Connections dimension of the F-SIM were entered in Block 2. After controlling for age, this block explained a statistically significant additional 32% of variance in group membership, Nagelkerke R2 = .32,
Table 2 provides a summary including individual variables that made a unique statistically significant contribution to the final model. Given group membership coding (general community = 0, SMI = 1), an OR between 0 and 1 denotes reduced likelihood for the SMI group whereas an OR > 1 denotes increased likelihood for the SMI group. Young adults with SMI were five times less likely to feel they had friends who would call on them in a crisis (OR = 0.19, 95%CI [0.04, 0.52], p = .04) and almost five times more likely to live with their parents (OR = 4.79, 95%CI [1.98, 11.15], p < .001). They were almost four times less likely to have worked/studied at any time in the past 12 months (OR = 0.27, 95%CI [0.11, 0.64], p < .001) and three-and-a-half times more likely to report unstable accommodation (OR = 3.58, 95%CI [1.14, 11.15], p = .04). Young adults with SMI were more than two times less likely to be currently studying at a formal institution (OR = 0.44, 95%CI [0.30, 0.64], p < .001). For every month worked/studied over the past 12 months, SMI group membership was 33% less likely than general community group membership (OR = 0.67, 95%CI [0.56, 0.81], p < .001). For every glass/cup, small bottle or can of alcoholic beverage consumed per week, SMI group membership was 1.18 times more likely (OR = 1.18, 95%CI [1.02, 1.37], p = .02).
Summary of the hierarchical logistic regression with group membership of N = 311 young adults aged 18–25 years (GC = 0, SMI = 1) as the outcome variable and age entered in Block 1, F-SIM Interpersonal Connections dimension items entered in Block 2, F-SIM Vocational and Financial Security dimension items entered in Block 3 and F-SIM Healthy Independent Lifestyle dimension items entered in Block 4 as predictor variables.
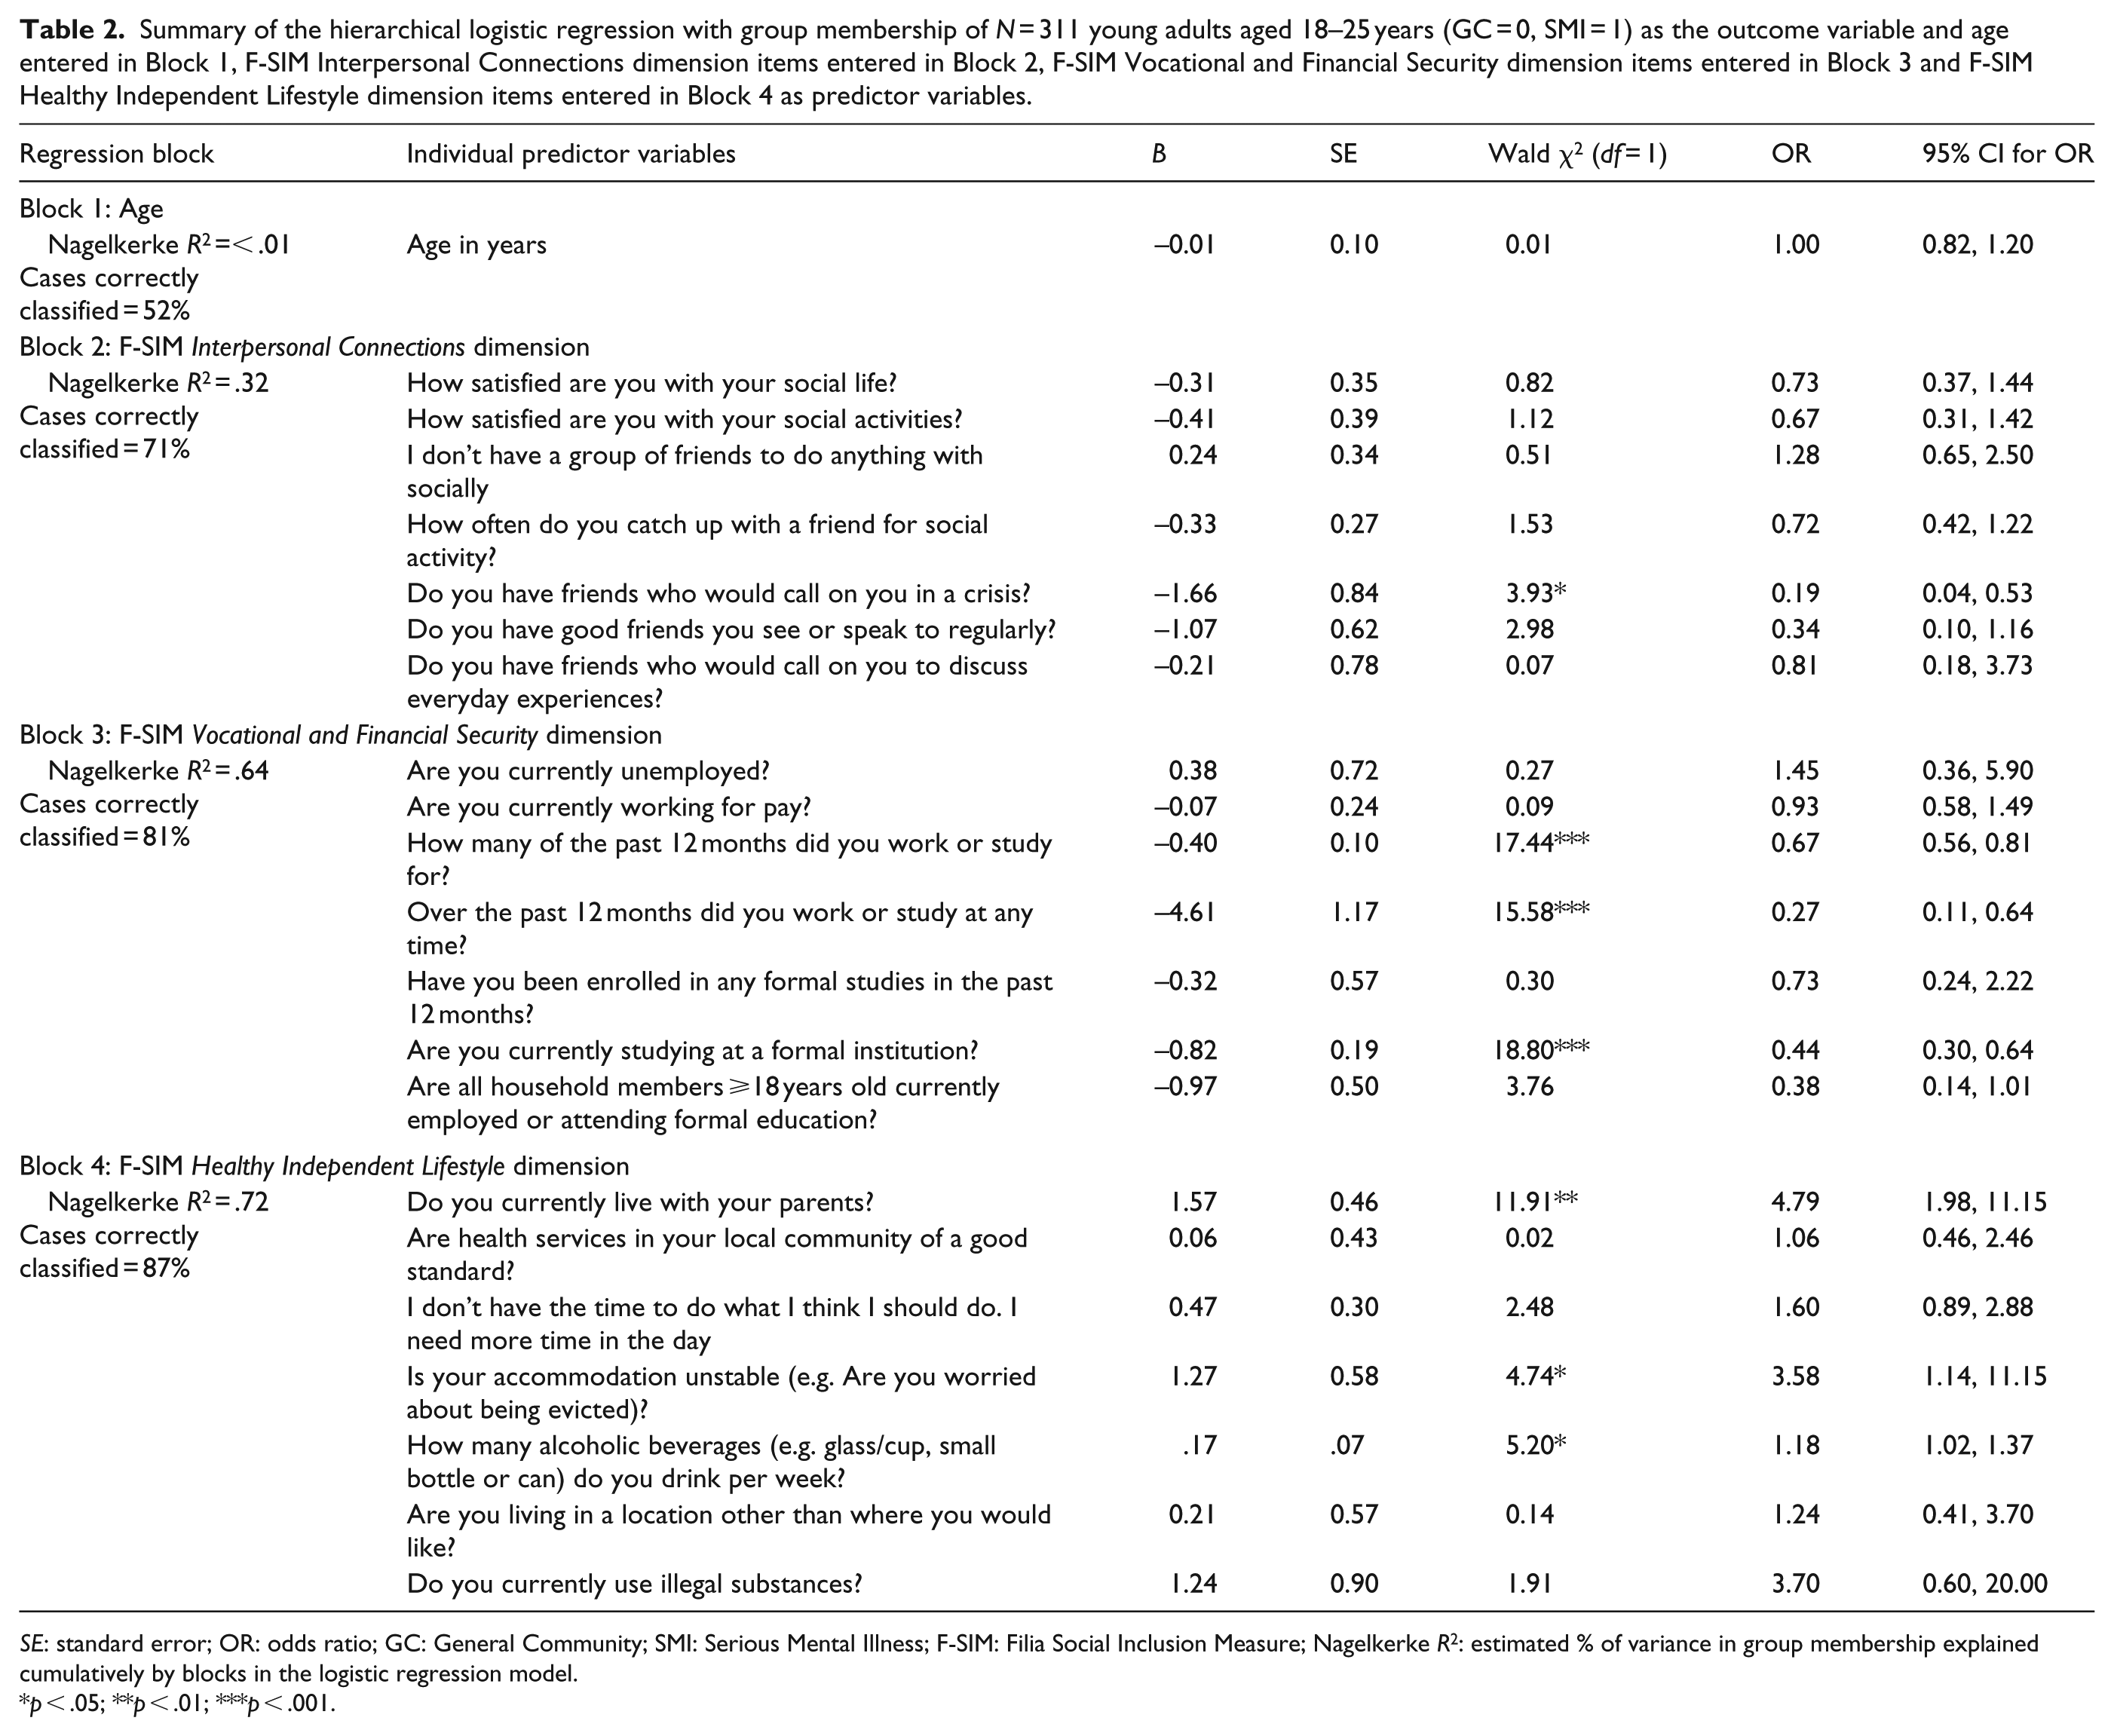
SE: standard error; OR: odds ratio; GC: General Community; SMI: Serious Mental Illness; F-SIM: Filia Social Inclusion Measure; Nagelkerke R2: estimated % of variance in group membership explained cumulatively by blocks in the logistic regression model.
p < .05; **p < .01; ***p < .001.
Discussion
To our knowledge, this is the first study to use a psychometric measure of social inclusion to examine group differences between young adults aged 18–25 with SMI and those from the general community. This contributes to the much-needed establishment of normative and clinical data regarding social inclusion among young adult populations (Evans-Lacko et al., 2014). It also deepens understanding of gross objective discrepancies (e.g. smaller social networks) by elucidating nuances of the social exclusion experienced by young adults with SMI. In so doing, these findings suggest the need for novel approaches to improving social inclusion in this population.
Summary of findings
The F-SIM dimensions of Interpersonal Connections, Vocational and Financial Security and Healthy Independent Lifestyle significantly discriminated between groups and accounted for a large amount of variation in group membership. Individual indicators suggested that young adults with SMI were socially excluded relative to peers from the general community in a number of areas. Those with SMI were significantly less likely to feel they had friends who would call on them in a crisis, to have been vocationally engaged in the past year, and to be currently studying at a formal institution. They were significantly more likely to live with their parents and to report unstable accommodation. This logistic regression model demonstrated a high level of accuracy in group classification. Alongside evidence that young people at risk of developing SMI are socially excluded (Robustelli, Newberry, Whisman, & Mittal, 2017), these findings suggest that models of social inclusion may have a part to play in the early identification of SMI.
Comparison to previous literature
Comparisons to previous literature are complicated by the lack of studies using psychometric measures of social inclusion to examine group differences between young adults from the general community and those with SMI. Nonetheless, these findings are consistent with evidence that young adults with SMI have smaller social networks (Gayer-Anderson & Morgan, 2013), are less vocationally engaged (Iyer et al., 2018), experience lower levels of independence (Breitborde, Woolverton, Frost, & Kiewel, 2014) and higher levels of housing instability (Narendorf, Cross, Santa Maria, Swank, & Bordnick, 2017) than those from the general community.
The findings support evidence that vocational engagement contributes to social inclusion for young adults with SMI (Gardner, Cotton, Allott, et al., 2019). They also suggest subtle differences in historical versus current vocational engagement and in employment-specific versus education-specific factors. Unspecified historical vocational engagement (i.e. Did you work or study at any time over the past year?) significantly discriminated between groups. The education-specific indicator of enrolment in formal studies over the past year did not discriminate between groups. This raises the question as to whether observed differences in vocational engagement over the past year were driven by employment-specific factors. Young adults with SMI may have been less likely to have worked, but not necessarily less likely to have studied, than their peers from the general community over the past year. This remains speculative, because no indicators exclusively assessing work history over the past year were included in the analysis. It is also important to distinguish enrolment in formal studies from attendance at such studies. Although young adults with SMI were not significantly less likely to be enrolled in formal education over the past year, they were significantly less likely to be currently attending an educational institution. This is consistent with evidence that young adults with SMI are less likely to be engaged in postsecondary education than peers from the general community (Roy, Rousseau, Fortier, & Mottard, 2016). It also suggests that there may be some utility in examining discrepancies between rates of enrolment and rates of attendance in educational settings for young adults with SMI. Such discrepancies may provide a useful index of the disruption that SMI can engender for affected young people.
In this study, indicators of current unemployment did not significantly discriminate between groups. This is inconsistent with evidence of a higher unemployment rate among young adults with SMI relative to peers from the general community (Ramsay, Stewart, & Compton, 2012). Methodological differences may have contributed to this inconsistency. Ramsay and colleagues included a wider age range for participants (18–40 years-of-age) and found that age was independently associated with unemployment. That is, younger age predicted higher unemployment. A relatively restricted age range in this study (i.e. 18–25) may have precluded us from detecting such an effect. Periods of unemployment, though likely detrimental to wellbeing, are commonly experienced by people in this age group (Lee et al., 2019). This may partly obscure the effects of illness-related employment difficulties for young adults with SMI, with such effects emerging from early to middle adulthood.
Clinical implications
Increased social inclusion (e.g. improved social relationships and vocational engagement) is a common treatment goal among young adults with SMI (Cotton et al., 2011; Iyer, Mangala, Anitha, Thara, & Malla, 2011; Ramsay et al., 2011). Individual Placement and Support (IPS) is an intervention that has demonstrated efficacy in terms of increasing vocational engagement for young adults with SMI (Killackey et al., 2019). However, perceptions of social exclusion in terms of interpersonal relationships are an important and under-researched treatment area in this population (Lim & Gleeson, 2014). The findings of the present study suggest that interventions to improve social inclusion should target such perceptions in addition to increasing vocational engagement. Young adults with SMI were significantly more likely to perceive that they had no friends who would call on them in a crisis, with a large effect size. The smaller social networks observed in this population likely reduce opportunities for young adults with SMI to receive interpersonal support. However, they may also reduce opportunities for young adults with SMI to demonstrate their ability to provide support to others – a crucial element of the reciprocity involved in satisfying interpersonal relationships. An implication of this finding is that interventions to improve social inclusion in this population need to address peer attitudes, beliefs and behaviors toward young adults with SMI. That is, a whole-of-community approach may be most effective (Saavedra, Pérez, Crawford, & Arias, 2017).
Relative to those from the general community, young adults with SMI were more likely to live with their parents, with a large effect size. Although it may be argued that this provides necessary social support for some individuals, there is evidence that living with parents is negatively associated with social inclusion for young adults with SMI (Gardner, Cotton, O’Donoghue, et al., 2019). Social inclusion interventions may therefore need to help empower young adults with SMI to establish an optimal level of autonomy/independence while ensuring access to support. Young adults with SMI were also more likely to report unstable accommodation, with a large effect size. This suggests a role for housing support services in any interventions aimed at promoting adaptive autonomy/independence in this population.
These findings have several implications regarding how early intervention services may best respond to the psychosocial needs of their clients. It may be helpful for clinicians to ask whether young adults with SMI feel they have opportunities to demonstrate their capacity to be a source of support to others. This may be an overlooked element of social inclusion compared to the more common enquiries about available support from others. Related to this are notions of autonomy and independence. It may be helpful for clinicians to assess how satisfied young adults with SMI are with their level of independence (particularly as it relates to living situation), while being sensitive to individual support needs. Such approaches may be combined with evidence-based vocational programs (e.g. IPS) to improve social inclusion for young adults with SMI.
Strengths and limitations
It is plausible that mental illness causes social exclusion (the ‘social drift’ hypothesis), and plausible that social exclusion causes mental illness (the ‘social causation’ hypothesis (O’Donoghue, Roche, & Lane, 2016)). A limitation of this study is that causality cannot be inferred from these cross-sectional, correlational findings. Given that the F-SIM is administered entirely via self-report, none of its items can be considered strictly objective. This is a further limitation. However, the F-SIM has been developed through consultation with experts, carers and consumers (Filia et al., 2019). Also, its psychometric properties have been examined specifically among young adults with SMI (Gardner, Cotton, O’Donoghue, et al., 2019). These are strengths of the study. Another strength is the item-level examination of social inclusion variables, which afforded a sufficiently granular level of detail so as to be clinically informative. The novelty of the finding that young adults with SMI were less likely to experience reciprocity in interpersonal relationships is another strength. It is important to note that the 95%CI around the OR for this effect was relatively wide, and its lower bound estimate was approaching zero. This highlights the need for replication of the effect, and is a potential limitation.
Future research directions
It will be helpful for future research to further examine actual and perceived reciprocity in interpersonal relationships (e.g. do members of the wider peer group around young adults with SMI note the proposed discrepancy in reciprocity?). Exploring additional methods for measuring reciprocity may help increase the precision of the proposed effect. There is no ‘gold standard’ measure of social inclusion – existing tools require ongoing development (Cordier, Milbourn, Martin, Buchanan, & Chung, 2017). This includes the F-SIM, which is one of the first measures to examine social inclusion specifically among young adults with SMI (Gardner, Cotton, O’Donoghue, et al., 2019). Although it has demonstrated reliability and validity in this population, the F-SIM requires further refinement to become clinically useful (e.g. the production of a shortened version). It would also be helpful to examine potential mediators of the relationship between group membership (general community vs SMI) and social inclusion among young adults. There is evidence that self-stigma predicts reduced social inclusion for young adults with SMI (Berry & Greenwood, 2018). Further examination of such potentially mediating variables may enable the development of more effectively targeted interventions.
Conclusion
Young adults with SMI are considered socially excluded relative to peers from the general community, but this has not been examined via psychometric measures of social inclusion. We undertook such an examination and found evidence of social exclusion in terms of interpersonal connections, vocational engagement and independence. Improving the social inclusion of young adults with SMI may involve addressing peer attitudes and maximizing independence, in addition to the more established vocational interventions.
Footnotes
Acknowledgements
This article was completed while the corresponding author was receiving a Research Training Program scholarship from the Australian Government Department of Education and Training.
Conflict of interest
The author(s) declared no potential conflicts of interest with respect to the research, authorship and/or publication of this article.
Funding
The author(s) received no financial support for the research, authorship and/or publication of this article.