
Abstract
This study explored the relationship between belief in conspiracy theories and the personality disorders. A sample of 475 British adults, aged around 30 years, completed measures of Belief in Conspiracy Theories (CTs) and the Personality Disorders (PDs), as well as the SAPAS, a short intelligence test and two self-evaluations. Belief in CTs was correlated with nearly all PDs, as well as the three established higher order clusters (A: odd and eccentric; B: dramatic and emotional; C: anxious). A series of stepwise multiple regressions were computed. A final regression showed five of the variables (education, intelligence, Cluster A, B, and C) were significant, which indicated that less well-educated and less intelligent participants, scoring higher on two PD clusters (Cluster A and B) but lower on Cluster C, believed more in the CTs. Implications of the study for understanding the origin of CTs is discussed. Limitations of the study, particularly the sample and measures used, are acknowledged.
Introduction
Conspiracist beliefs and theories are defined as essentially false narratives where multiple agents are believed to be working together toward malevolent ends (Douglas et al., 2017; Furnham, 2021a; Georgiou et al., 2019; Hart & Graether, 2018; Swami, 2012). There is now a thriving literature on this topic (Barron et al., 2018; Franks et al., 2013, 2017; Swami, 2012). Douglas et al. (2019) note that they are essentially attempts to explain the ultimate causes of significant social and political events by claims of secret plots concerning two or more powerful actors. Belief in conspiracy theories (CTs) have attracted a great deal of recent research (Goreis & Voracek, 2019). One recent study found that conspiracy beliefs were associated with a range of personality disorder features and internalizing symptoms (Bowes et al., 2021), which is the main focus of this study.
Researchers have conceptualized conspiracy theories as both a rational narratives of the world but also the possibly the outcome of psychopathology (Nefes,2015). It has been suggested that conspiracy theories (CTs) help make sense of events that are confusing, difficult to comprehend or poorly explained by mainstream sources of information (Swami & Furnham, 2012). Others suggest that there are maladaptive cognitive-perceptual traits that contribute to the formation or maintenance of CTs (van Elk, 2015). In a recent extensive review, Douglas et al. (2019) concluded that there is evidence that conspiracy theories appear to appeal to individuals who seek accuracy and/or meaning, lack the cognitive tools, or experience problems. This paper will explore both hypotheses, namely that belief in CT is related to psychopathology and cognitive ability.
Studies have explored beliefs in CTs and traits such as paranoia, magical ideation, and belief in the paranormal (Brotherton & Eser, 2015; Lobato et al., 2014; Swami et al., 2011). Various studies have also found positive associations between belief in CTs and schizotypy (Darwin et al., 2011; Swami et al., 2016). They have suggested that traits of suspiciousness seen in high schizotypal individuals may result in them disbelieving official or mainstream sources of information. Goreis and Voracek (2019) noted conspiracies appeal to those who feel disconnected from society, unhappy in their lives, and who have a worldview that includes unusual beliefs, experiences, and thoughts. They also suggest that they have higher levels of clinically relevant traits such as paranoid thought and schizotypy.
There have been a number of studies using different measures to examine the relationships between mental illness and the Personality Disorders (PDs). Swami et al. (2016) used the dimensional trait model of individual differences in personality disorders, included in Section III of the DSM-5 (American Psychiatric Association, 2015). This model proposes 25 trait facets that are classified into five broad trait domains, four that are suggested to be common to both normal and abnormal personality variation (Antagonism, Negative Affectivity, Detachment, and Disinhibition) and a Psychoticism domain that subsumes traits of schizotypy and dissociation (Krueger et al., 2012). This trait assessment provides a multi-level description of personality disorders for the DSM-5 and provides a key step in building models of personality pathology. This study uses a validated measure that assesses the DSM-IV disorders
They argued that by using broad dimensions that span normative and pathological functioning, it is possible to develop a reliable scaffold to understand the nature of conspiracist ideation. They found that the PID-5 facets of Unusual Beliefs and Experiences and, to a lesser extent, Suspiciousness, significantly predicted belief in conspiracy theories. They suggest that exploring further the link between various disorders and CTs would help scholars better understand the etiology and maintenance of CTs.
Personality disorder traits
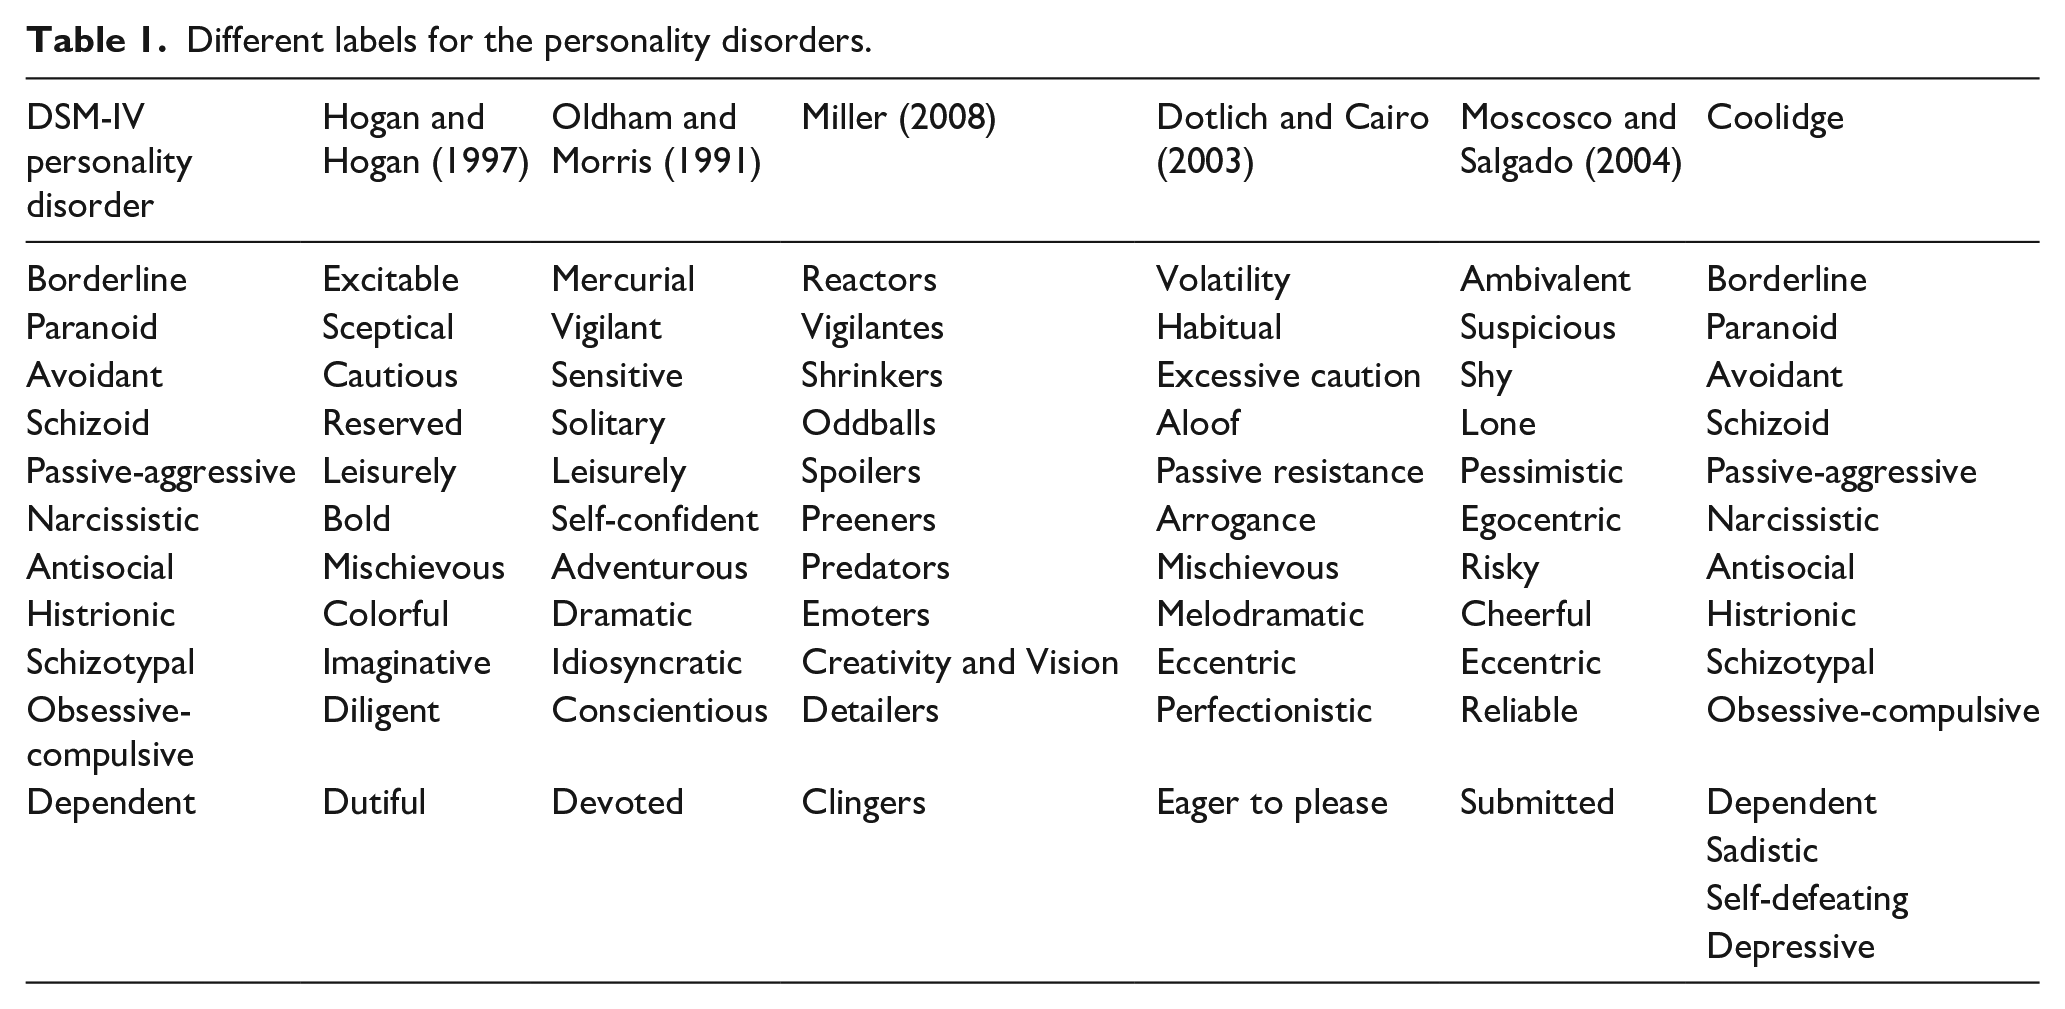
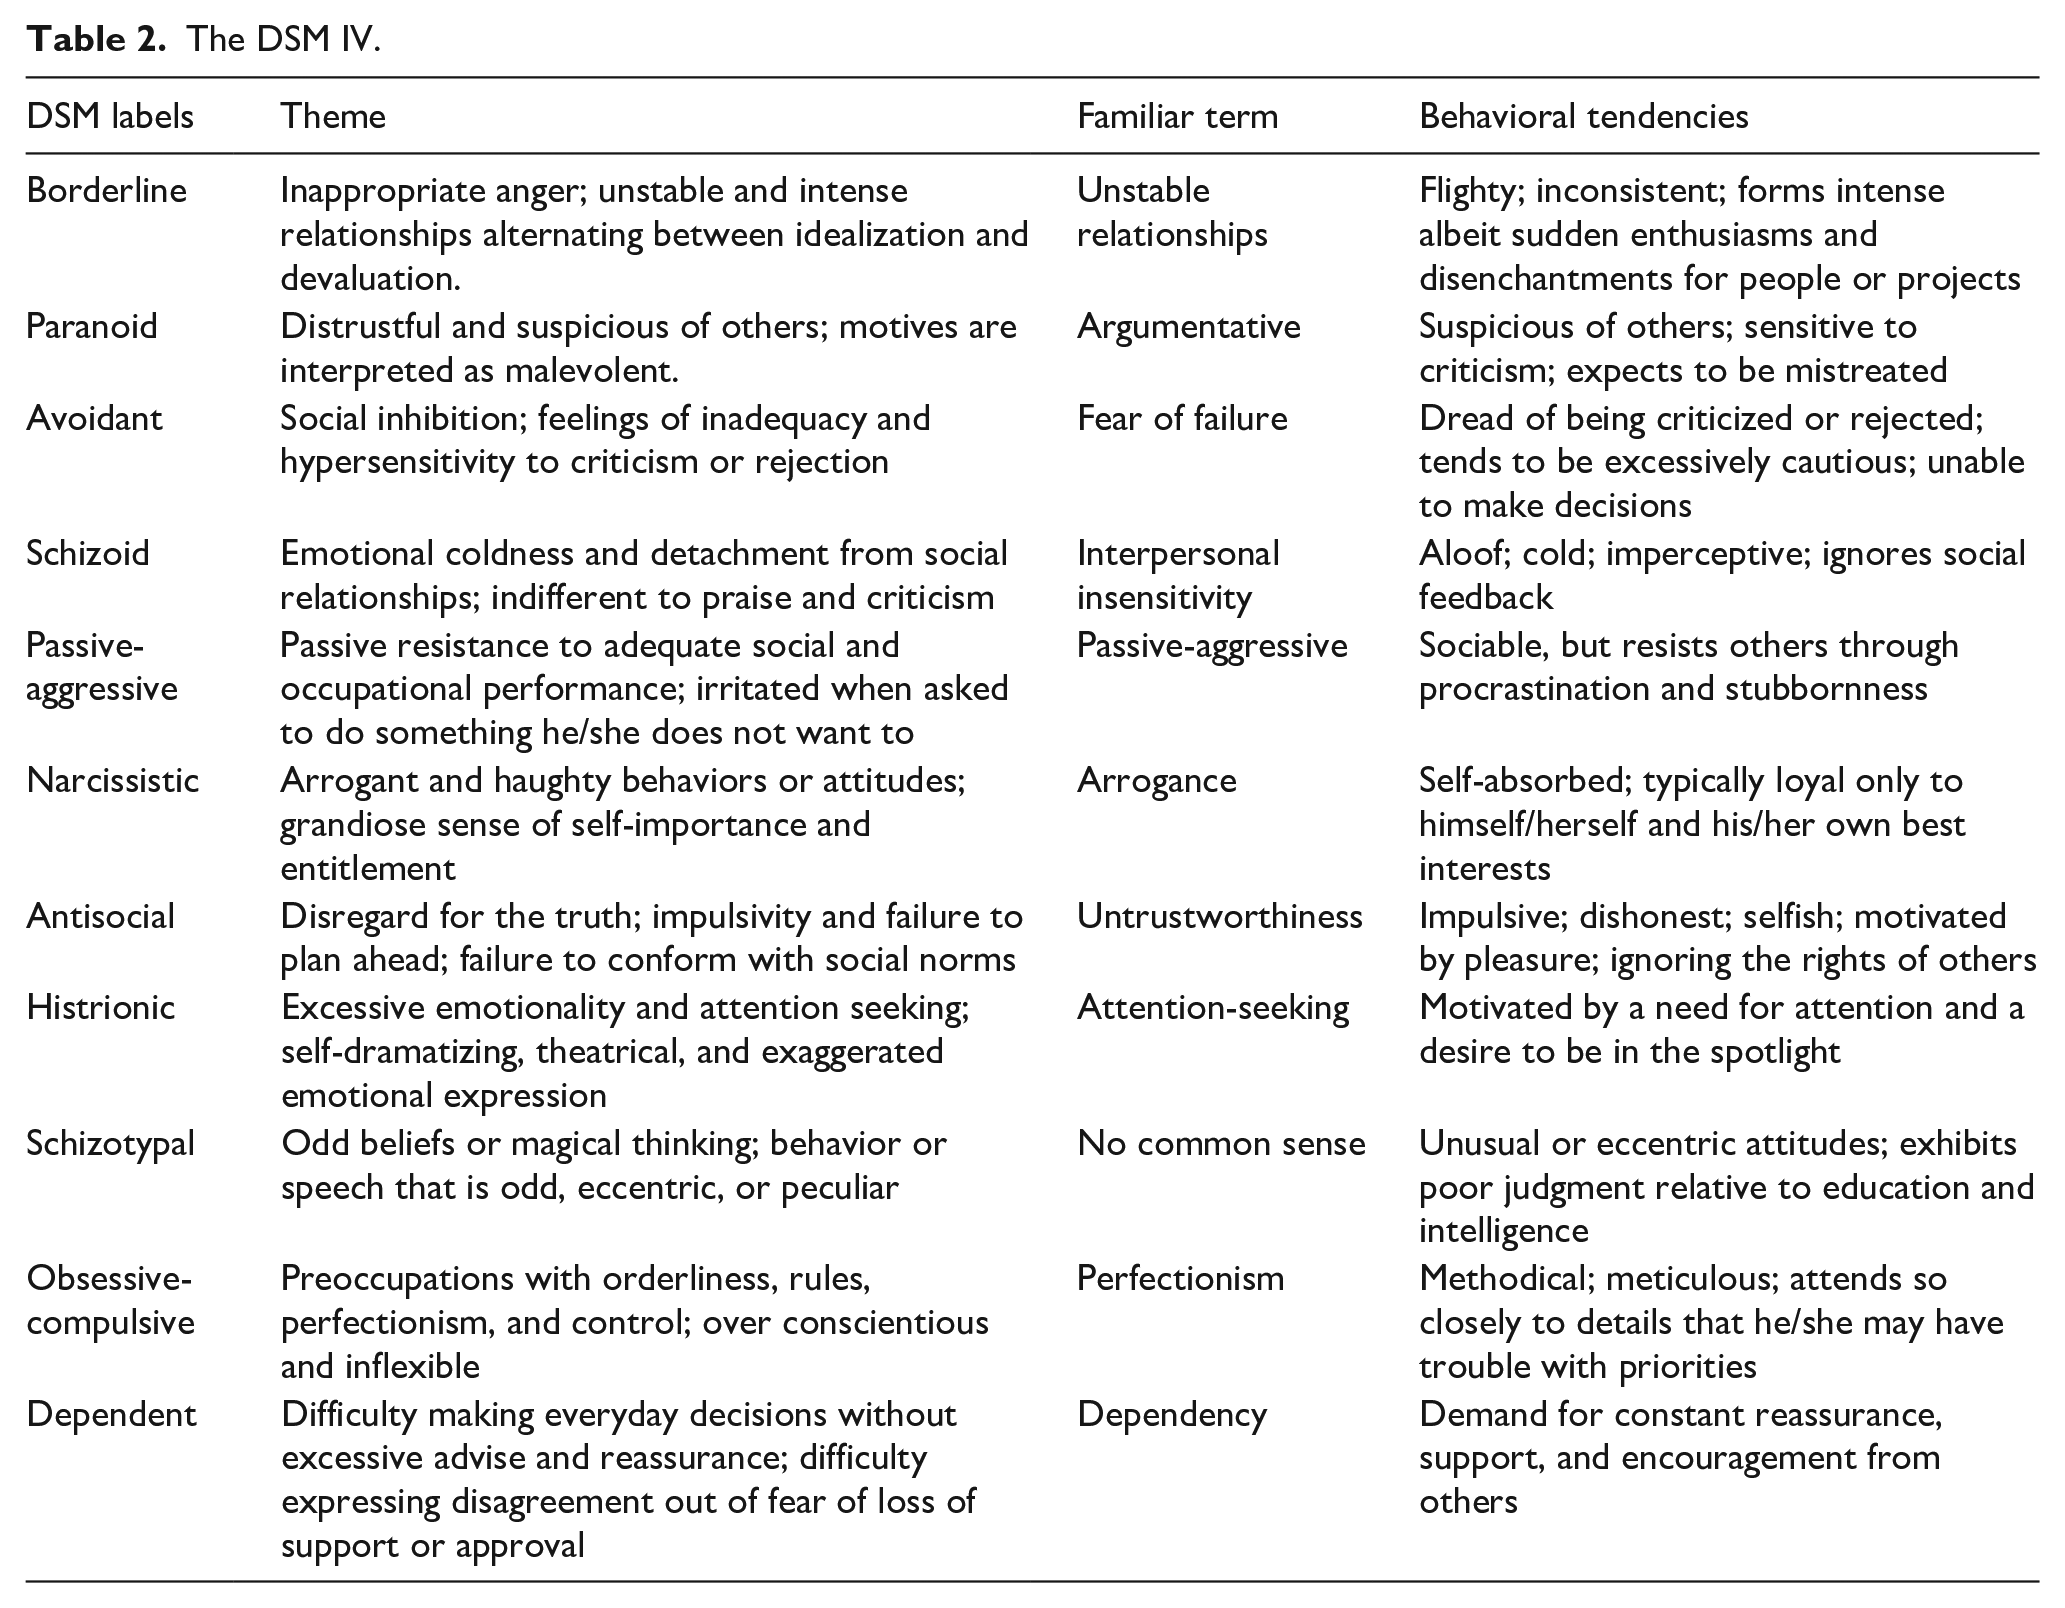
The various PDs have been labeled differently by different authors (see Tables 1 and 2).
Different labels for the personality disorders.
The DSM IV.
There are many different measures of the personality disorders, which can be measured by single item, a single disorder, or by many (Furnham et al., 2014). In the Diagnostic and Statistical Manual of Mental Disorders, fourth edition, (DSM-IV) PDs are grouped into three clusters: ‘A’ – odd, ‘B’ – dramatic/emotional, and ‘C’ – anxious (American Psychiatric Association, 2000). We shall be using this system whilst we recognize there are others such as the ICD system which classifies people into mild, moderate, and severe PD disorders (Bach & First, 2018; Furnham, 2021b).
Many studies do analysis at the PD and higher order factors. Note that there were no fundamental changes in the new DSM-V (American Psychiatric Association, 2015) regarding the classification of the PDs. Although the DSM-IV describes disorders as being ‘enduring, inflexible, and long-term’ (American Psychological Association, 2000, p. 686), studies reveal disorders are generally less prevalent with age (Segal et al., 2001).
In this study we used the 70-item Coolidge Axis-II Inventory – Short Form (SCATI) (Coolidge, 2001). It has been used to predict PDs in subclinical (Coolidge et al., 2010) and clinical (Watson & Sinha, 1996) populations. It has been used in a number of studies (Segal et al., 2001, 2006). For instance, Davison and Furnham (2017) looked at the SCATI PD trait profiles of 214 professional actors compared to a general population sample. Other studies looking at sub-clinical PDs have shown them to be related to a wide variety of social attitudes and behaviors including money beliefs and behaviors (Furnham, 2015).
Comparatively few studies have looked at the relationship between PDs and CTs. One exception is the study by March and Springer (2019) who examined the relationship between schizotypy, Machiavellianism, grandiose narcissism, vulnerable narcissism, primary and secondary psychopathy in predicting belief in conspiracy theories. In a study of 230 Australian undergraduates, they found odd beliefs/magical thinking, trait Machiavellianism, and primary psychopathy were significant, positive predictors of belief in CTs. They concluded that individual more likely to believe in CTs have unusual patterns of thinking and cognitions, be strategic and manipulative, and display interpersonal and affective deficits.
This study
The current study aimed to investigate the PD correlates of CTs. Previous studies using different measures of the PDs have suggested that certain PDs like Schizotypy (H1) and Paranoia (H2) would be related to the CTs. This study will attempt to replicate this. We also believe that other disorders like Borderline PD (H3) would be positively correlated with CTs because of the ‘disturbed cognition’ factor part of Borderline PD. The advantage of using the SCATI is that we can examine the relationship between the Clusters and CTs. From the previous literature we predict that both Cluster A, and to a lesser extent Cluster B, would be positively (H5) related to beliefs in CTs (Furnham, 2019). This is because Cluster A contains both Schizotypal and Paranoid PDs, demonstrated to relate to CTs.
We also know that various other factors are related to PDs. In this study we examine four of these. The first is demographics: sex, age, education. We predict that age (H6) would be positively, and education (H7) negatively, related to believe in CTs. The second is positive self-esteem and self-concept. In this study we measured self-ratings of health and attractiveness, which we summed, hypothesizing that high-ratings would be negatively related to CTs (H8). We also included a short IQ measure to test the hypothesis that IQ is negatively correlated with beliefs in the CTs (H9). Finally, we used a short eight-items screening measure for the CTs, namely the SAPAS, predicting that those more prone to having any/all PDs would have higher CT scores (H10).
Method
Participants
There were 475 British participants, of which 240 were males. Their average age was 29.08 years (SD = 12.32), with a skew toward younger people in their late 20s. In all 146 (31%) had a high school certificate, 173 (36%) an undergraduate degree, and 90 (19%) a postgraduate degree as their highest qualification. Also, 73% were not at all religious and 4% very religious, with the rest between these two extremes.
Measures
1. Coolidge Axis-II Inventory – Short Form (SCATI) (Coolidge, 2001). The 70-item self-report measure assesses 14 personality disorders, 10 from DSM-V, 2 from Cluster B of the DSM-IV-TR (Depressive and Passive Aggressive), and 2 from DSM-III-R (Sadistic and Self-Defeating). The SCATI has good internal scale and test-retest reliability (Watson & Sinha, 1996). It has been used to predict PDs in subclinical (Coolidge et al., 2010) and clinical (Watson & Sinha, 1996) populations. The reliability of this measure in this study is as followed: Antisocial (.66), Avoidant (.80), Borderline (.73), Dependent (.68), Depressive (.83), Histrionic (.64), Narcissistic (.68), Obsessive-Compulsive (.61), Paranoid (.76), Passive-Aggressive (.64), Sadistic (.68), Self-defeating (.70), Schizotypal (.63), and Schizoid (.68).
2. Belief in Conspiracy Theories (BCTI; Swami et al., 2010, 2011), a 15-item measure that describes a range of internationally popular conspiracy theories. Participants rated their belief that each conspiracy was true on a 9-point scale, ranging from 1 (Completely false) to 9 (Completely true). An overall score was computed as the mean of all items, with higher scores reflecting greater belief in conspiracy theories. Scores on this measure have been shown to be one-dimensional (Swami et al., 2011) and correlate strongly with scores from a generic measure of conspiracist ideation (r = .88; Brotherton et al., 2013). In the present study, Cronbach’s α for the BCTI was .90.
3. Structured Assessment of Personality Abbreviated Scale (SAPAS) (Moran et al., 2003) is an eight-item screening interview for personality disorder. It was designed to produce a dimensional score that represents the likelihood that a person has a personality disorder in general, rather than to screen for particular types of personality disorders or patterns. It produces a score that ranges from 0 to 8. In the original study with psychiatric patients, a score of 3 or more was both sensitive and specific as a measure of the presence of a personality disorder, according to the Structured Clinical Interview for the DSM-IV Axis II. It was designed to be so brief that it could be used in both routine clinical assessment when pressed for time, and potentially in community surveys. This study coded 1 for Yes and 2 for No for each question: (range 8–16) and the mean score was 12.41 (SD = 1.52).
3. Intelligence (Grover, 2018). This was a 10-item intelligence test with knowledge items such as ‘What score is obtained by hitting the bull’s eye in darts?’, ‘What is the unit of sound intensity?’, Who wrote ‘Of Mice and Men?’. It also had five fluid intelligence questions based on spatial and mathematical intelligence. The results were normally distributed (M = 4.74, SD = 1.78). The alpha for the test was .82.
4. Self-Estimates. Participants rated themselves on a 100-point scale (0 = Very Low to 100 = Very High) on their attractiveness and health. This is used a proxy for self-esteem and used in a large number of studies (Furnham & Horne, 2021). The correlation between the two ratings was r = .53 and the two were added together to get a score on self-ratings.
Procedure
Participants were recruited on-line, using the Prolific platform in 2019. They were all British nationals and over 21 years. They were told their anonymous results would be used for analysis. They were paid £1.50 for this participation. Ethics permission was sought and received by the appropriate committee (CEHP/514/2017). Close inspection of the data indicated that around 5% had to be discarded because of erratic responding, missing, or incomplete data. We are used to this data and have ways at looking for patterns and time taken which indicate the data may be unreliable. Whilst this is comparatively rare, we always remove ‘suspect cases’.
Results
Our hypotheses suggested that three PDs (Borderline, Paranoia, Schizotypy), all three DSM clusters (A, B, C), and various individual difference characteristics (age, education, IQ, and self-ratings) would be significantly related to CTS. We tested these hypotheses with correlations and regressions.
Table 3 shows sex differences on all the major variables. Males scored significantly higher on Antisocial, Narcissistic, Passive Aggressive and Sadistic PDs, as well as both self-ratings, than females, who in turn scored significant highly than males on Borderline and Schizotypy PD. All means and SDs were in the normative range for these tests where it was possible to check. However, although there were many significant differences effect sizes were small.
Sex differences on all variables.
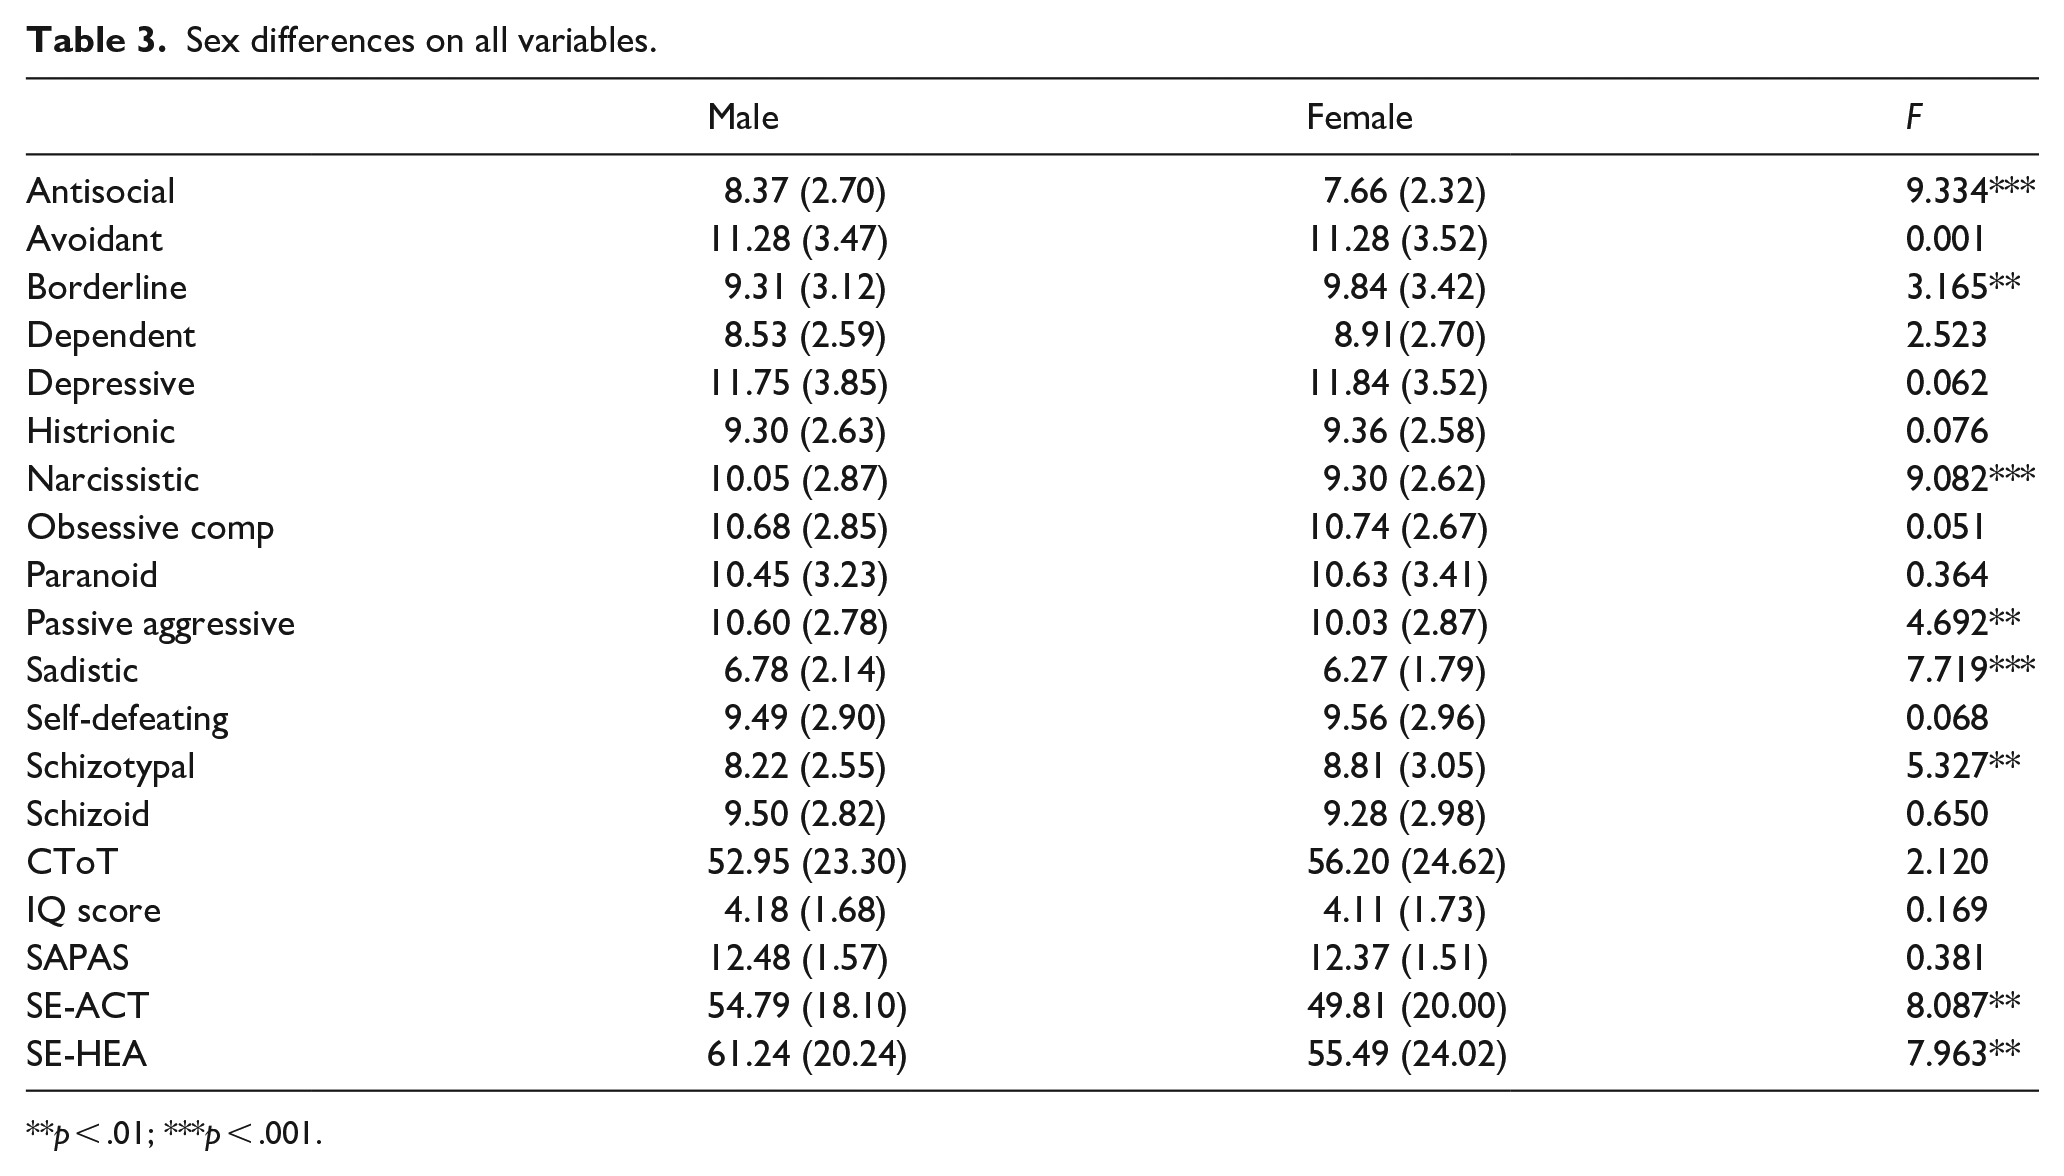
p < .01; ***p < .001.
Table 4 shows the correlations between the CT score and all 14 PDs. Nine were positive and significant, the top three being: Schizotypal (r = .35), Paranoid (r = .23), and Borderline (r = .17) This confirms H1, H2, and H3, namely that these three specific PDs would be significantly related the beliefs on CTs.
Correlations of the variables used in the study.
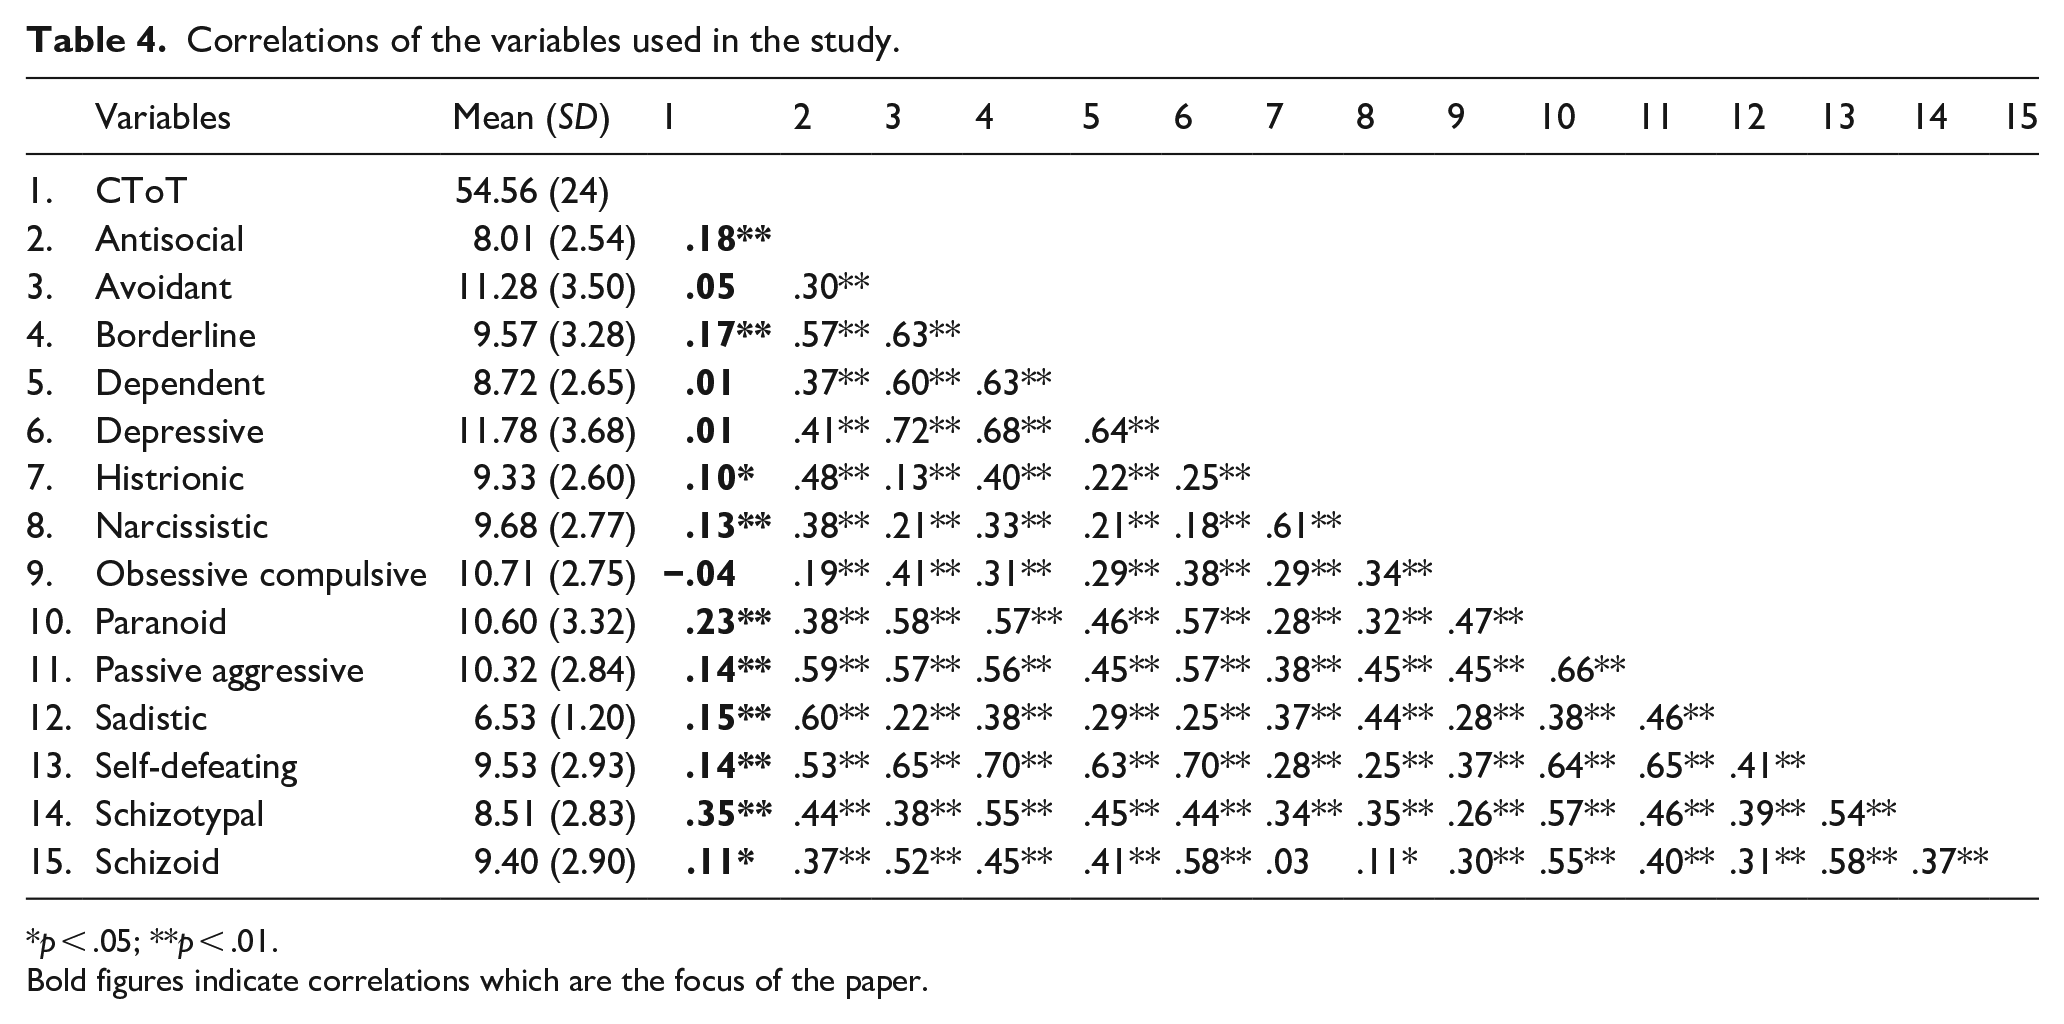
p < .05; **p < .01.
Bold figures indicate correlations which are the focus of the paper.
The three PD clusters were then calculated, A (alpha .75), B (alpha .77), and C (alpha .70), along with the total SAPAS scale and Self-Rating scale. Table 5 shows correlations between three demographic variables, the Self Rating score, the IQ score, the SAPAS and the three clusters. The total CT scale correlated significantly negatively with education (r = −.17) and IQ (r = −.14), but positively with Cluster A (r = .28) and B (r = −.19) confirming H7, H4, and H5 which stated that two Clusters A (Odd and Eccentric) and B (Dramatic and Emotional) would be positively and Cluster C (Emotional) negatively correlated with belief in CTs.
Further correlations with the three PD higher order factors.
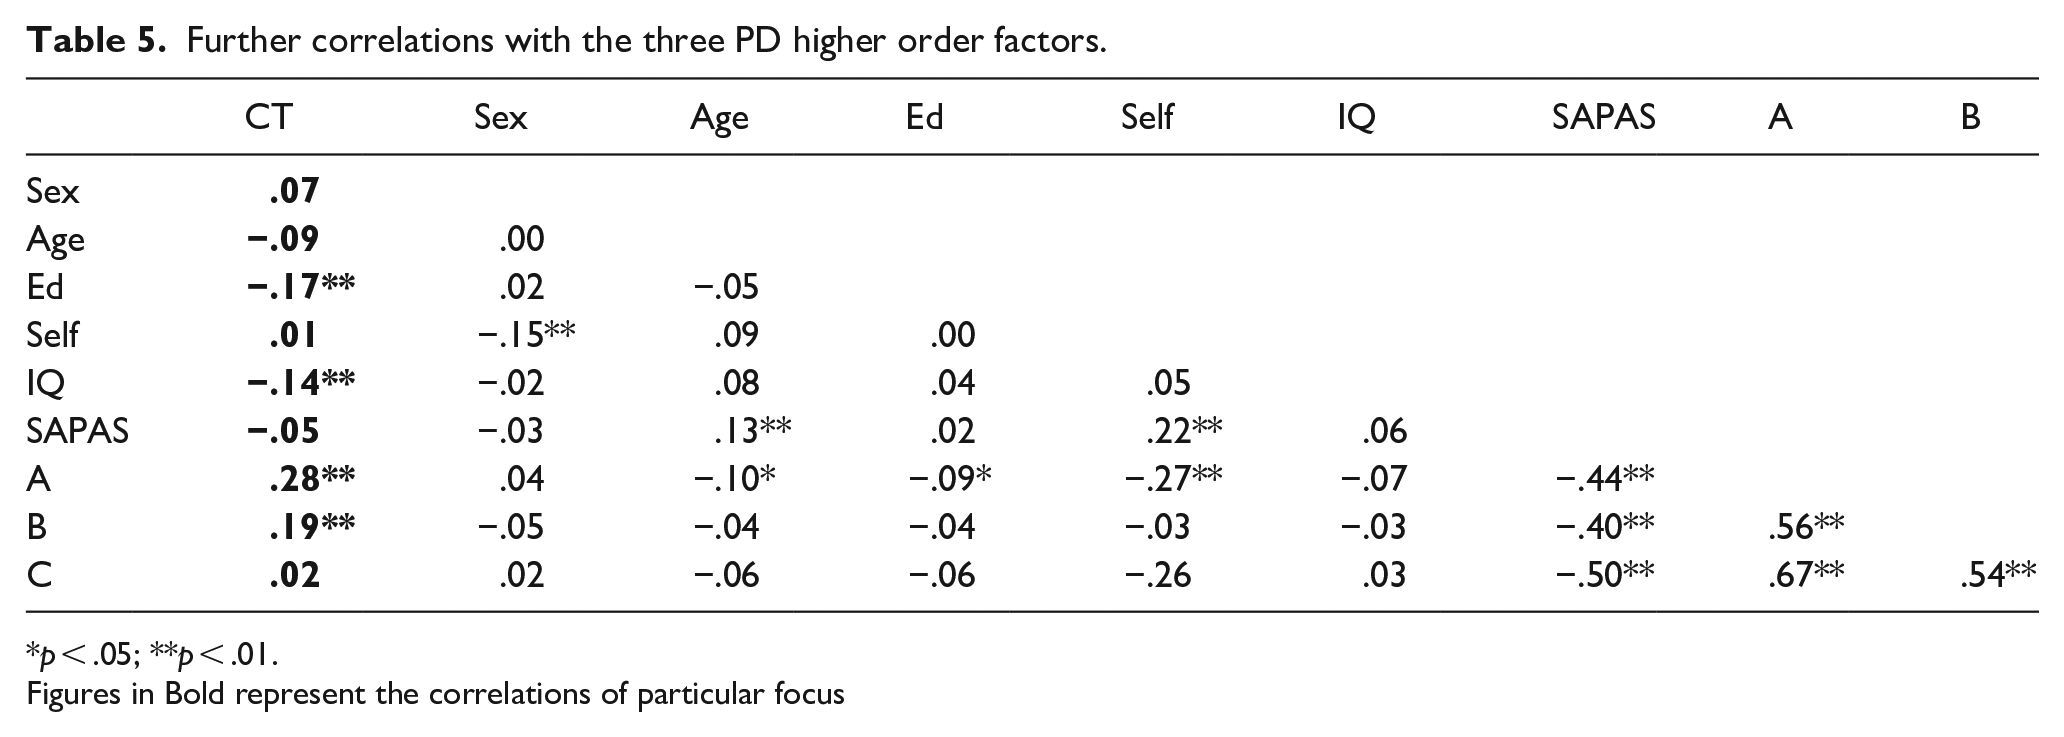
p < .05; **p < .01.
Figures in Bold represent the correlations of particular focus
The CT was also significantly related to IQ as predicted (H9): lower intelligent people endorsed theories more) but not self-ratings (H8) or SAPAS (H10).
A series of stepwise regressions was then computed with the totaled CT scale as the criterion variable. At first, we used all 14 of the PDs in the regression. After accounting for demography, five PDs were significant: Dependent (β = −.18, t = 2.98, p < .01). Depressive (β = −.20, t = 2.59, p < .01), OCD (β = −.11, t = 2.61, p < .01), Paranoid (β = .16, t = 2.33, p < .01), and Schizotypal (β = .34, t = 6.02, p < .01). The regression (F[14, 444] = 6.81, p < .01) accounted for 20% of the variance.
We then did a stepwise regression using all the variables. The first step included the three demographic variables (F[3, 457] = 6.60, p < .001, Adj R2 = .04), then self-ratings (F[4, 454] = 4.96, p < .001, Adj R2 = .04), then IQ (F[5, 453] = 5.60, p < .001, Adj R2 = .06), then SAPAS (F[6, 452] = 4.71, p < .001, Adj R2 = .06), and finally the three clusters (F[9, 449] = 11.52, p < .001, Adj R2 = .17). The final regression showed five of the variables were significant with indicated that less well educated (β = −.14, t = 3.32, p < .001), less intelligent (β = −.09, t = 2.16, p < .01), but scoring higher on all two PD clusters (Cluster A: β = .43, t = 6.88, p < .001; Cluster B: β = −.12, t = 2.07, p < .05) and lower on Cluster C (β = −.34, t = 5.33, p < .001), believed more in the CTs.
Various other regressions were run to explore the data set. Thus, regressing just education, intelligence and the 14 PDs onto the criterion PD score was significant (F[16, 446] = 9.40, p < .001), accounting for a fifth of the total variance. The measures with the highest positive Beta’s were PD Paranoid and Schizoid and negative Dependent and Depressive. When the same regression was run this time using the clusters it was also significant (F[5, 457] = 18.96, p < .001) accounting for 16% of the variance. By far the strongest positive Beta was for Cluster A and the strongest negative for Cluster C.
Discussion
Goreis and Voracek (2019) in their meta-analysis noted that number of variables have been suggested as predictors of conspiracy beliefs, amongst them personality trait and personality disorder factors. The psychological literature on predictors of conspiracy beliefs can be divided in approaches either with a pathological (e.g. paranoia) or socio-political focus (e.g. perceived powerlessness). We focused in this study on pathological factors: the PDs at both facet and domain (cluster) level.
This study confirmed most, but not all, the hypotheses, some of which were replicative (i.e. that Schizotypal PD and CTs are related). The strongest PD correlates were Schizotypal, Paranoid, and Borderline PD. It also extended the literature, particularly by looking at the relationship between the PD clusters and the CTs.
It should come as no surprise that Schizotypal and Paranoid PD should be correlated with CTs, although neither correlation was very high (r = .35 and r = .24). Further, various other PDs, namely Anti-social and Borderline, showed significant correlations with the PDs. Where the correlations were significant, they were all positive, indicating that CTs are associated with a wide range of disorders. It was interesting that Sadistic and Self-Defeating PD was associated with the CTs, as both these disorders appeared in the appendix of DSM-III-R and not in DSM-IV. It is possible that it is the feature of frightening and intimidating others that explains the link between Sadism and CTs, while it is negativity, gloom and preferences for people and situations that lead to disappointment, failure, or mistreatment even when better options are clearly available that part explains the correlation between self-defeating PD and the CTS. Both of these ideas require further analysis.
Interesting the SAPAS scale did not correlate with the PDs. The correlation was in the right direction (lower scores were indications of pathology) but failed to reach significance. This suggests that short screening measures of PDs are probably less useful in exploring the relationship between PDs and CTs.
The results showed clearly that the higher-order clusters were the clearest predictors of the CTs. According to the literature, Cluster A is called the odd, eccentric cluster. It includes Paranoid Personality Disorder, Schizoid Personality Disorder, and Schizotypal Personality Disorders. The common features of the personality disorders in this cluster are social awkwardness and social withdrawal. These disorders are dominated by distorted thinking. The correlations and regressions showed Cluster A to be the highest correlate of the PDs.
Esterberg et al. (2010) noted that Cluster A was the more severe personality disorders which are assumed by many to be resistant to treatment. People diagnosed with these personality disorders see the world as being ‘out of line’ rather than themselves being out of ‘sync’ with the world around them. Observers consider these individuals to be self-centered, leading to significant difficulties in their relationships.
Cluster B personality disorders are characterized by dramatic, overly emotional or unpredictable thinking or behavior. They include Anti-social personality disorder, Borderline personality disorder, Histrionic personality disorder, and Narcissistic personality disorder. Cluster B was also related to the PDs. The correlations showed that each of the constituent disorders were each correlated with the PDs (see Table 3).
The results showed that sex, age, and self-ratings were not correlated with the PDs. Previous work has shown mixed results with regard to these relationships and they may be better explored by a larger, more representative sample. This sample was younger and better educated than the population as a whole and both variables are related to being less likely to endorse CTs.
Two other related variables were correlates of the CTs, namely education and intelligence. This has been supported in previous studies (Goreis & Voracek, 2019). Educated people tend in general to be more skeptical, less religious, and less attracted to popularists theories. Further, as far as we know this is one of the few studies that have demonstrated the link between IQ and CTs. Indeed it has been suggested that education and training may be one of the best ways to counteract the spread of beliefs in CTs.
Douglas et al. (2019) concluded ‘. . .conspiracy theories have effects on both individuals and important societal institutions. Their risks (and benefits) are far-reaching, and much more research needs to be conducted to fully understand the importance of this pervasive psychological, political, and social phenomenon, especially on the vulnerable and disadvantaged groups that have been identified as most expected to benefit from them’ (p. 30).
We should note that in this study we used a measure of the PDs which included Self-defeating and Sadistic PD which is not in DSM-5, and found only in the appendix of earlier versions of the DSM (Furnham, 2021b). However, it the inclusion of Sadistic PD has moved the Dark Triad literature to the Dark Tetrad literature as there is a renewed interest in this PD (Furnham & Horne, 2021) though it remains unclear whether either future DSM or ICD systems will include it as a personality disorder.
This study looked at sub-clinical PD correlates of CTs and extended the literature in this area. It confirmed that whilst our participants were probably ‘sub-clinical’ in their PD scores, certainly those prone to odd and magical thinking and being suspicious and distrustful of others were more likely to endorse general CTs.
This study, like all others, had limitations. It was a cross-sectional, self-report study meaning both that causation cannot not be inferred, and that common method variance may inflate the correlations. Further, other PD measures may have been used which are more robust. Nevertheless, it took the literature on mental health and CTs further suggesting the exploration of various personality variables (Borderline, Sadistic, Passive Aggressive) not previously implicated in research.