
Abstract
This article suggests including drawing, a participative visual method, when designing organizational change research. It is based on a comparative analysis of three research protocols that have integrated drawing as a data collection method. Examining how drawing has been used in these studies leads to the identification of four elicitation processes—contextualizing, exemplifying, focusing, and reflecting—by which drawing gives access to data that would be more challenging to collect with conventional research methods alone. The article shows that these processes bring the participants’ emotions, lived experiences, and cultural influences to light in ways that may considerably enrich organizational change research. It ends by providing a set of guidelines on how to employ drawing in triangulation with other data collection methods.
Keywords
Introduction
Visual methods have long been established by researchers of numerous disciplines in the social sciences (Davison et al., 2015; Meyer, 1991). Lately, organizational scholars have begun to take a keen interest in visual methods as part of a broader scope for the development of alternative approaches to generating data. Photo-elicitation, video-ethnography, and freehand drawings are examples of methods based on the analysis of images that are emerging as new ways of knowing about organizations. They have been used to capture the embodied and emotional aspects of workplace interactions and to facilitate reflection among research participants.
While acknowledging the increased acceptance of visual methods in organizational studies, we believe an exceptional opportunity exists to expand their use for researching topics related to change. We purposely choose to focus on freehand drawing as a method for collecting data. Drawing is a considerably flexible method that may help in fulfilling the need for more nuanced and sensitive investigations. It has the advantage of requiring few means—only a few pencils and sheets of paper. It can be used without much difficulty by researchers to uncover the underlying mind-sets, tacit knowledge, and cultural influences associated with change situations. Yet we still know little about the processes by which drawing brings out such latent information.
Accordingly, this article addresses the benefits of including visual methods, and more specifically drawing, into organizational change research. To present our line of reasoning, we examine the methodology of three studies on topics related to change that have integrated drawing to their research design. The first study (A) focuses on the experience of bank branch managers who deal with difficult decision making that lead to major changes in the life of their employees and customers. The second study (B) explores the evolutive relationship between identity and collaboration within two interprofessional teams working in the mental health sector. The third case (C) was conducted in a nonprofit institution during an episode of organizational legitimacy crisis and looks at the collective identity processes involved. The comparison between the studies leads to the identification of four elicitation processes—contextualizing, exemplifying, focusing, and reflecting—by which drawing gives access to data that may be challenging to collect with conventional methods alone (e.g., interviews, focus groups, and surveys).
In what follows, we first review a selection of works related to change that include drawing in the field of organizational studies. After making an in-depth analysis of the selected research cases, we discuss the potential contributions of drawing to the production of knowledge on topics related to organizational change. The article ends by proposing a set of guidelines for scholars who wish to employ drawing for collecting data in change situations.
Drawing as a Visual Method of Inquiry in Organizational Studies
Until recently, most organizational studies that included visual data to their research design employed nonparticipatory methods, meaning that researchers relied on secondary data such as illustrations in company annual reports, corporate short films, and photographs of product prototypes (e.g., Kuronen, 2014; Rämö, 2017; Strati, 2000). However, over the past 10 years, there has been an increased interest for participatory methods, which leads participants to create the visual data themselves. Researchers often choose to take this approach with drawing, an art-based technique that allows the exploration of a variety of subjects without imposing too many constraints (Mair & Kierans, 2007; Pink, 2006). Concretely, using drawing as a data collection method entails that participants answer a researcher’s query or series of queries with a drawing (or series of drawings). Participants are then asked to describe the content of their drawing(s), either with written answers or orally during an interview (Guillemin, 2004). By creating and further elaborating on their drawing(s), the “sketchers” collaborate in the research processes on two levels: first, by producing visual and textual data (Vince & Warren, 2012), and second, by sharing their analysis of the visual data (Guillemin, 2004; Mitchell et al., 2011).
In the field of organizational studies, participatory drawing has been employed for studying cultural patterns and identities (e.g., Alcadipani & Tonelli, 2014; Nossiter & Biberman, 1990; Stiles, 2011, 2014), emotions (e.g., Barner, 2007; Kearney & Hyle, 2004; Vince & Broussine, 1996; Vince & Warren, 2012), management learning (e.g., Bryans & Mavin, 2006; Han & Liang, 2015; Nyquist et al., 1999), space (Höykinpuro & Ropo, 2014) as well as sustainable development (Kim et al., 2019). For example, Nossiter and Biberman (1990) used drawing to see how workers perceived their organization’s identity. This study, though only explanatory in nature, shows that drawings as metaphorical analogies can provide the most salient features of an organization (as perceived by its members). Culture has also been the focus of Alcadipani and Tonelli’s (2014) research on gendered dynamics in organizations. The field researcher asked shop-floor employees of a factory to portray their company, an exercise that revealed the existence of gender oppression problems in the organization. The gathered sketches allowed the authors to explore the symbolic aspects of the company’s gender dynamics, an aspect that was not observed on the field before collecting the drawings. In retrospect, the authors claimed the drawing activity made it possible for them to access the employees’ emotions, which are typically hidden in workplaces characterized by male chauvinism.
Seeking to better understand the role of emotions, Barner (2007) used “collective drawing,” a variation of the classic drawing technique which is rather centered on the individual. The author invited small groups of a manufacturing company managers and employees (seven groups of seven participants) to construct collective drawings at three different points in time. The results of the study showed that co-creating visual metaphors would be more effective than simply using discussion activities to capture complex thoughts and emotions (Barner, 2007). Moreover, according to Barner (2007), group-based drawing activities would promote the expression of less socially acceptable emotions in some workplaces, such as fear, despair, or anger toward changes. In this sense, they would have a therapeutic effect, potentially improving the well-being of participants.
In their work on organizational spaces, Höykinpuro and Ropo (2014) have developed a narrative approach to participatory drawing. They first asked participants to recall and draw their first encounters with their university’s physical environment. They then invited them to write a story explaining what they had drawn. The visual storytelling led participants to express their physical sensations, which goes beyond the cognitive aspects of understanding and experiencing organizational spaces. The majority of them described their lived experiences by referring to the aesthetics, the weather, and the people composing the atmosphere of their university campus.
Several studies have included drawing to inquire into learning processes in business schools. For instance, Bryans and Mavin (2006) explored how PhD students and senior scholars in the field of business regarded “research” and “researchers.” The participants were asked to draw what these terms meant, according to them. They then had to explain what they had sketched. The activity led them to voice sensitive issues associated with doing research and being a researcher. Drawing also helped clarify what drives researchers to engage in research projects. In another study, Han and Liang (2015) invited Chinese EMBA (executive MBA) students to draw life maps representing their thoughts and feelings regarding their experience in their academic program. The majority of the participants’ creations emphasized the existential aspects of learning and suggested that feelings of belonging to the EMBA program were closely related to personal identity stabilization and renewal processes. A more holistic view of learning emerged.
Recently, Kim et al. (2019) have included integrated drawing in their research design to study how sustainable development can be achieved by small organizations producing tea in East Africa. During the fieldwork, each participant was asked to produce “a set of two drawings that illustrate their life before and after obtaining Fairtrade certification” (Kim et al., 2019, p. 612). The visual method was particularly helpful in the context of tea production businesses for giving voice to female tea farmers and accessing the experiences of workers living in a culture that has a tradition of communicating through images rather than verbal modes of expression due to low literacy rates.
In summary, drawing as a data collection method is considered less directive than verbal questioning, which can be an advantage when exploring sensitive issues. It has been used in a variety of ways in organizational studies and is usually introduced in individual or group interviews as a discussion starter. There is a consensus about the type of knowledge that drawing may elicit. Namely, by elaborating on their drawings, participants often come to reveal cognitive, emotional, and sensory processes related to their position, work, and organizations (Bell & Davison, 2013; Davison et al., 2015).
The above research overview also highlights the relevance of using drawing for investigating topics related to change. Integrating drawing to triangulated research designs has, however, rarely been the object of serious methodological discussions in organizational studies. We still don’t fully understand the specific processes by which drawing elicits data that may be challenging to collect through conventional methods. The goal of this article is to address this gap by closely examining the research design and contributions of three research projects on topics related to change that have included drawing. In doing so, we aim to answer the following question: By which elicitation processes may drawing lead to a deeper understanding of organizational change? By elicitation processes, we mean the processes by which drawing brings out latent or potential information about change situations.
Three Research Cases Using Drawing as a Data Collection Method
To achieve the goal of this article, we selected three independent research projects that made use of drawing as a method for collecting data. The first study (Case A, 20 drawings) took place in different local bank branches and concerns the evolution of thorny decision-making branch managers’ experience in their daily activities. The second research (Case B, 39 drawings) examines how collaboration unfolds over time in two interprofessional teams in the mental health care sector. The third case (Case C, 14 drawings) builds on an ethnographic study conducted in a nonprofit organization in the arts sector during an important legitimacy crisis episode. For each project, we present the research strategy, the data collection, and data analysis protocols. We then describe the contributions of drawing to each research.
Case A: A Narrative Study of Thorny Decisions 1
The study explores how bank branch managers experience decision making that have financial, psychological, and sometimes even physical impacts on their employees or customers. This is what the author of the study calls “thorny decisions.” Based on a “practice” approach, the analysis examines the decision-making process at different times—before, during, and after the decision. Decision making requires managers to use their rationality, but it also involves complex emotions. For this reason, the author had the idea of using drawing as a complementary method for gathering data. Her aim was to produce, collect, and interpret how managers experience thorny decision making that may change the life of employees and customers.
Research Strategy
The research strategy is based on 10 cases of day-to-day decisions made by different bank branch managers in two institutions (five managers in each organization). Twenty thorny decisions were identified and reconstituted: Thirteen concerned employees and seven concerned customers. It was established that the decisions should have three characteristics: (1) be thorny or involving discomfort according to the manager, (2) have been implemented, and (3) have happened in the past 2 years at the latest to cope with memory biases.
Data Collection
The data collection process was mainly based on retrospective narrative accounts of thorny decisions experienced by the managers (30 semistructured interviews). The originality of the method stands on the fact that three types of data were collected for this research: verbal (three semistructured interviews with each manager), written (summary of two decisions between Meetings 1 and 2, and local documents), and visual (one drawing representing each decision). The drawing activity was included in the third interview.
The first semistructured interview lasted approximately 1½ hours and aimed at understanding how managers interpret the mission and values of their organization and conceive their professional role and their working environment. At the end of this interview, each manager was asked to think about two thorny decisions (one involving an employee and another involving a customer). The managers were then invited to write a brief summary of these decision episodes and send it to the researcher before their next meeting. The objective was double: first, to collect a written account of the key elements involved in each decision, and second, to take these elements in consideration in the next interview. Indeed, the second interview was dedicated to collecting data on the two decisions selected by the managers. It lasted about 2 hours. At the end of the meeting, the researcher asked the participants if she could have access to some documents supporting their accounts. Some documents were collected and archived whenever possible. Shorter, the third interview lasted for about 1 hour and started with the drawing activity. The managers were asked to draw an image representing the two decision-making episodes they had chosen to summarize in the previous interview. The researcher provided managers with standard white paper sheets and coloring pencils but did not indicate if they should use those pencils. The participants then had to explain and comment on their sketches.
Data Analysis
The visual data were not coded and interpreted for this research project. However, the participants’ comments about their drawings were included in the verbal data set and mentioned in the research report to support findings. To illustrate how the collected visual data have contributed in various ways to the data triangulation, we have selected four drawings. The pieces were selected because they (1) illustrate typical decisions that have an impact on employees and customers, (2) show different moments and forms of difficult decisions, (3) demonstrate the benefits of including drawing as a data collection method.
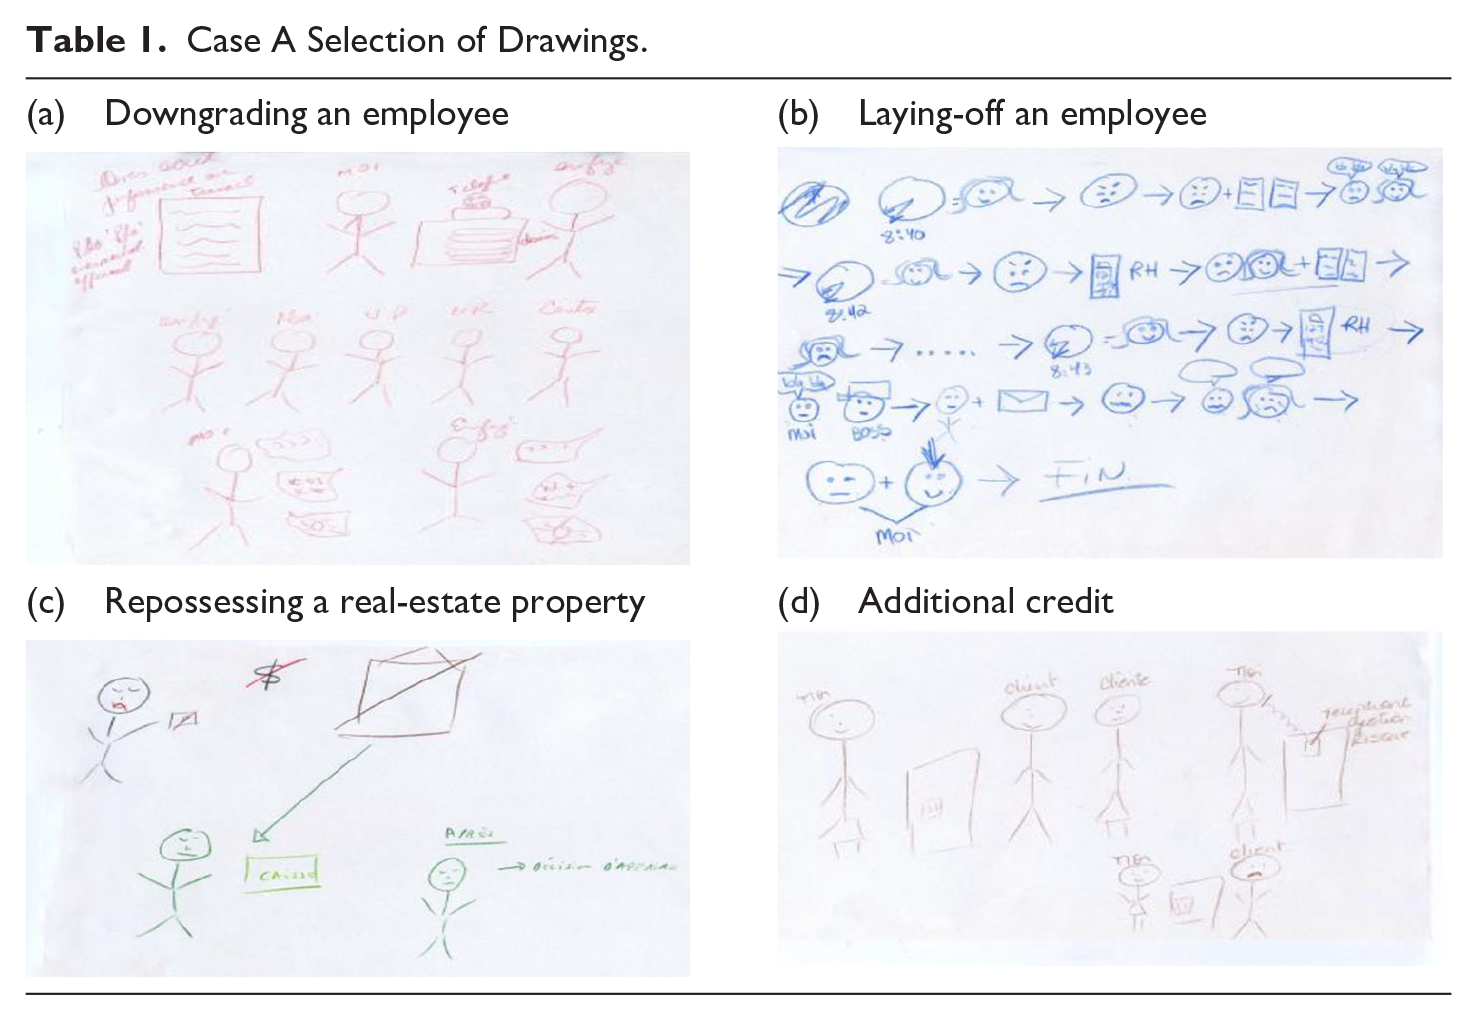
The drawings in Table 1 are mainly composed of stick men figures (Drawings a, c, and d) and emoticons (Drawing b). Other figures like buildings, time indicators (e.g., clocks, watches), money signs, communication tools (e.g., a telephone), arrows, and written words were also sketched. The majority of participants used colors, particularly the official colors of their banking branch (green or blue) to represent the context of their decision making (e.g., Drawings b and c). The figures in several compositions have been positioned in a sequential or linear order, somewhat like visual narratives with characters, a setting, a plot, a conflict, and a resolution.
Case A Selection of Drawings.
Case B Selection of Drawings.
For example, drawing a concerns an employee who had been promoted as a senior accountant manager but lacked competences for the role. Brigit, 2 the manager in charge of this employee, illustrated the situation with three superimposed series of sketches, one for the problem, one for its management, and one for the conclusion of the story. More precisely, the first line portrays the employee’s shortcomings as a senior accountant (e.g., not returning customers’ calls, not making the follow-ups with colleagues). The second line depicts the various actions undertaken by Brigit to manage the employee’s performance issue (i.e., all the organizational actors involved in the situation). The third row illustrates the fact that despite the decision to fire the employee, Brigit helped her find a position that required fewer responsibilities.
Contributions of the Visual Data
In this research case, the drawing activity contributed to enriching the interpretation of the phenomenon under study in four ways. First, it allowed several managers to explore and describe more acutely the emotions felt during decision making. This openness to the participant’s emotional world is evident in Drawing (b) in which Louis, the manager, sketched different emoticons to illustrate the contrast between his emotions and those of a dismissed employee. His narrative account ends with two emoticons that express his ambivalence during the decision process: On one hand, the dissatisfaction of having to reject a person, and on the other, the satisfaction of having corrected a recurring problem. Louis describes his emotional state in the following terms: Two emotions come up at the same time: first, from a personal perspective, I’m not happy because I have impacted someone’s life; second, I am happy because I’m a manager, I had to wear the corporate hat and I did my job according to the bank’s expectations.
Second, the drawing activity allowed some managers to focus on the important facts and situational elements related to the decision-making process that had not previously emerged in the interviews. For example, the telephone figure in Drawing (a) symbolized Brigit’s (the manager’s) frustration with her employee’s behavior (the fact that she did not return customers’ calls). When representing herself and the employee at the bottom of the image, Brigit added bubbles in which she noted the emotions that she had felt and the emotions that the employee might have felt during the whole process. The introspection also led Brigit to talk about how this employee’s behavior negatively affected her team’s working atmosphere.
While sketching, some participants focused on the rationale behind their decisions. In Drawing (c), a green box represents the bank (green being the color of the organization’s logo) between two stick men figures. The image shows Mary, another manager, before and after making the decision to take over a property in order to consolidate her customer’s debts. According to Mary, over time, the repossession became an inevitable business outcome despite her understanding and feeling of empathy toward the customer. The decision was above all a matter of business from which the figure of the green box (the bank), the symbol of money, and the red color evoke the standards and policies of her organization.
Finally, the drawing technique proved to be stimulating the reflexivity of the participants. Most of them reflected on their managerial role. All the interviewed managers portrayed themselves in their drawing. The self-representations may be differentiated between two categories: those who drew themselves in a chronological narrative and those who represented themselves with others, such as their employees or supervisors. Interestingly, managers often singled themselves out in their sketch (Drawings b and c). For instance, in sketch (d), Martine illustrated her decision of not increasing the credit limit of a customer whose debts had recently been consolidated. The first sequence of the drawing represents the initial situation: Martine is close to her customer, who is close to his sick wife; she tries to find a solution to help him since he’s struggling with his wife’s health. In the second sequence, Martine shows off a smile because she’s satisfied about the solution she offers him. However, the customer declines her offer. The drawing led her to share her insight on the ethical aspect of her job: When it comes to lending money, the heart is not our guide, the intellect is, but we’re human, and sometimes the heart influences our thinking. I could see it very well that the woman [the customer’s wife] was sick when she came into the office.
As we see, drawing stimulated the participant’s reflexivity toward her role and actions at work.
Case B: A Longitudinal Study of Interprofessional Collaboration
The second case study, conducted by the second author of the present article, explores the unfolding identity dynamics in the context of interprofessional collaboration. Interprofessional collaboration requires that professionals revise their distinctive professional identity to create an integrated collective identity (King & Ross, 2004). This challenge of identity differentiation and integration refers to what the literature calls the “identity paradox” (Jenkins, 2008). By observing and studying interprofessional interactions over time, the research offers a meticulous analysis of identity paradox negotiation within each team and its influence on the collaboration’s evolution. Identity and paradoxes are two intangible and complex concepts that are not easily accessible through conventional methods of inquiry (e.g., interviews, observation). Discussing these concepts directly can also be associated with sensitive issues and give rise to difficult emotions. The author thus integrated drawing into her interviews to ease the exploration of such tensions.
Research Strategy
The longitudinal qualitative study was carried out in an organization of the health care sector and was based on following two interprofessional working teams. At the time the study was conducted, team Alpha was composed of 25 members and team Beta comprised 10 members. Both Alpha and Beta members belonged to different health professions such as nurses, social workers, psychiatrists, and psychologists. Their general mission was to offer services to patients who have mental health problems, which include diagnosis, bio-psychosocial support, psychotherapy, and so forth.
Data Collection
The data collection implied two phases and was based on two main sources, namely observations and interviews. During the first phase in 2011, the researcher observed 31 meetings (21 with Alpha and 10 with Beta) and conducted interviews with each member of the different teams. She then returned to the field in 2013, attending 25 meetings (13 in Alpha and 12 in Beta) and carrying out second interviews with some members (14 in Alpha and 13 in Beta). Team meetings were held weekly and mainly consisted of clinical discussions, lasting approximately 180 minutes. In the first phase (T1), nonparticipative observations were used to collect information on real-time collaboration (i.e., how individuals organized and interacted). T1 semistructured interviews lasted about 90 minutes and were used to collect information about the history and the functioning of collaboration, as well as the self and others’ representations, and the negotiation of possible identity tensions within the team. During the second phase (T2), nonparticipative observations and semistructured interviews were mostly used to examine the evolution of identity negotiation and interprofessional collaboration. Gathering data from two interprofessional teams on two occasions allowed multiple case comparisons (within-case and across-case analysis).
Drawing was inserted in T1 and T2 interviews. The researcher invited some participants to draw a picture of how they viewed their team. More specifically, she asked them: “Could you please draw your team? What image comes to your mind when you think about your team?” These questions were raised about halfway through the interview with participants who were especially talkative and with whom a bond of trust had been established with the researcher. Thirty-nine drawings (19 drawings in Alpha and 20 in Beta) were gathered. Drawing as a data source was selected because it allows a better access to the individuals’ perceptions than textual methods (written and oral). The researcher wished to stimulate and deepen discussions with the professionals, notably through the explanation of their sketches. In fact, the use of drawing was initially an attempt. Then, realizing that it revealed the presence of differentiation and integration—the two forces at the center of the research project—the researcher decided to continue its use. Besides the exchanges during the interviews, the drawings were also discussed collectively with the team members. At midpoint and at the end of the research project, the author presented preliminary results to the participants, which included the collected drawings. The presentations gave rise to lively discussions and enabled them to reflect about the evolution of their collaboration. The participants were engaged in the data analysis process, as the researcher included their perspective to her interpretation of the visual data.
Data Analysis
The data analysis was conducted in three stages: (1) studying how individuals collaborate (i.e., the structure and the more or less formal rules that guide the interactions within the team), (2) studying how individuals negotiate the identity paradox, and (3) studying how identity negotiation influences and changes the way people collaborate. As stated earlier, a part of the analysis was accomplished by the participants who reflected collectively about collaboration processes during report sessions. The other part of the analysis was conducted by the researcher based on Glaser and Strauss’s (1967) method of comparative analysis and grounded theory (Charmaz, 2006). The general idea was to construct categories (i.e., codes, themes) based on the constant comparison between multiple words, sentences, or incidents (empirical data), then to integrate this system into generic concepts. Establishing relationships between these concepts ultimately led to the construction of a theoretical frame. Data from the first and the second phases were compared to identify revealing themes about how identity and collaboration processes had developed over time. The concepts of differentiation and integration were mobilized to examine the identified themes. The idea was to see how these two forces manifested themselves and evolved within the teams.
The drawings were used iteratively during the data analysis. The researcher frequently went back and forth between the interview verbatim, observation reports, and visual data to clarify her understanding of the identity and collaboration processes. These iterations oriented the final interpretation of the whole data set. The analysis of drawings was abductive, meaning it combined deductive and inductive approaches. On one hand, the theoretical lens of differentiation and integration was used for their interpretation. On the other hand, a place was left for the emergence of meaning about the way in which differentiation and integration took place. The drawings were also used at the end of the analysis as another source to triangulate the research’s main results. Table 2 presents four drawings from the Case B.
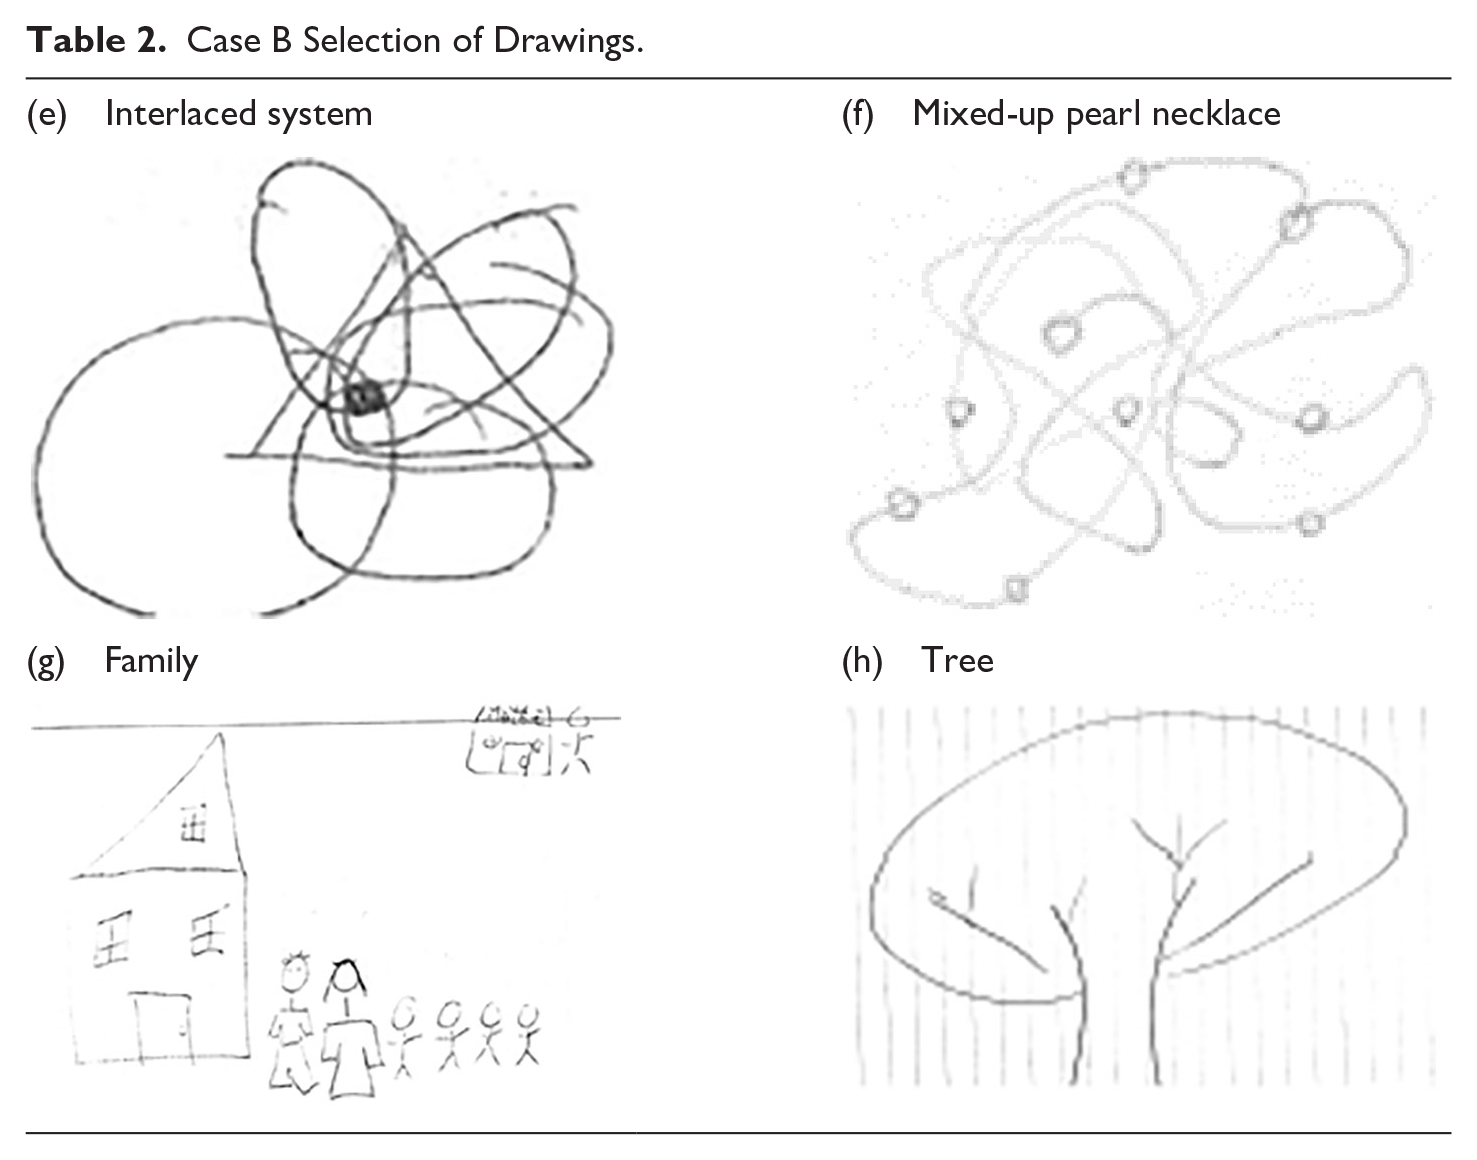
The selection of the drawings was based on two reasons. First, (e) and (f) are from the Alpha team—(e) being from T1 and (f) from T2, while (g) and (h) are from Beta team—(g) being from T1 and (h) from T2. Second, the chosen sketches represent the main object of the research (i.e., differentiation and integration in the context of interprofessional collaboration).
Contribution of the Visual Data
Undoubtedly, the drawings enriched the data set collected for this research. They captured the various facets under which the differentiation and integration paradox appeared. Differentiation mainly occurred when health professionals stressed the distinctiveness of their expertise, while integration arose when members valued their team’s uniqueness as a whole. For example, in Drawing (e), Martin explained that each of the circles represented a specific professional expertise, such as psychiatry, psychology, and social work (differentiation). He also put emphasis on the existence of a central point that connected all the experts to the patient (integration).
The act of drawing allowed the professionals to articulate other aspects of the differentiation and integration processes. Namely, Drawing (g) proved to reveal the power dynamics within the Beta team. The sketcher, Olivia, compared the team with a family, in which the clinical and administrative managers were the parents and the health care professionals were the children living in a village led by the doctor who is “the mayor of the village” (right upper corner of the image). This representation confirmed the triadic distribution of the team’s leadership (i.e., doctor, administrative manager, and clinical manager). The fact that the professionals were compared with children of the same family indicated that a collective identity had been integrated by the participant. Indeed, she viewed her colleagues as equals who were tied together. This resonated with the work practices the author had observed on the field. In team Beta, all professionals carried out a set of common tasks despite their professional expertise. For example, a social worker may administer medication to patients just as a nurse may perform social evaluations of patients. This exchange of roles was discussed in the interview once the drawing exercise was completed. It allowed the researcher to better understand the process of integrating a common identity in collaborative practices.
The act of drawing also incited participants to share details about their daily work practices. For instance, Olivia described an episode related to drug delivery to patients: This [the drawing] reminded me, for example, the other day, all the professionals were frustrated; altogether, we came to the decision that we would deliver the pills to one patient at 5:00 p.m. Then, the doctor arrived and said that the patient would need his pills at 8:00 p.m.! No, we don’t have the time to make the delivery at 8:00 p.m. He lives in his own house. Sometimes, he doesn’t understand our reality!
The anecdote reiterated the existence of boundaries between some members of the Beta team according to their profession, an observation that was brought up by many participants of the study. This helped the researcher in gaining a better awareness of how the identity paradox unfolded in daily tasks and routines, which in turn had an effect on collaboration.
Furthermore, drawing led participants to talk about the impacts of the differentiation and integration paradox on the team’s collaboration quality. The Drawing (f) represents all the difficulties associated with the organization of collaboration. During his interview, the participant, Paul, repeatedly mentioned his desire to improve the structure and the functioning of collaboration. His drawing was particularly meaningful since throughout the data collection period, the Alpha team undertook a series of structural transformations. Being a large group forming a simple administrative unit at the beginning of the field work, it then evolved into an organization of interdependent subgroups. The Alpha team was looking for an effective structure that would allow the distinction of all professions while contributing to their integration through the development of a unified and cohesive team. Some members in both teams used visual metaphors in their drawings. These were usually indicative of the participants’ emotions regarding their efforts to collaborate. The pearl necklace in Drawing (f) is a good example. The image highlights a rather negative perception of interprofessional collaboration. Yet the researcher noted that drawing had a calming effect when negative emotions came up in the discussion.
Finally, drawing brought the participants to become more reflexive about how their team’s collaboration had evolved over time. In Drawing (h), the participant, Max, explained how the leader played an important role in developing team collaboration. He used the metaphor of a tree to illustrate his team: Each branch represented a member with his or her distinctive professional identity, and the team was supported by a trunk that symbolized the leader. He pursued by saying that, like a tree, the team had flourished over time. This was partly attributed to the administrative manager’s leadership, although Max noted that the leadership was not always good. This brought him to reveal details about the previous problems encountered by his team. Working with images to explore the evolution of team collaboration was especially suitable because of the longitudinal design of the study. Indeed, gathering drawings in each of the study’s phases allowed the researcher to make comparisons between the team members’ perceptions at two points in time.
Case C: An Ethnographic Study in a Small Film Archive Organization
The third case study is based on a year-and-a-half-long ethnography, which was conducted in a film archive nonprofit organization—the Filmatek. 3 The research’s goal was to explore the identity work practices at the organizational level—that is, the individual or collective efforts accomplished by the members of an organization to create, present, sustain, reinforce, or influence its central, distinctive, and durable features (e.g., Breit, 2014; Kreiner et al., 2015).
Research Strategy
The author’s ethnographic immersion was made at a key moment in the organization’s recent history. At the end of 2014, the film archive was facing a serious legitimacy crisis, which jeopardized its public funding. The local government was considering forcing a merger between the nonprofit and a state-owned library to save up on its subsidy allocations. The threat of this major transition had a strong impact on the organization’s climate and led to the involvement of the Filmatek’s executive board, the employee’s labor union, and a strong media coverage. In March 2014, the film archive’s employees rallied around a campaign named “Support the Filmatek!” When the author entered the field, she was not expecting the problematic situation with the government to lead to a crisis. Rather, the organization was chosen because of its size, availability, openness to the research project, and the nature of its activities. Nevertheless, the controversy revealed to be a precious opportunity to study the organizational members’ identity work, in particular, the collective efforts directed at overcoming the risk and uncertainty associated with a potential rapid change (i.e., the organization’s identity transformation). For this research project, three data collection methods were triangulated—namely, participant and nonparticipant observation, semistructured interviews, and the study of documents.
Data Collection
The data collection began in October 2014 and ended in September 2015—for 12 months. During this time, the author attended a set of committee meetings (e.g., the preservation meetings, the communications, and marketing meetings). Some of these occurred every 2 weeks, but the majority were held once a month. In exchange for this access to the organization’s core activities, the author was given the responsibility of writing the official meeting summaries. Sixty-four participant observation sessions were audio-recorded and archived. Field notes were also an important part of the project’s archives. Throughout the fieldwork, the author regularly wrote her impressions and feelings, the striking details she noticed, and the emotions expressed by the participants in the study. These notes constituted a diary and were sometimes complemented by drawings or photographs.
Besides the informal and spontaneous interviews accomplished during the observation sessions, the researcher conducted semistructured interviews with 15 organizational members. The interviewees were selected based on their position in the organization or their behaviors and responsibilities toward the crisis (i.e., purposeful sampling, cf. Patton, 2002). The semistructured interviews were used to explore the theme of identity in-depth.
Since the theme of organizational identity is closely related to the one of organizational image, the author thought of integrating drawing into her interview. The instruction offered was to draw an image of the Filmatek on a standard letter size white paper sheet with a black marker. Everyone was asked to draw whatever image that came to his or her mind spontaneously. They were given 5 minutes for the task. In most cases, the exercise was used as a conversation starter on the theme of organizational identity, but when more appropriate, the author delayed the task, adapting herself to the interview’s flow. Once the portrait was made, the participants were asked to explain what they had drawn. The researcher also referred to their creation to explore how they had experienced the merger threat episode by asking further questions.
Data Analysis
The analysis of the drawings was abductive, combining deductive and inductive approaches. According to the author’s notes and reflections, emotions and materiality appeared to be constitutive of the identity work practices aimed at maintaining and reinforcing the organization’s legitimacy. This observation was also reflected in the collected drawings. Several participants drew the organization’s architecture, others illustrated cinematographic artifacts, such as a projector, a projecting screen, a camera’s focus, and film archive spaces. To explore these links further (i.e., emotions—materiality—identity work), the author constructed a matrix that consisted of a basic table. Three columns were created, one for the theme of emotions, the second for the theme of materiality, and the third for the general theme of identity. For each drawing (row), under each column, the excerpts from the interviews explaining the image was copied according to the themes (emotions, materiality, identity). The excerpts and drawings were then revisited along with the other data collected throughout the ethnography (e.g., personal field notes, interview, and meeting transcripts) in a loop-like pattern of multiple rounds. During this process, the author used a basic hermeneutic framework consisting of three iterative questions that she asked herself systematically when reviewing the drawings, the excerpts, and other data (i.e., What are the data telling me? What is it I want to know? What is the relationship between what the data are telling me and what I want to know?) (Srivastava & Hopwood, 2009). The reflexive process was conducted until she gained a deeper understanding of the material.
Contributions of the Visual Data
The exercise brought out insightful information on the Filmatek’s members’ organizational identity work. Table 3 presents a sample of drawings from Case C, which were selected according to four criteria. Fist, each of them represents a different view of the organization’s identity (i.e., who we are and what we do). They were also selected because their production seemed to have facilitated the expression of emotions. Third, the drawings include material elements such as everyday objects or architectural spaces. And last, the four images are rooted in different time frames, each evoking an identity issue linked to the organization’s past, present, and, sometimes, its envisioned future.
Case C Selection of Drawings.
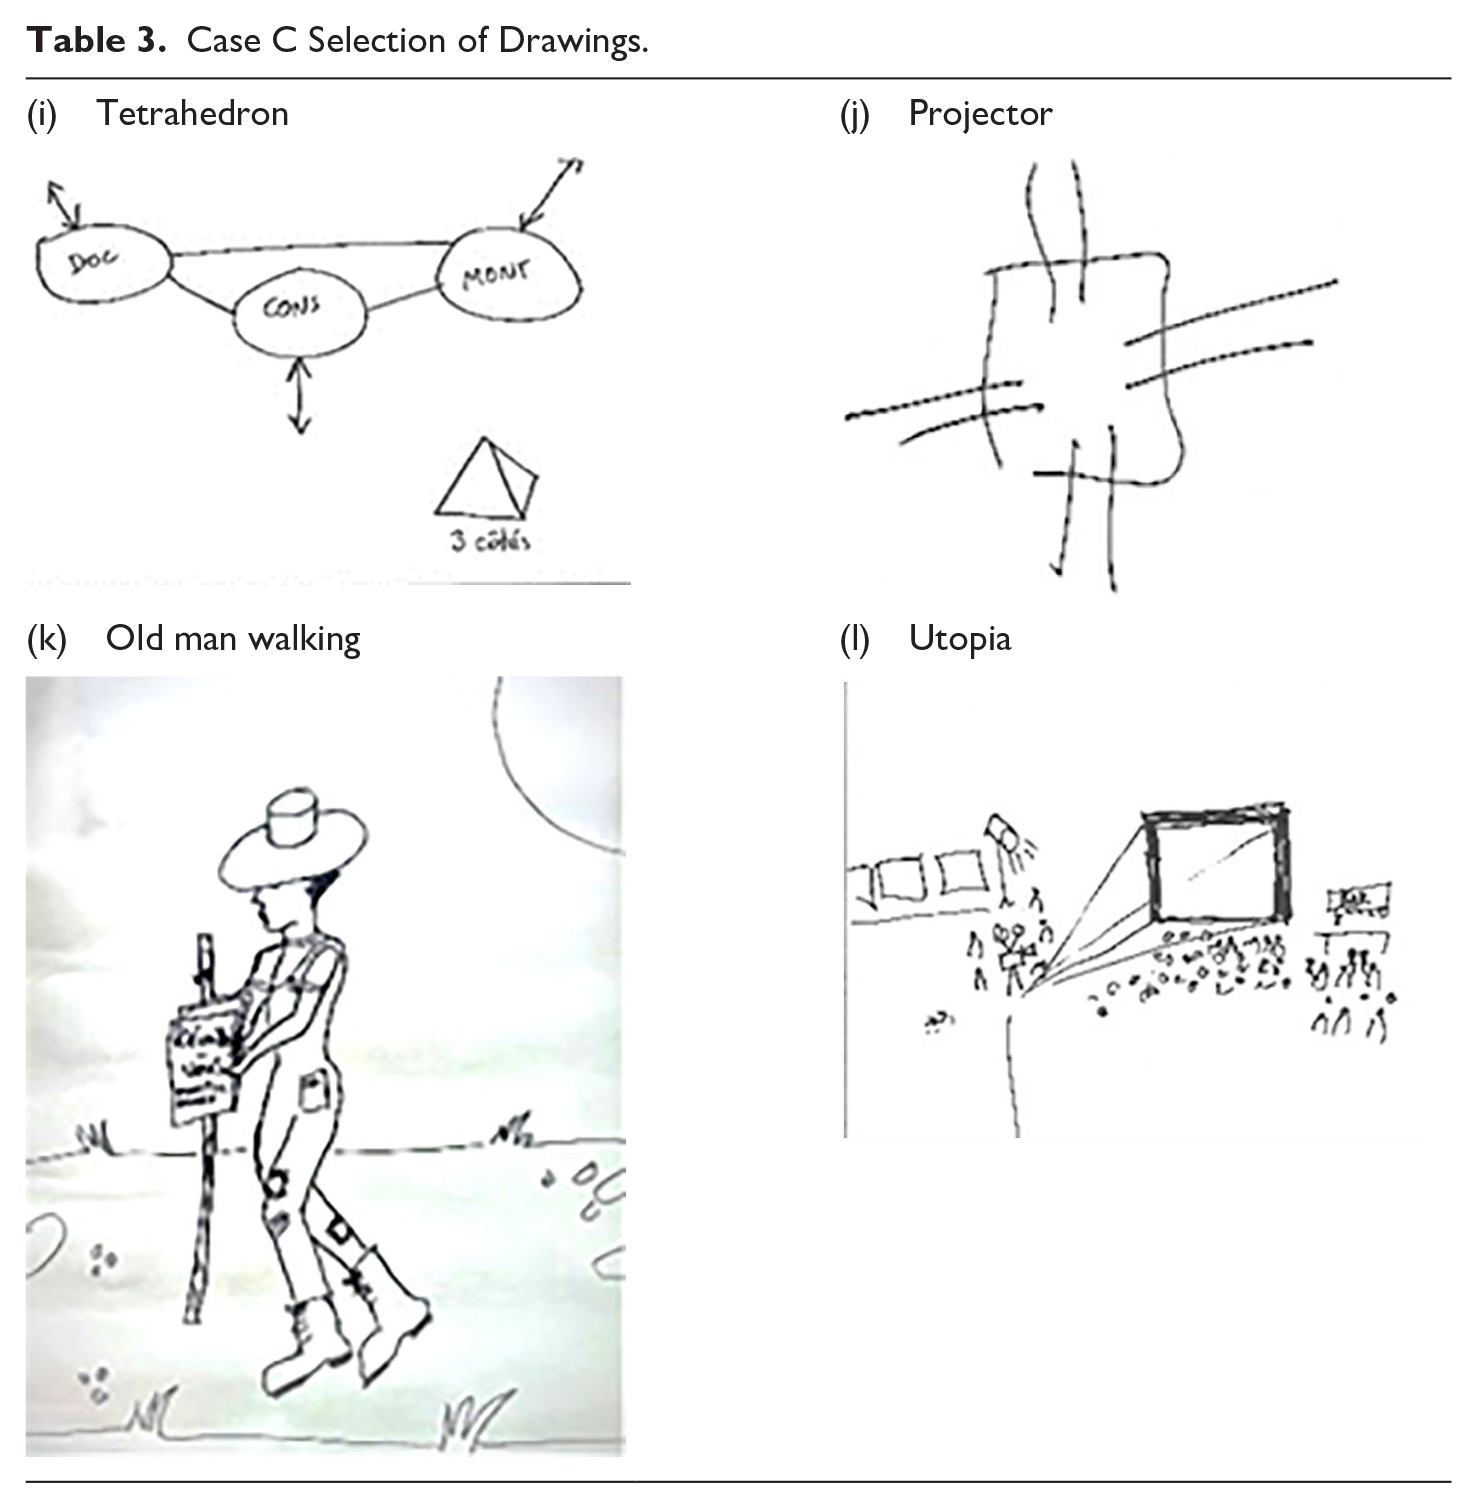
As the first drawing of the table demonstrates, one of the interviewees, Clarisse, represented the organization by tracing three circles linked together by doubleheader arrows. According to the employee’s description, the three circles symbolized the main activities of the Filmatek. The composition presented a tetrahedron in the bottom right of the sheet of paper. As the next excerpt shows, the drawing activity generated a discussion about the organization’s mission: For me, there are three entities, if you will. Of course, it consists of preserving, showing and documenting . . . so, it’s really not only about film reels! (Ironic tone) . . . And yet I think that archives are at the heart! I see myself as being at the heart of the heart (working as an archivist), because we can’t show something without having documented what we have preserved.
The drawing encouraged Clarisse, despite a rather abstract representation, to address the central properties of her organization in terms of concrete practices. In doing so, she sought to legitimize her position within the organization, and the importance of her profession in fulfilling the organizational mission (i.e., archiving and preserving films). Drawing also brought out her feelings of pride and attachment to the core activities of the organization, which play an important role in sustaining an organization’s identity. The method can thus be an opportunity for research participants to explore what is most meaningful to them when exploring specific themes.
The act of drawing can be a good opportunity for the participants to reflect on their daily activities since the sketch may be reminiscent of noteworthy episodes. Indeed, the exercise led one employee, Adrien, to talk about how identity tensions unfolded in everyday work. He portrayed the organization by drawing a projector (drawing j), an image that may seem simplistic if the following explanation is not considered. The object glows in all directions (glimmer on the picture) and “includes all forms of moving images.” For Adrien, the projector symbolized inclusiveness, a significant feature of the organization’s identity, which, according to him, was not recognized and respected both internally and externally. He complained that the “museum status” of the organization was not promoted enough. He went on, giving an example of how this issue arose in day-to-day work: In the past, some managers had forgotten to add the sentence “museum of moving images” to the head of official letters. After noticing that, he started controlling some managers’ communications and reminded them of the importance of emphasizing the “museum status” consistently. The drawing activity helped the researcher visualize very subtle identity work—that is, the concrete efforts undertaken to sustain the organization’s main properties.
Along with highlighting the “micro” aspects of organizational practices, drawing may reveal the macro-environmental forces that influence them. Drawing (k) is a good example of this process. When invited to portray her organization, Stella, an employee of the Filmatek, drew an old man, dressed up in outworn clothes, standing on a sand path, holding a poster saying: “Wake-up, expertize, knowledge.” According to her, the image symbolized the organization’s persistent behaviors and old ways of functioning, which characterized its identity. The metaphor expressed how difficult it is for organizational members to move away from long-standing and entrenched social and cultural norms despite a strong willingness to modify their working practices.
Another participant, James, interpreted his drawing within the sociohistorical landscape of the Filmatek. The image depicts a screen attracting a large number of people represented by stick men figures (drawing l). A bar stands to the right of the picture and poster frames stand to the left. The screen is bright and what is projected brings people together, making them eager to share their ideas and passion for cinema. The drawing represents the participant’s ideal view of the organization, which he explained through criticizing the building’s architecture and design: The Filmatek was created by a group of Quebec’s elites who had received a religious education from the Jesuits, who were themselves influenced by Marxists. I would have preferred if it had been the Italian Catholics who had thought the Filmatek through because they at least have a baroque sensitivity! . . . Here, we have done everything for the architecture not be festive. . . . I’ll say it again and again: It’s an architectural failure because it’s a philosophical failure.
As the extract shows, to rationalize his perspective, James associated the organization’s visual identity (e.g., its spaces, the sensory experiences it induces) to “negative” ideological influences of the past. It’s worth noticing how the portrayed architecture does not correspond to the physical reality of the Filmatek. Rather, the participant chose to sketch its enhanced image. Even if the image connoted negative emotions (e.g., regret, anger, sarcasm), the discussion led to a more positive note. The participant expressed hope and even excitement about the organization’s future. As this example shows, the act of drawing may inspire participants to visualize their organization in a better light. The discussion that follows can be informative for the researcher, as hidden desires, ideas, motives, and strategies are made salient.
Discussion
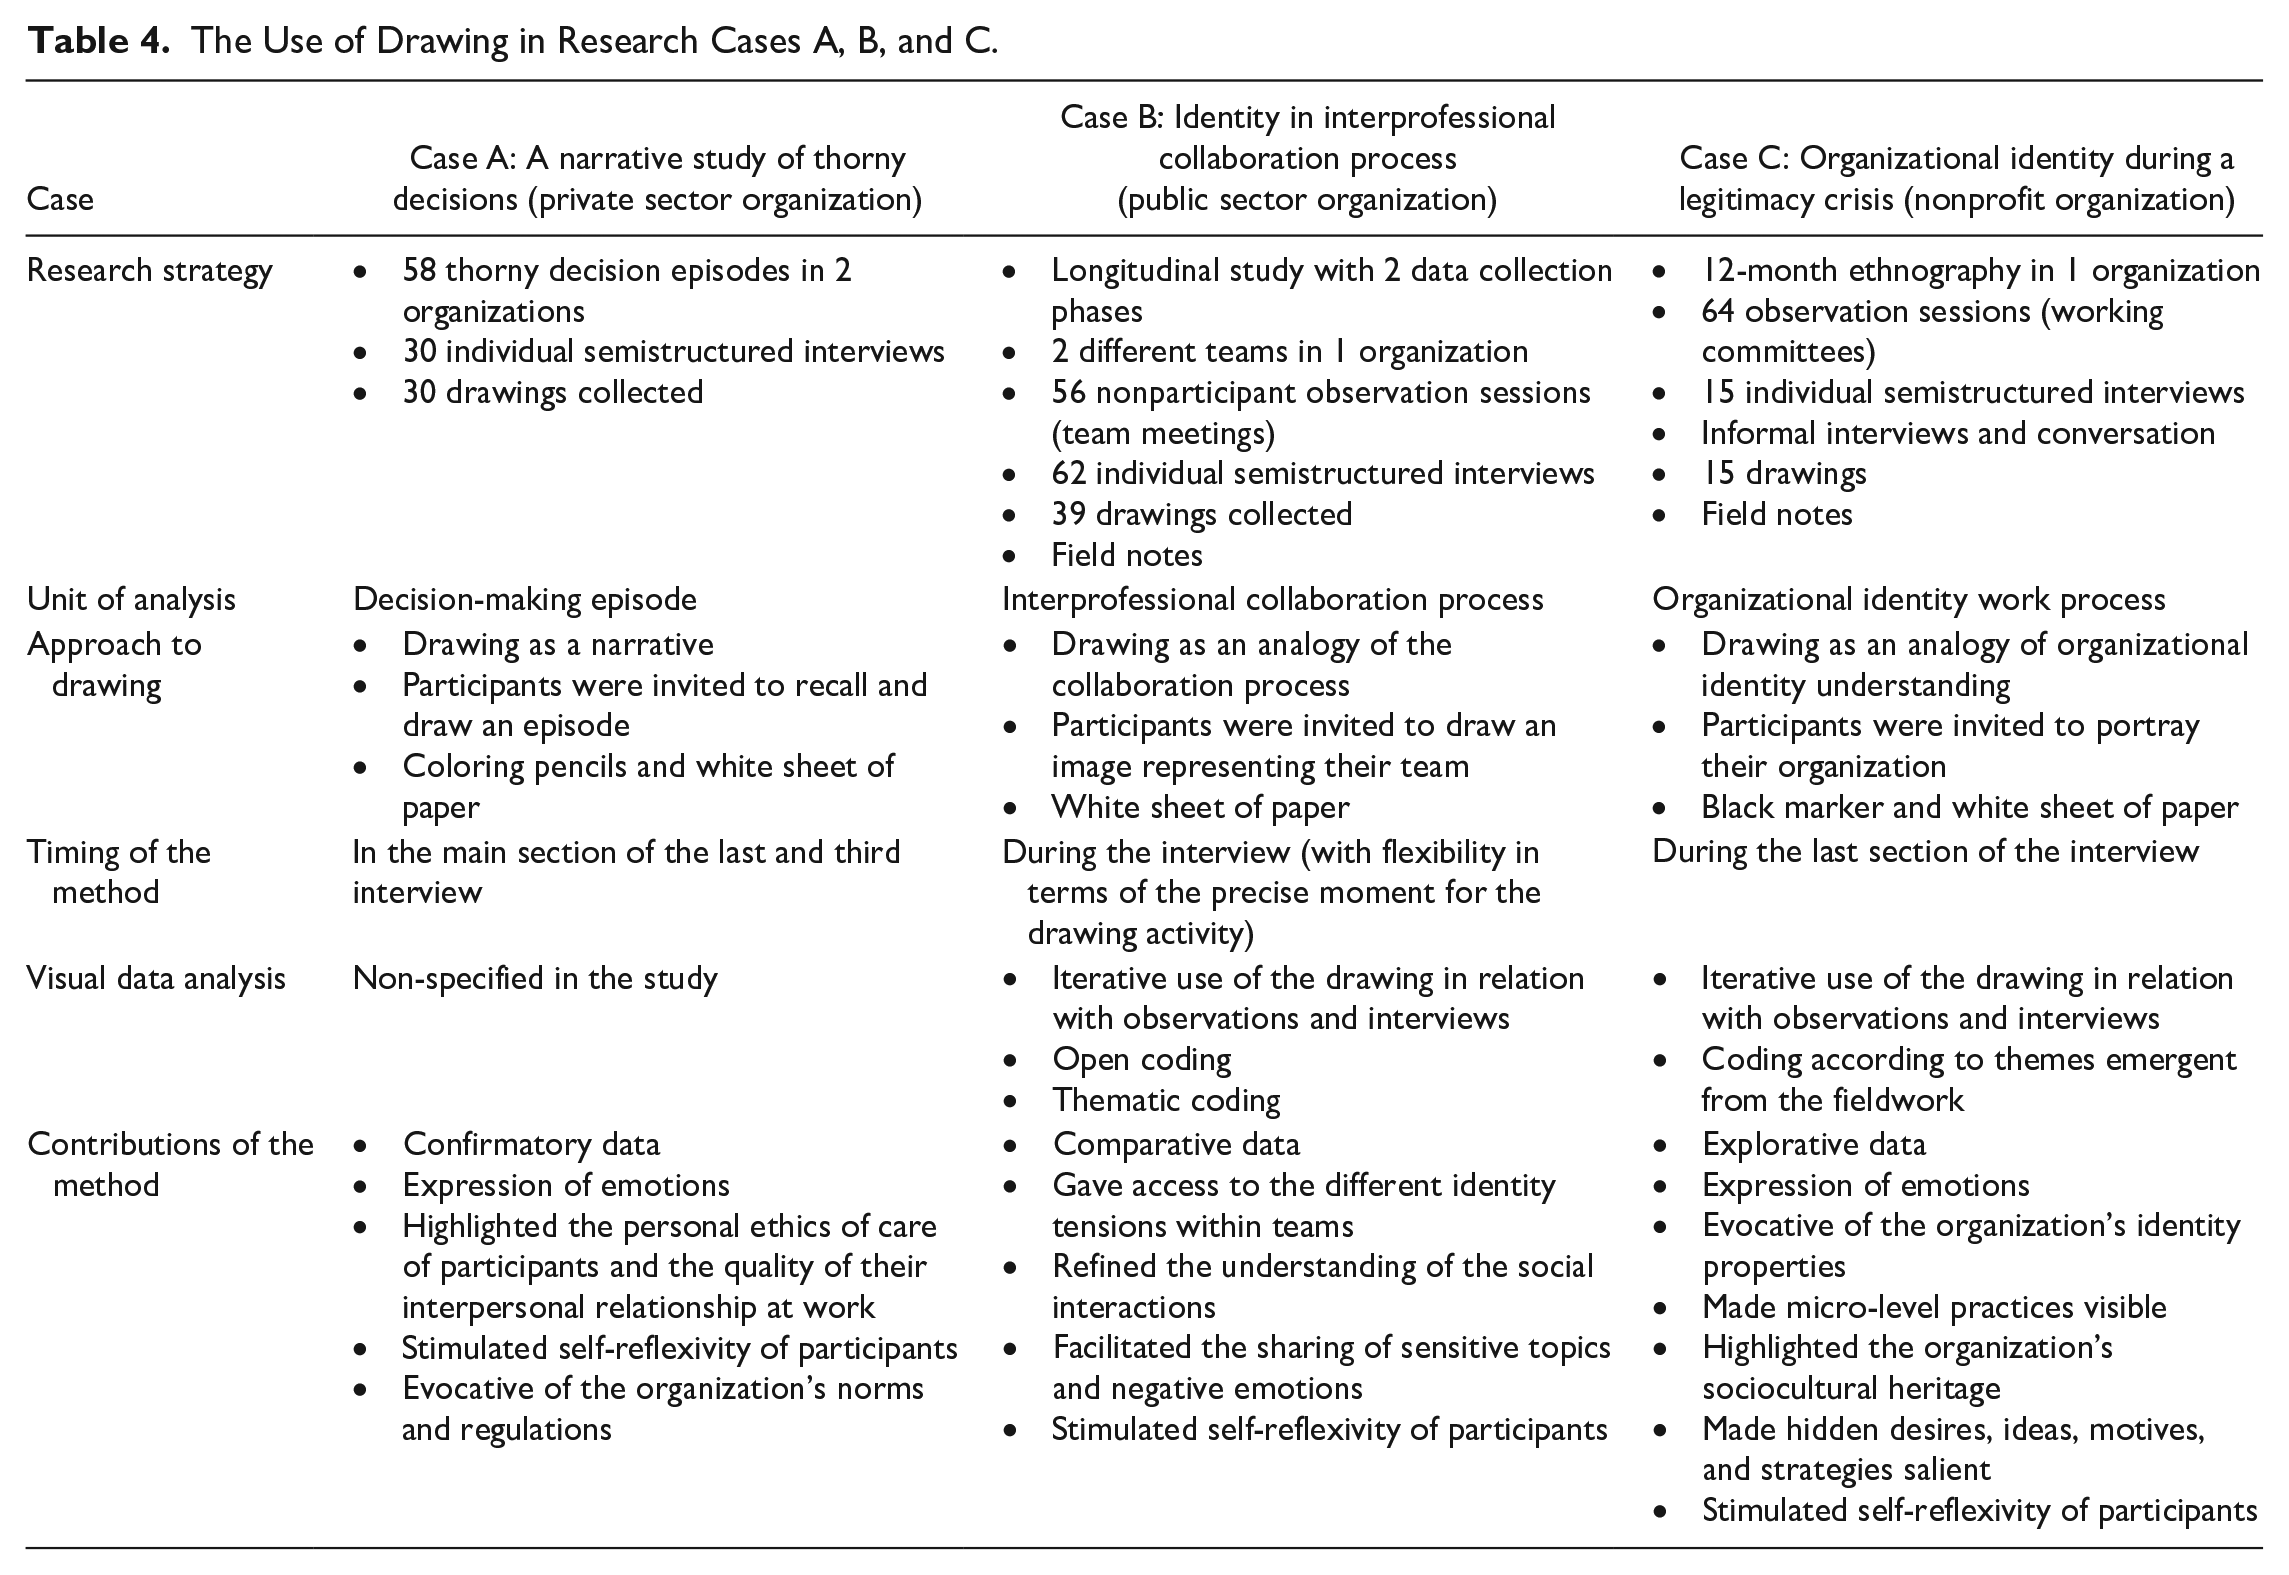
Each of the research cases above demonstrates how drawing as a data collection method can contribute to several areas of research related to change such as decision making, interprofessional collaboration, and professional and organizational identities. The studies also illustrate three ways of integrating drawing into a triangulated research design. To help organizational researchers see the potential benefits of using drawing in a triangulated research design, we will now compare the research design of the three selected cases (Table 4 summarizes our comparative analysis). The analysis has brought us to identify four elicitation processes by which researchers can get access to challenging data out of drawing. We finally put forth some guidelines for organizational change researchers who would like to include the visual method to their research design.
The Use of Drawing in Research Cases A, B, and C.
The Comparative Flexibility of Drawing
Cases A, B, and C demonstrate that there are various ways to integrate the drawing technique into a research design whatever the change situation at play. The most salient distinctions between the research cases pertain to the units and levels of analysis, and the type of use that was made of the visual data. Indeed, the images presented in Case A relate to the evolution of decision episodes at the individual level. They led to gathering retrospective data, and the researcher mainly used them to corroborate other data collected during the fieldwork. In contrast, the drawings in Case B refer to group activities. They were collected at different points in time as part of a longitudinal research design. The visual data were compared and triangulated with data from observations and interviews. Their analysis led the researcher to identify significant changes in the professionals’ interactions, thus reaching a better understanding of each team’s evolution of collaboration. The drawings in Case C highlight the organizational identity work practices in the face of a merger threat. They were collected during an ethnography, and their examination influenced the analysis of the whole data set. By analyzing the visual data, the author was able to identify a gap in the literature—namely, the lack of work exploring the role of materiality in identity work at the organizational level.
Moreover, our research cases exhibit a variation in the tools used for sketching the drawings, such as the types of pen or marker. In Case A, different colored markers were offered to participants; in Case B, the choice of the pen was left to the discretion of the participants; and in Case C, a black “Sharpie” marker was used by all the participants. Although the colors of the drawings were only considered in Case A, this may represent another avenue for analyzing the data. A further aspect to consider is that the three studies display various ways of discussing the drawings with the participants. While in Cases A and C, the drawings were discussed during the interviews, in Case B, additional discussions were held during presentations of preliminary findings. Participants were then asked to examine and talk about each other’s sketches together. These sessions of collective deliberation enriched the overall data analysis for the research project.
Evidently, the presented research cases highlight the fact that drawing as a data source is far from being homogeneous and offers multiple possibilities ranging from rather simple research design (confirmatory) to more complex ones such as comparative and exploratory designs. The same method (i.e., drawing technique) may evolve differently according to the unit of analysis (individual, group, and organizational) and combination with other data collection techniques (interviews, observation, and ethnography). The a priori simple invitation “Could you please draw me . . .” entails many opportunities to consider. Our three research cases unveil the various nuances behind the use of this visual method and the diversity of data it can generate.
In brief, the comparison of the three studies underlines the flexibility of drawing, which lends itself to a variety of research topics and contexts. It also reminds the reader that drawing offers multiple possibilities and gives rise to different applications depending on the preferred unit of analysis and its combination with other data collection methods. Another contribution of drawing is its ability to address multiple levels of analysis, thus potentially enriching our understanding of individual, group, and organizational responses to change.
The Elicitation Processes
Our review of Cases A, B, and C has led us to the identification of four elicitation processes—namely, contextualizing, focusing, exemplifying, and reflecting—by which unrevealed information is brought to light. These processes contribute to reinforcing a triangulated research design in ways that may be beneficial for organizational scholars working on topics related to change.
Contextualizing
Drawing can allow research participants to address in a more nuanced way the circumstances surrounding the multiple issues they are facing. These circumstances may be related to the environment of an individual, group, or organization. They may also describe relationships between individuals or a set of organizational principles, and thus be structural in nature. In Case A, nearly all the managers portrayed their relationships with their supervisors, employees, or with other staff members of their bank headquarters. They used stick men figures and emoticons to represent the individuals involved in their decision making. For example, Drawing (a) made visible the effect of the decision-making process on a whole team with a serious deterioration of its working atmosphere. Drawing (c) emphasized the organizational structure in which the decision had been made (i.e., norms and rules) by using colors associated with the institution’s branding.
Contextualizing emerged as a process in some of the Case C drawings, where participants interpreted their drawings within the sociohistorical landscape of their organization. Indeed, some managers explained their sketch by underlining specific turning points in the organization’s history—that is, past decisions that have shaped its present mission and trajectory. The projector in Drawing (j) alluded to the fact that the organization had chosen to expand its mission in the 1990s, becoming a museum of moving images. In Drawing (l), the participant sketched the organization’s interior spaces, which gave him the opportunity to explain the cultural influences that led the Filmatek’s founders and previous managers to make particular aesthetical and architectural choices for its main building.
Contextualizing entails linking the drawings to a set of relevant but taken-for-granted relations, events, facts, or norms and values that were not mentioned in interviews or observed. Therefore, this process gives the possibility for the researcher to reinforce the analysis and even open some possibilities of interpretation. Given organizational settings are becoming more and more complex and diversified, the use of drawings may help organizational change researchers better capture the contextual specificities in which change is occurring (Pettigrew et al., 2001).
Focusing
As it is not very restrictive compared with other visual methods, drawing offers participants more freedom in focusing on the elements they judge relevant or most important regarding a specific topic. The authors of the three research cases noted that drawing had the effect of exacerbating or revealing the desires, interests, and emotions of many participants. The stick men figures and emoticons in Case A reflected the emotions managers felt when assessing their memories regarding a thorny situation. Strongly present, the red color refers to their feelings of anger or dissatisfaction. In Case B, the twisted figures in Drawings (e) and (f) refer to the feeling of confusion arising from the collaborative process. Similarly, several participants in Case C expressed intense emotions when commenting their composition (e.g., joy, pride, exasperation, anger). These were palpable not only in the tone of their voices but also in their choice of images to portray their organization. Hence, the old man advancing on a sandy path in Drawing (k) alludes both to the participant’s hope and despair toward the future of her organization.
In all three cases, research participants also relied on more or less complex symbols that synthesized their thoughts on the subject of inquiry. There is a telephone and documents in Drawing (a), a clock and letters in Drawing (b), a dollar sign and a green box in Drawing (c). These figures were used as symbols of key elements that played an important role in the decision-making process. In Case B, drawing seemingly encouraged participants to capture the central tensions within their team. The circles in Drawing (e) and the branches in Drawing (h) refer to the identity process of professional differentiation. Other examples of focusing with symbols may be found in Case C. As mentioned previously, the drawing of the old man (Drawing k) was created to accentuate the organization’s inability to adapt adequately to its environment. The metaphor’s meaning is rather complex: The image condenses facts, ideas, and desires of organizational members from the past and the present. All of these elements that are difficult to observe or capture through words are of great interest for organizational change researchers. Indeed, change initiatives often jolt the deepest roots of an individual’s relationship with their organization (Carr, 1999). It is therefore necessary to grasp all the subtleties and nuances of the emotional shock in order to have a better understanding of the whole change experience.
Exemplifying
Drawing can also enrich the interviews through the process of exemplifying. In several interviews, participants used their sketch to illustrate specific issues related to their work practices. Case A participants explained how they attempted to bypass institutional policies to favor a customer or an employee in their decision-making process (Drawings a and d). In Case B, the author of Drawing (g) explained his choice of image by telling a particular episode related to the administration of drugs to patients. The example offered additional information about the team’s hierarchy and the emotional dynamics at play between the doctor and the other professionals of the team. Likewise, many participants of Case C interpreted their drawing by providing examples of how identity struggles materialized in organizational practices. The employee who drew a tetrahedron to represent the Filmatek’s core properties (Drawing i) attributed personal meaning to those elements by linking them to her responsibilities and day-to-day tasks. The manager who sketched the metaphor of a projector (Drawing j) justified his choice of image by revealing the efforts he had made to overcome specific organizational identity problems in everyday practices. Drawing can therefore allow better accessibility to organizational structures, practices, and their meanings. Since such elements are difficult to grasp in times of change, researchers may benefit from including drawing in their research design.
Reflecting
The three research cases demonstrated that the integration of drawing can stimulate reflexivity, the formulation of opinions and critiques among participants regarding their role, position, work, and organization. Being at the heart of the learning process, reflexivity is simultaneously an important skill and tool for producing change and achieving learning (Eriksen, 2008). Case A participants all portrayed themselves at the heart of the decision-making process. The self-portrait led them to meditate on their managerial role and on the fit between their personal values and the ones of their organization. They sketched themselves either alone or in relation to employees or customers. The participants who illustrated relationships expressed a greater level of consideration for others while making difficult decisions.
The reflecting process appeared differently in Case B. Since the research involved two periods of data collection, the participants were asked to compare their team’s collaboration at different times (T1 and T2), which meant creating two drawings. Each time, the participants tended to describe the collaboration’s evolution by identifying elements that have changed over time. For example, in Drawing (h), the leadership practices of T1 were set in contrast with the T2 leadership practices. Drawing had the effect of stimulating critical thinking regarding the team’s collaboration: In Drawing (f), the sketcher indicated that collaboration could be improved by a better team structure. Sketching prompted individuals to evaluate their team’s level of collaboration by sharing their negative or positive perceptions of it. The reflective process was also ongoing, as the Case B researcher presented the drawings to team members during report sessions. This led the group to discuss drawings other than their own and, more precisely, engage in the research’s data analysis.
In Case C, participants immersed themselves in a reflexive process when drawing. Drawers of sketches (i) and (j) adopted a critical stance toward their organization’s mission fulfillment. In sketch (i), the employee presented herself and her team “at the heart of the heart” of the organization’s purpose. The manager who made the projector (Drawing j) felt he had to act as the gatekeeper of the Filmatek’s mission. The drawing activity revealed how these participants legitimize their actions and roles, and position themselves within their organization. For Case C participants, reflexivity also meant sharing their ideal vision of the Filmatek. The employee who portrayed the old man (Drawing k) judged her organization to be reluctant to change, but her comment was rather positive and expressed trust in the organization’s ability to move forward. Quite the opposite, the manager who drew stick figures and architectural spaces (Drawing l) illustrated his “dream version” of the organization but strongly criticized the way decisions had been made in the past.
Guidelines
As we have seen in the literature review, drawing is best suited to gather insights about tacit emotions, cultural systems, and identities (e.g., Alcadipani & Tonelli, 2014; Stiles, 2011; Vince & Broussine, 1996), which are important aspects of change situations. We know that the benefits of the technique is heightened when the participants are encouraged to analyze the drawings themselves (Guillemin, 2004; Mitchell et al., 2011). Still, there is a lack of information about the practice of using and analyzing drawing in triangulation with other data collection methods. Organizational researchers may feel devoid of methodological guidelines. Hence, we close our discussion with some additional considerations based on the reflexivity of the Cases A, B, and C researchers, who have worked with drawing as a complementary method. These considerations include some advice on the collection and the analysis of drawings in a triangulated research design.
First, there is an appropriate time to collect the drawings. The three research cases showed that this timing may vary. In Case A, the drawings were collected in the third interview; in Case B, they were collected following several field observations; and in Case C, they were collected after many days spent on the field. The researchers of each study spent a lot of time on the field and acquired a certain experience before collecting the drawings. Indeed, we suggest introducing the technique once a bond of trust has been developed between the participants and the researcher. If no contact is possible before the interview, the collection of drawings should be handled like another sensitive question of the interview (i.e., the researcher should insert the invitation to draw when he feels that the timing is appropriate). Additionally, we encourage researchers to remain attentive to the way participants are sketching, by noting the main emotions that arise, their body language, and the intonation of their voice when explaining their drawing. This additional information may ease the conversation and enrich the analysis as well.
Second, we wish to bring up details about the way drawing is carried out on the field. Being asked to draw may be surprising for some participants. Some may be worried about their art skills. Organizational change researchers should be reassuring, for instance, by specifying that the “artistry” of the drawing is not important and that no aesthetic evaluation will be made in this sense. The researcher should also consider the length of time allotted to participants to accomplish their draft. The longer the exercise, the more time the participants will have to cogitate and censor themselves. On the other hand, providing too little time can alarm and paralyze a participant. We encourage organizational change researchers to tailor the allotted time for drawing according to their object of study. For example, topics that refer to personal matters such as identity and emotions may need more spontaneity whereas topics like learning and change processes may require more time since they involve a certain reflection on past and future events.
Our third consideration involves the analysis of the visual data. As we have mentioned, employing drawing entails that participants are asked to describe the content of their sketches with written or spoken language. Engaging them in this explanation process helps in reducing the researcher’s subjectivity in the data analysis. One of the premises of participatory methods is taking a diversity of voices into account. It is thus important to foster openness and reflexivity when trying to make sense of the visual data. To achieve this posture, the participants should be questioned about their compositions—the choice of colors, the size of figures, the core and the peripheral elements, and so on. This should be done even if some written material accompanies the drawings since it is an occasion to gain an even deeper understanding of their view points. Also, researchers should adopt a bird’s-eye perspective by considering the overall visual data set. Comparing the drawings between participants may be helpful for identifying content and meaning patterns. This can be done collectively if the research topic permits it. As we have seen in the literature (e.g., Barner, 2007) and with Case B, a collective analysis of the drawings is another way to enable voices and reflexivity in the research process.
Conclusion
This article demonstrates the potential contributions of drawing as a data collection method in organizational studies. By examining three research projects, we have identified the elicitation processes by which drawing can enrich the overall data set when researching topics related to change. Contextualizing is the uncovering of the circumstances surrounding a question, a topic, or an issue that relates to the environment of an individual, a group, or an organization. Focusing is the process by which the act of drawing enables participants to center their attention on a point that could be considered “out of scope” in relation to the research’s main theme. Employing drawing can lead them to open up about the subjective experience of their work like organizational norms and practices. This is what we have identified as exemplifying. Finally, the process of reflecting allows participants to take the time to explore ambiguous, unpleasant, or even paradoxical emotions with the researcher. These four processes contribute to the literature by clarifying the ways drawing brings out important supplemental information. We hope to have incited researchers adding drawing to their research design, but more important, we hope that the elicitation processes form a convincing base for justifying the use of this original method.
The literature in organizational studies increasingly recognizes methods that promote the involvement of participants in the research process. This openness extends to visual methods and, of course, to drawing. While our article highlights the potential contributions of this method, the need to develop tools to analyze visual data remains. We have observed that this aspect is often overlooked in research using drawing as if their analyses were self-evident. Future methodological studies should focus on the development of analytical approaches and techniques adapted to this type of data.
Footnotes
Declaration of Conflicting Interests
The author(s) declared no potential conflicts of interest with respect to the research, authorship, and/or publication of this article.
Funding
The author(s) received no financial support for the research, authorship, and/or publication of this article.