
Abstract
The Republic of Korea Government implemented a universal consumption subsidy program to combat the coronavirus disease 2019 (COVID-19) economic downturn in 2020. Using granular, micro-level transaction data, we find that the subsidy scheme has stimulated household consumption immediately after receipt. Moreover, lower income groups demonstrate higher marginal propensity to consume than middle and higher income groups; this holds true even when creating synthetic control groups that model rational spending behavior. This can have a significant implication on the effectiveness of fiscal impulse. Using income and average historical credit card spending, we also demonstrate credit and liquidity constraints are major factors affecting consumption responses.
Keywords
Introduction
The adverse economic impacts of the ongoing coronavirus disease 2019 (COVID-19) pandemic have been broad-based globally, the unprecedented health crisis leading to the worst economic recession since the Great Depression of the 1930s.
Asian Development Bank (ADB) estimates indicate that global losses from COVID-19 could total US$4.8 trillion to US$7.4 trillion, 28% of that decline coming from developing Asia (Abiad et al., 2020). A separate report estimates developing Asia contracted 0.2% in 2020, a stark contrast to the 5.0% expansion of 2019 and the region’s first recession in more than half a century (ADB, 2021).
As the outbreak spread worldwide in March 2020, governments implemented strict movement restrictions to contain the disease, shutting down the physical operations of many industries, implementing strict social distancing guidelines, and suspending public transportation, among others. These measures slashed business activities and individual consumption, crippling many economies. Studies show that declines in consumption account for a significant portion of the contraction of gross domestic product (GDP) in most economies. In the first quarter (Q) of 2020, private consumption contracted 34.1% in the United States, 16.8% in the euro area, and 28.9% in Japan (ADB, 2020).
Governments have acted decisively to mitigate economic losses from extended containment through unprecedented fiscal stimulus and monetary easing measures. The former includes supplementary budgets for disease prevention and treatment, credit support for small businesses, tax concessions, subsidies for dining and transportation, unemployment assistance, and support for low-income households. For households, many countries have provided emergency and temporary relief through direct cash transfers to partly cover vital expenditures such as food, utility bills, mortgages, house rental fees, medical expenses, and transportation costs (International Monetary Fund (IMF), 2020).
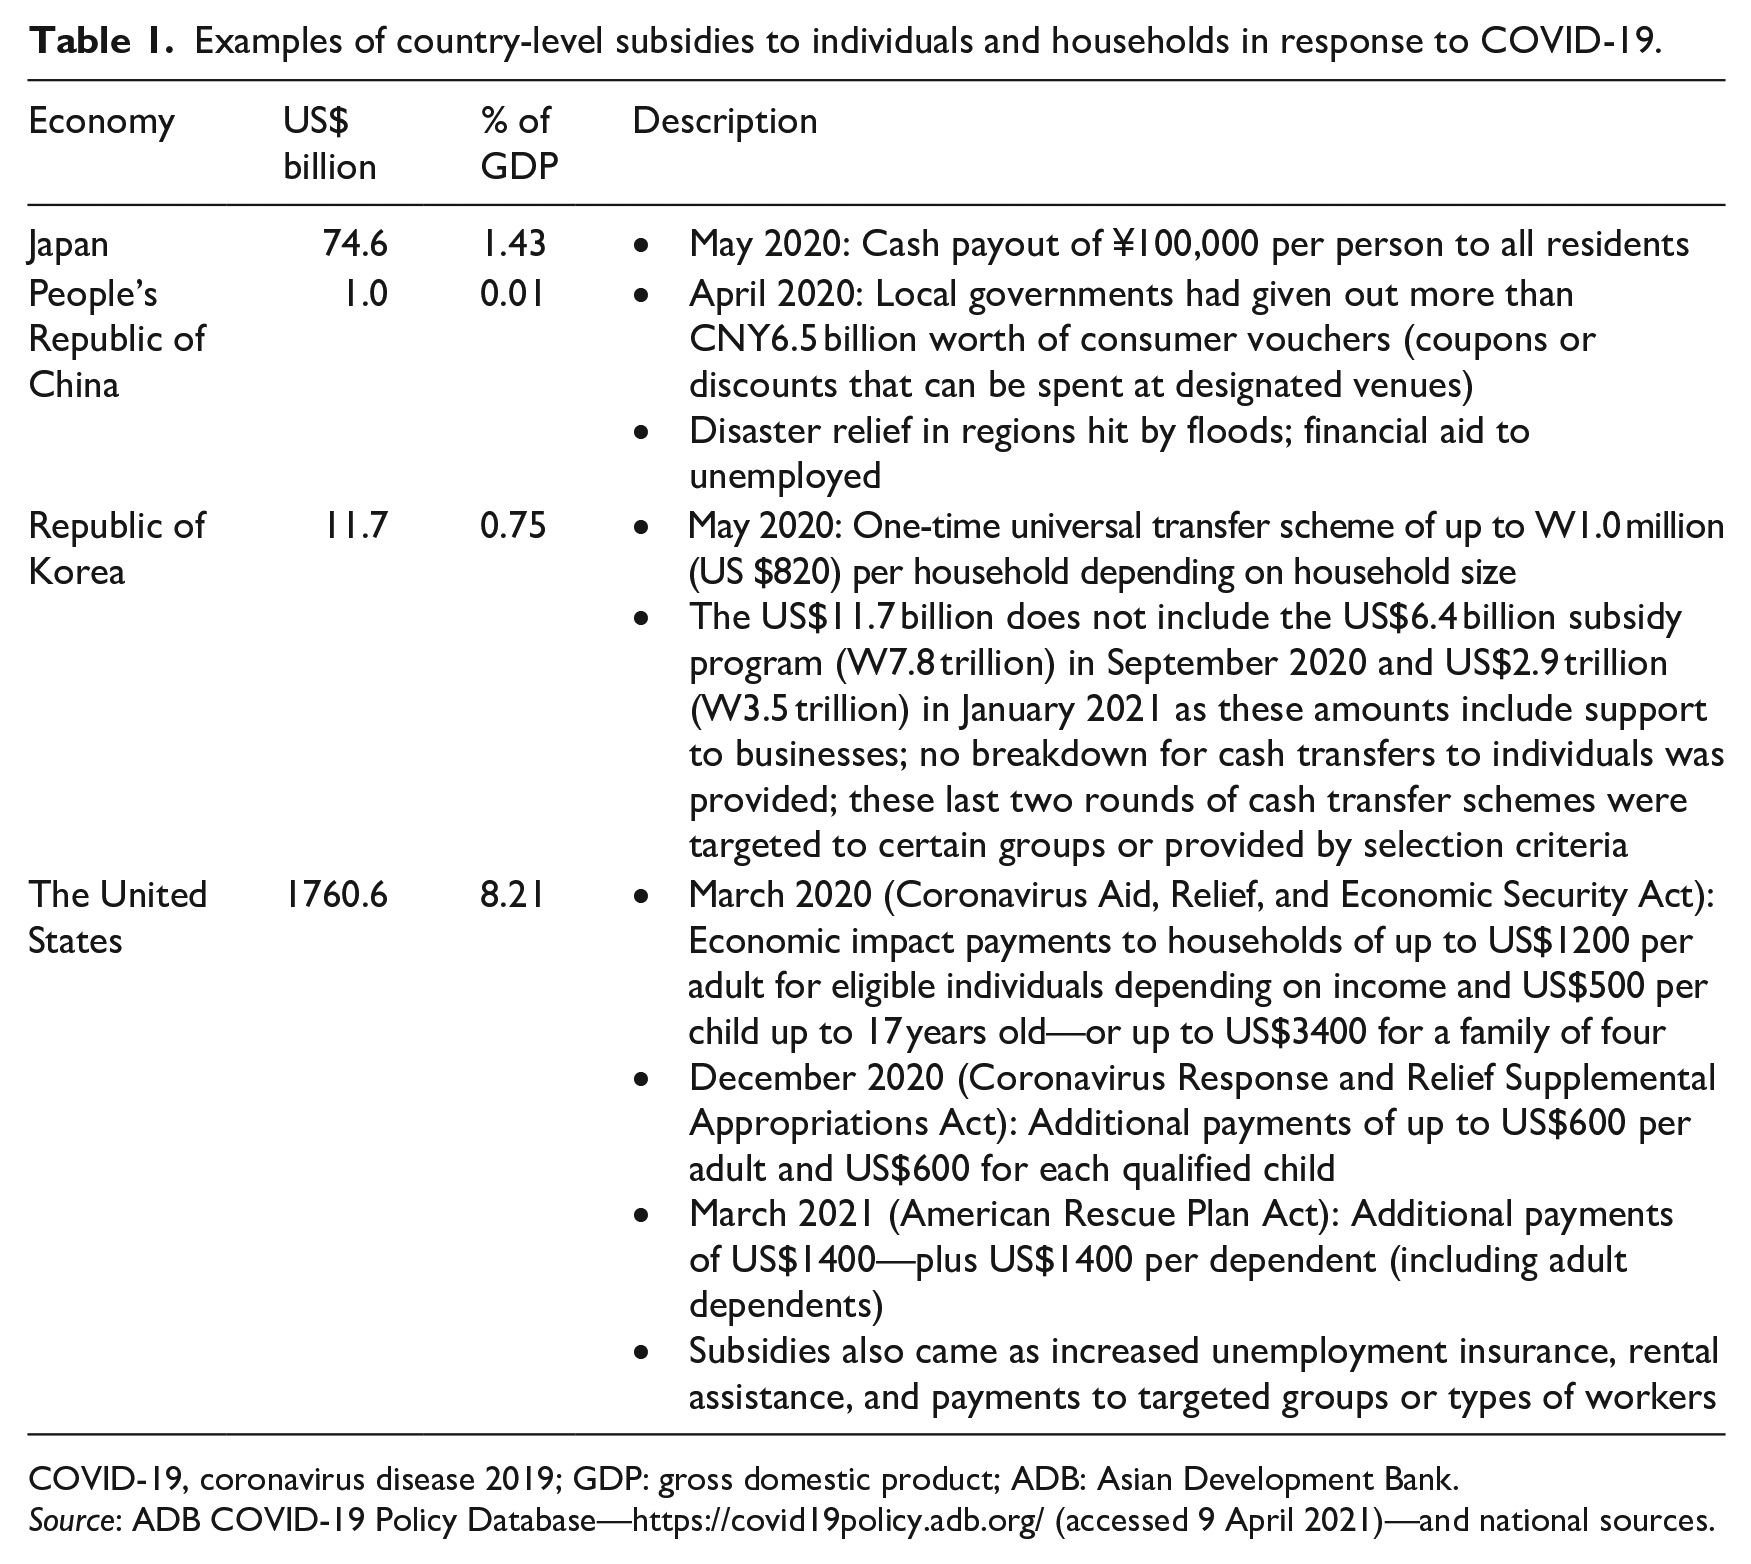
Table 1 presents selected country-level examples of COVID-19-related subsidies to individuals and households, including cash transfers, based mainly on ADB’s COVID-19 Policy Database. The US federal government in March 2020 distributed cash transfers to households of up to US$1200 per adult depending on income and number of dependents, and US$500 per child. Two more rounds of additional transfers were provided in December 2020 and March 2021, amounting to up to US$600 and US$1400 per adult, respectively. The US government’s total subsidies to individuals and households—including these cash transfers as well as increased unemployment insurance, rental assistance, and payments to targeted groups or types of workers—amounted to almost US$1.8 trillion or 8.2% of GDP.
Examples of country-level subsidies to individuals and households in response to COVID-19.
COVID-19, coronavirus disease 2019; GDP: gross domestic product; ADB: Asian Development Bank.
Source: ADB COVID-19 Policy Database—https://covid19policy.adb.org/ (accessed 9 April 2021)—and national sources.
Japan and the Republic of Korea, as noted, implemented universal transfer schemes in May 2020. In Japan, the cash payout given to all residents was 100,000 yen (¥) (around US$900) per person, equivalent to a total of US$74.6 billion or 1.4% of GDP. The Republic of Korea’s 14.3 trillion won (W) (US$11.7 billion, 0.75% of GDP) relief program provided up to W1.0 million per household (or around US$820.0) depending on household size (see Section 3). Subsequent rounds of subsidies in the Republic of Korea (September 2020 and January 2021), unlike the first round, targeted groups based on certain selection criteria. A subsidy scheme in the People’s Republic of China’s local governments distributed consumer vouchers in April 2020, which can be spent at designated establishments.
Several other Asian economies also implemented cash transfer programs. Hong Kong, China, gave cash payouts to residents over 18 years old. India, Malaysia, the Philippines, Thailand, and Vietnam implemented emergency cash transfers to low-income families and/or other targeted groups.
Fiscal relief packages, however, do not come without a cost. Without a strong resource base, extending cash transfers, although essential during the crisis, could increasingly strain public finances by widening fiscal deficits and accumulating debts. Given limited fiscal space, governments aim to maximize policy impacts of fiscal stimulus programs, including cash subsidy programs for households, which have been rolled out and continue to be contemplated on a massive scale. Measuring the spending effect of income subsidies either through tax rebates, lower withholdings, or time-bound coupons has lately been at the center of various empirical economic research, even before the onset of the COVID-19 pandemic.
Shapiro and Slemrod (2003) study how US households responded to a 2001 tax rebate using survey techniques. They find the increase in spending amounts to only 21.8%, as many households choose to save or repay debt. Different behavioral responses could be explained by various hypotheses, such as Ricardian equivalence and the effect of liquidity constraints. If a household believes that there will be no change in well-being through one-off income, it will not affect spending behavior. According to the permanent-income hypothesis, consumption should respond only to unexpected changes in income. In addition, a household under liquidity constraints tends to spend additional income more quickly than those under no such pressure.
Unlike conventional belief, however, their survey results do not support the hypothesis that lower income people have higher propensity to consume. Counterintuitively, they show that households in worse financial condition than the previous year are less likely to spend more because of the rebate. However, this could be associated with future income prospects at the same time.
Johnson et al. (2006) test a permanent-income hypothesis based on consumption patterns in response to the US federal income tax rebate in 2001, showing a significant increase in household spending due to the rebate. A household increased average expenditure on food by 11% of the rebate, its expenditures on strictly non-durable goods by 24%, and on non-durable goods (broadly defined) by 37% within 3 months of the rebate receipt. In sum, the pattern of coefficients suggests a large increase in expenditure at the time of rebate receipt, then a decaying but still substantial effect in the subsequent quarter or two. These results are inconsistent with the benchmark rational-expectations version of the permanent-income hypothesis. Under this model, no expenditure response should occur to the receipt of the (publicly preannounced) rebates, because its arrival brings no new information about lifetime wealth.
Hsieh et al. (2010) analyze the impact of Japan’s “shopping coupons” rolled out in 1999 with 6 months expiry date, using household-level and commerce survey data. The “use-it-or-lose-it” nature of the coupons could distinguish the program from conventional tax rebates. They find the coupons had a positive effect on expenditures on semi-durables. Estimates using household-level data suggest that the marginal propensity to consume (MPC) of semi-durables was 0.1 to 0.2 when the coupons were distributed in March but zero in subsequent months. This suggests households tend to consume coupons relatively quickly. (In our case, the Republic of Korea households were allowed to file for the subsidy allowance anytime during the 4 months window until the expiry date. This can prompt people to anchor the timing of filing around the timing of their planned expenditures.) Contrary to what the intertemporal substitution of spending hypothesis suggests, Hsieh et al.’s results using regional variation provide stronger evidence that spending did not fall after the coupons had been redeemed, supporting the argument that the coupons had net consumption boosting effect.
Analyzing the impact of US fiscal policy, Sahm et al. (2012) quantify the spending response and examine differences in spending by whether stimulus was delivered as a one-time payment or as a flow of payments from reduced withholding. They find that the reduction in withholding in 2009 boosted spending at roughly half the rate (13%) of the one-time payments (25%) in 2008. They also find the spending responses of households did not differ by whether the household believed that the lower withholding represented a permanent or temporary change in taxes—a pattern at odds with the permanent-income hypothesis. Their approach provides evidence of the behavioral response as a function of visibility. They find that the majority of households did not notice the withholding changes.
Baker et al. (2020b) analyze the effect of the 2020 US Coronavirus Aid, Relief, and Economic Security (CARES) Act, which directed large cash payments to households. They analyze households’ spending responses using high-frequency transaction data from a financial technology non-profit, exploring heterogeneity by income level, recent income decline, and liquidity. Households respond rapidly to the receipt of stimulus payments, with spending increasing by US$0.25 to US$0.40 per dollar of stimulus during the first weeks. Households with lower incomes, greater income drops, and lower liquidity respond more strongly. This highlights the importance of targeting subsidies instead of providing a universal income subsidy.
The literature, mostly using the survey data, suggests salient points associated with the effectiveness of government’s fiscal policy through income subsidies. First, the intertemporal spending substitution effect does not seem to be significant, as households recognize the unexpected subsidy as additional income readily available. This is also true in the case of time-bound coupons distributed. Second, liquidity or credit constraints are an important factor to affect spending behaviors. People with constrained liquidity tend to spend more of the subsidy more quickly. Third, the empirical evidence of the relevance around the permanent-income hypothesis is not clear—indeed, ambiguous at most. Fourth, the economic theory that people with lower incomes have larger MPC remains an empirical question to be tested.
These findings motivate and characterize the setting of this study in examining the varying MPC across income groups. We examine whether the one-time government income subsidy with specific expiry date brings meaningful differences in MPC across income groups and the potential role of liquidity constraints in exerting such differences. Covering both subsidy account and regular account data, we could control for immediate cross-account or the contemporaneous substitution effect.
Motivations
With the threat of prolonged COVID-19 impact and daunting post-pandemic economic recovery challenges, evaluating the impact of fiscal stimulus policies is critical to informing ongoing and future implementations. Several studies have examined the effect of cash transfers on gross consumption patterns, such as the MPC (Baker et al., 2020b), or changes in gross consumption patterns (Carvalho et al., 2020).
However, rather than just gross consumption, it is important to determine whether these cash transfers generate a net increase in individual consumption, the true barometer for policy effectiveness. This is because changes in gross consumption could possibly be attributed to substitution effects, as individuals may only be increasing spending in essential categories while decreasing spending elsewhere. For instance, an individual may increase spending in the account into which the direct transfer was deposited, which has been illustrated in various studies (Baker et al., 2020a; Cox et al., 2020; Kim and Lee, 2020). However, that same individual might moderate her spending in other accounts, resulting in no net increase in overall consumption. In effect, the direct cash transfer may be seen as a windfall gain that may or may not lead to an increase in individual spending (Arkes et al., 1994; Soman and Cheema, 2001).
Moreover, the severity of city-level lockdown measures may impact the consumption behavior of beneficiaries. More stringent restrictive measures may depress individual expenditures more, because of decreased mobility, barriers to leisure and entertainment, and much more.
Hence, this study seeks to determine the causal impact of cash transfers on individual consumption by using high-frequency credit card transaction data in the Republic of Korea. Credit card is the most preferred non-cash mode of payment in that country. Non-cash payments had gained popularity even before the COVID-19 pandemic due to well-developed payment infrastructure, a well banked population, and high financial technology awareness among consumers (GlobalData, 2020). As a result, the share of non-cash payments in the overall transaction volume increased from around 42.4% in 2015 to around 54.9% in 2019 and is projected to increase further to 62.8% in 2023 (Figure 1). Around 75% of these non-cash payment transactions are made through cards, and almost 50% through credit cards—almost double the 25% share of the United States. 1 Credit card payment value in the Republic of Korea has also been rising steadily, reaching over W700 trillion in 2019, and expected to increase through 2023 (Figure 2).
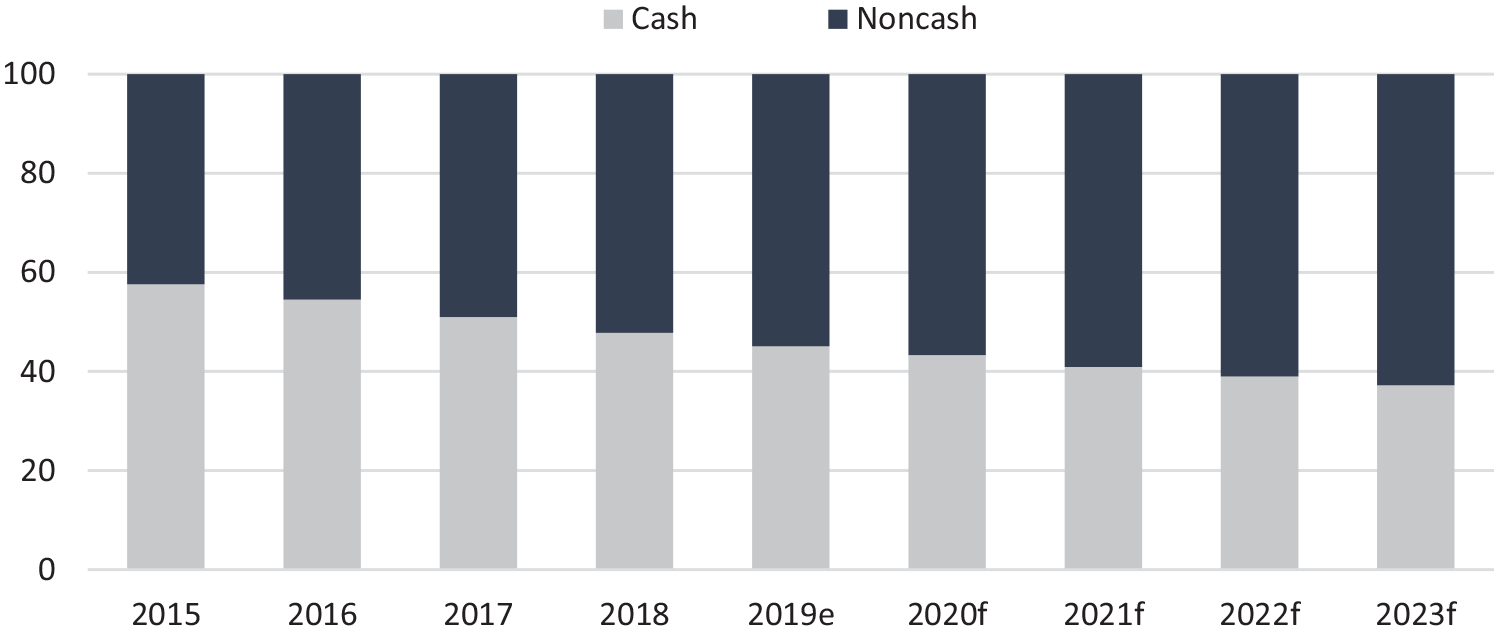
Cash versus non-cash payments volume—Republic of Korea (%).
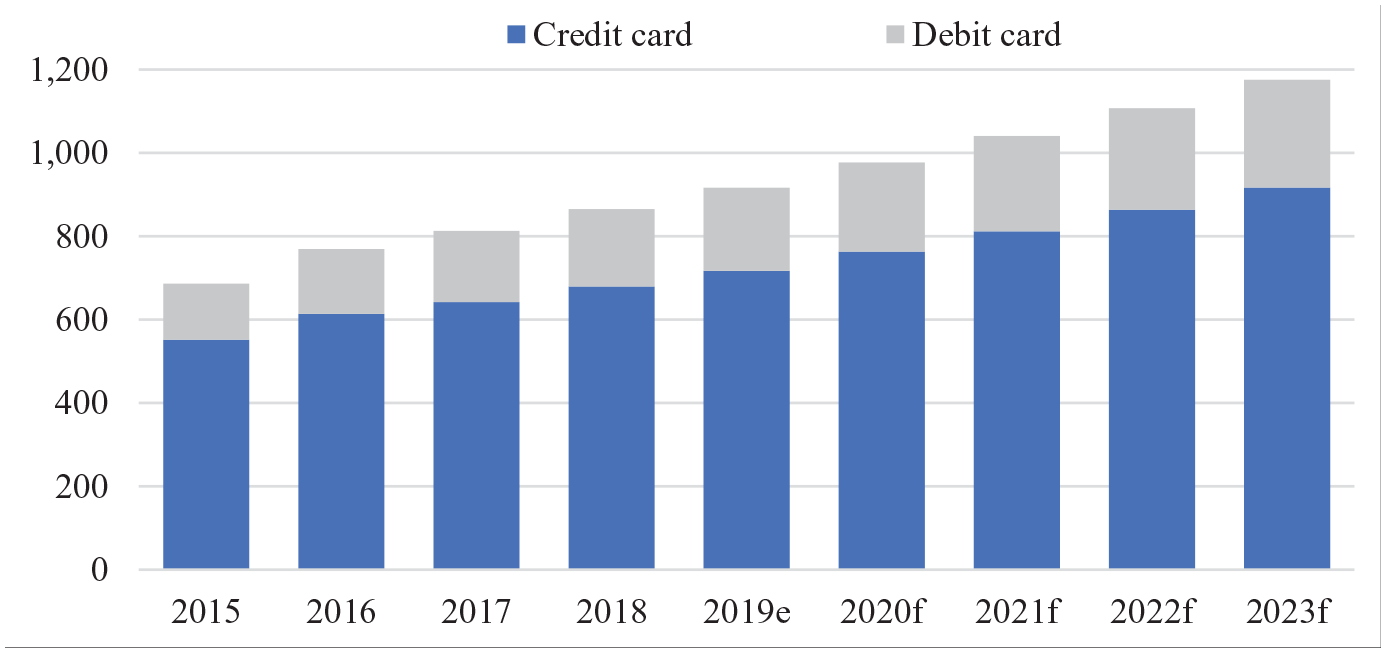
Card payment transactions value—Republic of Korea (trillion won).
The main findings and key contributions of this research are as follows:
The time-bound household cash subsidy in the Republic of Korea shows a significant spending increase during the first weeks across all demographic categories.
Propensity to consume measured by MPC shows that lower income groups tend to have larger MPC, as theory implies, even after controlling for the contemporaneous cross-account substitution effect.
This is also evidenced by the robustness check through counterfactual exercises, and liquidity constraint proxied by historical expenditure amounts seems to be among the crucial factors affecting the result of step 2.
Additional heterogeneity across vocations and geographic location further support the need for targeted policy implementations.
This paper is structured as follows. The “Republic of Korea’s subsidy scheme” section discusses the key features of the Republic of Korea’s subsidy scheme implemented during the peak of the pandemic from May to August 2020. The “Data and model specification” section discusses the data source and model specification. The consumption responses and estimated MPCs are presented in the “Consumption response” section. The “Conclusion” section concludes.
Republic of Korea’s subsidy scheme
To combat the downward pressure of the COVID-19 pandemic, the Republic of Korea government implemented a stimulus subsidy scheme in the middle of May 2020. The subsidy amount depended on the number of household members: W400,000 for 1-person household; W600,000 for 2; W800,000 for 3; and W1,000,000 for 4 or more. 2
One key feature of the stimulus program is that recipients are constrained to spending within certain limitations. These include spending only within their province of residence, within specific sectors, and within a set time period (until end August 2020). As such, recipients were not permitted to spend on large retailers or franchises, with the exception of Seoul residents, who were allowed to do so provided that the head office of said franchises is based in Seoul. Some restrictions were intended to aid local business and micro, small, and medium enterprises who were bearing the brunt of the economic fallout from the pandemic (Government of the Republic of Korea, Ministry of Foreign Affairs, 2020). Despite constraints attached such as prohibition of spending in larger department stores and entertainment shops, recipients were allowed to use the subsidy for a wide range of purposes without much restriction.
There were four different methods to avail of the subsidy: (1) credit card or check card, (2) gift certificate or voucher, (3) prepaid card, and (4) cash for recipients of the national basic livelihood security, disabled pensioners, and basic pensioners (senior citizens who earn incomes below the household income recognized by the policy). Korean citizens could apply either online or offline from mid-May 2020 to the first week of June 2020. In addition, all subsidies were made available until 31 August 2020, after which any remaining balance would be revoked (Ministry of the Interior and Safety, 2020). Government data show that the vast majority of households (95.0%) applied for the subsidy within the month of May, and almost all the subsidy received (99.5%) was spent within the spending deadline of 31 August. This suggests even high-income group households used up the subsidy within the prescribed time period without leaving any amount unutilized.
Data and model specification
This research uses a large, proprietary, high-frequency, micro-level dataset from Shinhan Card, covering 1,074,630 unique individuals from Seoul and Kyunggi province. Shinhan Card is the biggest credit card company in the Republic of Korea, capturing 21.7% of the market in 2020. 3
In contrast to previous studies, the Shinhan credit card transaction dataset captures daily spending per individual, which has been anonymized according to the Financial Security Institute authorized standards. In addition, unlike similar datasets, it includes information on the account spending allocation of each individual, that is, whether spending is made through the subsidy account or otherwise. This allows us to decompose the account-specific effect of the subsidy. The dataset is also the first to include individual-level information on occupation and family structure. For this study, we examine data in May 2020, or
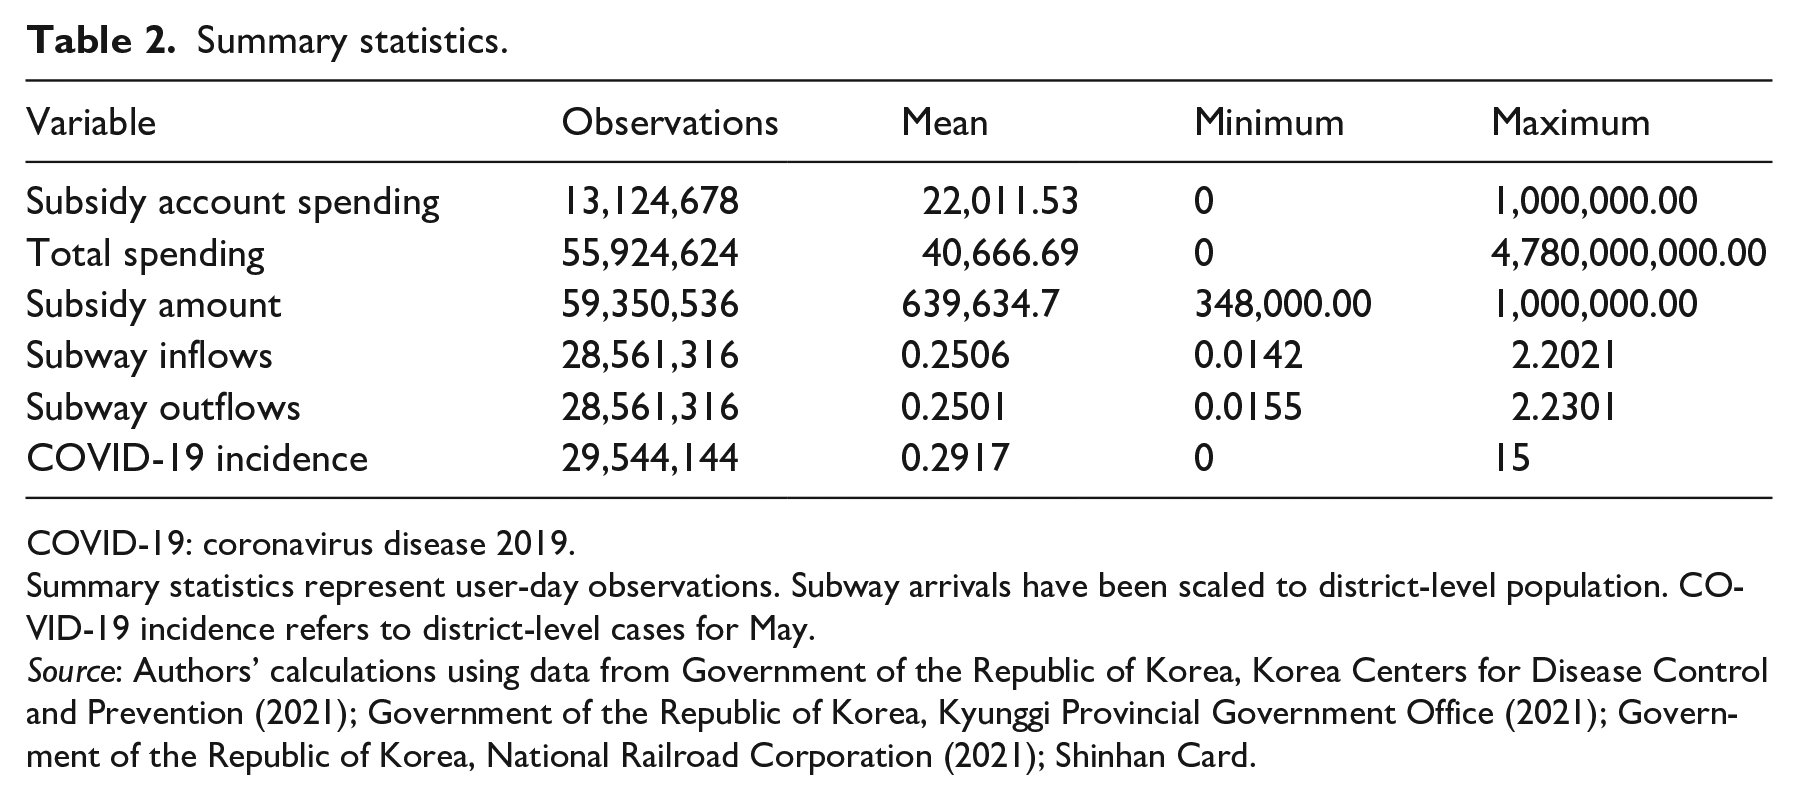
These data adequately capture spending behavior, as 23% of individuals in the dataset spent at least half of their subsidy amount within the period covered, while 62% spent at least a quarter of the subsidy. Table 2 presents summary statistics.
Summary statistics.
COVID-19: coronavirus disease 2019.
Summary statistics represent user-day observations. Subway arrivals have been scaled to district-level population. COVID-19 incidence refers to district-level cases for May.
Source: Authors’ calculations using data from Government of the Republic of Korea, Korea Centers for Disease Control and Prevention (2021); Government of the Republic of Korea, Kyunggi Provincial Government Office (2021); Government of the Republic of Korea, National Railroad Corporation (2021); Shinhan Card.
We examine the spending response and MPC the week prior to and 2 weeks succeeding the government payout.
Following Baker et al. (2020b), spending responses to government cash subsidies may be captured in the
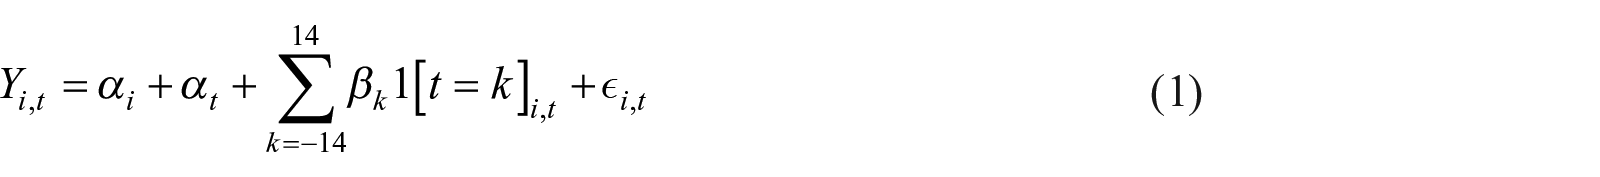
where
To capture the nuances of high-frequency behavioral responses to the government subsidy, we perform regression analysis at the individual-day level and cluster standard errors at the individual level.
Daily-level MPC is captured in the specification below
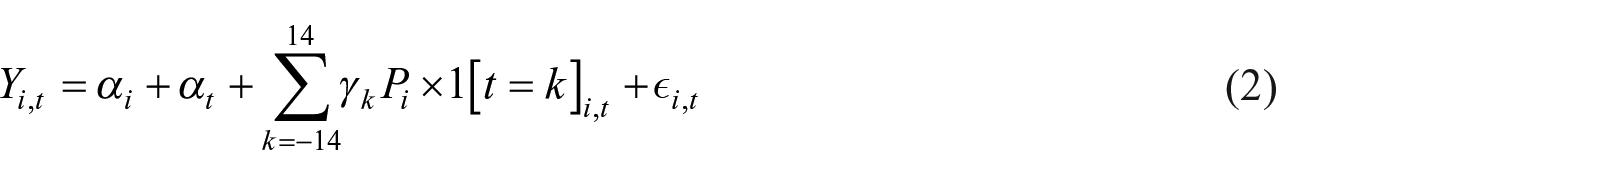
where
To determine the cumulative MPCs after the payment, we scale the time period indicators by the amount of payment over the number of days since the payment. The cumulative MPC
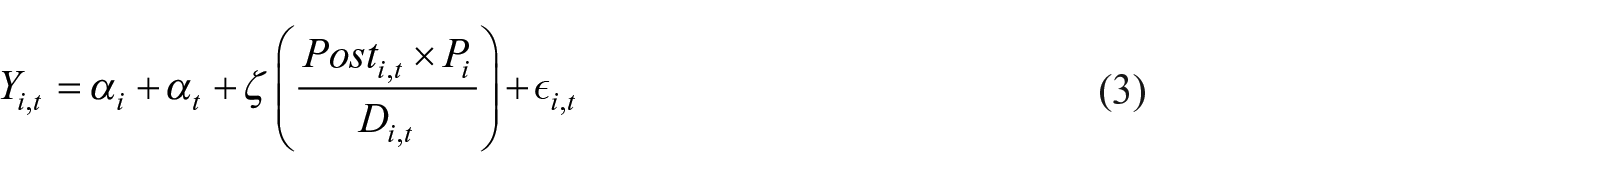
where
Extending equation (3), we interact the individual fixed effects with day-of-week and day-of-month indicators. In alternative specifications, we require demographic data such as income, geographic location, age, and gender as controls. In particular, income and geographic location would be highly relevant as these provide valuable information for subnational policy targeting measures. For instance, it is worthwhile to exploit subnational variation in COVID-19 incidence and severity, which could impact the spending response of users. We also run separate regressions to determine the differential impact of the stimulus payment on different groups of individuals.
The spending equation (1) may then be respecified as follows
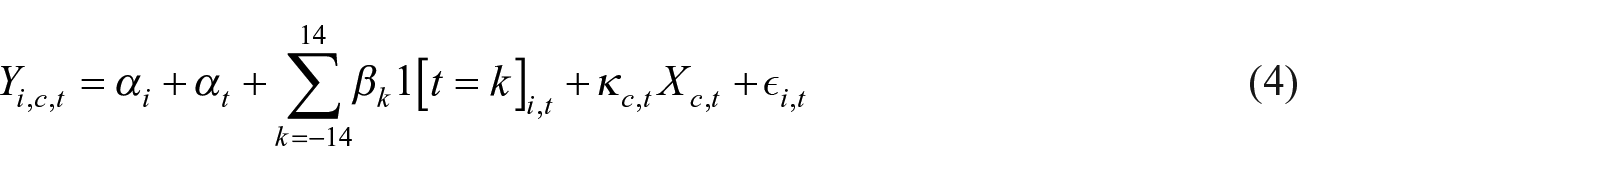
where subscript
Similarly, the cumulative MPC may be modified as follows
where
Consumption response
Consumption responses to subsidy payments
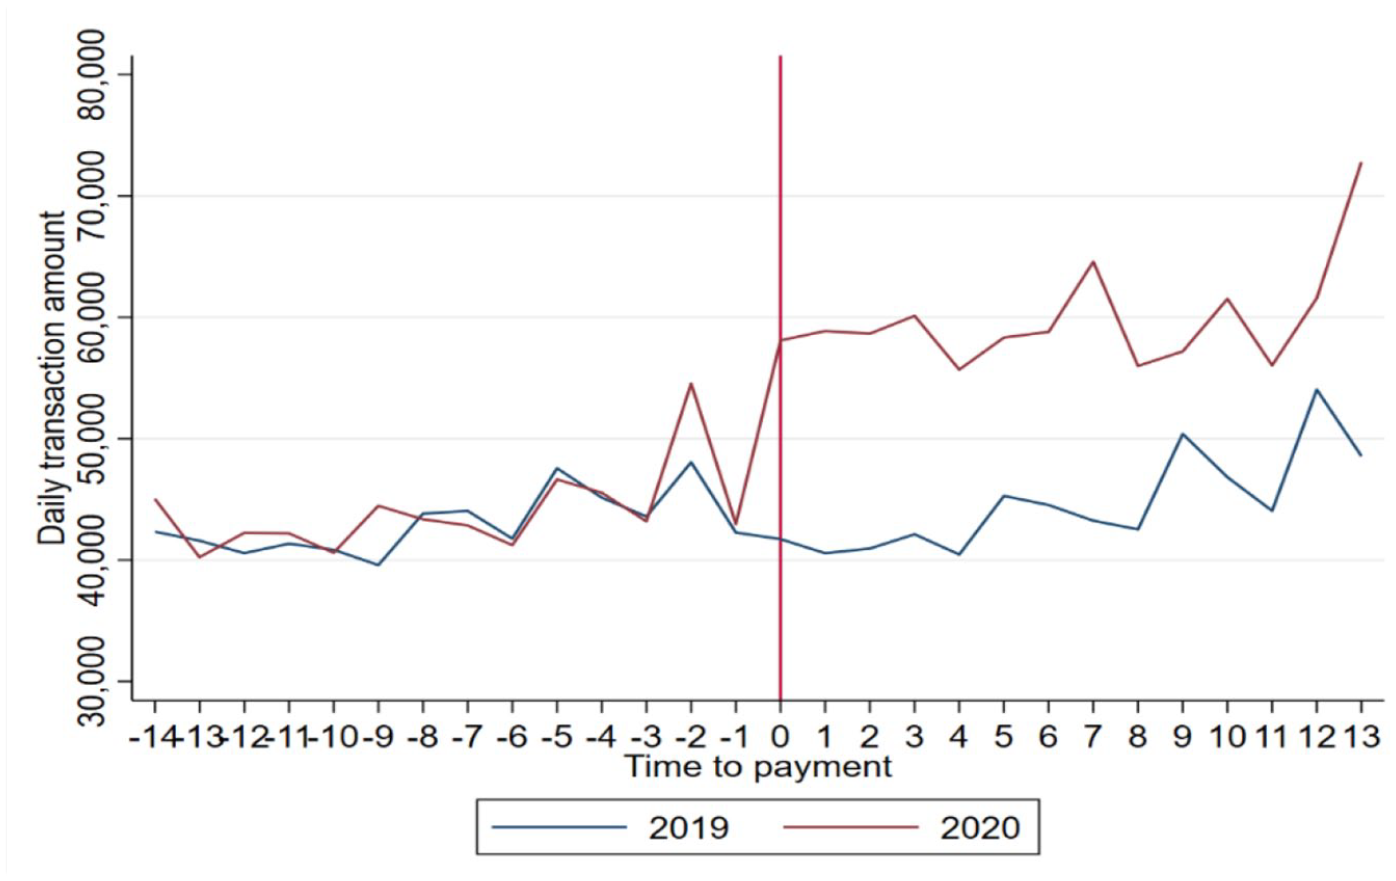
The naïve trend shows a 42% year-on-year increase in mean total credit card spending in the period after receipt of the subsidy, with respect to 2019 values (Figure 3). It is clear that before the subsidy, spending levels were somewhat similar, with a marked bifurcation upon the stimulus disbursal.
Mean daily spending.
Moreover, individuals clearly shifted their spending allocation from their regular accounts to the subsidy account, as examining the spending from the non-subsidy account reveals a significant decline, particularly for higher income groups (Figure 4).
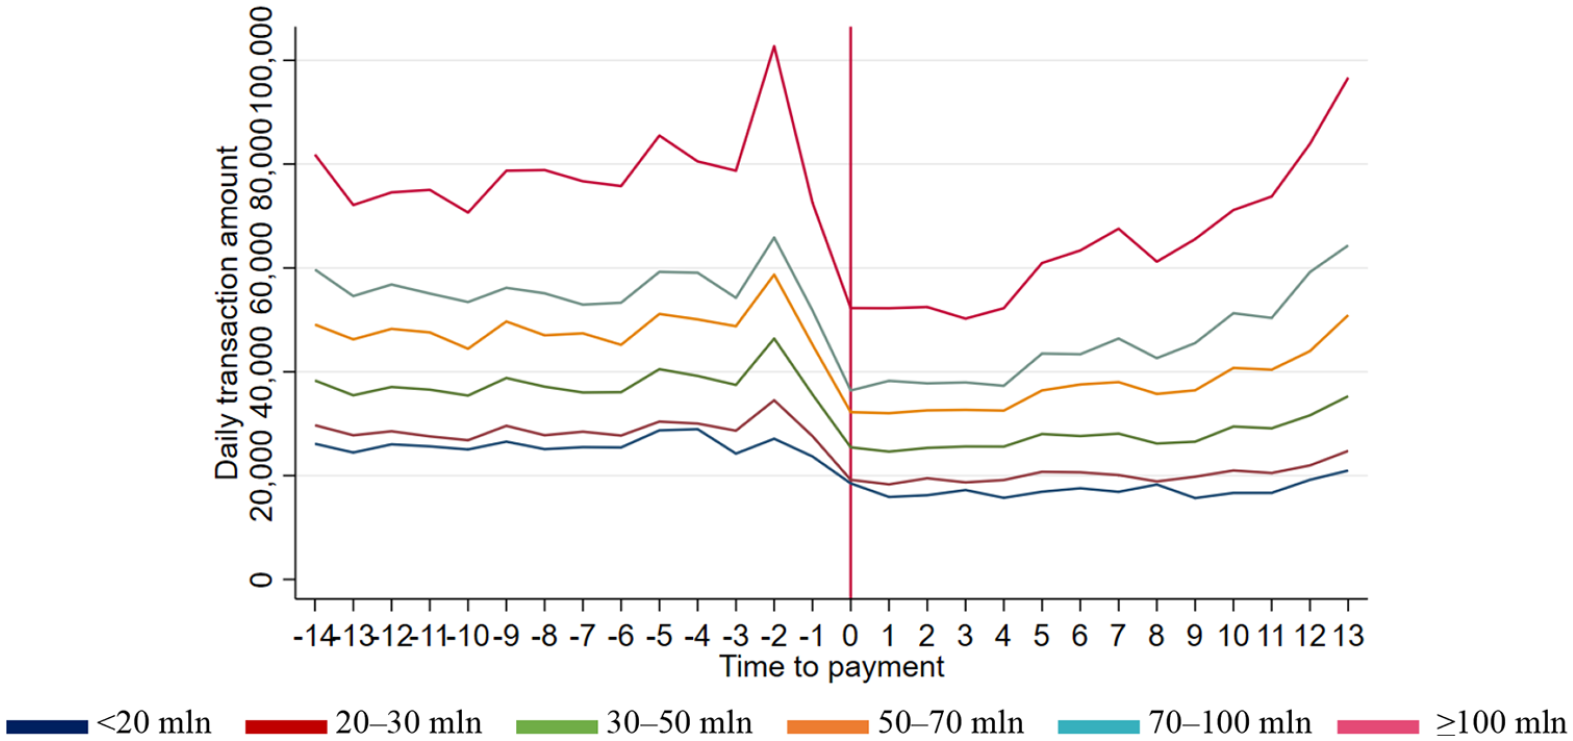
Mean daily non-subsidy account spending by monthly income level (won).
The magnitude of these declines roughly corresponds with the mean daily account spending in the subsidy-specific account (Figure 5), except for the lowest income group, which had the second-highest mean transaction amount on the day immediately following the stimulus receipt. These initial findings suggest that there may be unequal impacts of the stimulus program based on annual income.
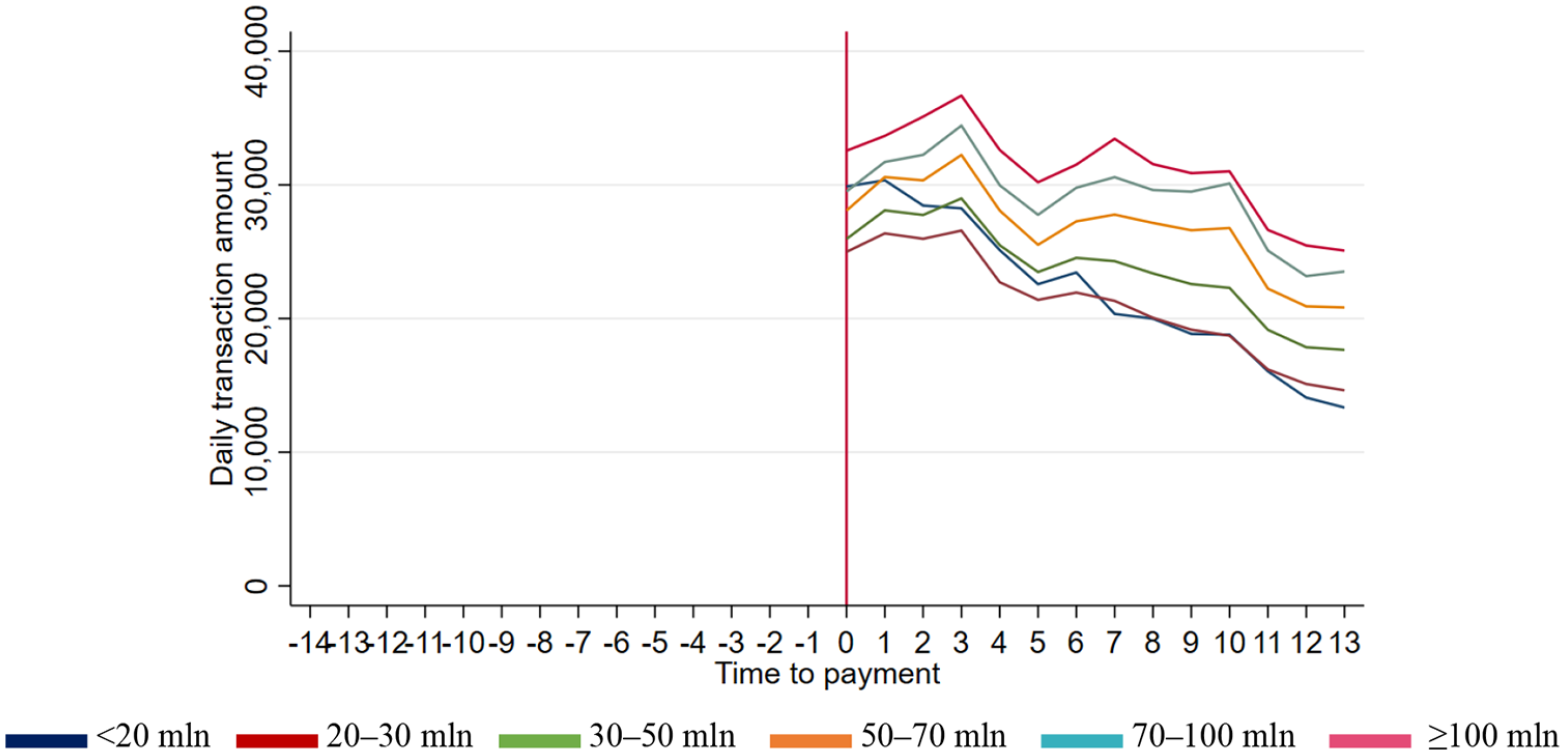
Mean daily subsidy account spending by income level (won).
To measure the impact of the government subsidy, since all the individuals in our sample were recipients, we use 2019 values as the benchmark. Thus, we compare the spending of individuals before and after subsidy receipt to their own transaction behavior in the same period the year prior. Figure 6 shows the coefficients from equation (1) for non-subsidy account, while Figure 7 shows the same for total spending. There was a decrease of around W13,000 following the government payout in the non-subsidy account; however, this was clearly offset by the increase in subsidy account spending as there was a net increase of approximately W14,000 in total spending (Table 3).
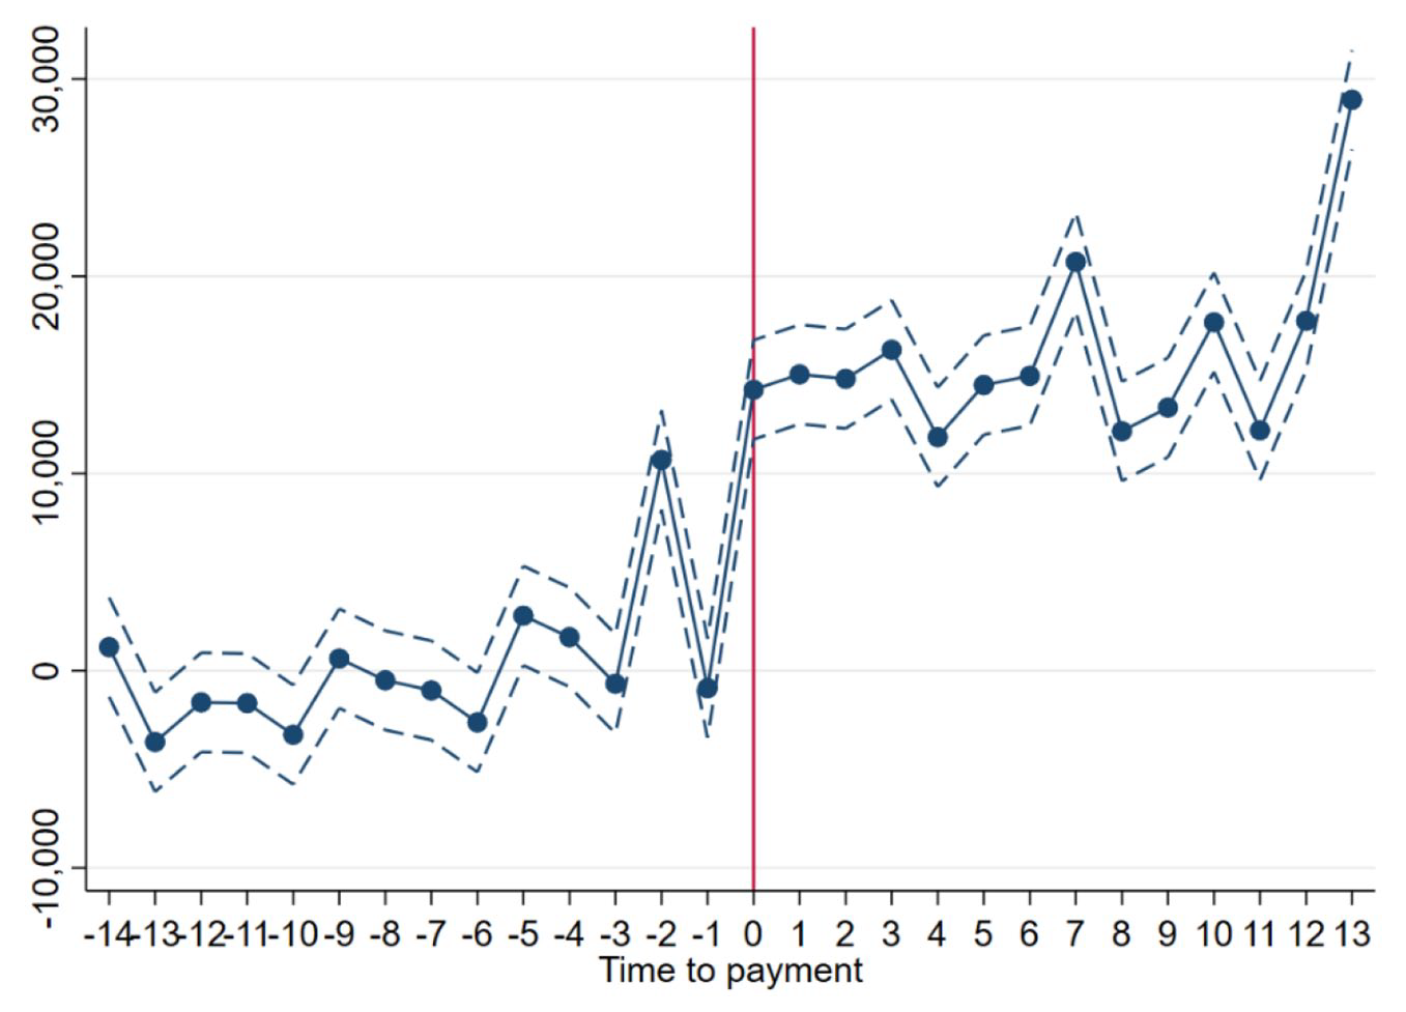
Consumption response to subsidy payments—regression coefficients (won).
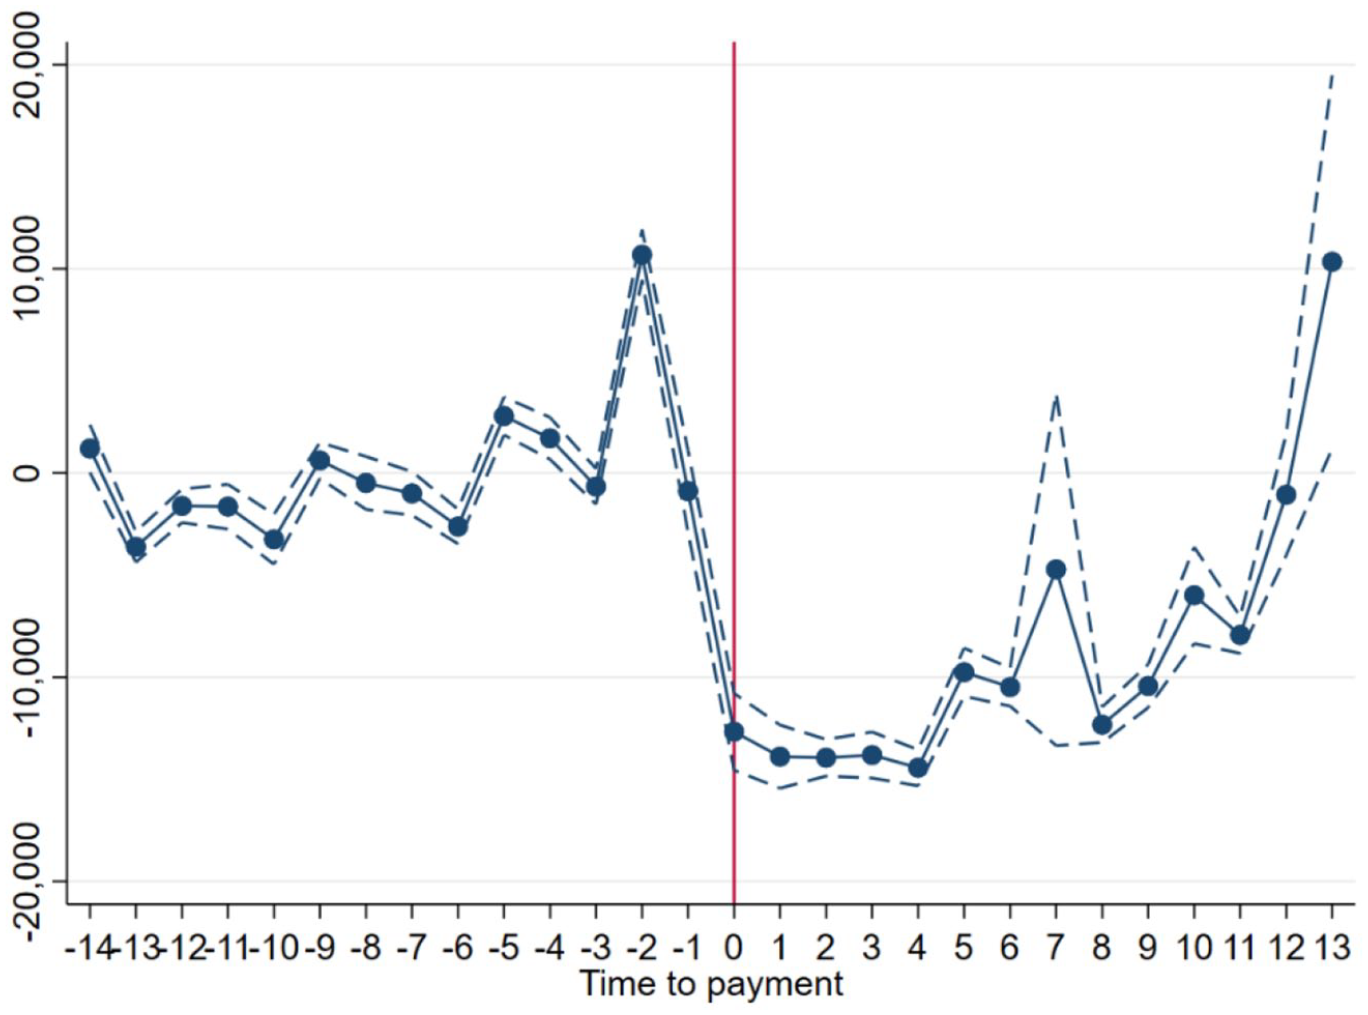
Consumption response to subsidy payments in non-subsidy account—regression coefficients (won).
Spending around government subsidy payment.
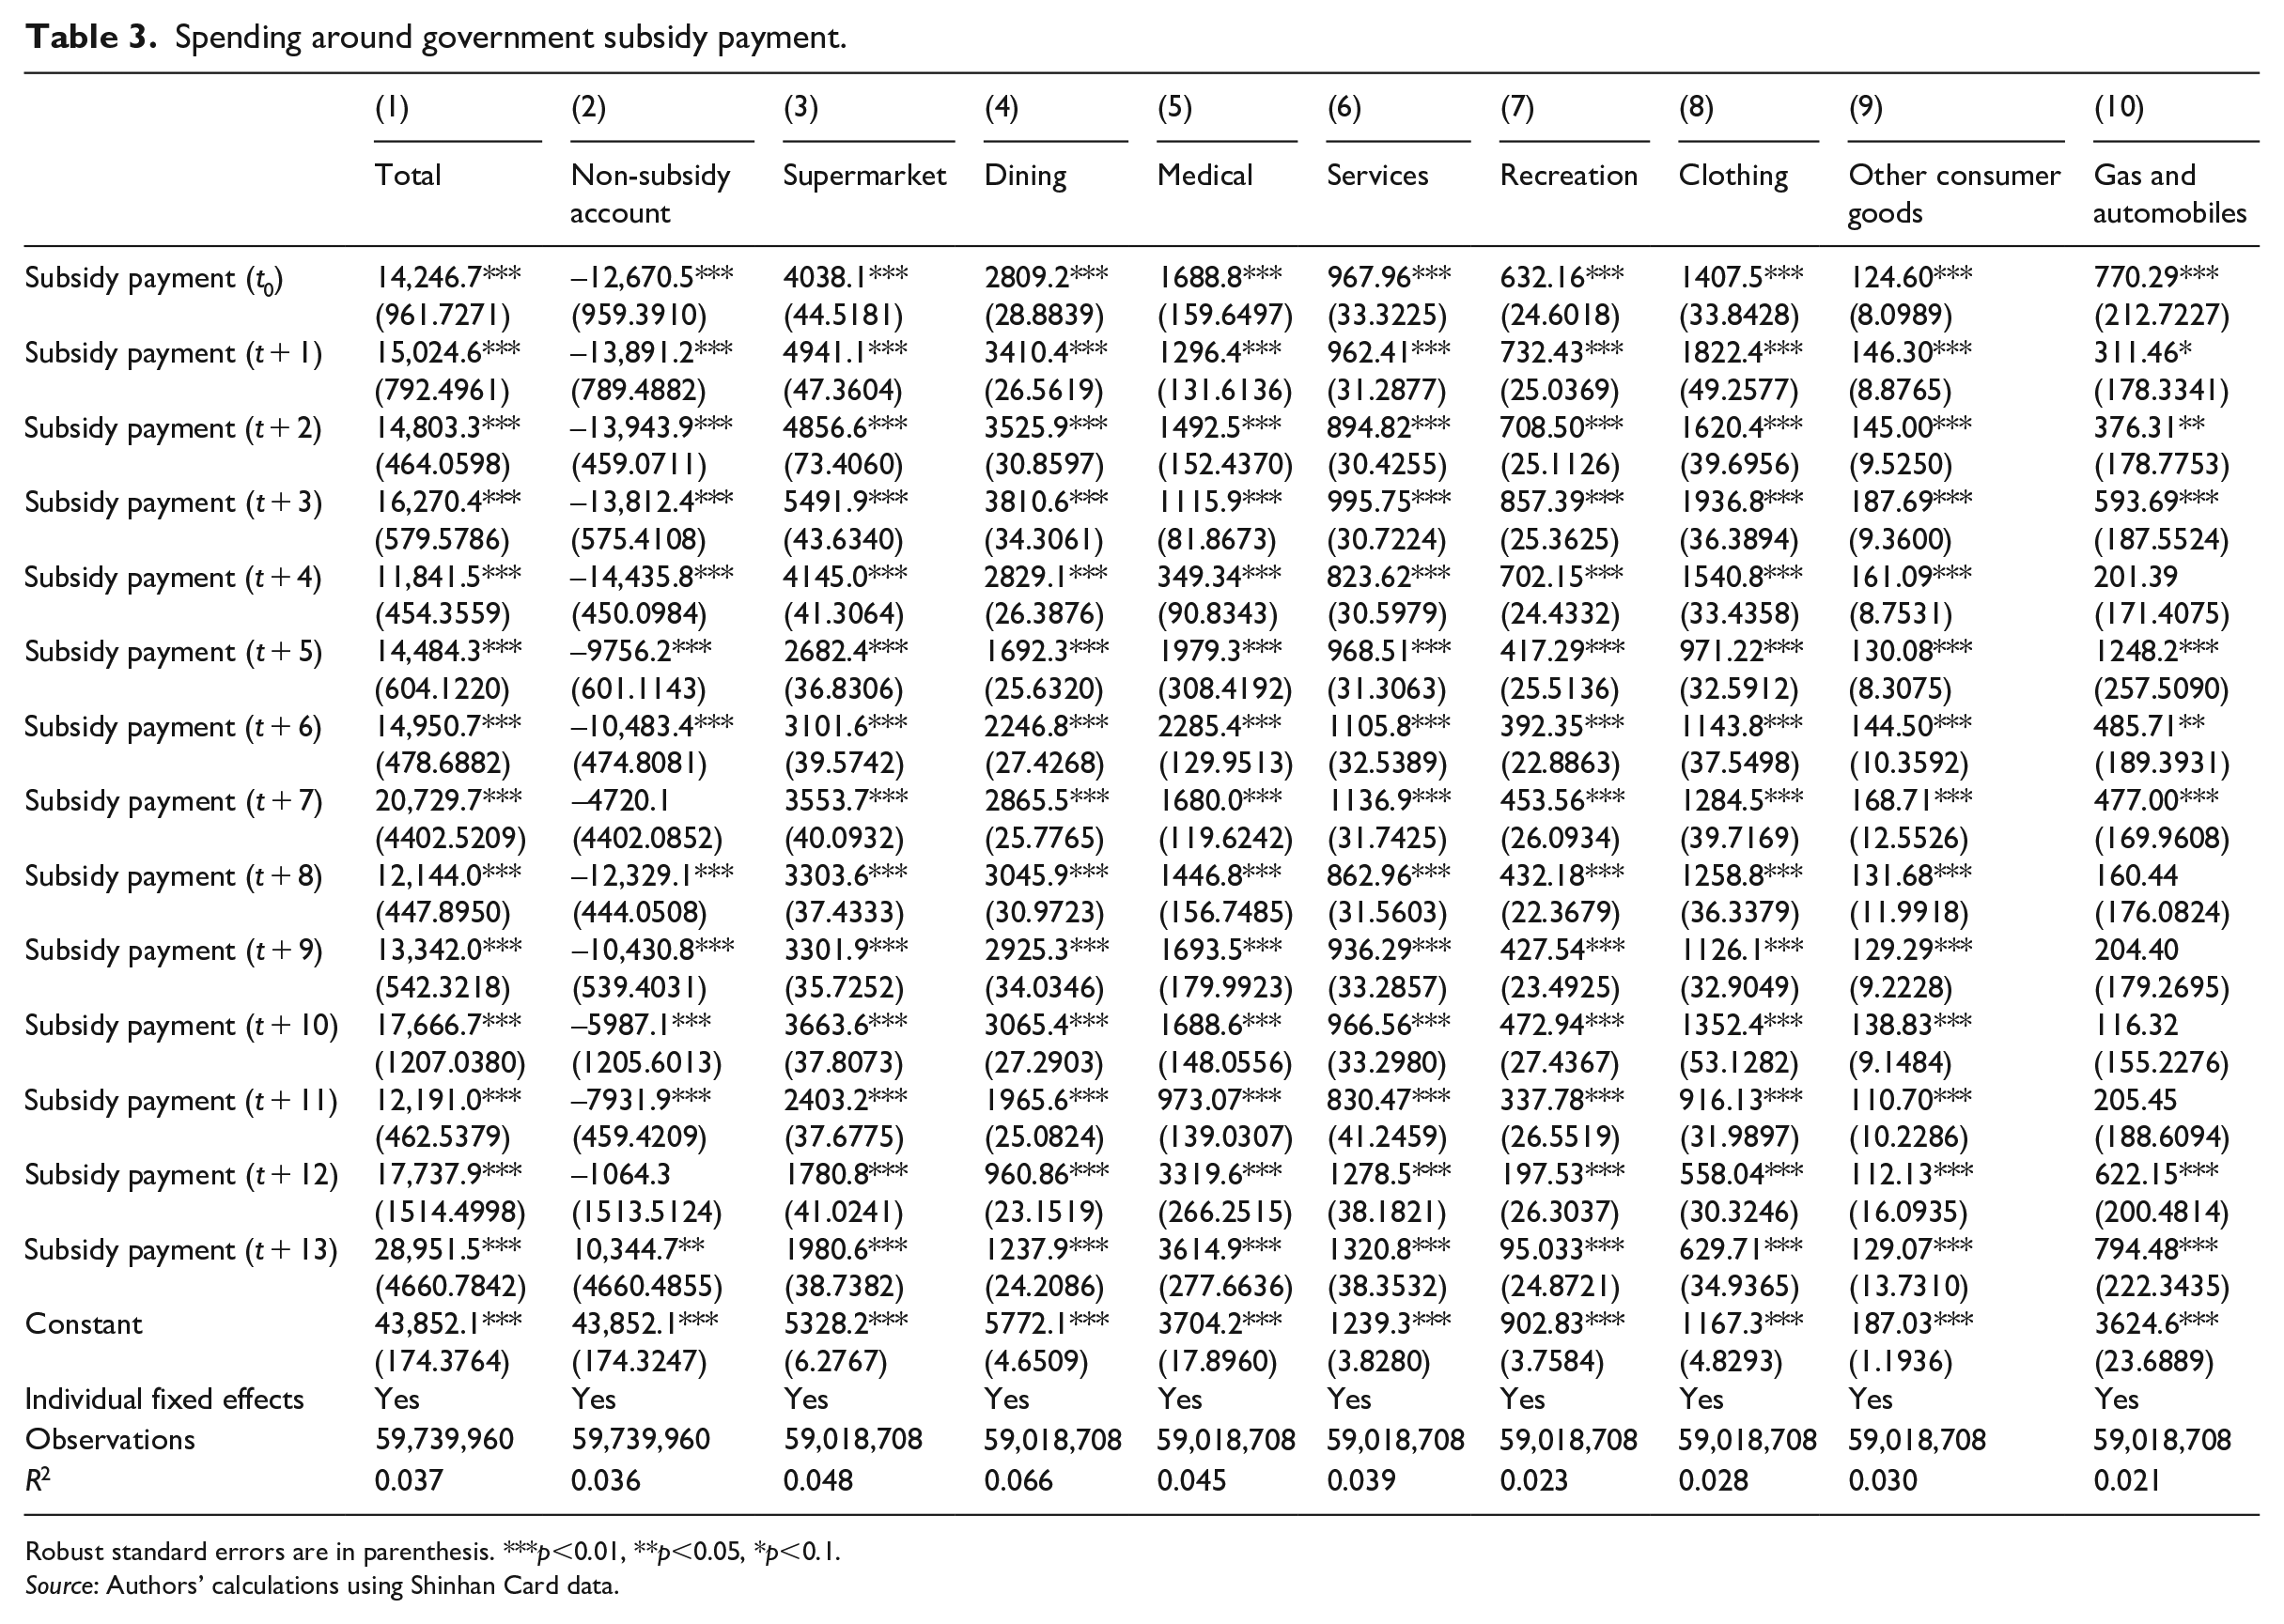
Robust standard errors are in parenthesis. ***p<0.01, **p<0.05, *p <0.1.
Source: Authors’ calculations using Shinhan Card data.
In Figure 8, we disaggregate consumption responses by salient demographic characteristics such as income, occupation, average monthly spending, province, and family structure. The time-bound household cash subsidy leads to a significant spending increase during the first weeks across all demographic categories, which suggests a positive consumption boosting impact of the fiscal stimulus. From Figure 8.1, there is clear heterogeneity across income groups: the largest drops from the non-subsidy account in the days after
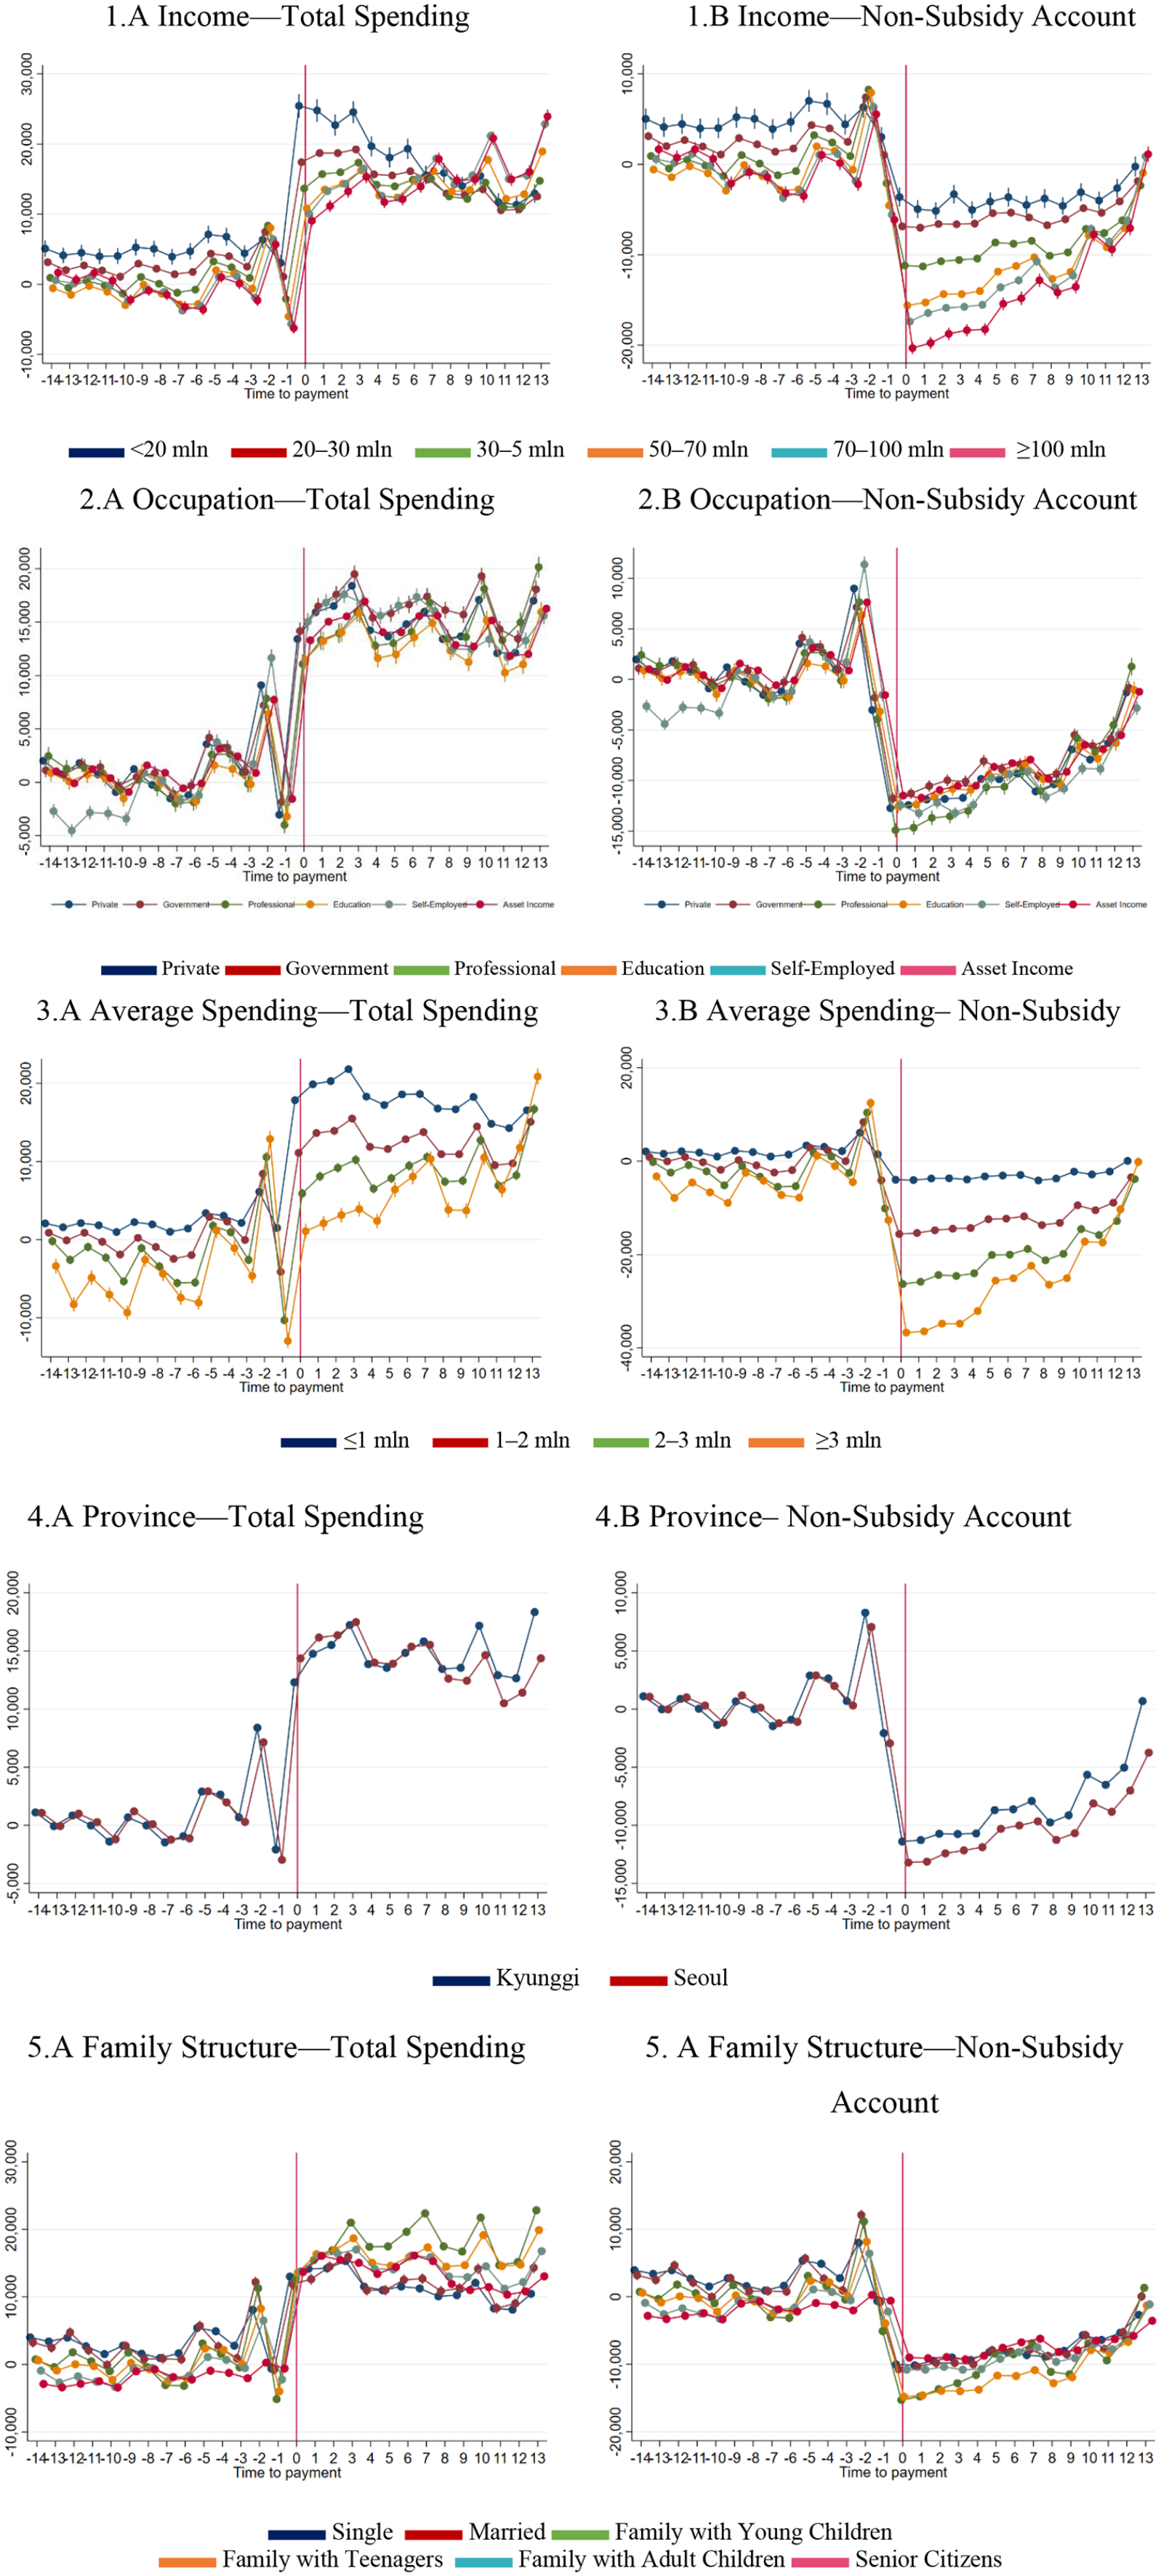
Consumption response to subsidy payments by demographic—regression coefficients (won).
Finally, Figure 8.4 illustrates the regression coefficients by province. Overall, Seoul residents appeared to decrease their non-subsidy account spending more and increased their total spending less. This could have been partly attributable to subnational differences in the subsidy policies. For instance, although recipients in Kyunggi province are generally disallowed from spending their subsidy in large franchises, Seoul residents were allowed to do so provided that the franchise’s headquarters is based in Seoul.
Figures 9 and 10 depict consumption responses by the Shinhan-defined categories such as groceries, dining, medical services, and more. Figure 9 shows overall spending, while Figure 10 shows non-subsidy account spending regression coefficients. There was an apparent decline of around W2000 to W5000 in spending per category in the non-subsidy account after receipt of the stimulus. Notably, the sharpest declines were observed in groceries and dining, presumably because recipients of the subsidy shifted their spending to their subsidy account instead. Despite this decrease, again, the increase in consumption as a result of the subsidy was more than enough to compensate. Overall spending increased for all categories by approximately W1000 to W4000.
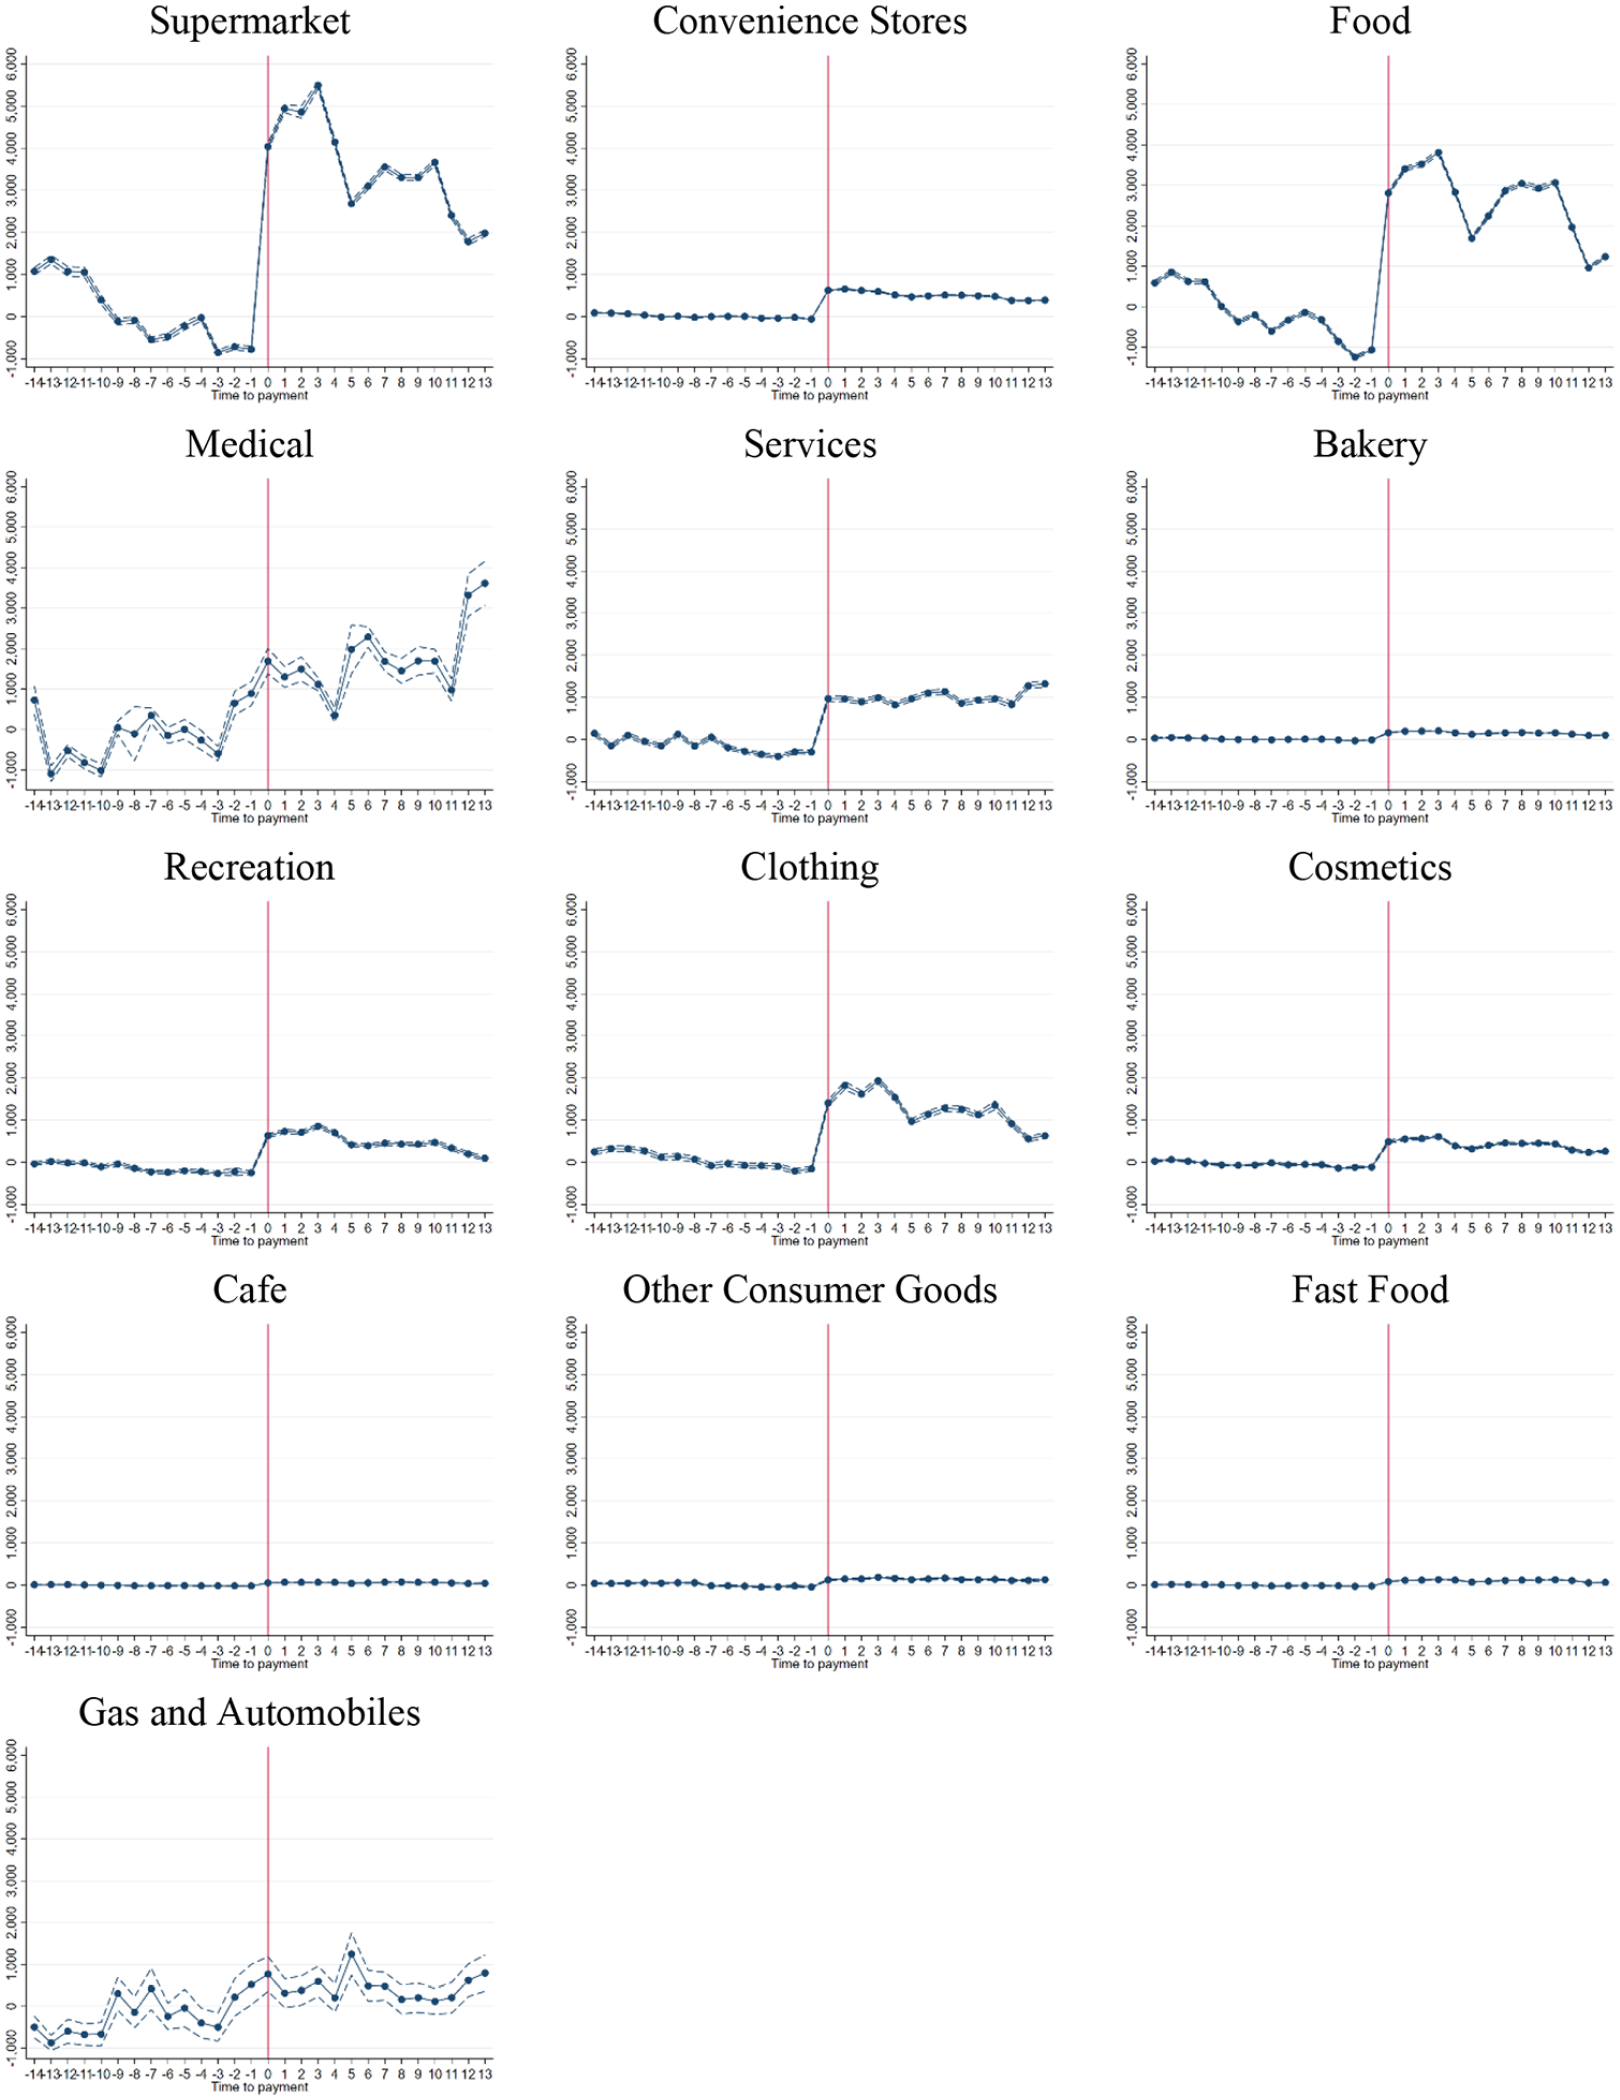
Category-specific total consumption response to subsidy payments—regression coefficients.
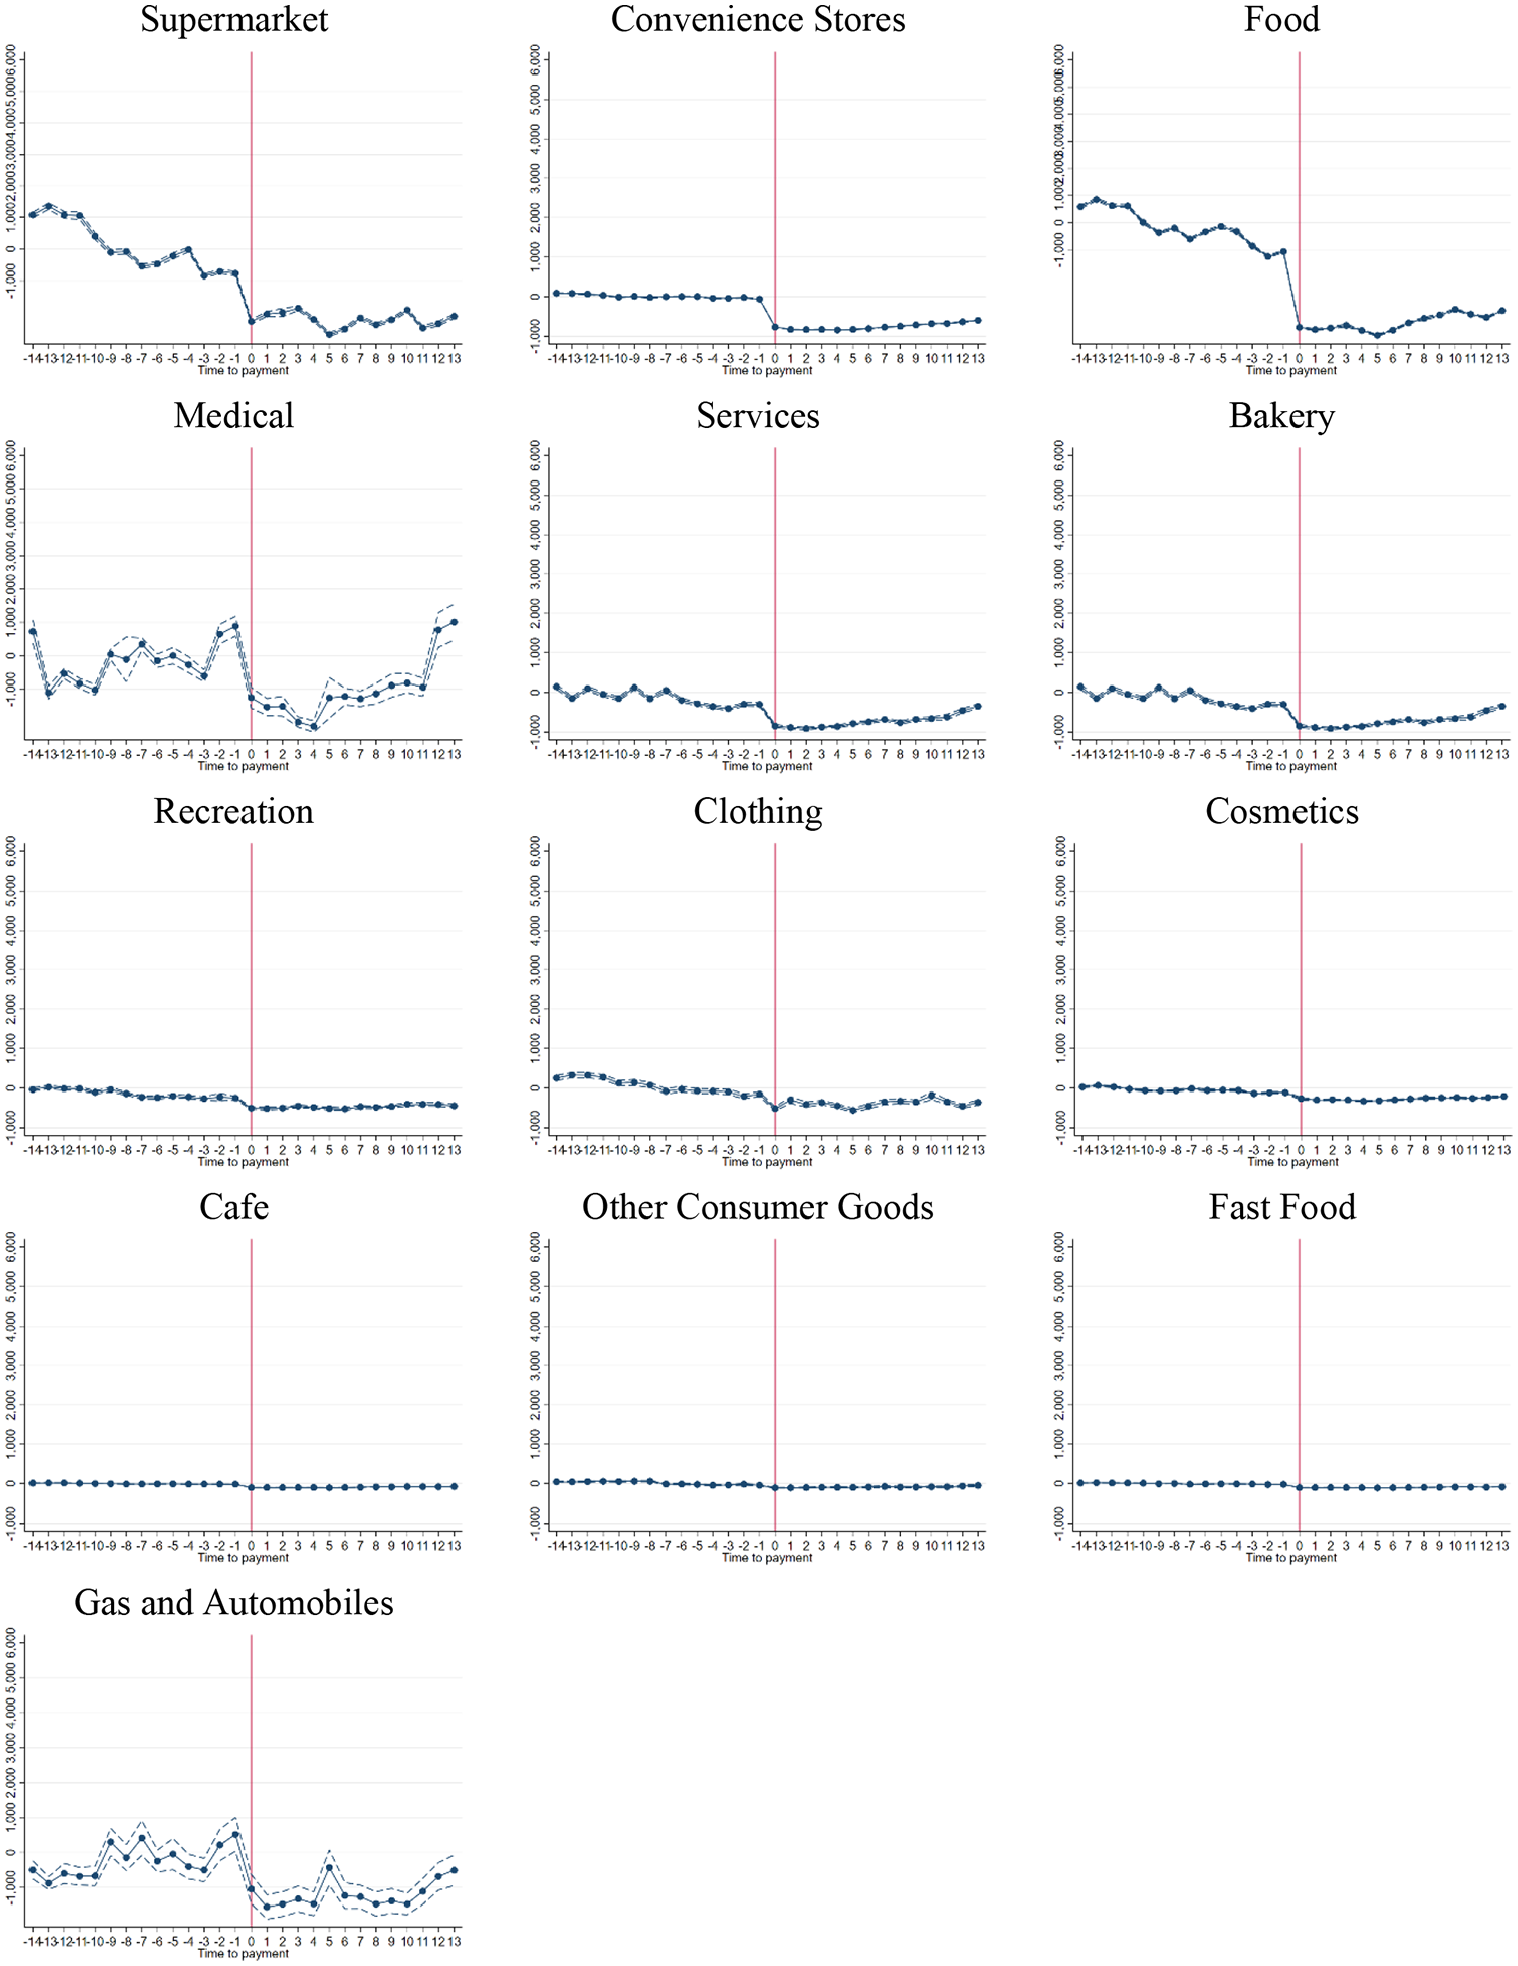
Category-specific consumption response to subsidy payments in non-subsidy account—regression coefficients.
To further analyze these category-specific responses, we disaggregate the patterns of consumption by income groups in Appendix 1 (Figures 19 and 20). In subsidy account spending, responses do not differ as much per category. However, for non-subsidy account spending, higher income earners tend to decrease their spending more than low-income earners, most especially for services, groceries, and dining. The sole exception appears to be convenience stores, where low-income earners showed the largest decline in spending (W1000 daily).
Stimulus responses and income
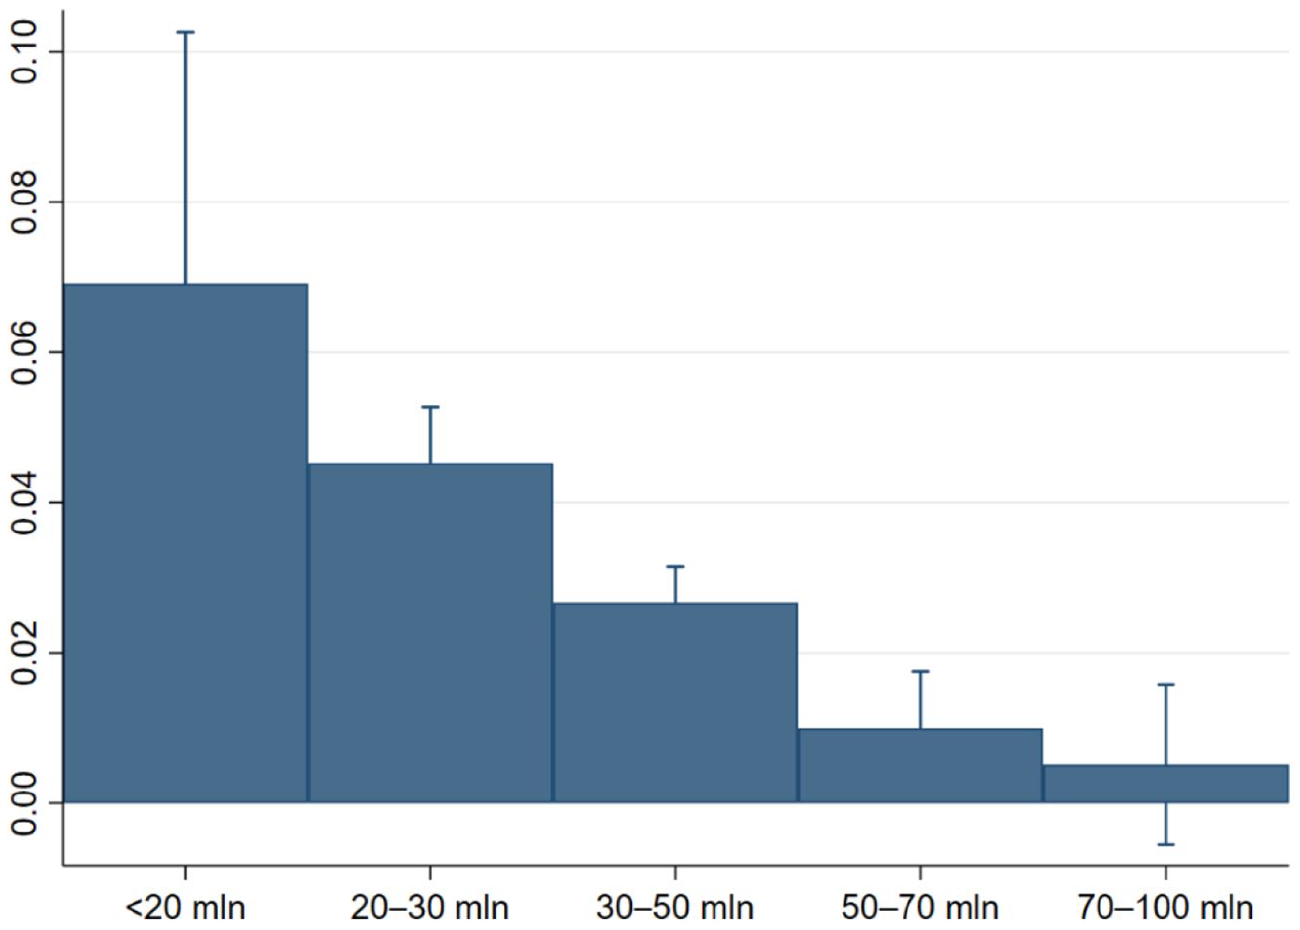
Figure 11 illustrates the MPC as disaggregated by income level. This captures the proportion of the subsidy spent over the time period, weighted by the number of days (t + 14) covered in this study. From Figure 11, users with lower levels of income seemed to respond much more strongly to the receipt of a stimulus payment. Those who earned below W20 million had an MPC (0.27) 5 times as large as those who earned W100 million and above (0.04). This is substantiated by Table 7 in Appendix 1, which shows the actual regression coefficients as well as additional interaction runs.
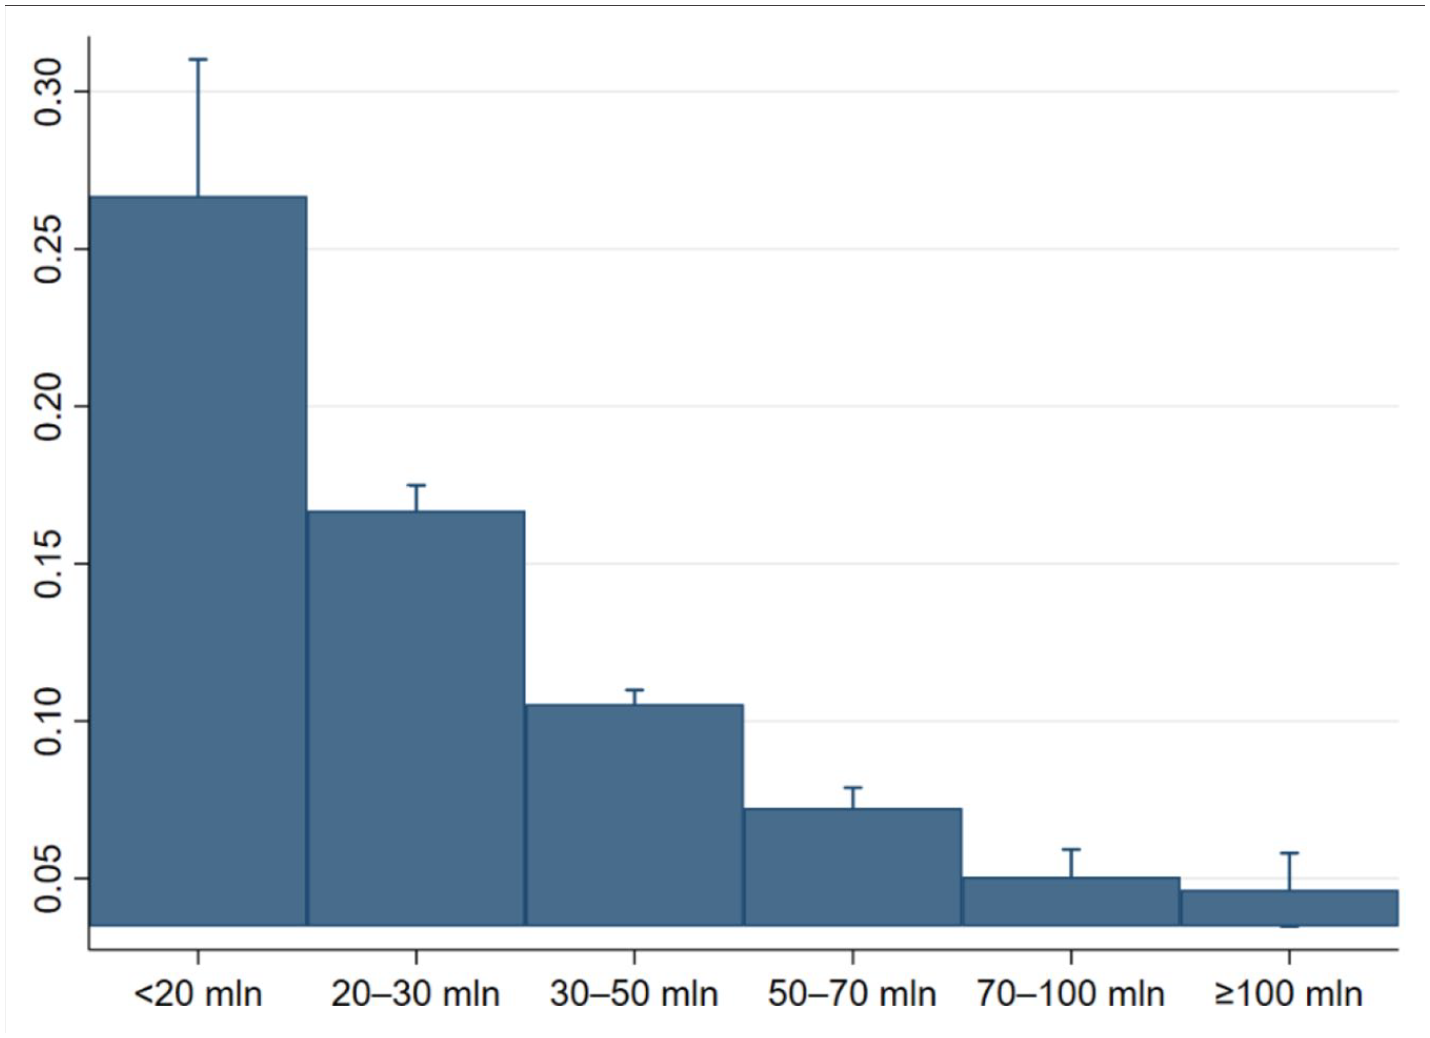
MPC by income levels (subsidy account).
One potential source of different MPC levels observed between low- and high-income groups is associated with the features of the Republic of Korea’s income subsidy scheme with time-bound (end of August 2020) expiry date attached. Whether this time-bound nature of the subsidy works as an actual constraint on consumers depends upon consumer behavior. High-income group individuals with enough income buffer available could easily bypass this constraint by switching sources for spending across income sources as well as across time. For example, the fact that high-income group’s spending level from non-subsidy account fell significantly after the receipt of the subsidy indicates such substitution effect across income sources and time. In an extreme case, a high-income individual could fully substitute his or her regular spending requirement with spending from the subsidy, keeping the same amount as savings for future spending after the expiry date of the subsidy. This could dilute the consumption boosting effect of government subsidy, including through nullifying time-binding constraints. On the contrary, low-income group individuals may not be able to pursue a similar substitution affect, due to income constraints and urgent needs for spending.
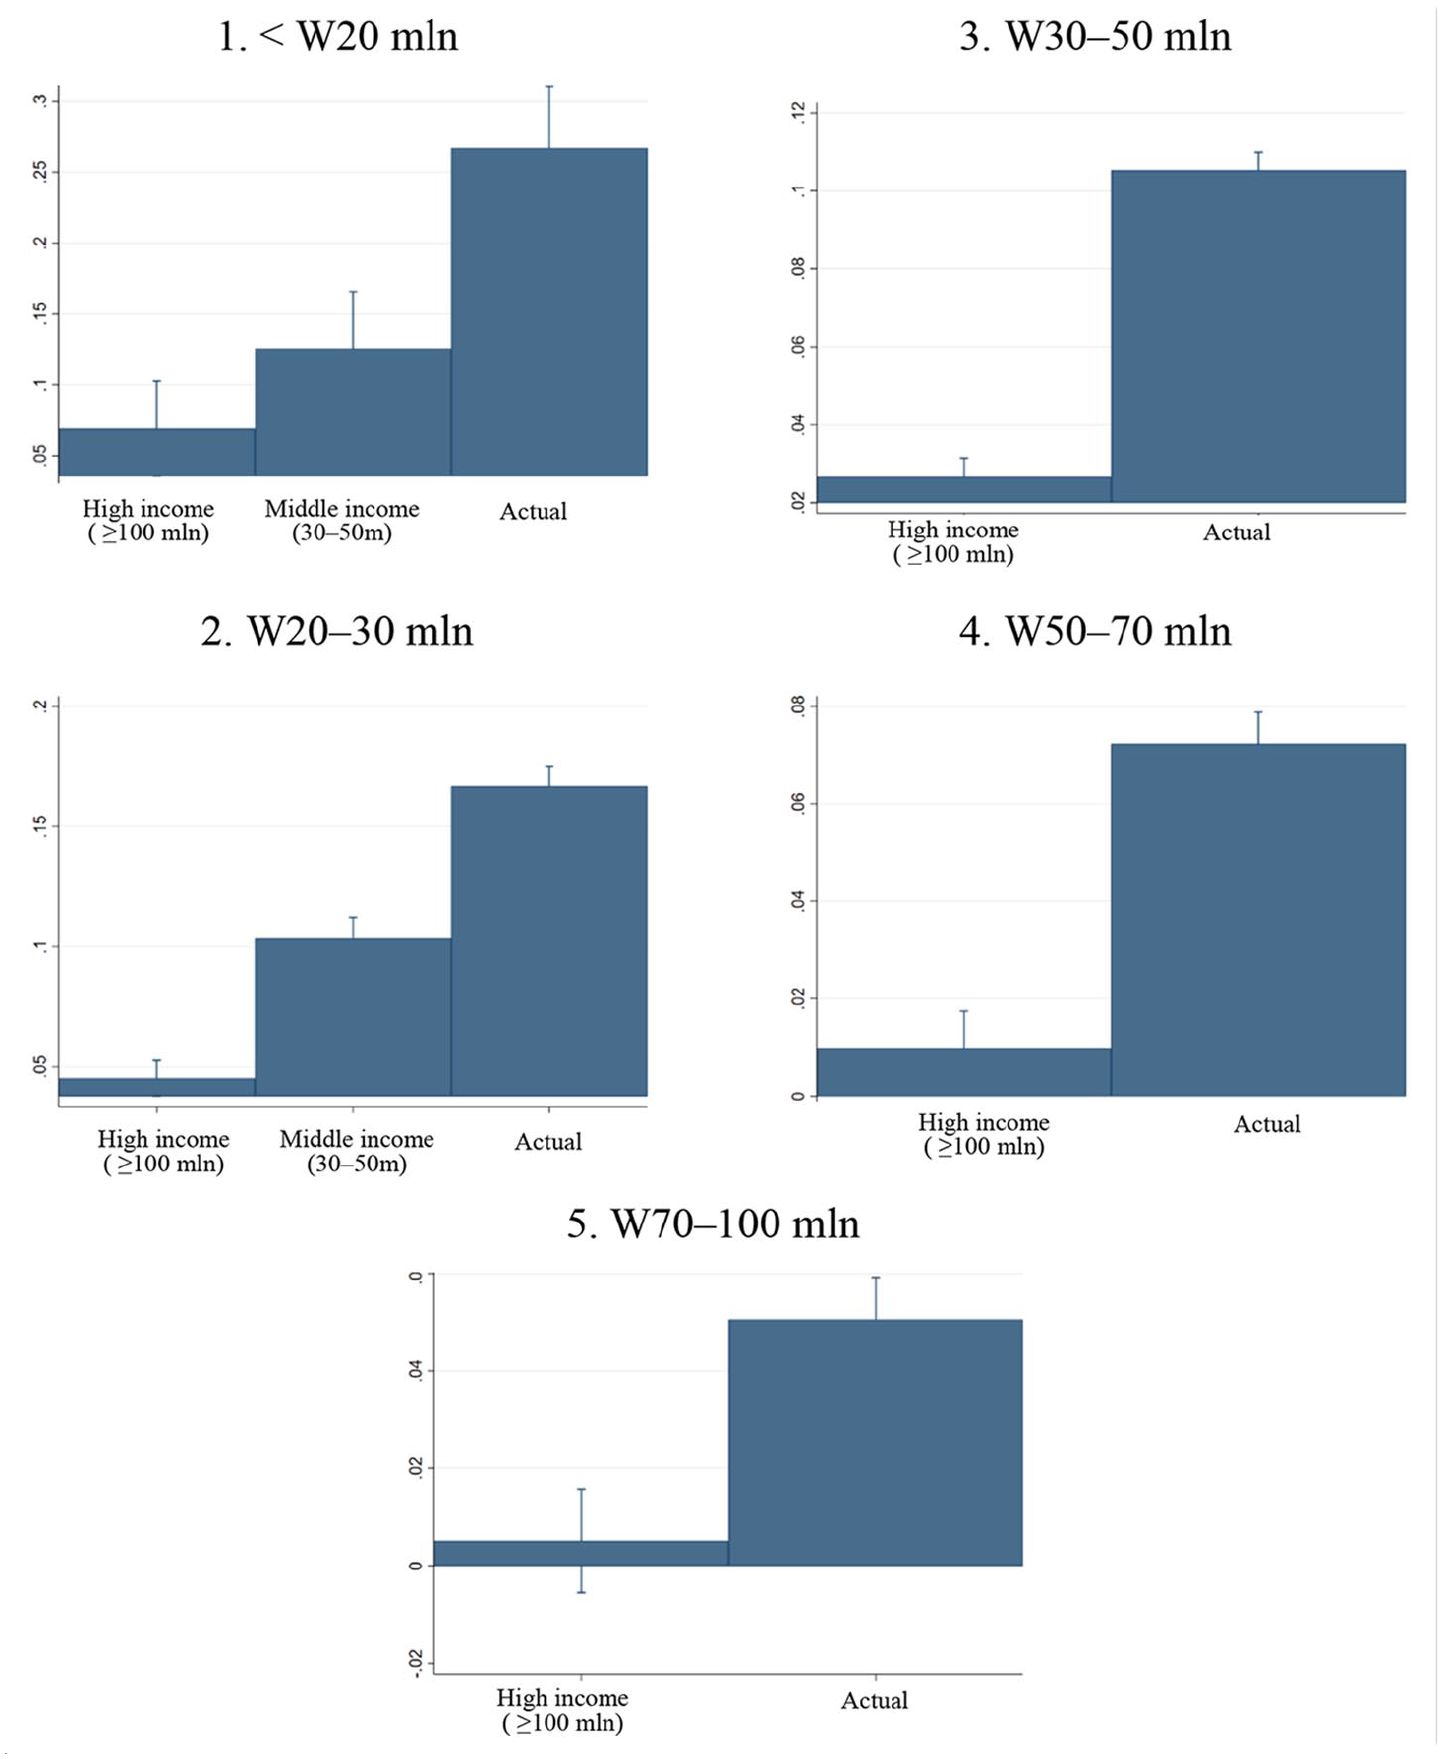
To further determine whether the significant shocks to the consumption patterns of lower income groups are owed to the subsidy, therefore, we model several counterfactuals wherein the behavior of lower income groups conforms to the spending pattern of mid- to high-income earners. With this simulation, we apply the year-on-year change in total account expenditures in high income (⩾W100 million earned annually) and middle income (W30 million–W50 million annually) to lower income groups. This is denoted as follows

where
This has the effect of providing a benchmark estimate of the spending patterns of lower income groups, in that they follow highly moderate behavior patterns. We then estimate the same MPC equation (3) and compare the moderating effect in Figure 12. Across all income groups, it is apparent that following the behavior of the ⩾W100 million group provides a much lower benchmark than the middle-income group (W30 million–W50 million), as expected. This moderating effect stands at around a factor of 4 for all categories. Whereas for the middle-income benchmark, the factor stands at around a factor of 2 or roughly half of the high-income reduction.
MPCs and counterfactuals.
Figure 13 depicts the same regression results but counterfactuals when the high-income group’s spending adjustment behavior was used as a benchmark for all income groups. It is also apparent that despite modeling the effect of the middle-income group, those who earn less still display a markedly increased MPC over their high-earning counterparts. Compared to the KRW70 million to KRW100 million group, the KRW20 million group has an MPC over 4 times higher (0.072 vs 0.015). Additional figures for the KRW70 million to KRW100 million and KRW30 million to KRW50 million case are included in Appendix 1. Similar findings apply, with MPC decreasing as income increases. These results suggest the estimation results in Figure 13, indicating the lower the income, the larger the MPC still holds and is robust to the counterfactuals even if we hypothesize the low-income group’s spending adjustment behaviors follow the higher income group’s cross-account consumption smoothing behaviors. This analysis clearly shows lower income groups tend to have larger MPC, as theory implies, even after controlling for the contemporaneous cross-account substitution effect.
Counterfactual—using high-income case (⩾W100 mln) as benchmark.
Liquidity constraints and MPC
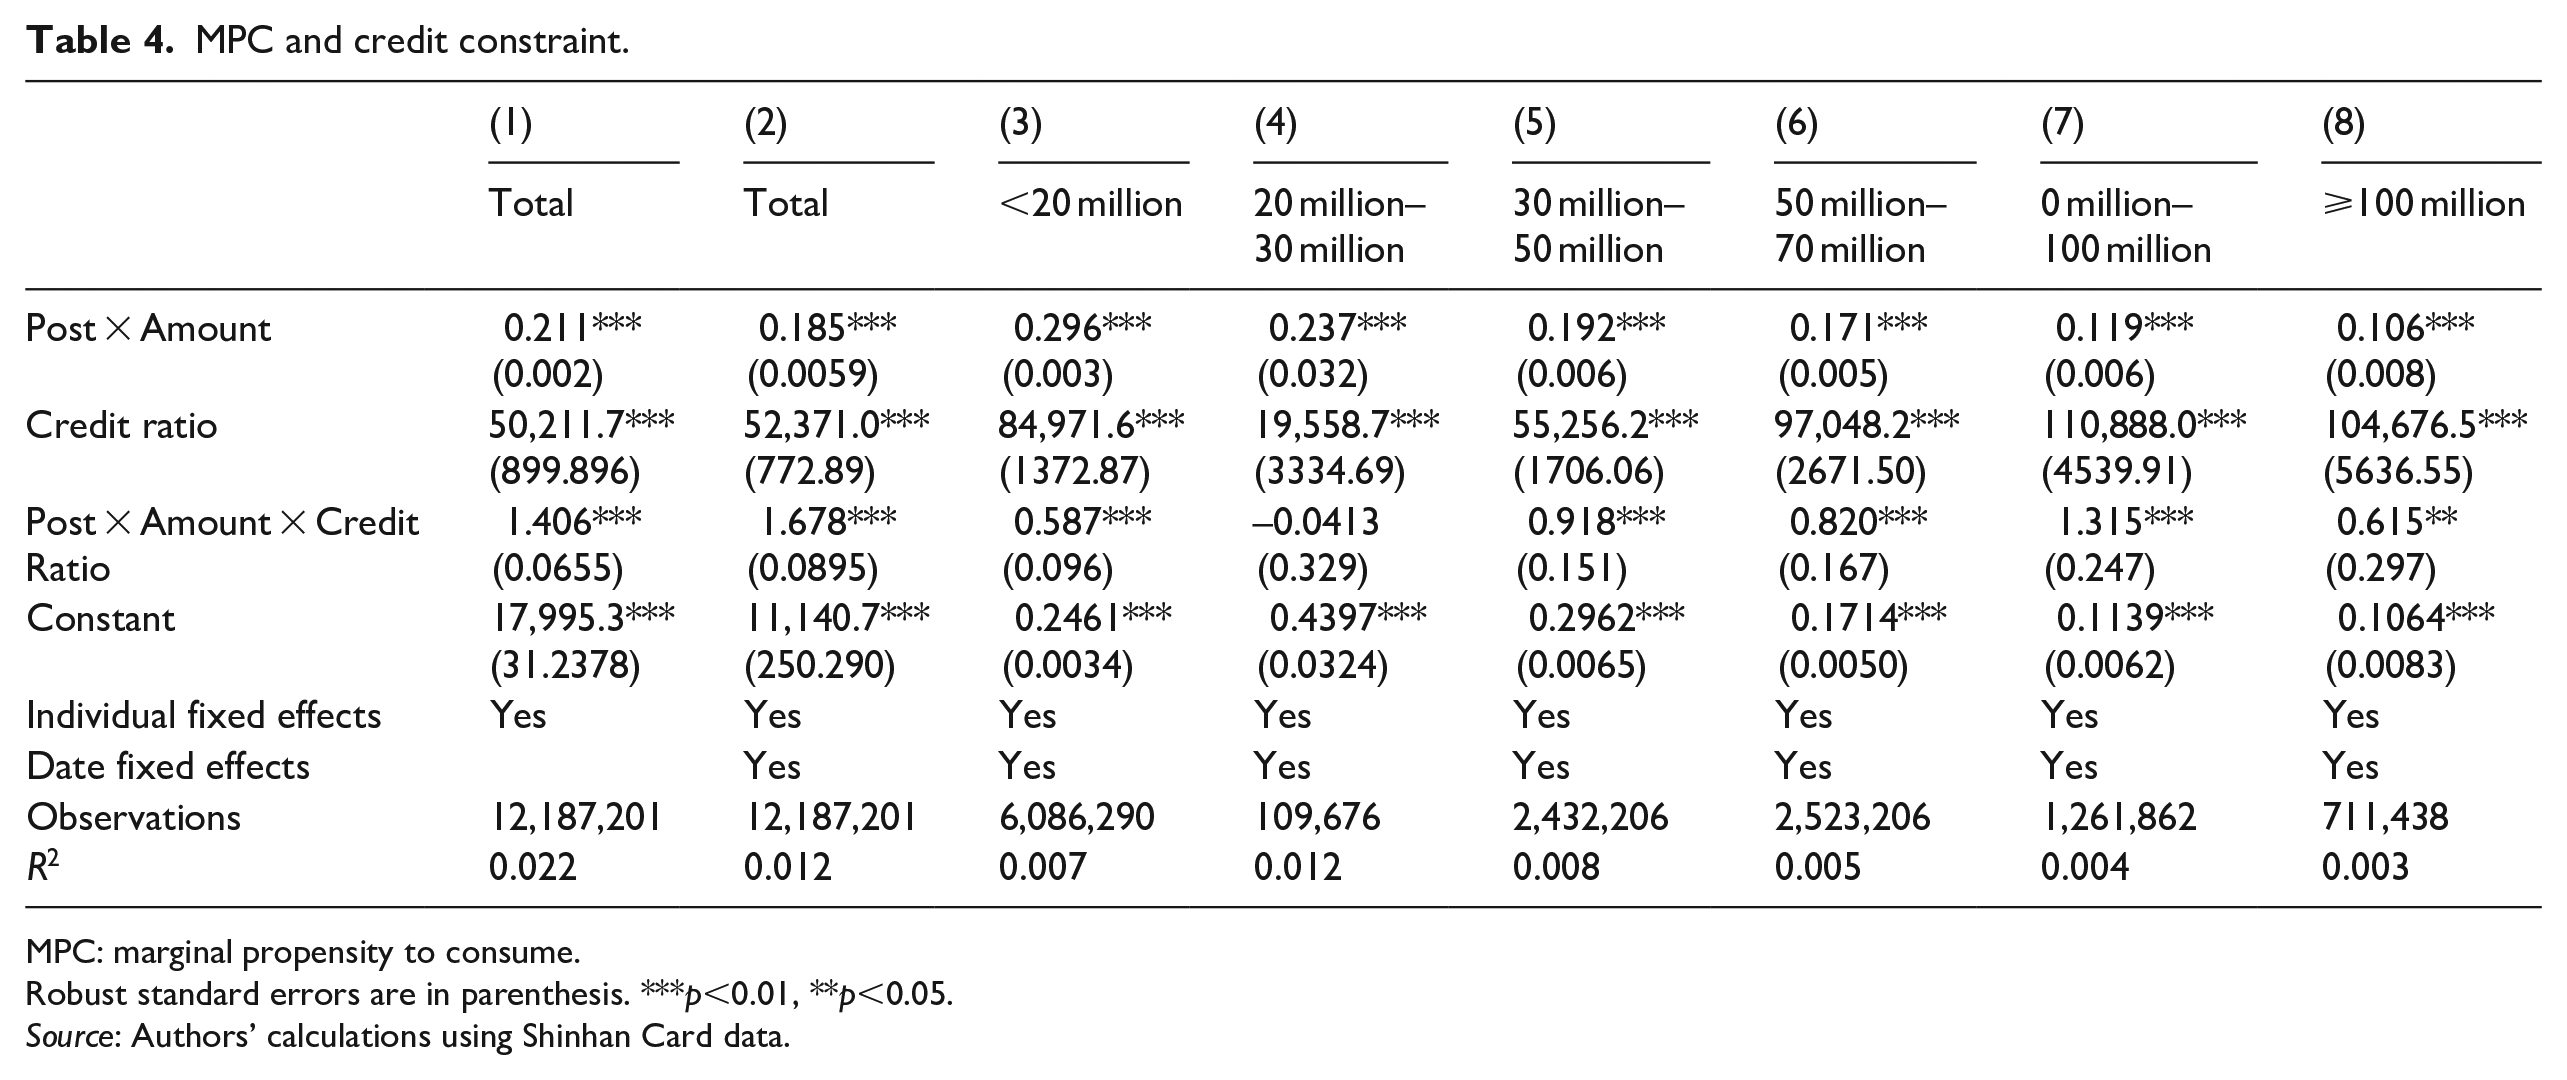
Another salient point of discussion could be made on the impact of credit constraints on consumption response. Liquidity constraint hypothesis predicts those under credit or liquidity constraints tend to spend more upon the arrival of the payment. Given data privacy constraints, we are not able to analyze the impact of one’s credit limit on spending patterns. Hence, we use the average historical spending in the past year (covering 2019–2020) of the individual as the proxy for liquidity or credit availability. This is because actual spending could already reflect the amount of liquidity and credit one can avail of within or beyond the income level. Next, we use the combined information from average monthly spending and income to represent the overall liquidity situation of an individual. We obtain the ratio of average spending as a percentage of income and interact this with the fraction of the stimulus to obtain MPC estimates.
Once scaled to the amount of the subsidy, consumption differences in terms of spending amount are less clear-cut, in contrast to the findings in Figure 8. However, in general, those who spend less than W3 million monthly appear to have a slightly higher MPC (Figure 14). Actual regression coefficients may be found in Table 9 in Appendix 1.
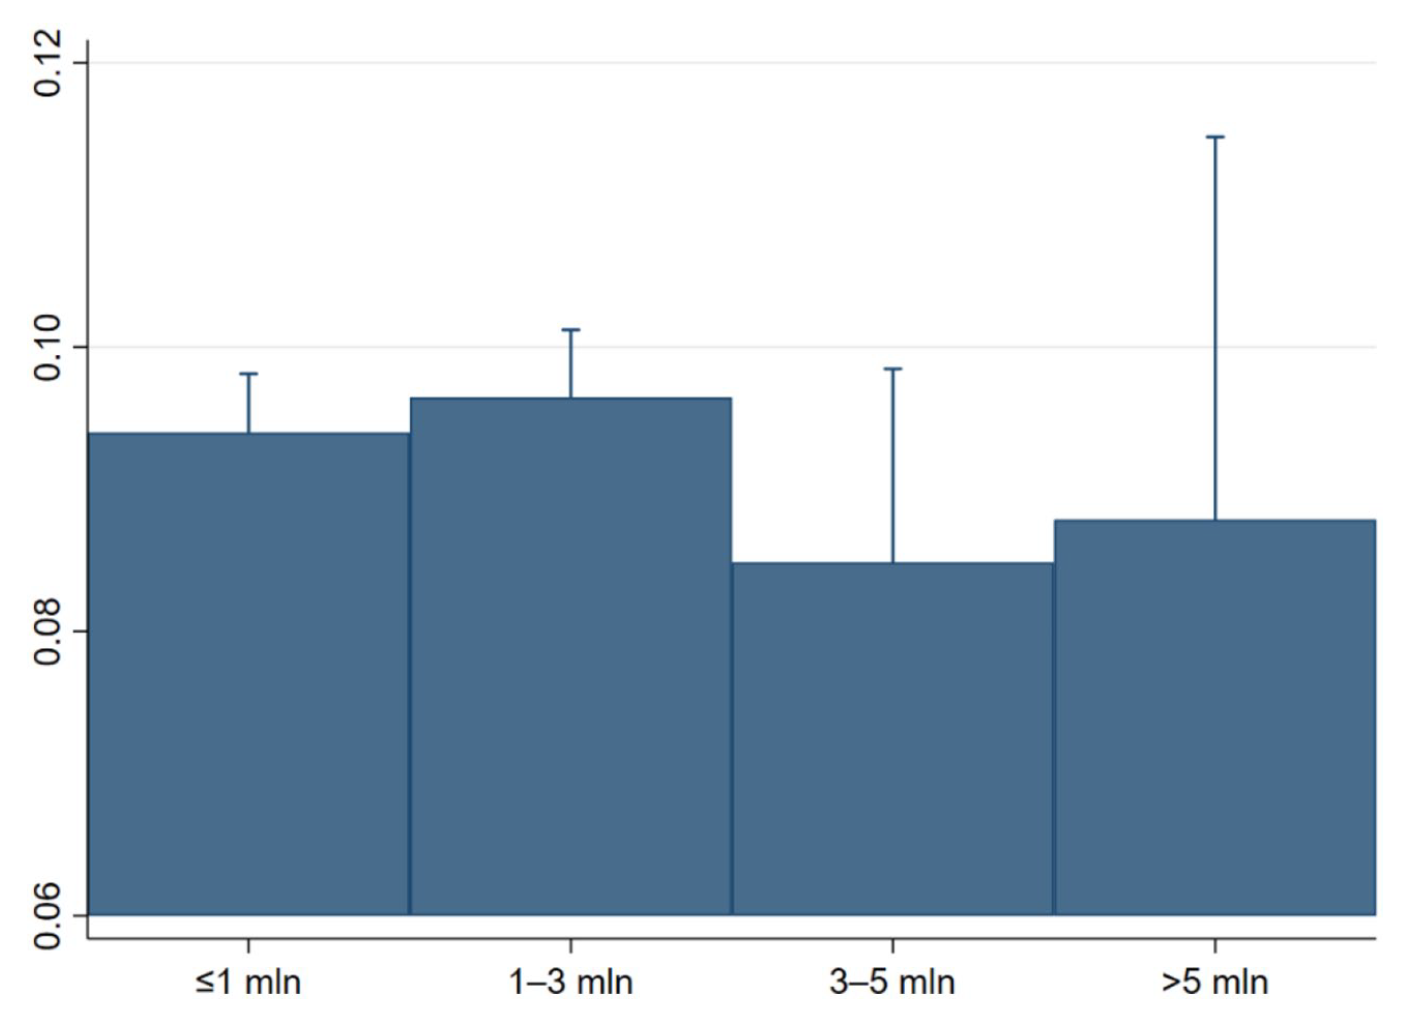
MPC by average monthly spending (subsidy account).
The results for the second proxy are shown in Table 4. Accounting to this estimate, around 21.15% of the subsidy is spent in the time period. This is slightly reduced to 18.53% with the addition of date fixed effects. These figures are roughly comparable to the overall MPC estimates shown in Table 3. Moreover, the income utilization ratio seems to have a significant and positive impact on MPC, with MPC increasing as the percentage of income spent in spending increases.
MPC and credit constraint.
MPC: marginal propensity to consume.
Robust standard errors are in parenthesis. ***p<0.01, **p<0.05.
Source: Authors’ calculations using Shinhan Card data.
Those with lower spending to income ratio should have a larger buffer in savings and current liquidity, rendering them to be less prompted for immediate spending from subsidies and vice versa. Both of these results indicate those more constrained in credit and with less savings available tend to be prompted for larger and immediate spending from one-off income increase through government subsidy. Given lower income groups are in general more constrained in credit with lower savings amount, these results suggest liquidity constraint could be among the crucial factors affecting the result of lower income groups having larger MPC than higher income groups.
COVID-19 risk and mobility
The economic fallout from the current COVID-19 pandemic is distinct from previous episodes. Unlike other crises, individuals are now subject to additional health risks when performing economic activities such as retail shopping, dining out, commuting to work, and other such day-to-day activities. In addition, social distancing or mobility measures may dampen the impact of any form of economic stimulus, as these constrain an individual’s ability to spend.
To measure the risk of infection, we use district-level cumulative daily COVID-19 cases. A chart of cumulative and daily cases in Seoul and Kyunggi can be seen in Figure 15. There is a clear weekly seasonality present, highlighting the need for date fixed effects. Moreover, Seoul appears to have more COVID-19 cases overall. Since these numbers were open to the public and updated regularly by the government, it is assumed that the sample was aware of these figures and modified their behavior according to their perception of risk within the time period in this study.
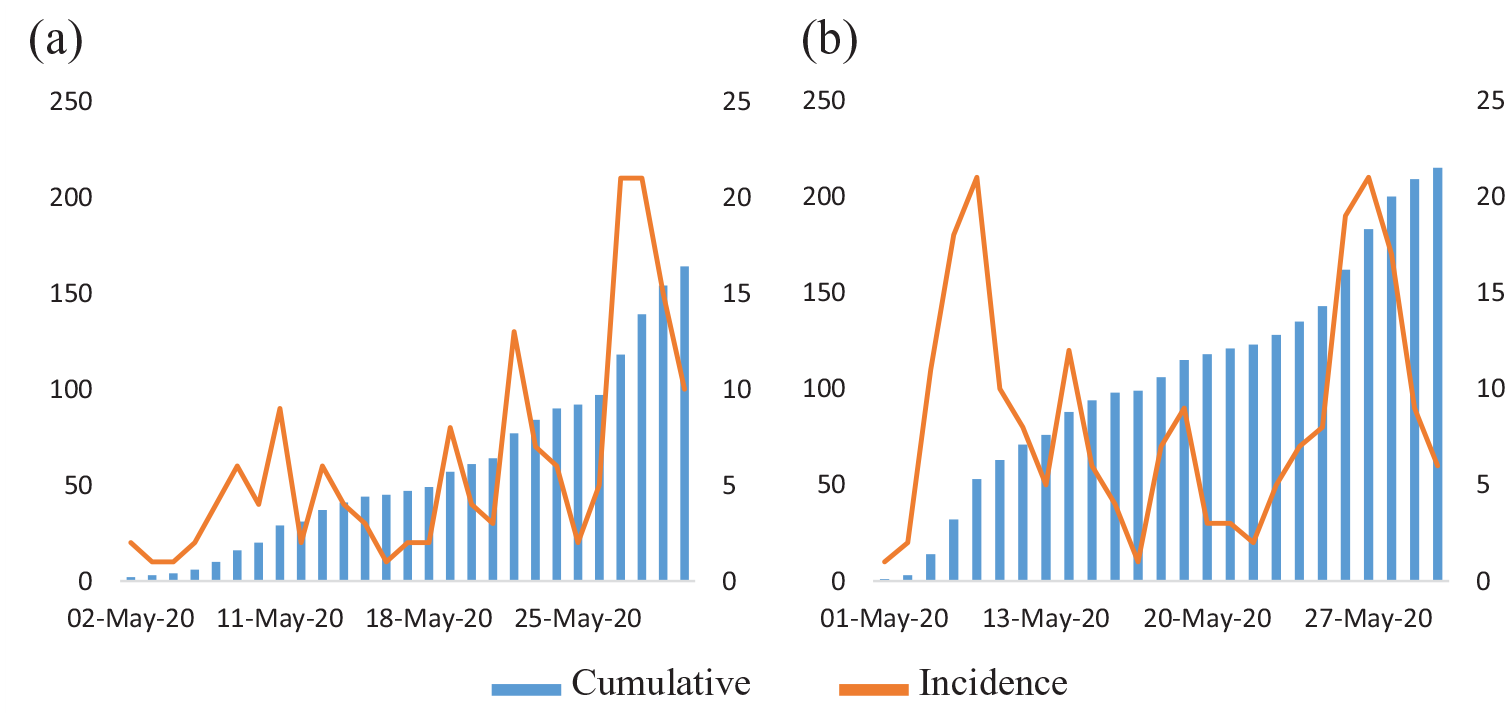
COVID-19 incidence, May 2020: (a) Kyunggi and (b) Seoul.
From Table 5, increasing infections clearly appear to have a statistically significant dampening effect on consumption as shown by the negative coefficient. This implies that spending patterns do seem to be influenced by risk avoidance measures in the phase of COVID-19 incidence. This effect is slightly moderated by date fixed effects.
COVID-19 incidence and MPC.
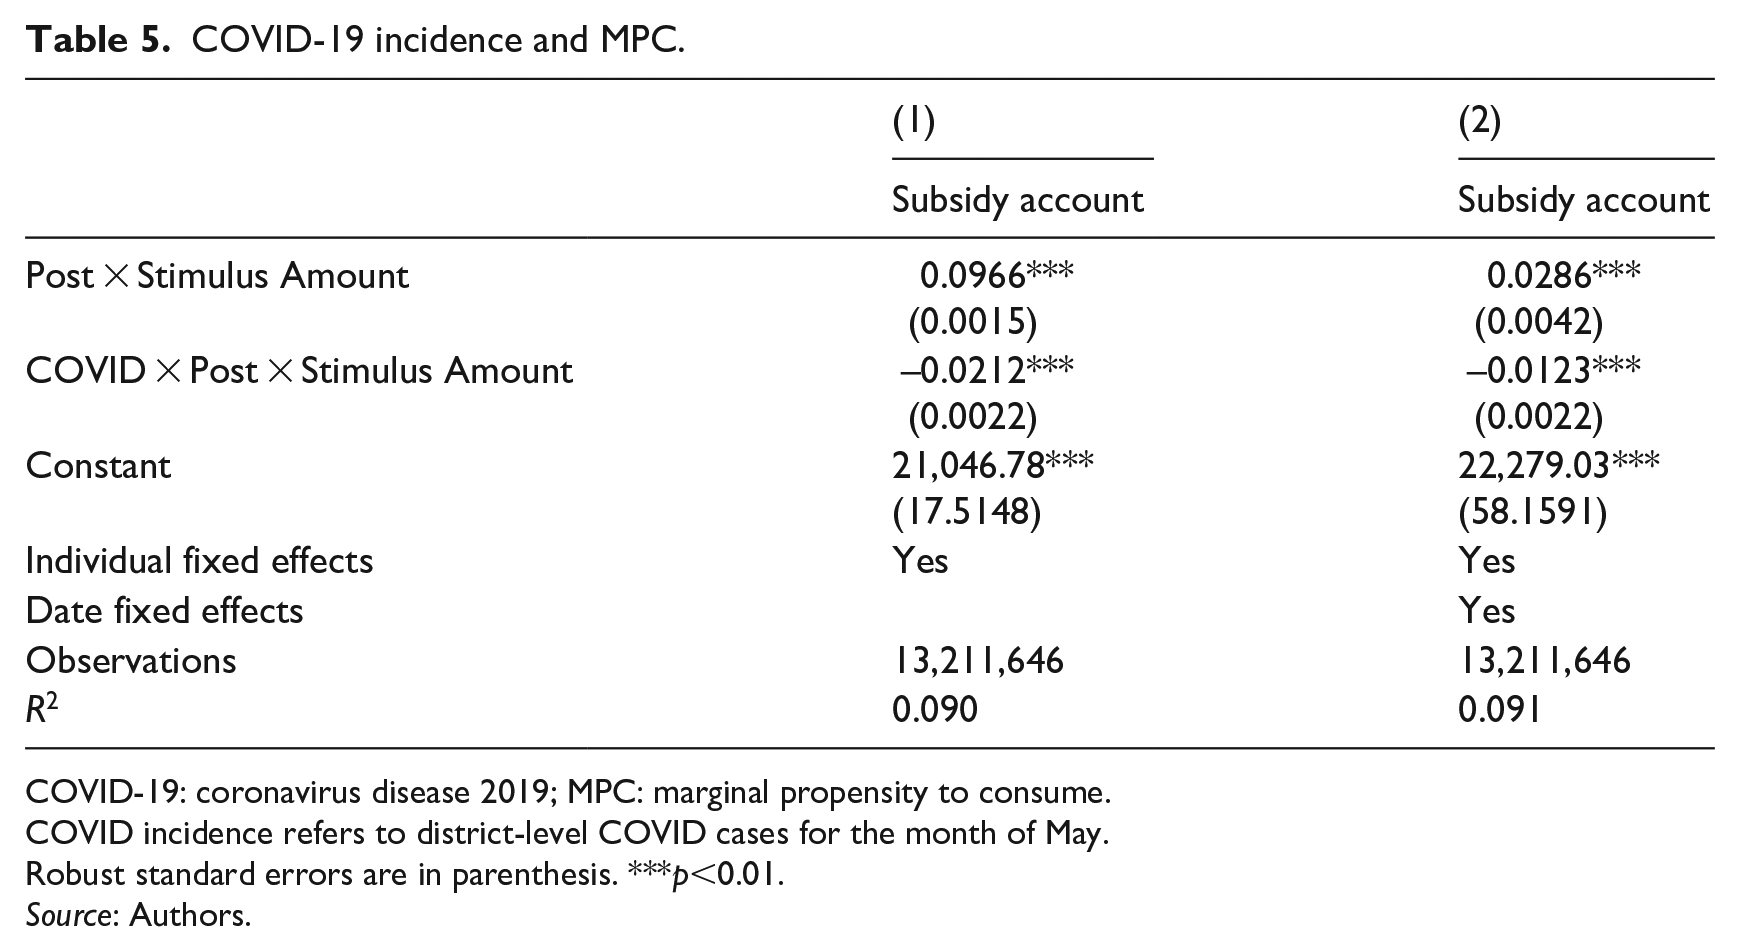
COVID-19: coronavirus disease 2019; MPC: marginal propensity to consume.
COVID incidence refers to district-level COVID cases for the month of May.
Robust standard errors are in parenthesis. ***p<0.01.
Source: Authors.
Absent a high-frequency, district-level measure for mobility or social distancing measures, we use district-level subway flows. From Table 6, subway flows, even accounting for population, appear to stimulate spending, and this effect is slightly moderated by date fixed effects. These results point to offering other means of assistance that are not necessarily consumption-based for areas that are most affected by the pandemic, whether through risk level or through curbed mobility, as a possible policy to mitigate losses.
Subway arrivals and MPC (subsidy account).
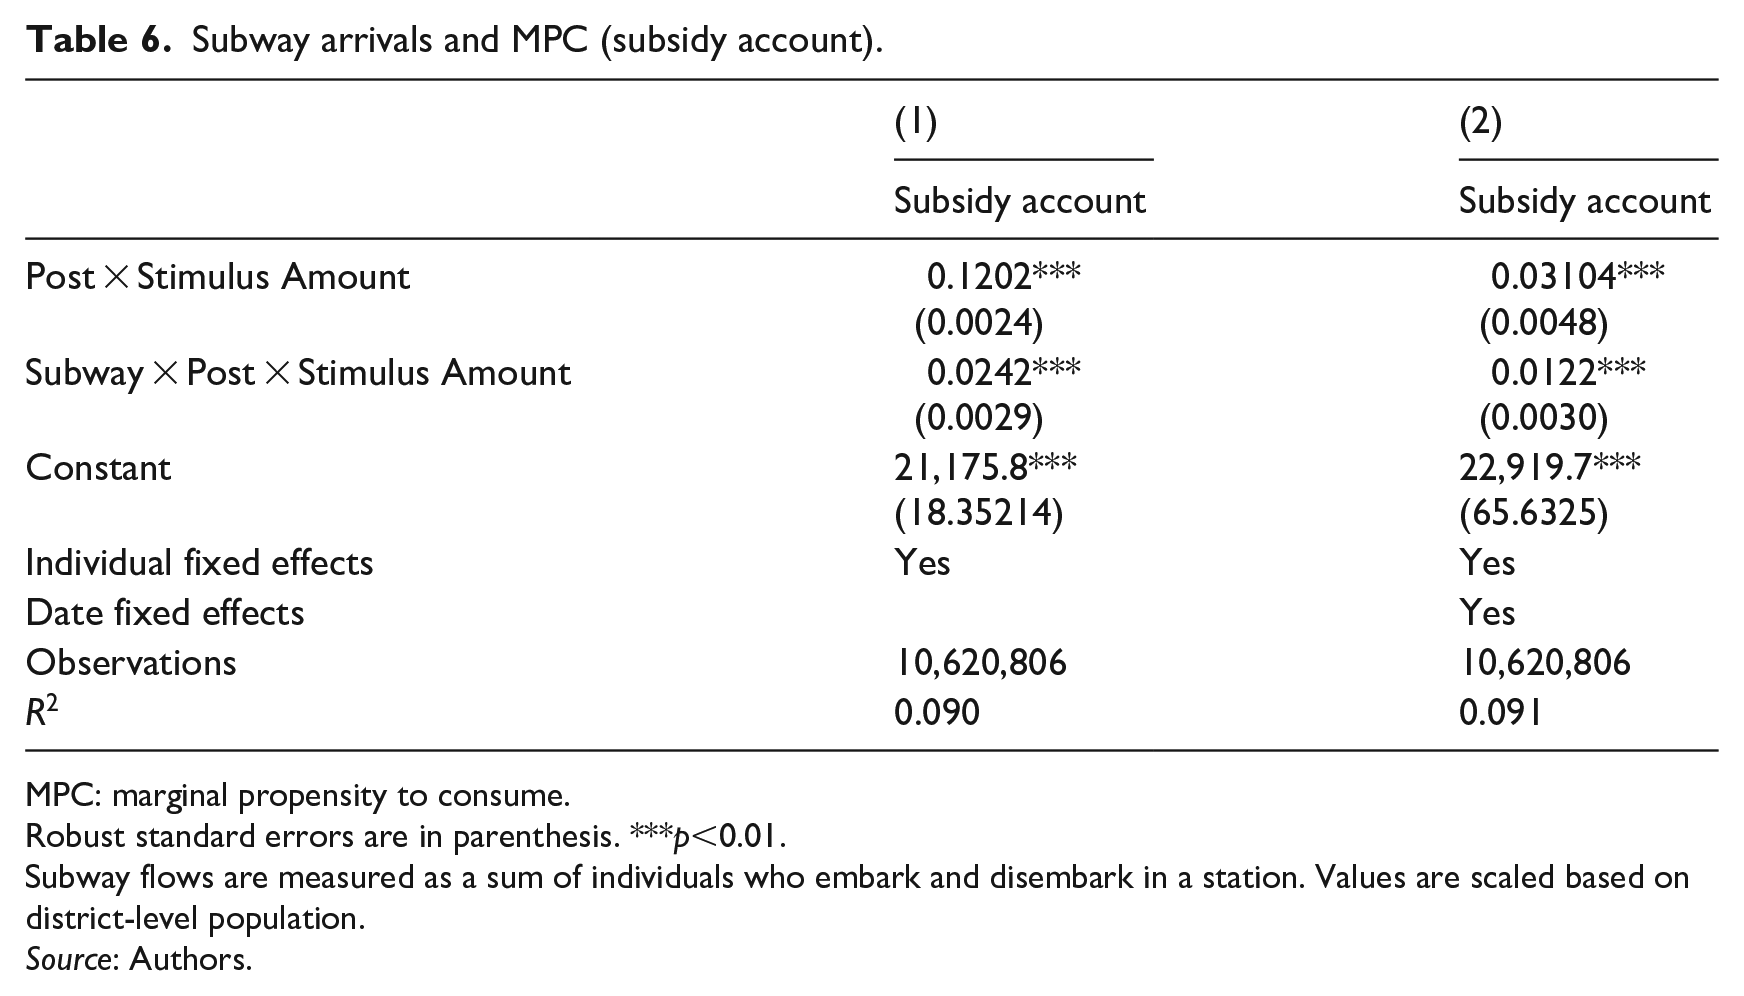
MPC: marginal propensity to consume.
Robust standard errors are in parenthesis. ***p<0.01.
Subway flows are measured as a sum of individuals who embark and disembark in a station. Values are scaled based on district-level population.
Source: Authors.
Heterogeneous impact of stimulus payments
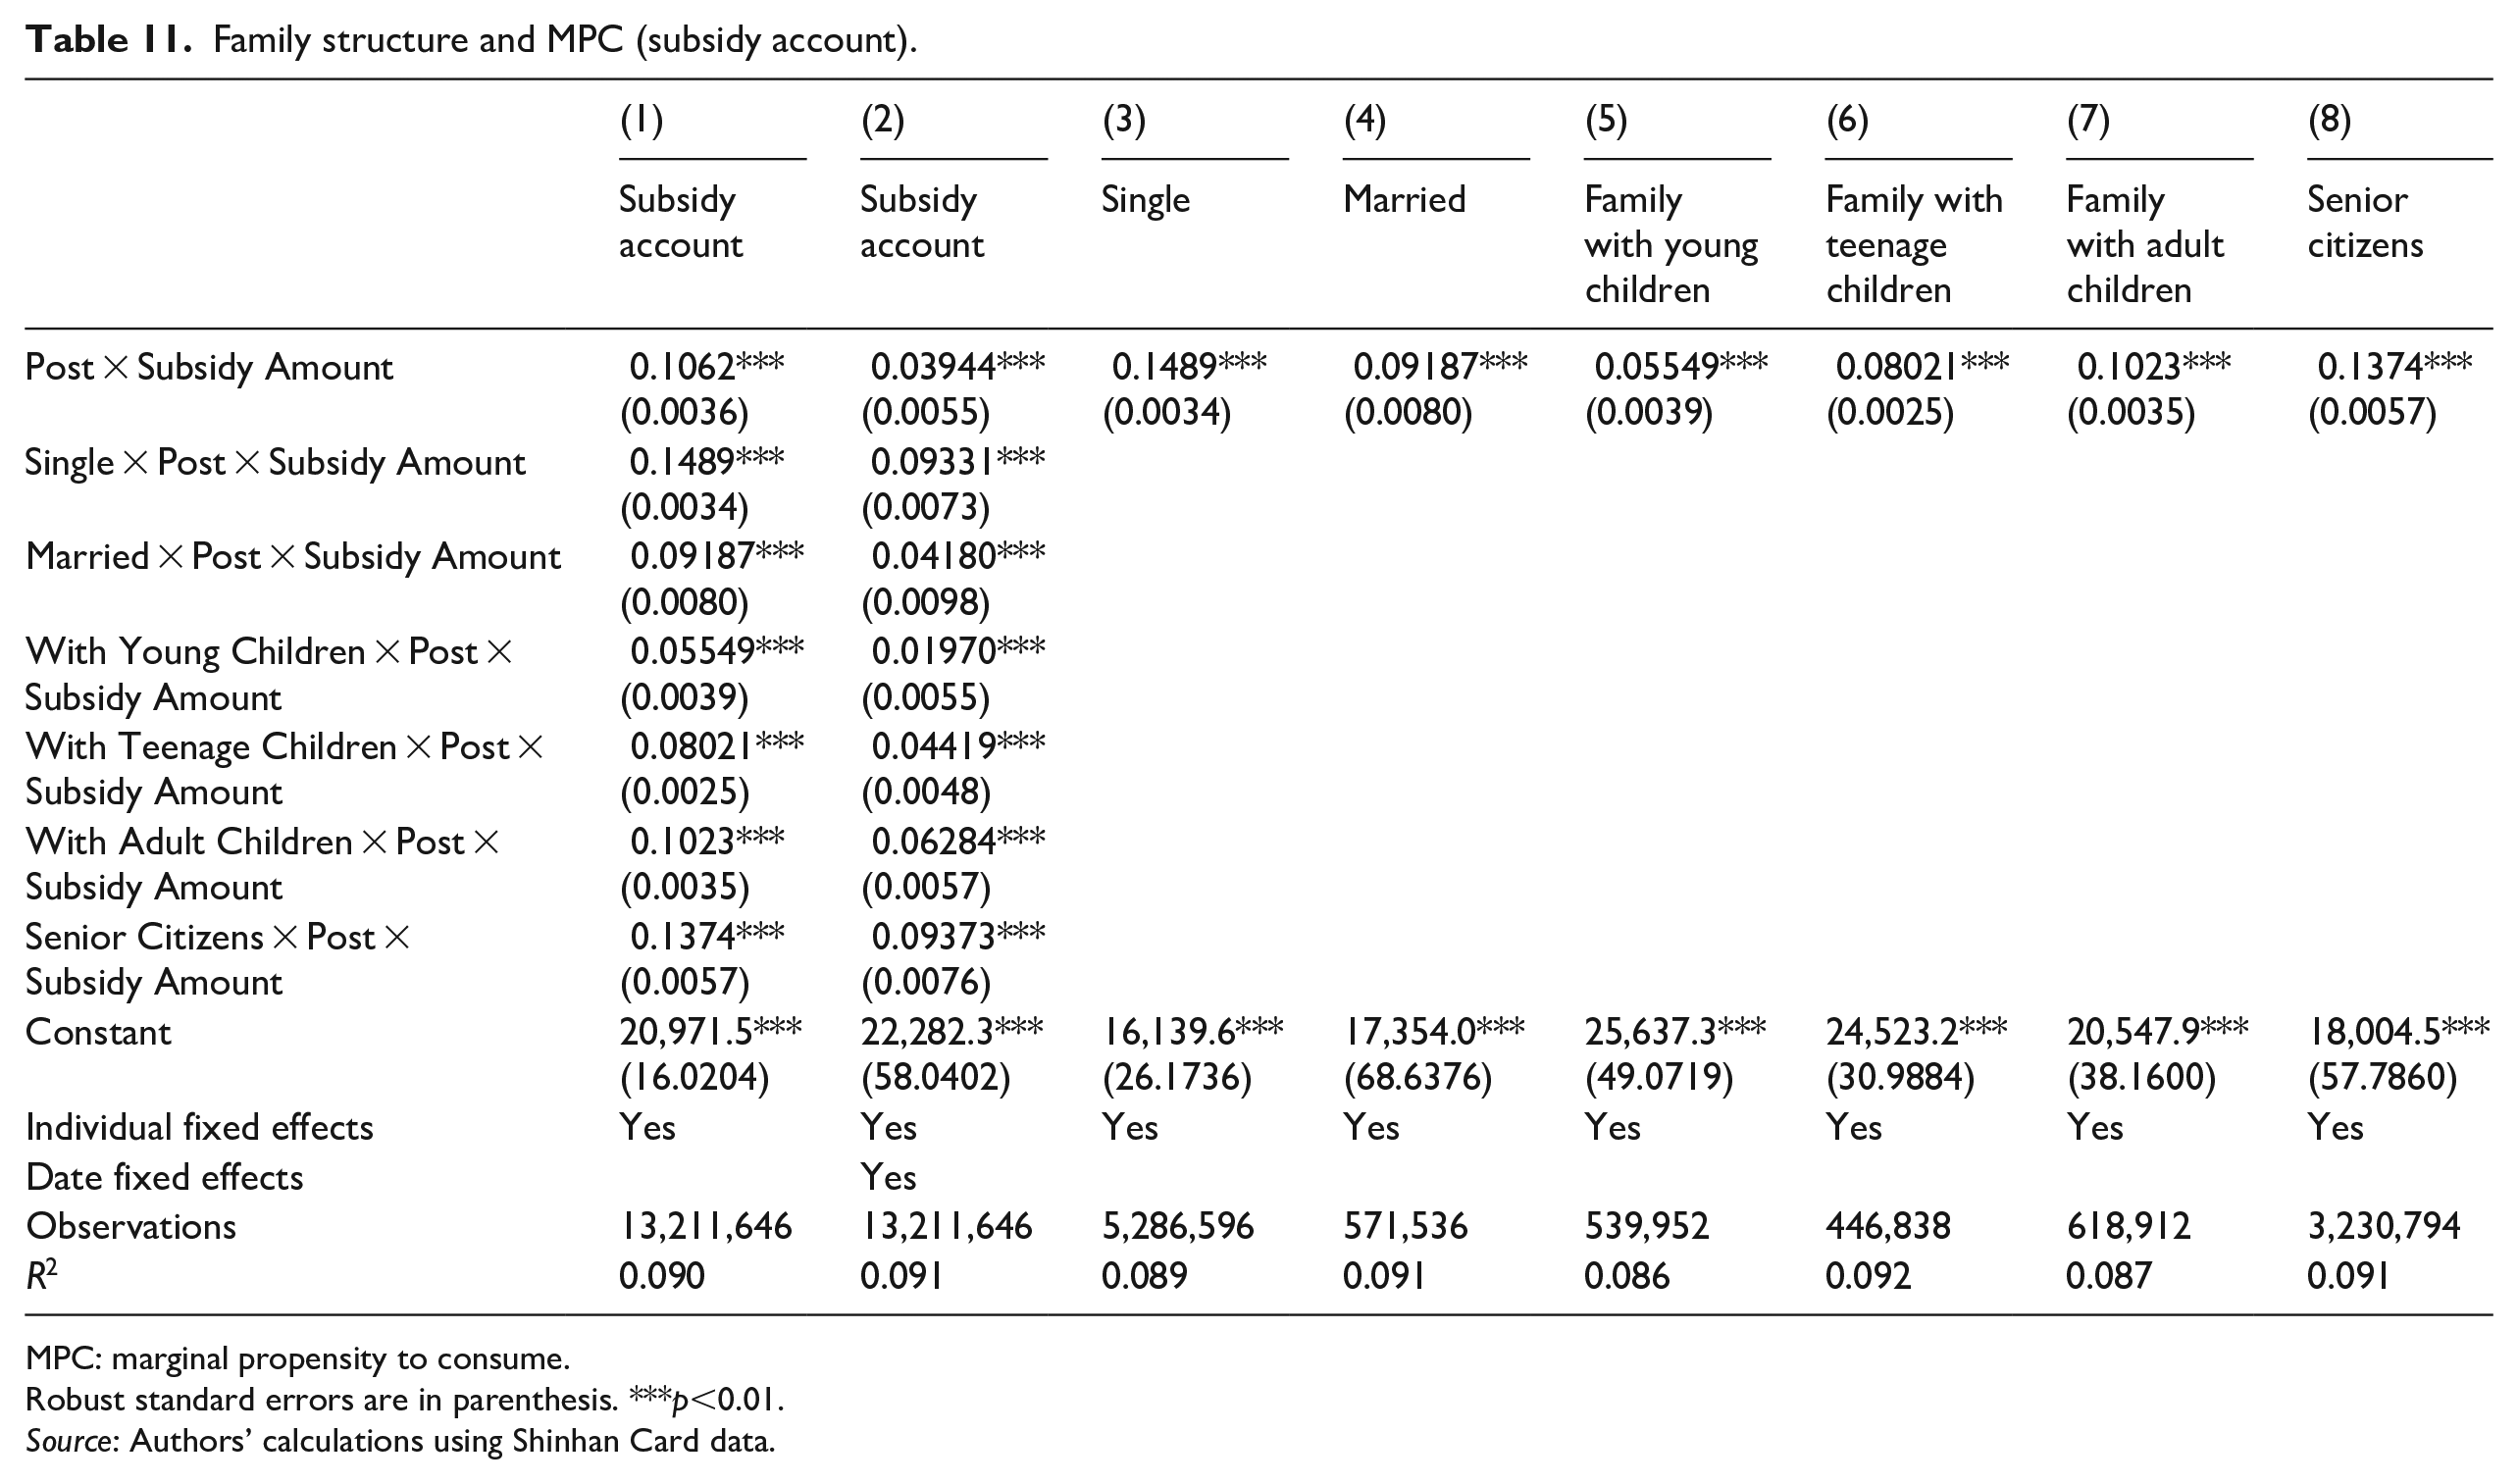
There are also clear differences across occupational categories (Figure 16). Self-employed individuals have an MPC (0.11) around 2 times more than government workers (0.06). This could be due to vocational differences in income stability and non-income compensation. In general, self-employed individuals, working on restaurants, entertainments, and so on, requiring face-to-face interaction for businesses could have been hit harder by the pandemic. Actual regression coefficients across different occupations and family structure can be found in Tables 8 and 11 in Appendix 1.
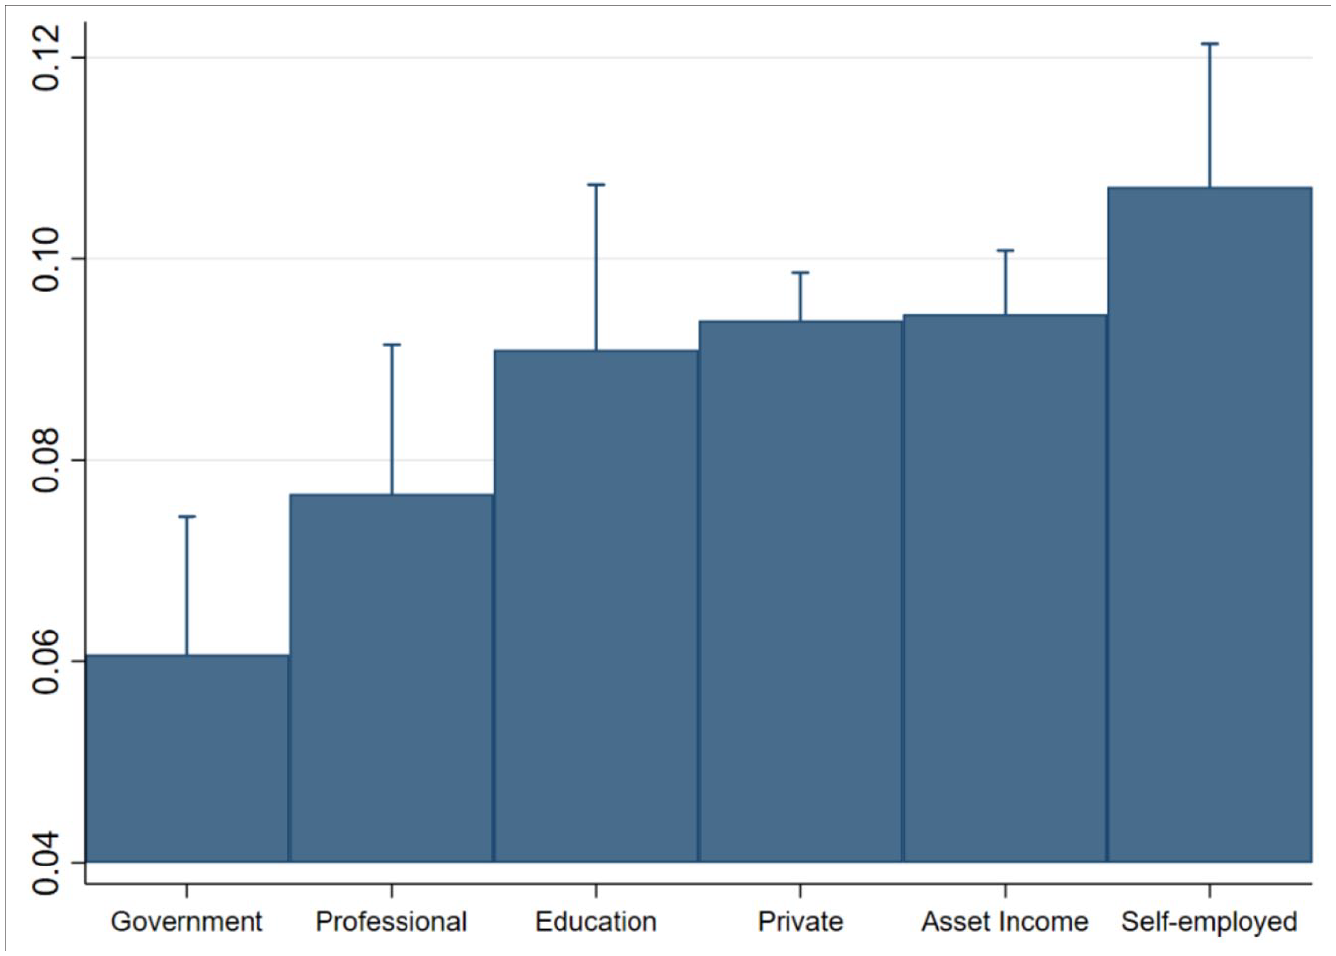
MPC by sector of occupation (subsidy account).
Once scaled by the subsidy amount, Seoul residents seemed to respond 2 times more strongly to the subsidy than Kyunggi residents (Figure 17). This may arise due to slight differences in subsidy policy in Seoul and Kyunggi, as mentioned in the previous section. Actual regression results may be found in Table 10 in Appendix 1. Heterogeneity observed across vocations and geographic location in addition to income levels and credit constraints further support the need for targeted policy implementations in strengthening policy effectiveness.
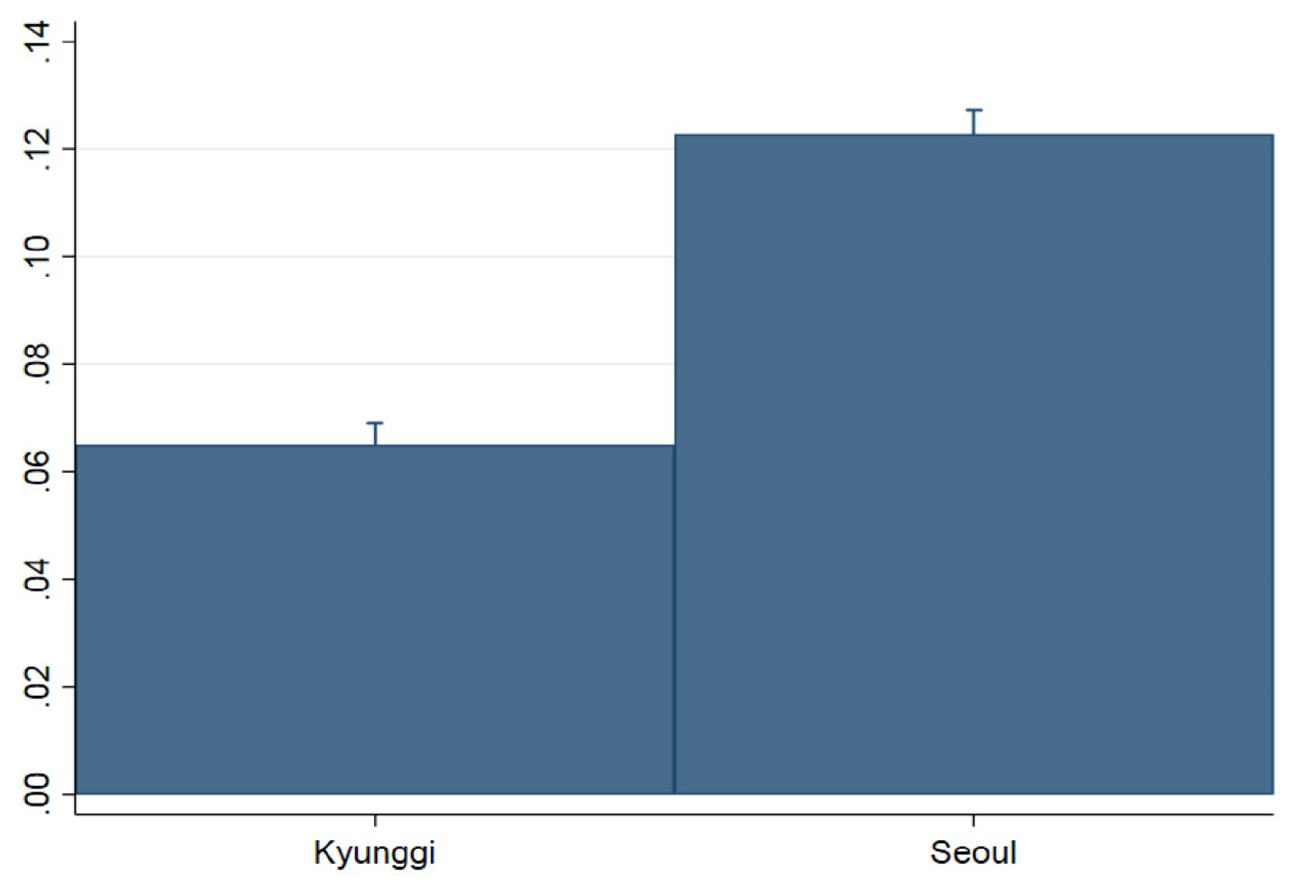
MPC by province of residence (subsidy account).
Conclusion
This research analyzes the impact of the Republic of Korea Government’s response to the COVID-19 economic downturn using a universal consumption subsidy program. Using proprietary, high-frequency, micro-level data from the largest credit card provider in the country, we find that the subsidy scheme appears to be effective in stimulating household consumption immediately after receipt. Moreover, we find that the subsidy disproportionately raises the consumption of lower income groups despite controlling for substitution across accounts; this holds true even when creating synthetic control groups that model rational spending behavior. This translates into the result that the smaller the average income, the larger the MPC for the group and vice versa. This finding provides a significant implication on the effectiveness of fiscal policy. Given the fiscal multiplier in a simple macroeconomic model is known as
We also test the role of liquidity constraints by using average historical credit card spending data and expenditure share out of income data. We find that credit and liquidity constraints play an important role in determining spending responses, specifically in that consumption decreases as credit availability is larger and liquidity constraints smaller as measured by the consumption-out-of-income ratio. In addition, we show evidence that COVID-19 incidence and mobility decrease the effectiveness of stimulus payments as a means to boost consumption. Heterogeneity is observed across family occupational groups, possibly due to different degrees of adverse impact on different vocations from the pandemic. Moreover, we find that slight differences in policy implementation between Seoul and Kyunggi province, specifically in restricted sectors of spending, led a marginal increase in consumption for Seoul residents. The study lends to the argument for making the government subsidy programs more targeted to enhance overall impact. For fiscal policy effectiveness, priority should be put on targeting the lower segment of income groups and those hit harder than others.
Footnotes
Appendix 1
Family structure and MPC (subsidy account).
| (1) | (2) | (3) | (4) | (5) | (6) | (7) | (8) | |
|---|---|---|---|---|---|---|---|---|
| Subsidy account | Subsidy account | Single | Married | Family with young children | Family with teenage children | Family with adult children | Senior citizens | |
| Post × Subsidy Amount | 0.1062*** (0.0036) |
0.03944*** (0.0055) |
0.1489*** (0.0034) |
0.09187*** (0.0080) |
0.05549*** (0.0039) |
0.08021*** (0.0025) |
0.1023*** (0.0035) |
0.1374*** (0.0057) |
| Single × Post × Subsidy Amount | 0.1489*** (0.0034) |
0.09331*** (0.0073) |
||||||
| Married × Post × Subsidy Amount | 0.09187*** |
0.04180*** |
||||||
| With Young Children × Post × Subsidy Amount | 0.05549*** |
0.01970*** |
||||||
| With Teenage Children × Post × Subsidy Amount | 0.08021*** |
0.04419*** |
||||||
| With Adult Children × Post × Subsidy Amount | 0.1023*** |
0.06284*** |
||||||
| Senior Citizens × Post × Subsidy Amount | 0.1374*** |
0.09373*** |
||||||
| Constant | 20,971.5*** |
22,282.3*** |
16,139.6*** |
17,354.0*** |
25,637.3*** |
24,523.2*** |
20,547.9*** |
18,004.5*** |
| Individual fixed effects | Yes | Yes | Yes | Yes | Yes | Yes | Yes | Yes |
| Date fixed effects | Yes | |||||||
| Observations | 13,211,646 | 13,211,646 | 5,286,596 | 571,536 | 539,952 | 446,838 | 618,912 | 3,230,794 |
| R 2 | 0.090 | 0.091 | 0.089 | 0.091 | 0.086 | 0.092 | 0.087 | 0.091 |
MPC: marginal propensity to consume.
Robust standard errors are in parenthesis. ***p<0.01.
Source: Authors’ calculations using Shinhan Card data.
Funding
The author(s) received no financial support for the research, authorship, and/or publication of this article.