
Abstract
It is a well known that nucleation by gases in the supercritical state lead to high-density nanocellular foams, but the aim of this article was to find a route to microcellular low-density closed-cell foam with expected low heat conductivity and high mechanical properties. Polystyrene was impregnated with carbon dioxide or propane at room temperature and 70 bar pressure. Pentane served as a reference substance. The samples were investigated by electron microscopy. The specimens comprising carbon dioxide and propane showed bubbles surrounded by a ring of lamellas. The samples were foamed in hot bathes of silicone, of saturated NaNO3 water solution, and in water vapor under stretching conditions at 100℃ or 110℃. The foaming was registered continuously on a balance by buoyancy experimentally and calculated in diffusion as well as viscosity-controlled foaming models. A microcellular foam with 35 kg/m3 density, 1.5 µm or 1500 nm cell diameter, 5.5 MPa tear strength, and 0.027 W/m.K heat conductivity was obtained, which looked like porcelain. The continuous manufacture of low-density carbon dioxide or propane foam by extrusion did not lead to microcellular foam, because the necessary high-pressure, low-temperature nucleation conditions could not be performed.
Introduction
Large-scale cellular polystyrene (PS) is manufactured by two procedures.
1
Expandable PS beads comprising pentane are produced by dispersion polymerization and are expanded in water vapor. After storage, they are further expanded to boards or other items in water vapor. In Europe, 730,000 tonnes per year are produced. Cellular PS boards X-PS are manufactured by extrusion through a broad slit nozzle. Blowing agents are carbon dioxide and pentane. In Europe, 210,000 tonnes per year are consumed.
Common demands on closed-cell rigid foams are the use of environmentally friendly blowing agents, low heat conductivity, low density, low manufacturing costs, and high mechanical properties.
According to ASTM D 883-80C and DIN 7726, a cellular plastic is defined as a plastic, the apparent density of which was decreased substantially by the presence of numerous cells displaced throughout the mass. Microcellular foams with 10 µm cell diameter and densities between 200 and 800 kg/m3 are published in various literatures.2–9 Low-density open-cell PS foams with 35–50 kg/m3 are accomplished in extrusion, when mixtures of highly nucleating chlorofluorohydrocarbons, fluorohydrocarbons, and carbon dioxide are used. Though the cell sizes are as small, about 5–80 µm, the K-factors at ambient pressures are 0.5–0.46 W/m.K high.10–12 Foams with cell sizes of 90–200 µm are obtained, when PS was extruded in the presence of hydrofluoropropenes as a substitute for HFC 134a. The numerical and experimental bubble growth during the microcellular foaming process is described for PS expanded by the blowing agent nitrogen and carbon dioxide.13,14 The established calculations are based on a diffusion-controlled Newtonian model, a power law model, and a viscoelastic model. In the present paper, an earlier published calculation is used. 15 In the literature,16–18 the mechanism of extensional stress-induced cell formation in PS foaming is and investigated and visualized.
Nanofoams with pore diameters of less than 100 nm are well known for aero gels, metal, and carbon foams. When polyetherimide is stored at 21℃ and 10 MPa pressure, 12% CO2 is taken up. After heating at 200℃, a 500 kg/m3 foam with 0.1–0.1 µm pore sizes is obtained. 19
The task was to investigate nanosized low-density closed- cell PS foam with densities of 35 kg/m3 and to find out a route for its production.
Experimental
Materials
Chemicals and ingredients used.
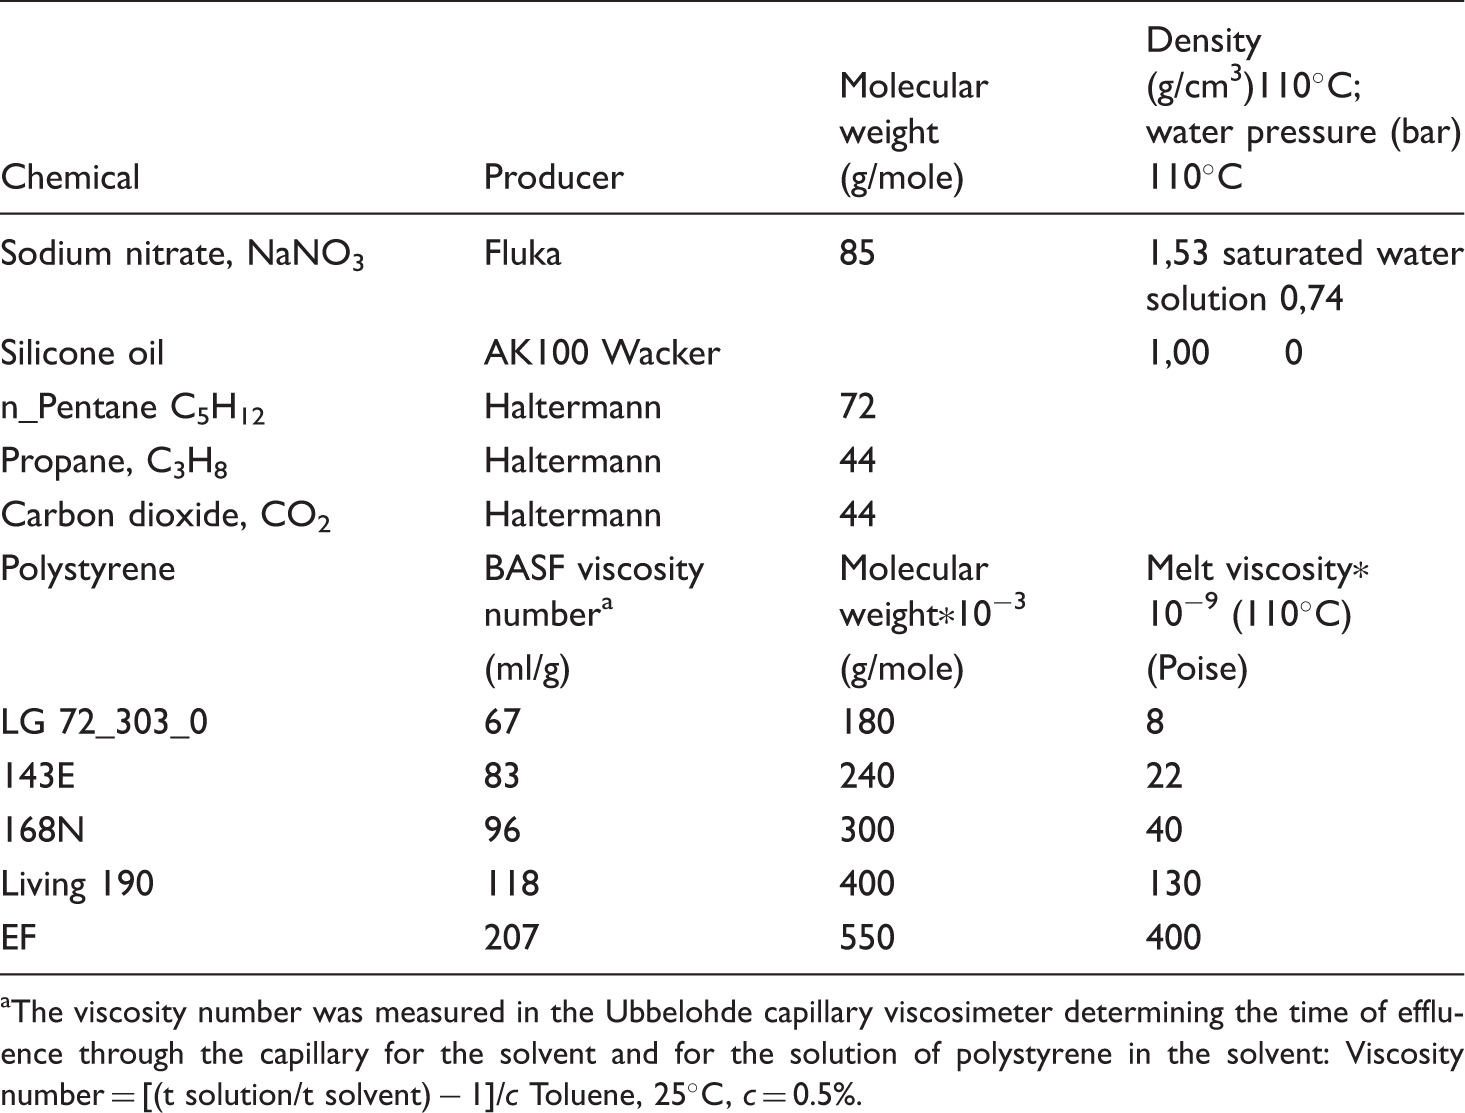
aThe viscosity number was measured in the Ubbelohde capillary viscosimeter determining the time of effluence through the capillary for the solvent and for the solution of polystyrene in the solvent: Viscosity number = [(t solution/t solvent) − 1]/c Toluene, 25℃, c = 0.5%.
Equipment
Impregnation of PS with carbon dioxide, propane, and pentane was performed at temperatures from 20℃ to 120℃ at 1 to 100 bar pressure in an autoclave. The uptake of blowing agent was determined by weight and volume measurements.
The expansion b was dimensionless and was defined as (do/df) −1, where do = 1 g/cm3 was the density of the unexpanded PS and df was that of the foamed sample. The expansion b of the specimen, with the weight E1, was measured continuously by buoyancy E2 using a wire cage containing the sample. The cage was fixed on the electronic microbalance 4130 from Sartorius (Sartorius microbalances: Sartorius, Göttingen, Germany) and dipped into hot silicone oil or saturated aqueous sodium nitrate solution. E2 was the measured negative weight of the sample in the bath caused by buoyancy E1*[(b + 1)/do]*d1. After rearrangement the following equation was established

Measurements in silicone oil AK 100 with 1 cm3/g CO2 solubility and in mercury without gas solubility led to the same results.
Cellular boards were manufactured using a Polypan LMP R.C.B.3/E machine from Colombo System (Extruder: Polypan, LMP/Polytal, Torino, Italy): corotating twin-screw extruder, 180 mm screw diameter, L/D = 17/1, 3030 kgm torque, rotation 8–26 r/min (LMP/POLTAL Ltd). For the extrusion of boards, a broad slit nozzle with the dimensions 5 mm × 23 mm was used.
The cell structures were determined by light, scanning electron microscopy, and stereo scan sonde. The tear strength of foamed samples was measured on a Shimadzu Autograph tear machine (Tear strength measurements Shimadzu Europe Autograph AG-X Series: Shimadzu Europe Münster, Germany). The heat conductivity was determined with the help of a Dynatech Wärmeleitfähigkeits–Meßgerät Modell K-Matic K75 (Dynatech heat conductivity: Kipp & Zonen, Delft, The Netherlands). The content of the closed cells was measured in the Beckman air pyknometer (Beckman Air Pyknometer: Beckman Instruments GmbH. Munich, Germany) according to ASTM 2856-70.
The polymer permeation analyzer, Dohrmann Div. of Envirotech Corp., provided the constants of permeation and diffusion. The diffusion constant was determined from the instationary part of permeation just after gas contact.
Experiments
Impregnation and characterization of impregnated samples
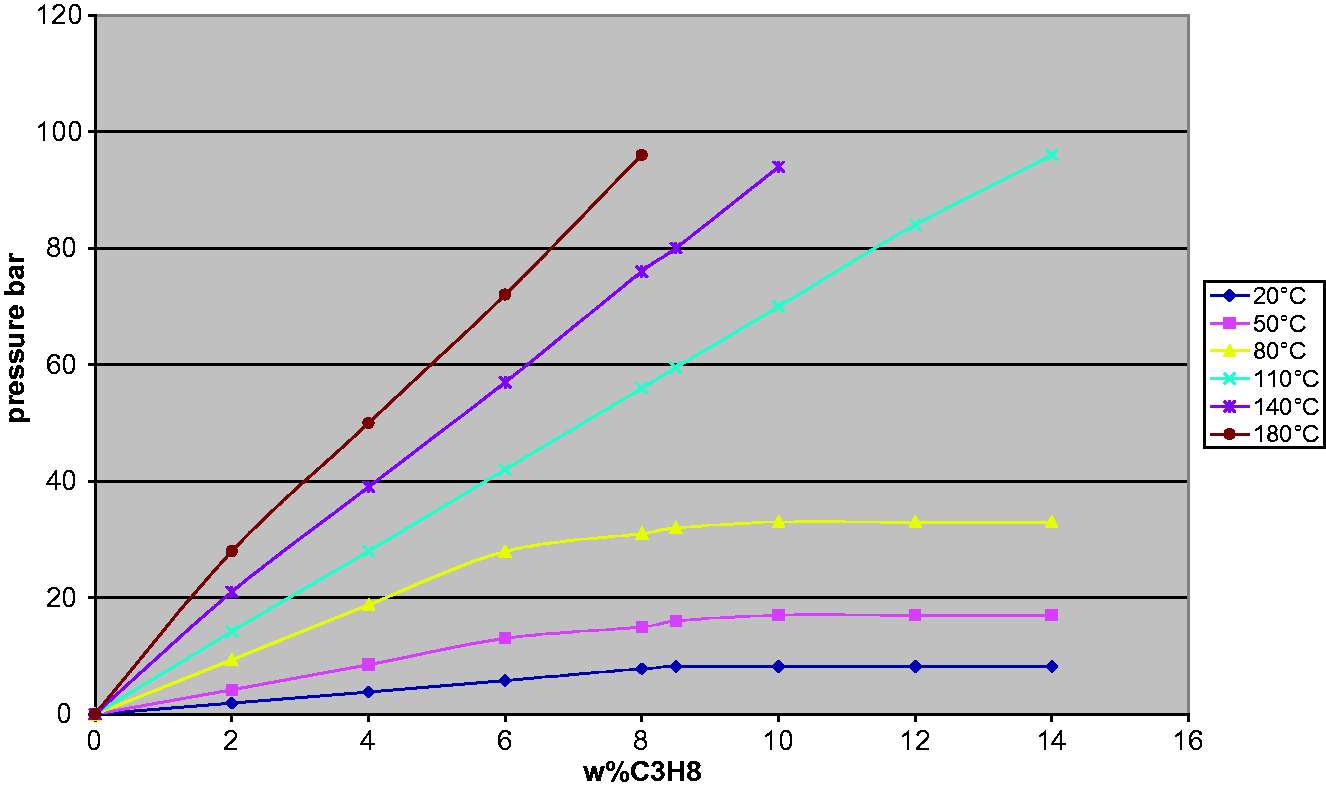
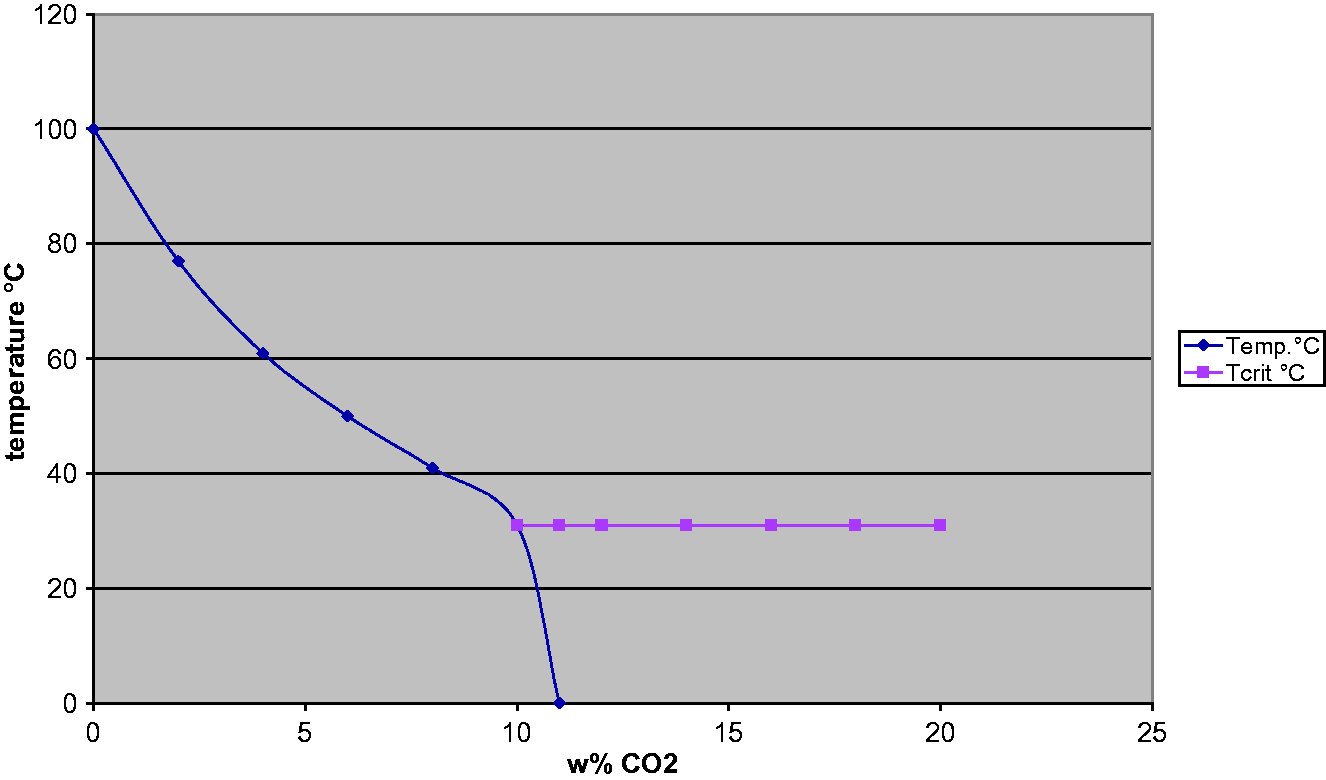
Solubility data of carbon dioxide, propane, and n-pentane in PS were available in various literatures.20–22 The measured uptake values of carbon dioxide (CO2) and propane (C3H8) were determined and documented in Figures 1 and 2. PS-143E bars were stored for 3 days under gas pressure in an autoclave. After quick withdrawal, the uptake was measured on a balance. The agreement with solubility data
22
was good. The values for the depression of the glass temperature of PS was taken from various studies23–27 and depicted in Figure 3.
Carbon dioxide pressure upon PS-143E/CO2. Propane pressure upon PS-143E/propane.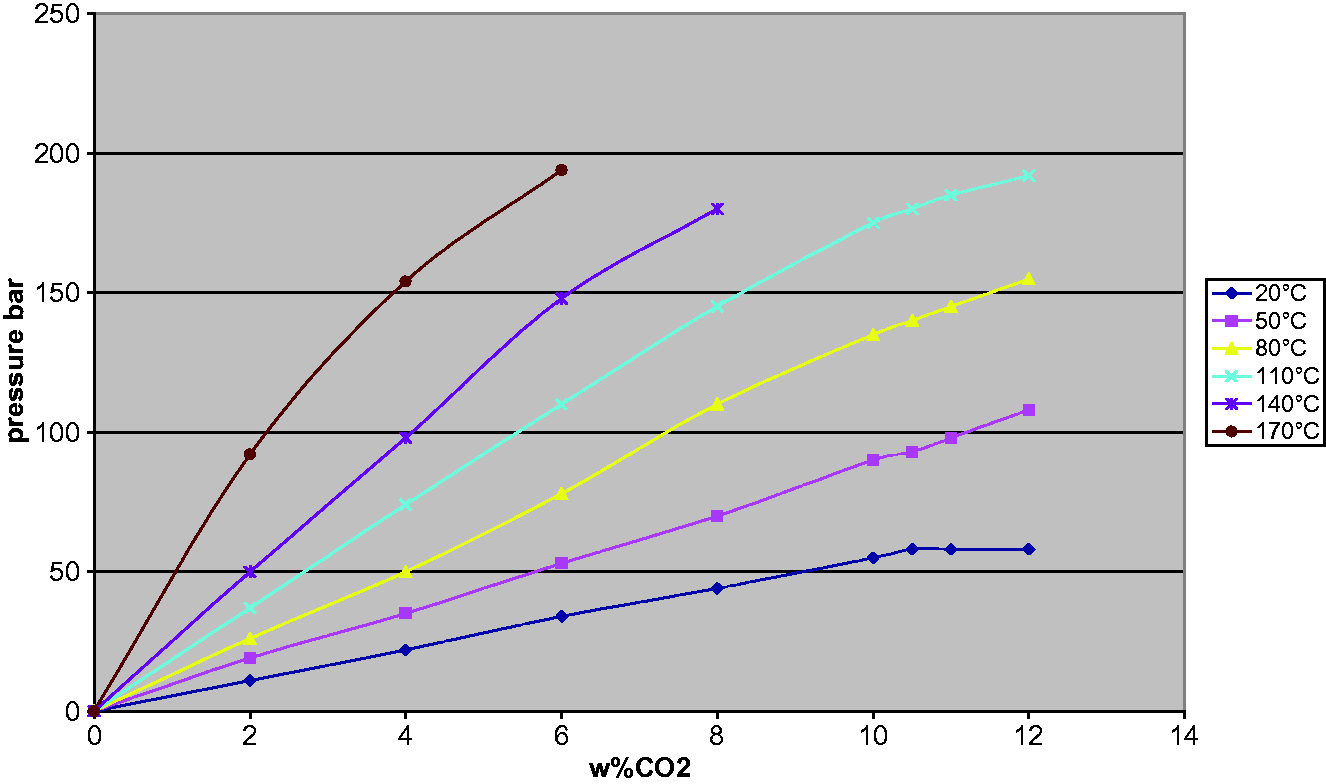
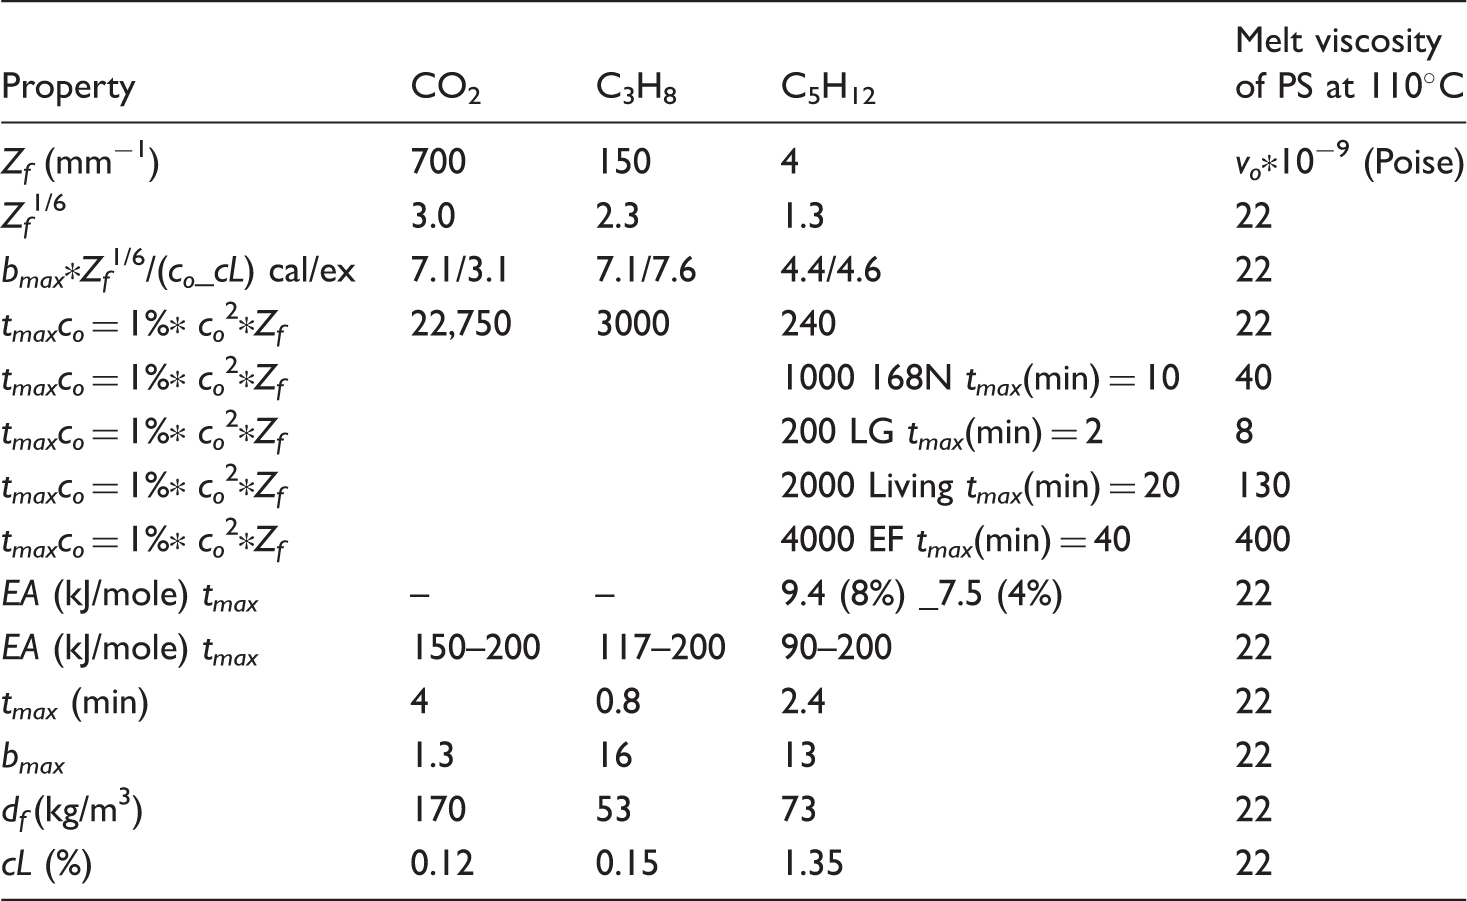
Data of blowing agents alone or in the presence of PS.
The dimensionless
Do was the constant of diffusion without dissolved blowing agent. EA, the energy of activation for diffusion, was determined by the Arrhenius plot:
Dc, the diffusion constant at the dissolved gas concentration C, was calculated for the CO2 concentration 6%

Characteristic data of blowing agents in PS were those such as the heat of solution H L , which was defined as the sum of the heat of condensation and mixing, and the specific glass temperature depression dTglass/wt%. The Henry constant k was equal to the reverse solubility cL of the blowing agent in PS at atmospheric pressure.
H was dimensionless and resulted from
PS was stored in liquid n-pentane at the room temperature (RT). In the case of gaseous blowing agents carbon dioxide and propane, PS was impregnated in an autoclave at a pressure of 70 and 120 bars at temperatures of between RT and 100℃ for 3 days. The procedure was exemplified with carbon dioxide: immediately after the removal from the pressure vessel, the amount of dissolved carbon dioxide cL and the specific volume V1 of the sample was measured. V1 followed equation (3) and was the sum of the volumes of PS and liquid carbon dioxide

After storage, the samples lost their blowing agent quickly and reached the specific volume V2 according to the following equation

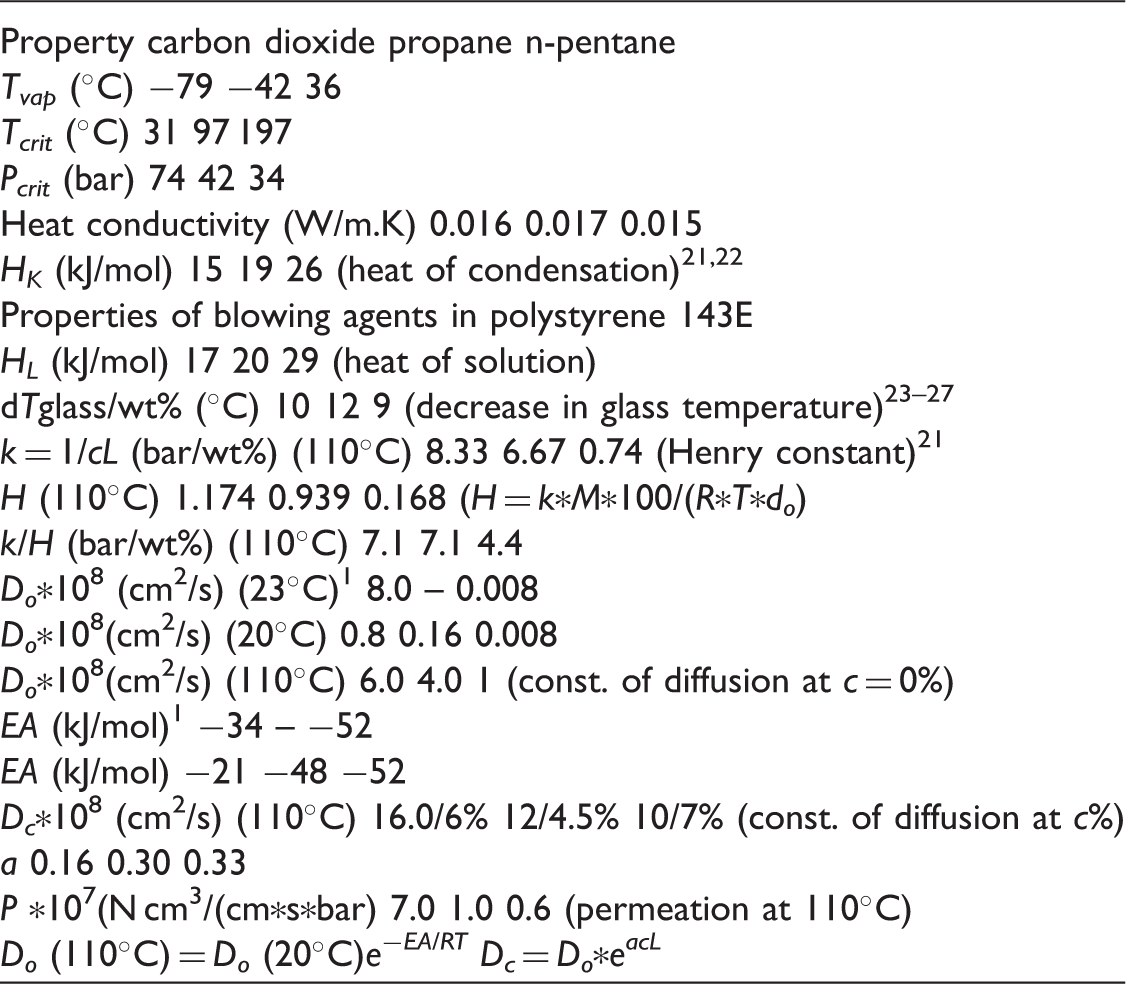
The sample stored at RT and 7 MPa pressure was investigated with different enlargement by scattering electronic microscopy, as shown in Figure 4.
Electron microscopy of PS-143E/CO2 sample delivered from the pressure vessel after storage at RT and 7 MPa CO2 pressure for 3 days.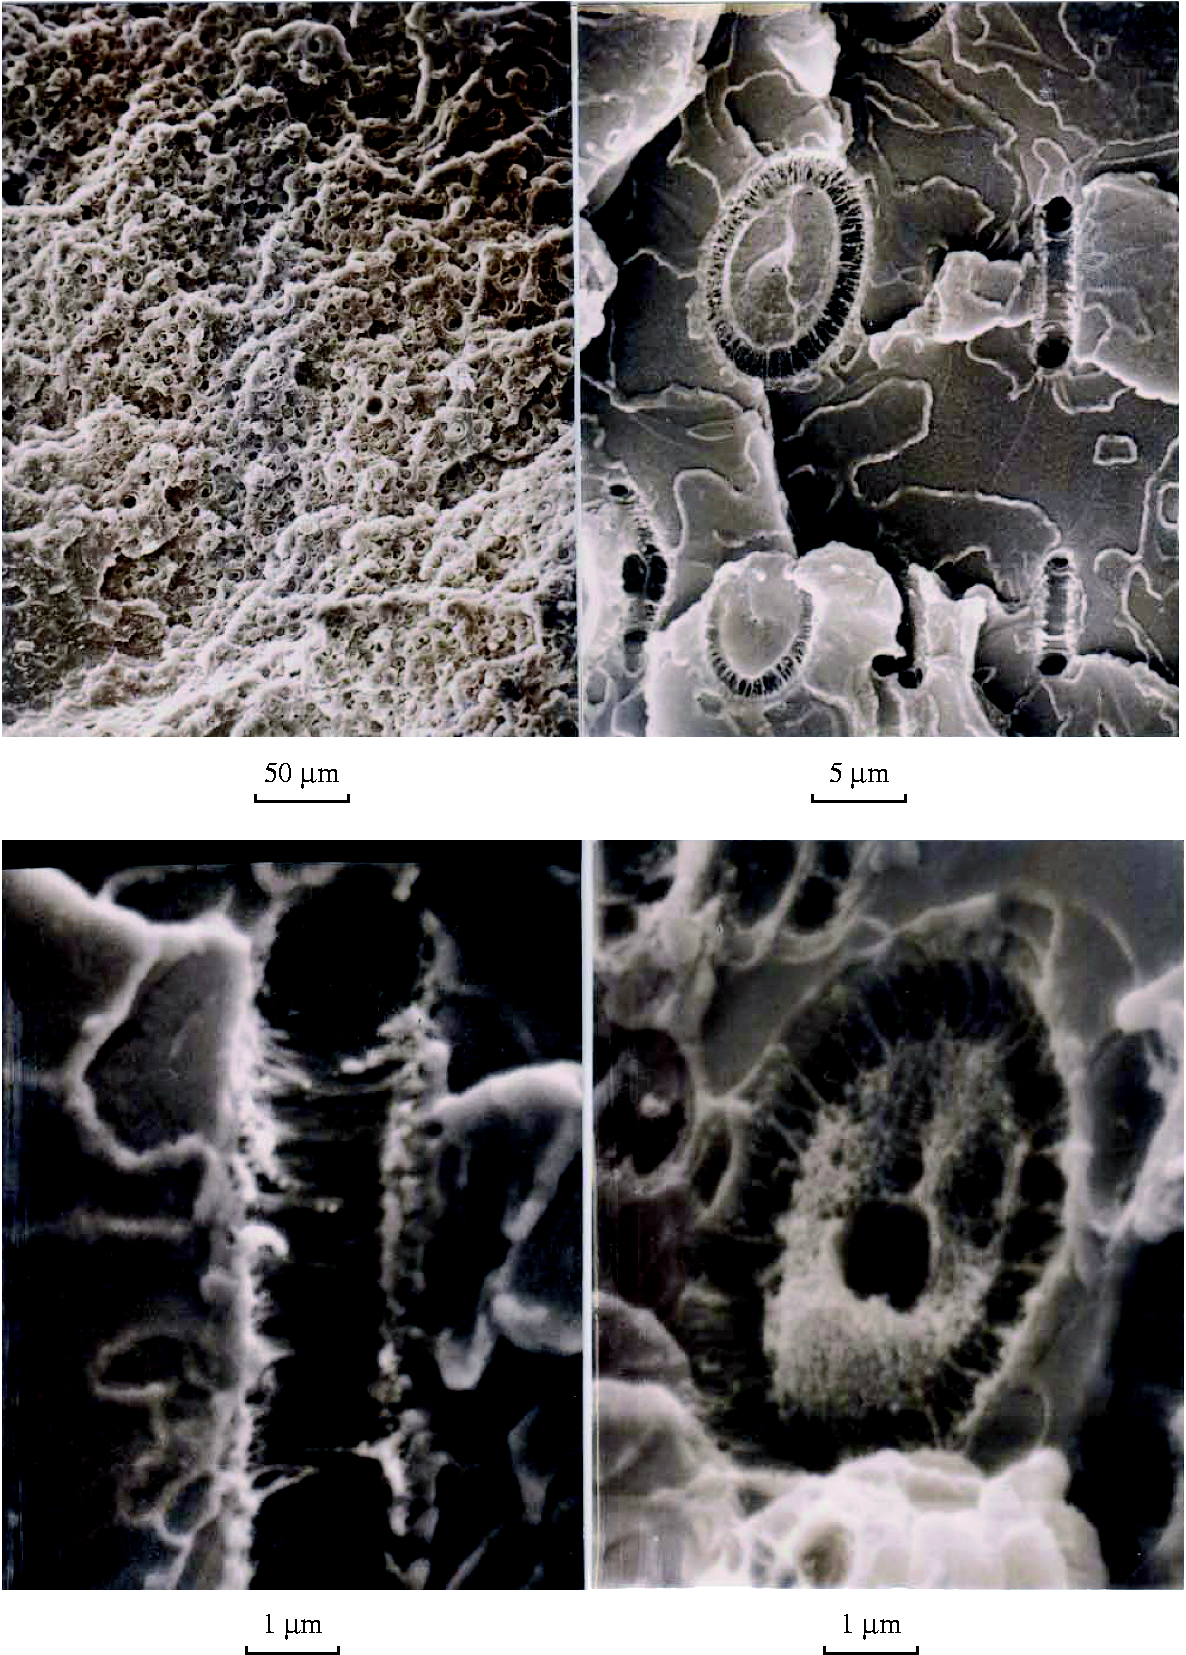
The structure of the cavities was astonishing: the whole assembly consisted of a bubble surrounded by a circular ring of fanned cavities. In Figure 4, 1.5 assemblies were registered per 10 µm or 150/ mm. When the fanned cells, with a geometry of small discs with an area of ro2*π and a height of ro = 0.1 µm, were counted, a 10 time larger number of 15/10 µm or 1500/1 mm was determined. These figures were important for the calculation of the expected cellular structure of foams with low densities of about 30 kg/m3 according to equation (5). For instance, in the case of 150 cells per 1 mm (Zo = 150) with a density of 100 kg/m3 according to equation (5), a cell number of 46.5 (Zf = 36.5) resulted in a foam with a density of 30 kg/m3

PS-143E/CO2 storing conditions in the pressure vessel, cL amount of dissolved CO2, specific volumes VCO2, VPS, V1, V2, and cell number Zo.

In the foaming process, expansion had to start from an initial expansion of bo. This starting expansion was given by the number of spherical holes multiplied by the volume of holes. For the circular ring of fanned cavities with the geometry of discs, bo was calculated by equation (6a) and amounted to 0.011. The averaged radius of the holes was ro and had the dimension of about 0.1 µm.

In the reference sample of PS/pentane, only the large spherical holes with a diameter of 2r = 20 µm in wide distances of about 65 µm were detectable by electronic microscopy. Therefore, in the case of Zo = 0.015/µm, the initial expansion started at bo according to

Though the cell numbers were very different, the initial expansions of bo were quite similar and about 0.01–0.015. The knowledge of bo was important for the calculation of foaming according to the viscosity model.
Foaming in silicone oil with vapor pressure 0 bar at 110℃
The wire cage of the Sartorius balance was charged with samples of PS comprising blowing agent, which were immersed in the 110℃ hot bathes of silicone oil.
In Figure 5, the foaming in silicone oil at 110℃ was documented for PS-143E impregnated with co = 5% carbon dioxide, propane, and pentane. The cell numbers Zf were determined by light microscopy and by electronic microscopy on cuts of the maximum foamed samples and are recorded in Table 4.
Expansion b of PS-143E 0.1 g samples with 5% blowing agent in an oil bath at 110℃. Foaming of 0.1 g PS-143E with 5% blowing agent in silicone oil with p
w
=0 at 110℃.
The reduced data of Table 4 were derived from foaming experiments, such as that shown in Figure 5. Vice versa, the data of Figure 5 could be calculated from the reduced data in Table 4, under the use of equations (7) and (8): for instance b
max
and t
max
were calculated for the sample 143E/CO2. In order to obtain b
max
for 5% CO2, the reduced value 

Pentane was the best investigated blowing agent and served as reference: the influence of PS molecular weights on b max was negligible, but on t max the maximum foaming time as well as the reduced value increased with vo, the melt viscosity of PS. t max was obtained, when t max .co2*Zf = 420 was divided by co2*Zf = 52*7 = 175 then t max = 2.4 min.
The experimental data indicated a linear relationship of t
max
with the viscosity vo

Clausius–Clapeyron treatment of b max in dependence of temperature for PS-143E/pentane with 4% and 8% pentane.
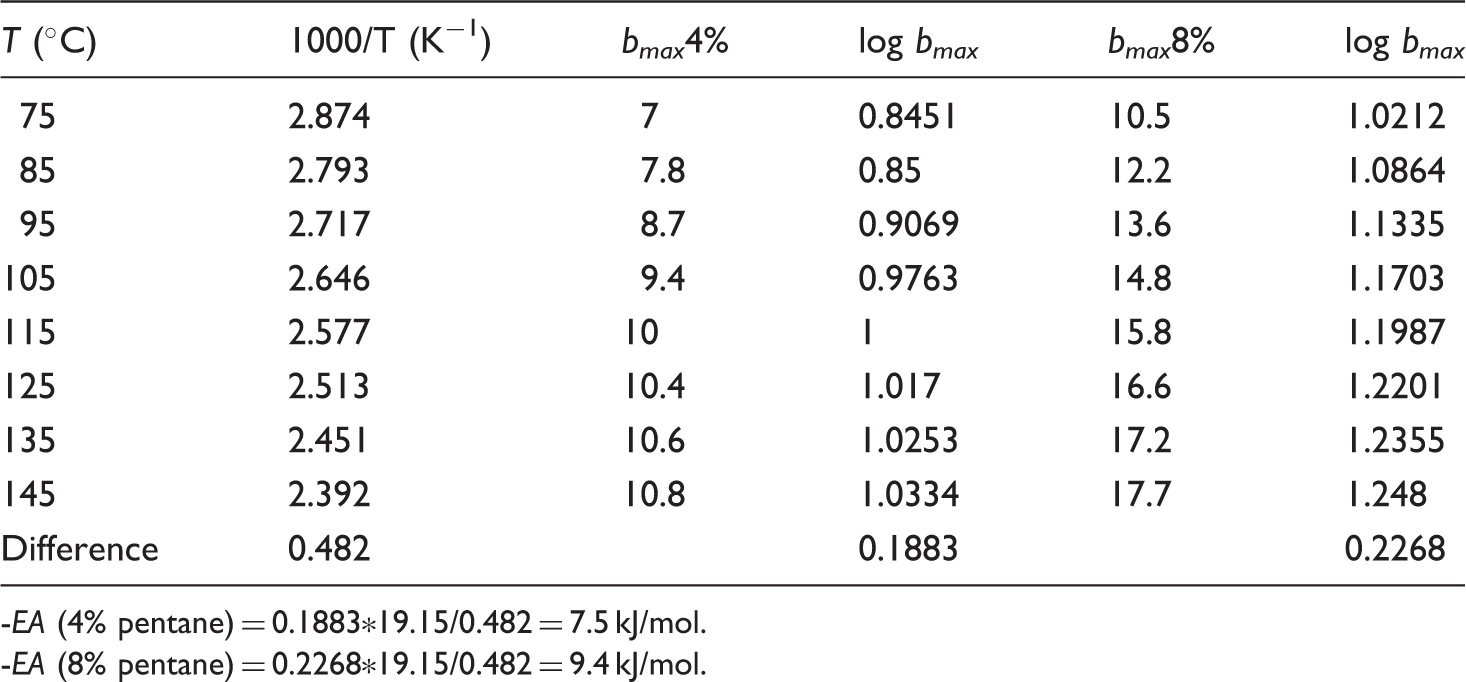
-EA (4% pentane) = 0.1883*19.15/0.482 = 7.5 kJ/mol.
-EA (8% pentane) = 0.2268*19.15/0.482 = 9.4 kJ/mol.
The pentane saturation in PS, with 12% −EA = 7.5*12/4 = 22.5 kJ/mol corresponded with the heat of vaporization Hv = −29 kJ/mol minus the heat or work per mole of the viscoelastic counter forces EA = 6.5 kJ/mol. The activation energies EA 90–200 kJ/mol, derived from the t max dependence on temperature, corresponded with the activation energy of the viscosity of PS loaded with definite amounts of blowing agent of 206 kJ/mol (0% n-pentane), 132 kJ/mol (4% n-pentane), and 90 kJ/mol (8% n-pentane) in Table 4.
For the case of an ideal gas, b
max
could be calculated by

The calculated data were listed in Table 4. Experimental and calculated values of PS–C5H12 and PS–C3H8 were in good agreement. The bad agreement of PS–CO2 was reasonable, when great losses of CO2 were taken into account.
Foaming in aqueous saturated sodium nitrate with vapor pressure p w = 0.75 bar at 110℃
In Figure 6, samples of PS-143E with 5% pentane and different cell structures were foamed in aqueous saturated sodium nitrate with a density of 1.53 g/cm3 at 110℃ and vapor pressure of 0.74 bar.
Expansion b of PS-143E/pentane with 5% pentane and different cellular structure in a saturated solution of sodium nitrate in water with a density of 1.53 g/cm3 at 110℃, p
w
= 0.74 bar.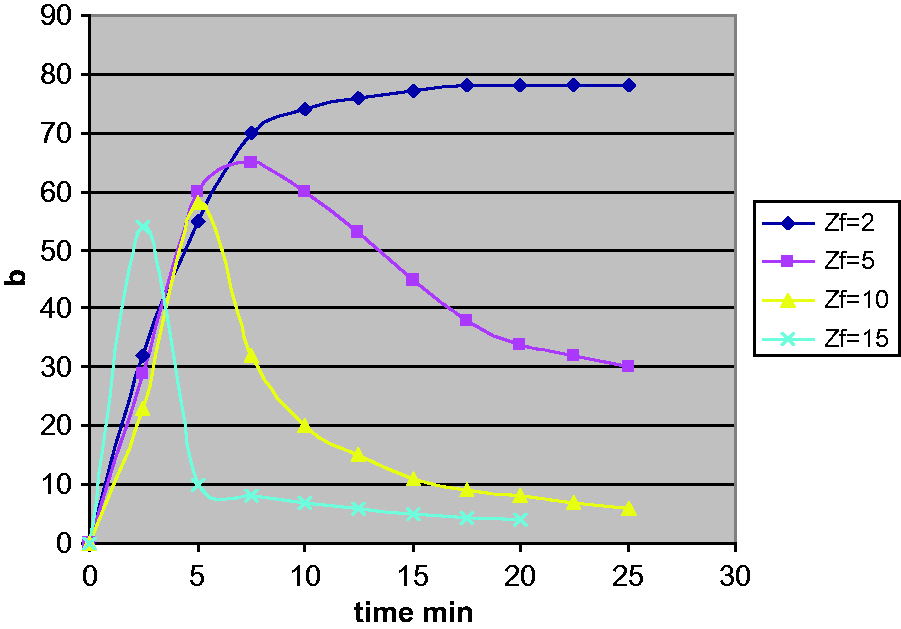
Foaming of 0.1 g PS-143E/pentane with 5% n-pentane and different cellular structure in saturated sodium nitrate water solution at 110℃ and p w = 0.74 bar.
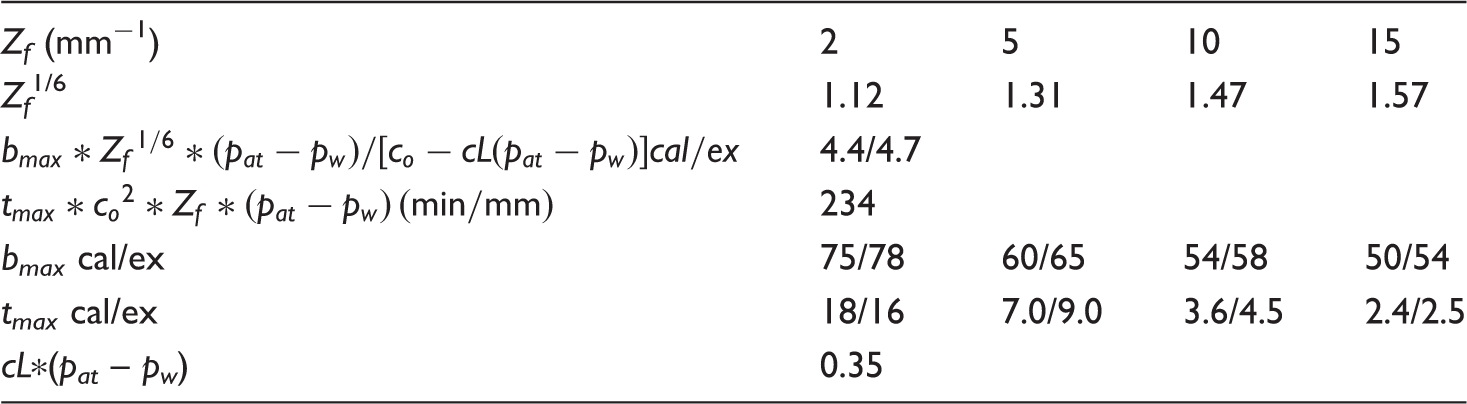
The reduced values allowed the determination of the experimental data of Figure 6, for instance for PS-143E/C5H12, Zf = 2


Foaming in water vapor p w =1 at 100℃
As experiments with the balance allowed only foaming of small specimens, larger samples were expanded in hot water vapor. In Figure 7, the same samples were foamed in water vapor at 100℃ and vapor pressure of 1 bar. In the case of PS–CO2, the expansion curve showed a dependence on the sample size, which could be understood, especially when small samples large losses of carbon dioxide were taken into account.
Expansion b of PS-143E with 5% blowing agent in water at 100℃.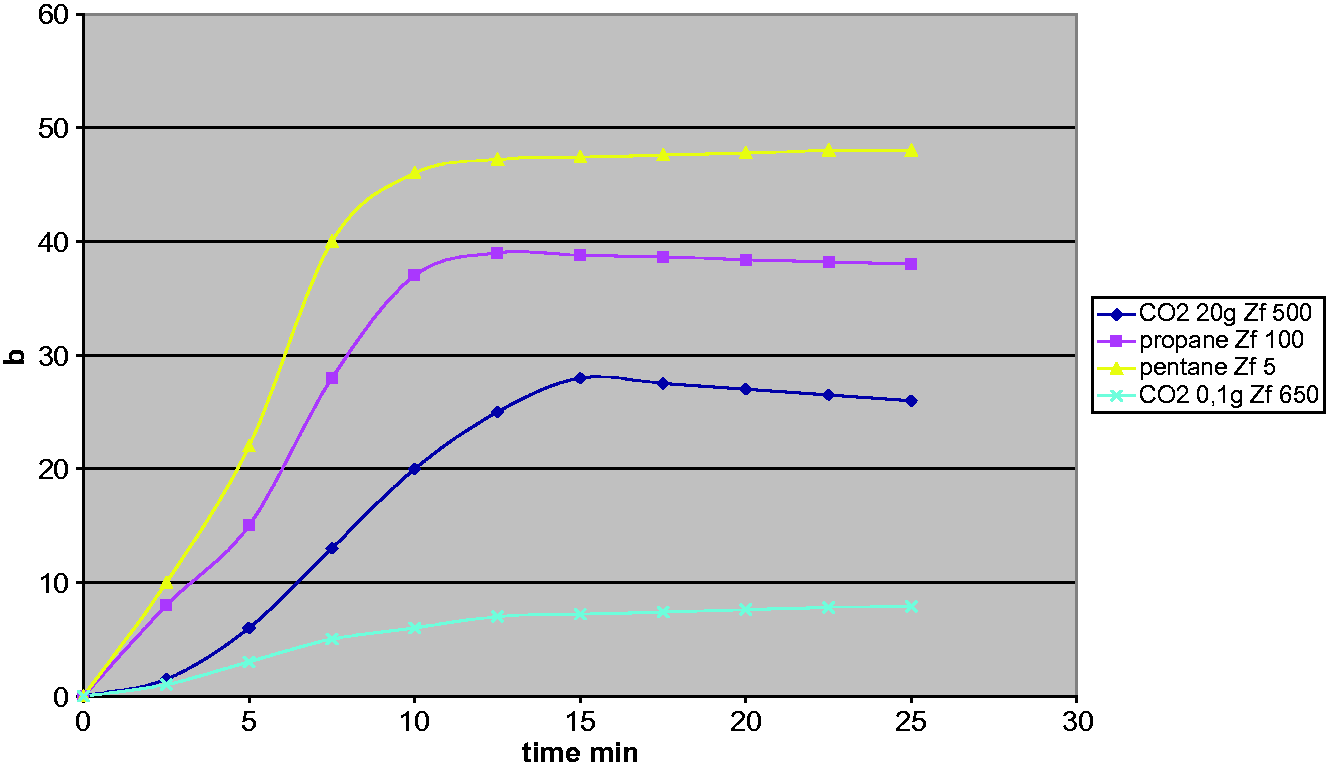
Foaming of PS-143E with 5% blowing agent in water vapor at 100℃.
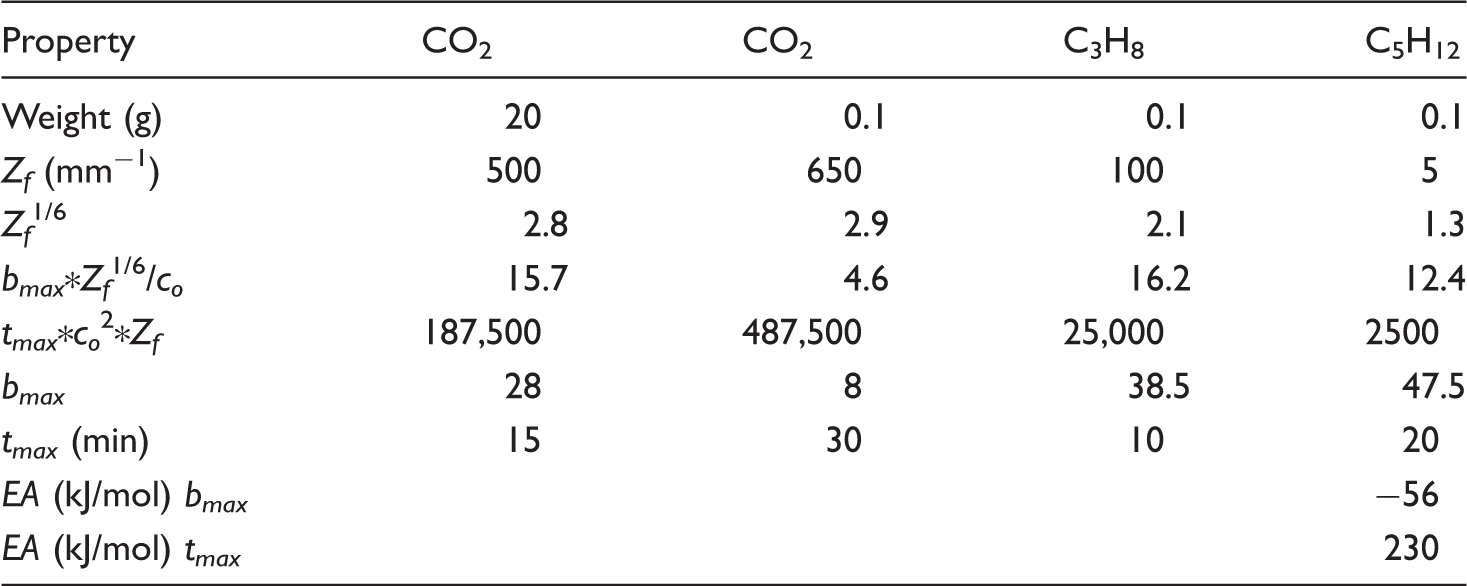
Figure 8(a) shows the surface of the 35 kg/m3 PS-143E/ CO2 foam, which was coated by vaporized coal: about five cells were counted over a distnce of 10 µm corresponding with 500 cells per mm and a cell size of 2000 nm. Figure 8(b) was taken from the same sample using a stereo scan microsonde: about seven cells were counted over a distance of 10 µm, which corresponded with a cell number of 700 and an average cell size of 1400 nm.
According to equation (11), the maximum expansion should reach infinity, when the water vapor pressure rose to 1 bar and was equal to the atmospheric pressure. Only the viscoelastic counter forces limited the expansion. In Table 7, the activation energy −56 kJ/mol derived from the temperature dependence of b max corresponded with the sum of −16 kJ/mol of the heat of vaporization of pentane and −41 kJ/mol of the heat of vaporization of water.
Higher b max was reached, when foaming took place in aqueous salt solutions or in water vapor. This observation was used in extrusion, where higher b max was achieved, when the extruded foam passed a bath of aqueous salt solution or of water glycol mixtures installed just after the die. 28
Shrinkage and orientation
A PS-143E bar was elongated to twice its length at 130℃. Shrinkage of 100% was observed at 140℃ after 1 h. By stretching, the tear strength increased from 38 MPa to 70 MPa.
Samples with cellular structures between Zf = 1 and 16 mm−1 but the same specific volume of 54 cm3/g, which had been manufactured by foaming PS-143E with 5% pentane and different nucleation in water vapor at 100℃, were stored at 110℃ for 40 h. The amount of shrinkage was proportional with the number of cells Zf
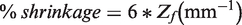
Equation (12) meant that a sample with Zf = 16.7 shrunk to its virgin volume.
The time for 100% shrinkage obeyed

A tear strength of 0.5 MPa was determined for the PS/pentane foam with 40 kg/m3 and Zf = 5. For the PS/CO2 foam with 35 kg/m3 and Zf = 500, a tear strength of 5.5 MPa was measured.
A 10 times higher tear strength should be comprehensive, when stretching under orientation had occurred. A measure of orientation was given by the surface increase of the cellular sample.
The surface O was a function of b max and the cell number Zf. For cubic foam, the surface of one cell was 6a2. When 6a2 = 6 × 10²/Zf2 was multiplied by the numbers of cells in 1 g foam n = Zf3*103*(b max +1)/do, the surface O was obtained.
As most of the cell walls belong to two cells, O was divided by 2

For the case that equation (14) was valid, the PS/CO2 foam with Zf = 700/mm had a 100 times higher surface or a triaxial orientation than the PS/pentane foam. In one direction the orientation was 33, which correlated with an 11 times higher tear strength.
The relevant data were collected in Table 10, displayed later in this article.
Extrusion
Conditions of extrusion.
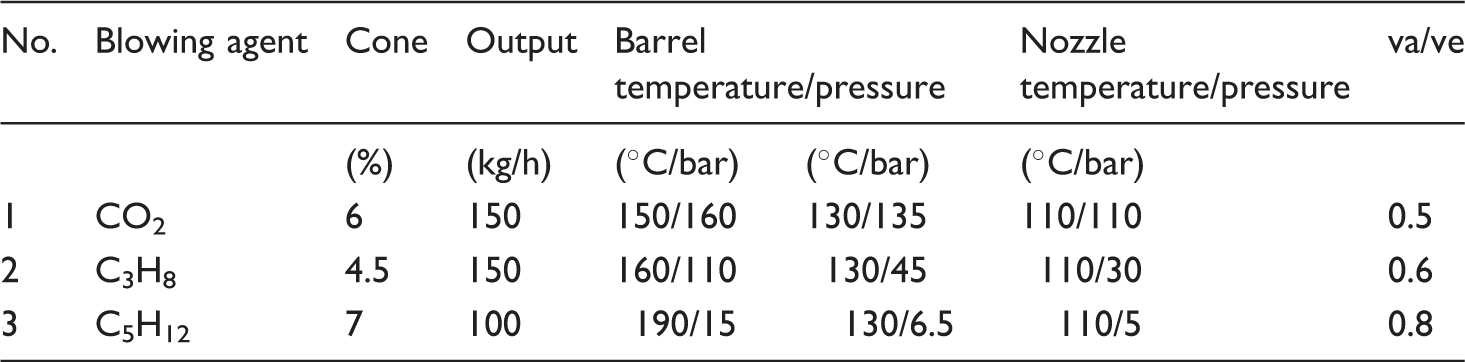
Propane and carbon dioxide exhibited high pressures and, therefore, the extruder had to resist pressures of up to 150 bar in order to avoid foaming in the barrel. The maximum expansion was determined from the density of the foam as well as from the profiles using the following equation

where L
max
/Lo correlated with va/ve, the speed of conveyor carrying the foam divided by the speed of extrusion. va/ve was kept at 0.8, 0.6, and 0.5. Pictures were taken from the profiles in Figure 8. L
max
was the distance from the nozzle to the point of fully expanded foam b
max
in Figure 8. The obtained cellular boards are characterized in Table 9.
Electron microscopy of the cut surface of PS-143E/CO2 with a foam density of 35 kg/m3 derived from a sample previously stored at RT under 7 MPa CO2 pressure and foamed in 100℃ hot water vapor. Cellular structure, density of extruded boards, and b
max
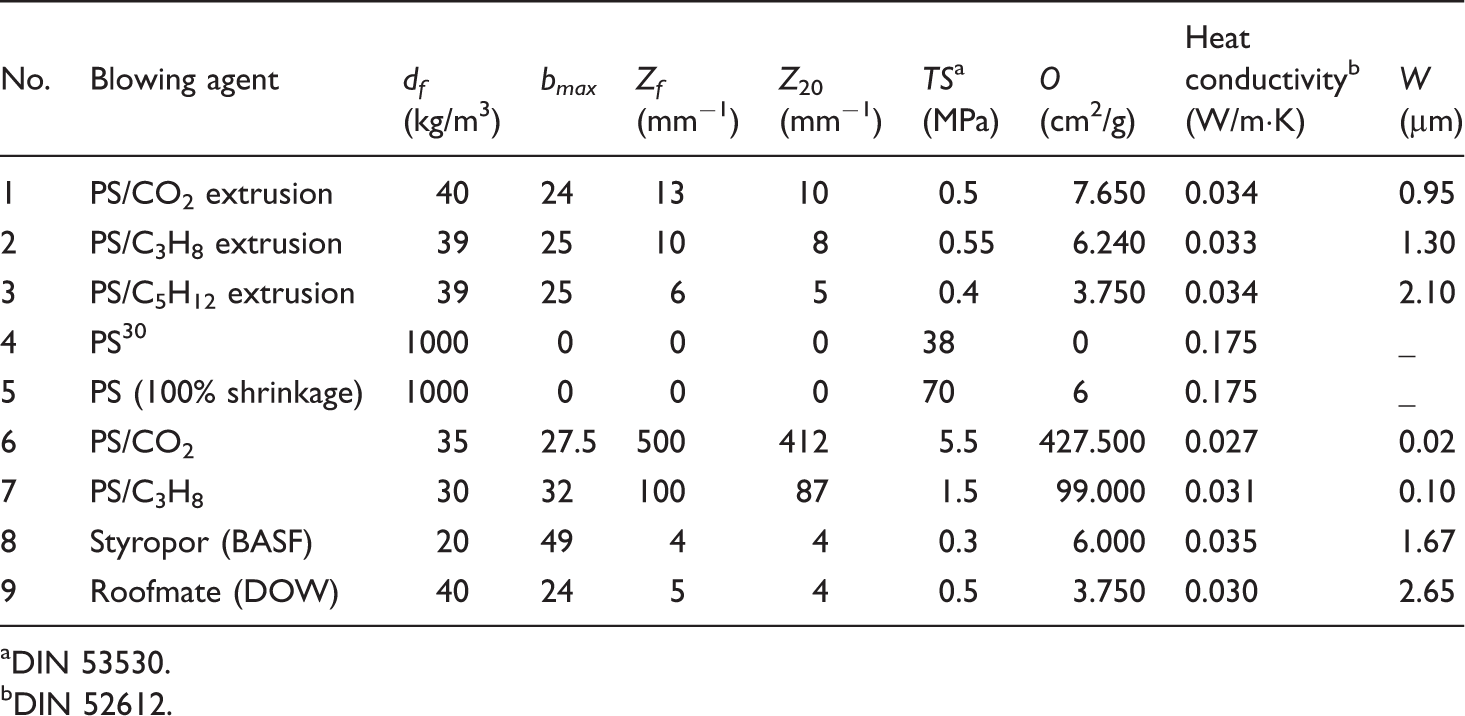
in comparison with data obtained in 110℃ silicon. Properties of PS foams: density df, maximum expansion b
max
, cell structure Z, tear strength TS, surface O, heat conductivity HC, and cell wall thickness W. DIN 53530. DIN 52612.
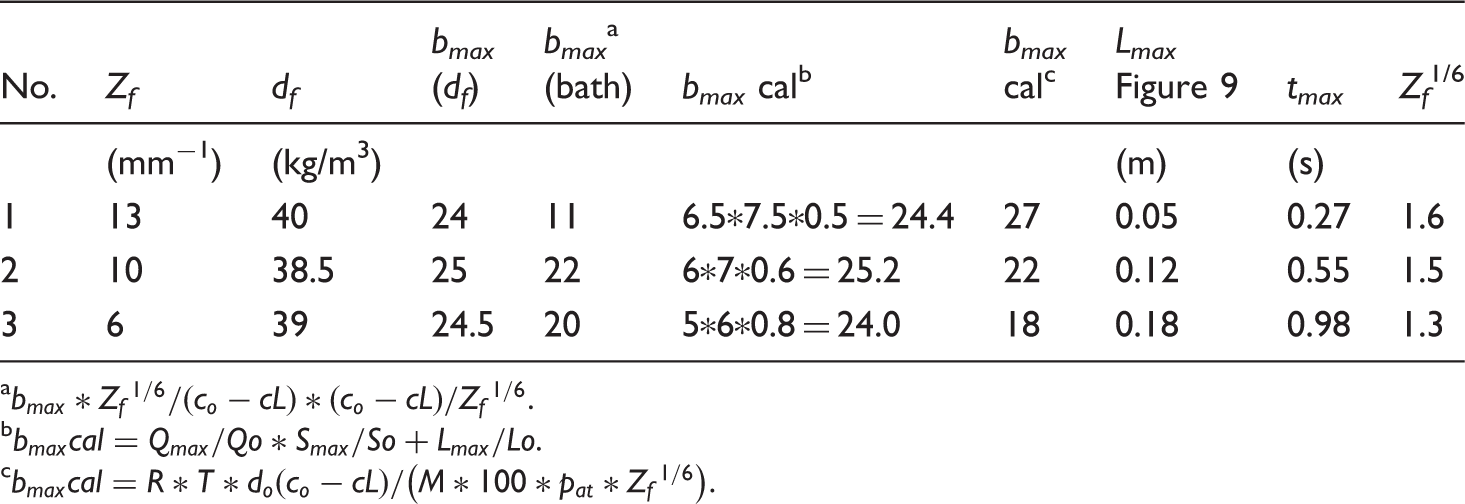
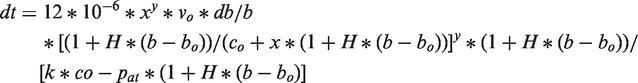
In Table 9, the time until the foam achieved its highest expansion t
max
was calculated using the following equation

The maximum expansion b
max
in the extrusion were compared with those obtained in the silicone bath in Table 9. On average, they were comparable with the exception PS-143E/CO2 caused by loss of blowing agent.
Profiles of the extruded foams comprising PS-142E + 1% talcum with 6% CO2, 4.5% C3H8, and 7% C5H12 material temperature at the nozzle 110℃ (1:1 natural size, 1:0.5 half natural size).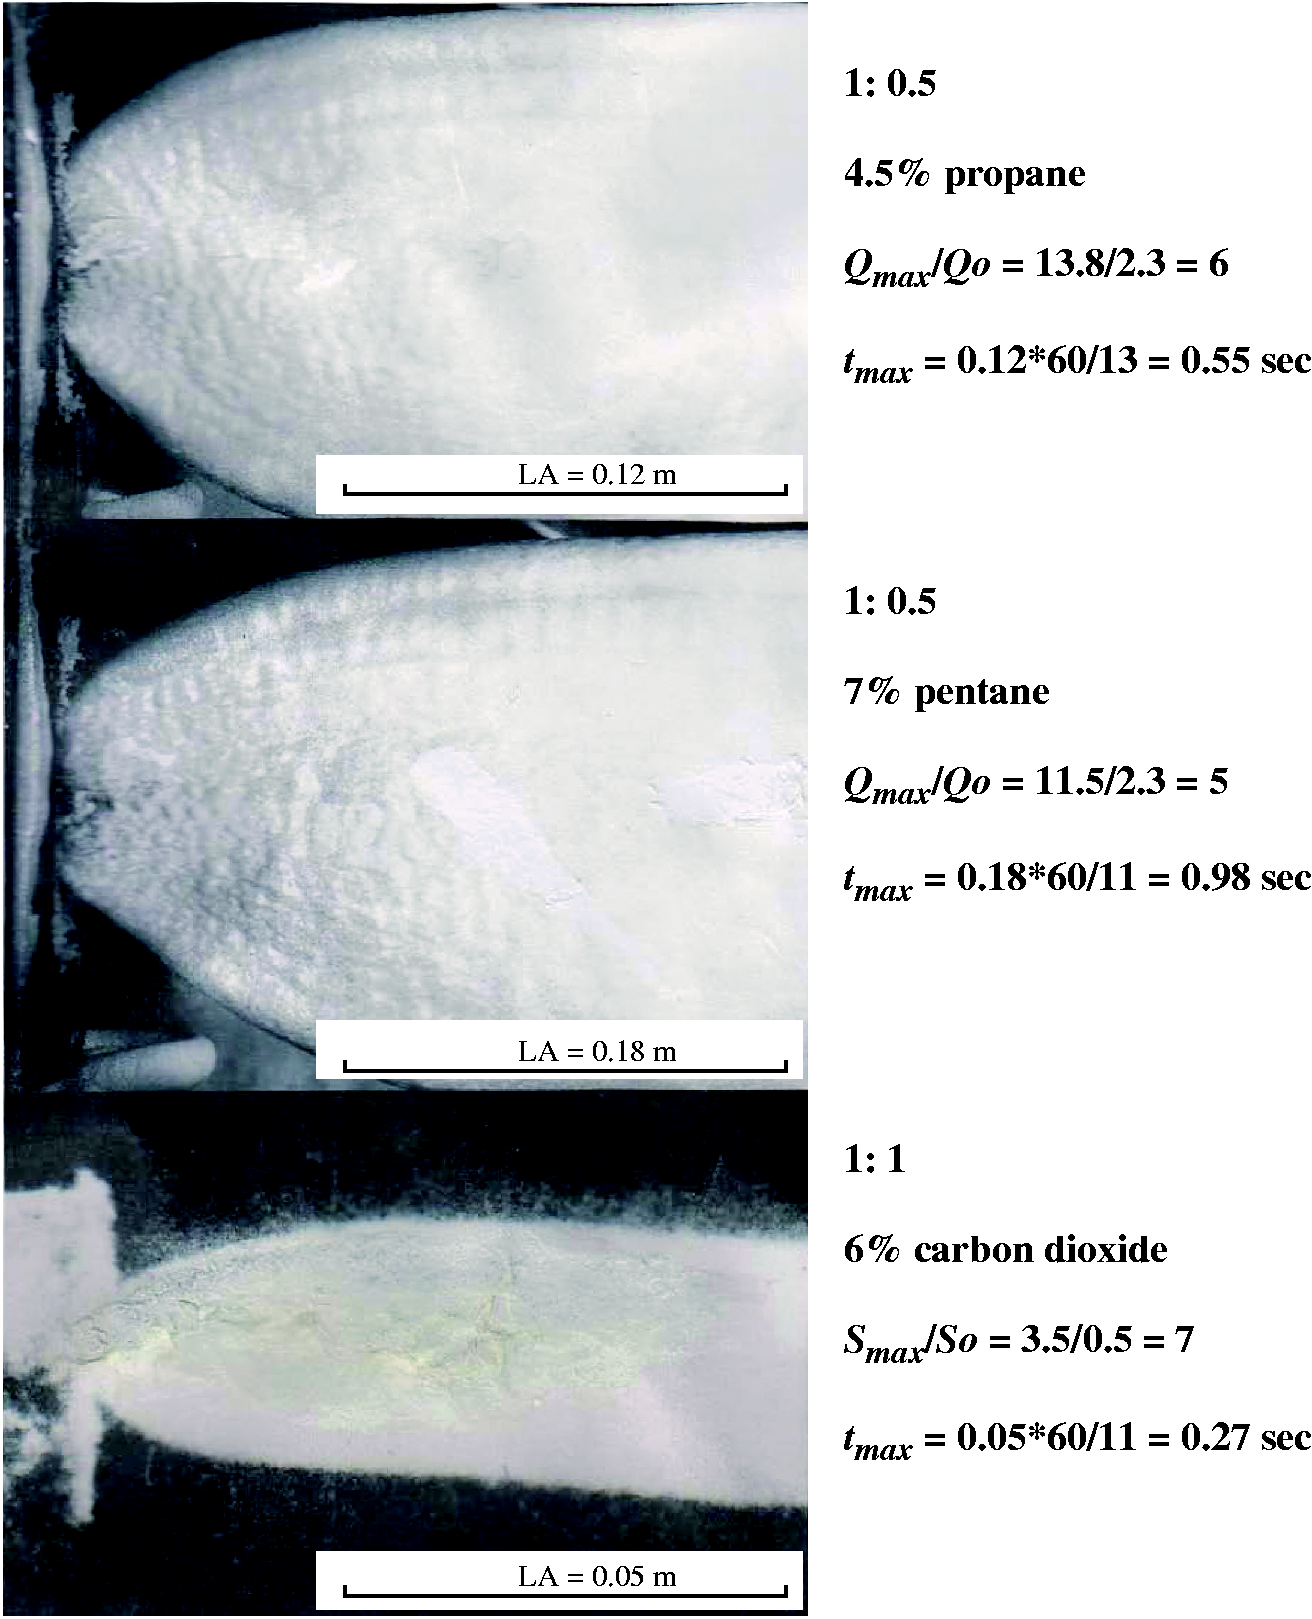
t max (extrusion) was not compared with t max (silicone bath), because no agreement was expected. t max in extrusion was determined by diffusion and t max in silicon bath was determined by heating and diffusion.
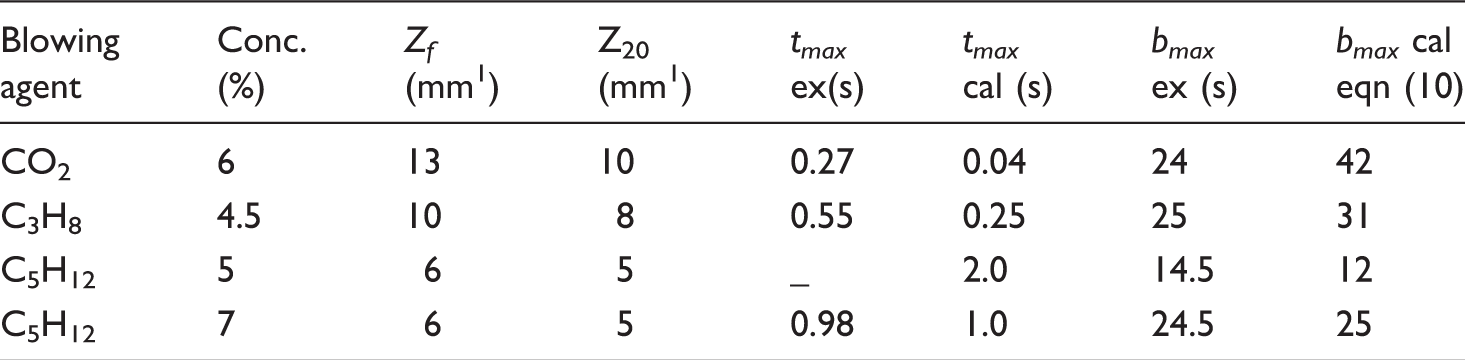
No microcellular foam was obtained by extrusion process. Also, dies with a higher pressure drop would not have improved the results very much as suggested in Rohsenow and Choi. 29 There, a pressure drop of 10 MPa resulted in a cell density of 1010 cells/cm3, which corresponded with a cell number of the unexpanded foam Zo = 100 mm−1, or Zf = 31 at a foam density of 30 kg/m3. The characteristic data of the extruded boards are collected in Table 10.
Characterization of the obtained foams
PS impregnated with carbon dioxide or propane at 7 MPa pressure at RT was foamed to densities of 35 kg/m3 in water vapor under stretching conditions. The cell structure of the cut surface of a 35 kg/m3 foam was in nanoscale and had to be investigated by electron microscopy. Measurements with the air pyknometer confirmed the closed-cell structure.
The low-density microcellular foam sample No. 6 exerted tear strength TS up to 5.5 MPa owing to the high degree of orientation, which correlated with the increase in surface O. The propane-expanded samples with lower cell numbers reached only 1.5 MPa. Nanocellular foams with density df of 35 kg/m3, a cell size of 2 µm, a cell wall thickness W of 0.02 µm or 20 nm, and tear strength of 5.5 MPa showed a reduced heat conductivity of 0.027 W/m.K, which could be explained by the small cell dimension of about 0.2 µm.31–34 The restricted gas movement produced by the Knudsen effect was expected for a mean free path of 0.07 µm at ambient pressure. After foaming, the highly nucleated samples looked like porcelain with a tear strength of 25 MPa.
Model calculation
Model calculations were performed under the assumption of a cubic or spherical cellular structure and viscosity or diffusion determined expansion. The viscosity model took the melt viscosity vo and its change by the solved blowing agent vs= 90*vo/(cl +2)6,5 into account but no influence of the cellular structure Z.
The importance of orientation caused by the cellular structure and expansion was considered by calculating the surface produced by the numbers of cells and by expansion. As known from experiments, the maximum expansion b max , as well as the tear strength TS, were influenced by orientation caused by stretching: b max was reduced by Zf1/6 and the tear strength T increased with increasing Zf. In the diffusion-controlled model, the influence of melt viscosity on foaming was neglected.
Diffusion-controlled foaming
Ramesh et al.
35
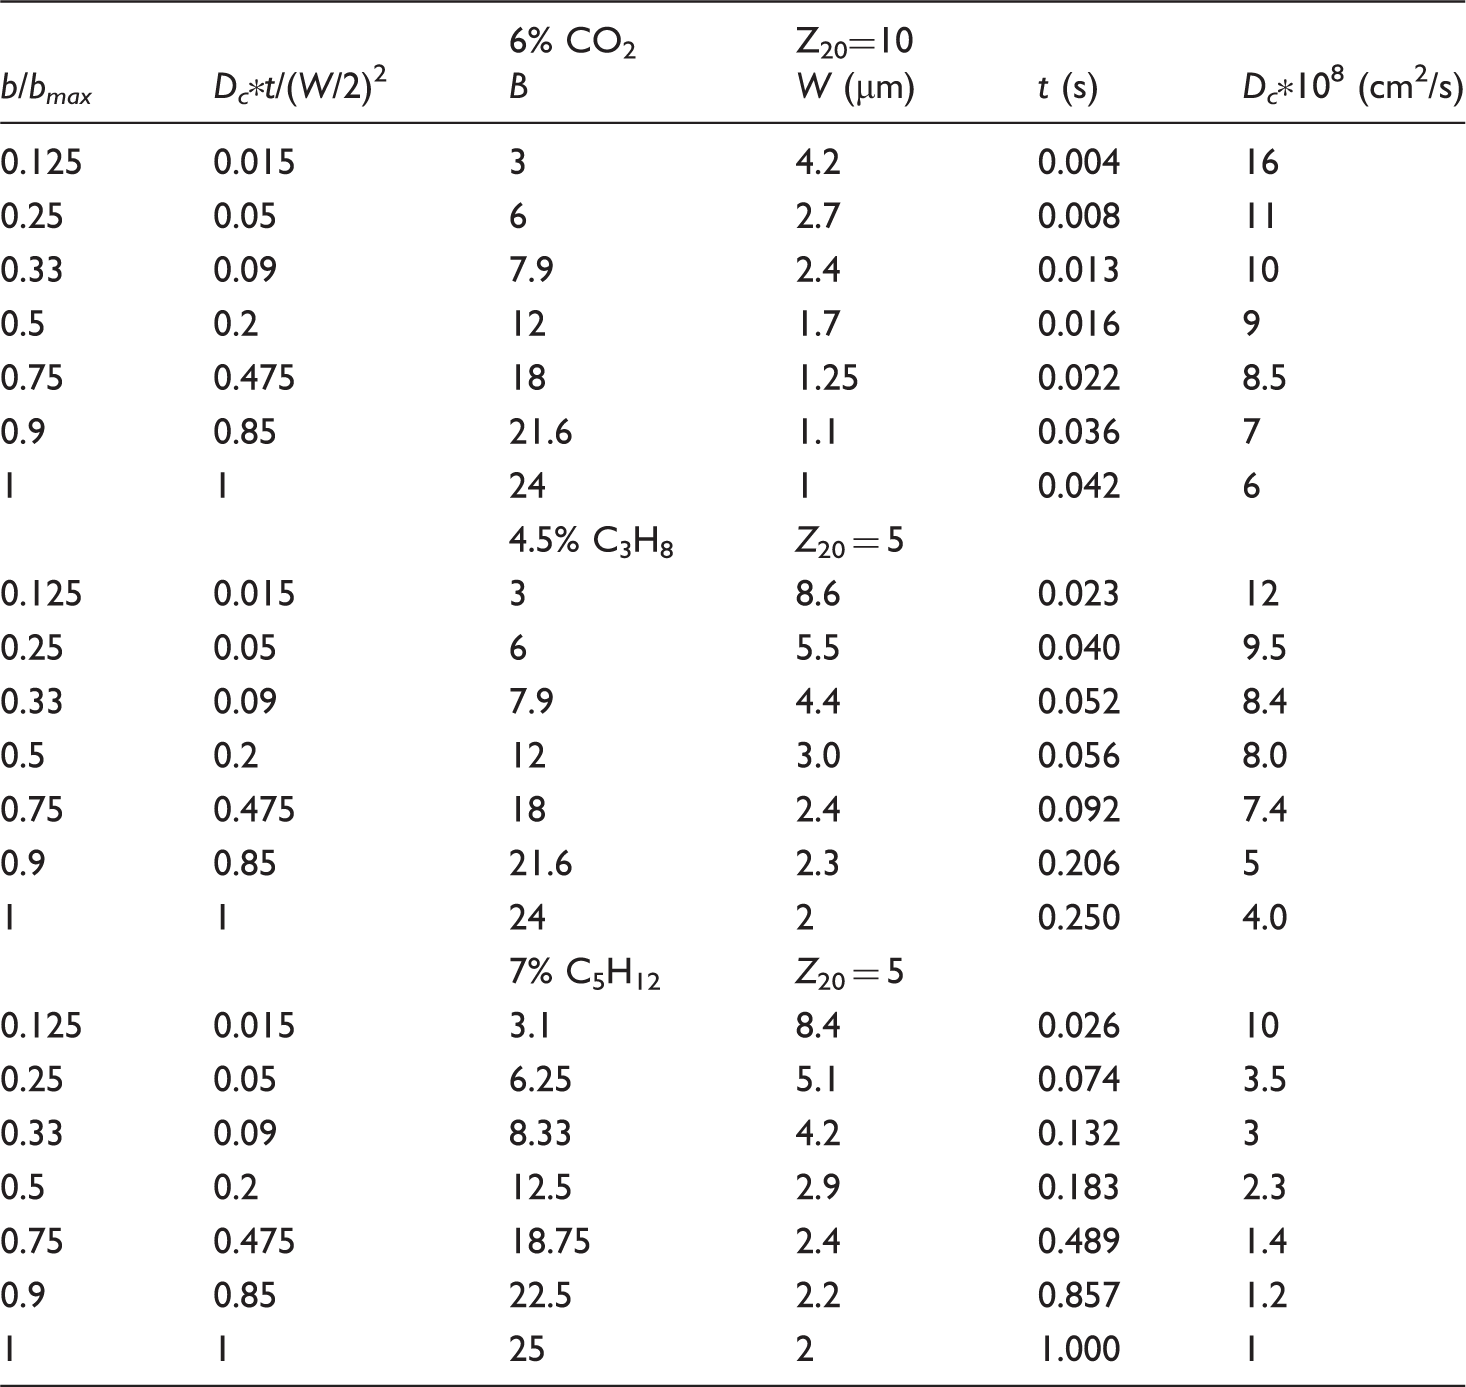
published a numerical and experimental study of bubble growth during the microcellular foaming process. The wall thickness W of cells was calculated dependent on the expansion b and the number of cells at the foam density of 20 kg/m3 Z20 for cubic cell structure in
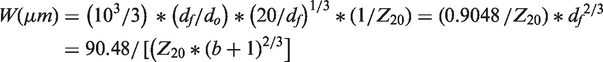
A diffusion-controlled model was set up in equation (18) using a cubic cellular structure and Fick's law for diffusion in plates, of which the graphical solution was given in Crank.
36

Calculation of PS/6% CO2, PS/4.5% C3H8, and PS/7% C5H12 according to the diffusion model.
Comparison of experimental data of extrusion with calculated data according to the diffusion model.
Viscosity-controlled foaming
For spherical foam, a formula for foaming
15
was set up in equation (19). Curves of expansion were calculated for samples of PS/pentane under the influence of melt viscosity vo and amount of blowing agent co. The dimensionless parameters H = k*M*100/(R*T*do) and the Henry constant k bar were taken from Table 2
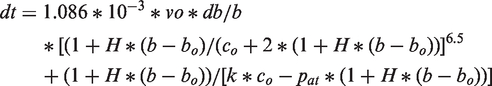
When equation (19) was discussed by differentiation db/dt = 0, the solution for the maximum was
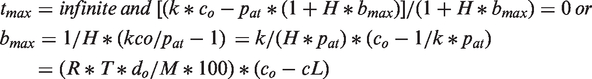
Equation (22) was identical to equation (10).
Experiments in silicone oil derived equation 23, which was valid for foaming PS/C5H12 with PS with different melt viscosities vo at 110℃

Using equation (20), results of some relevance and agreement with foaming in a silicone bath were expected for small samples with low Zf and high heating rate, such as with pentane and Zf = 5. Expansion curves were calculated for PS-143E comprising 5%, 8%, and 10% pentane by introducing H = 0.168, k = 0.74 bar, p
at
= 1 bar, vo = 22 × 109 Poise in an adjustment of equation (20). The integration was performed from bo = 0.015 to b
max
in the time 0 to t
max
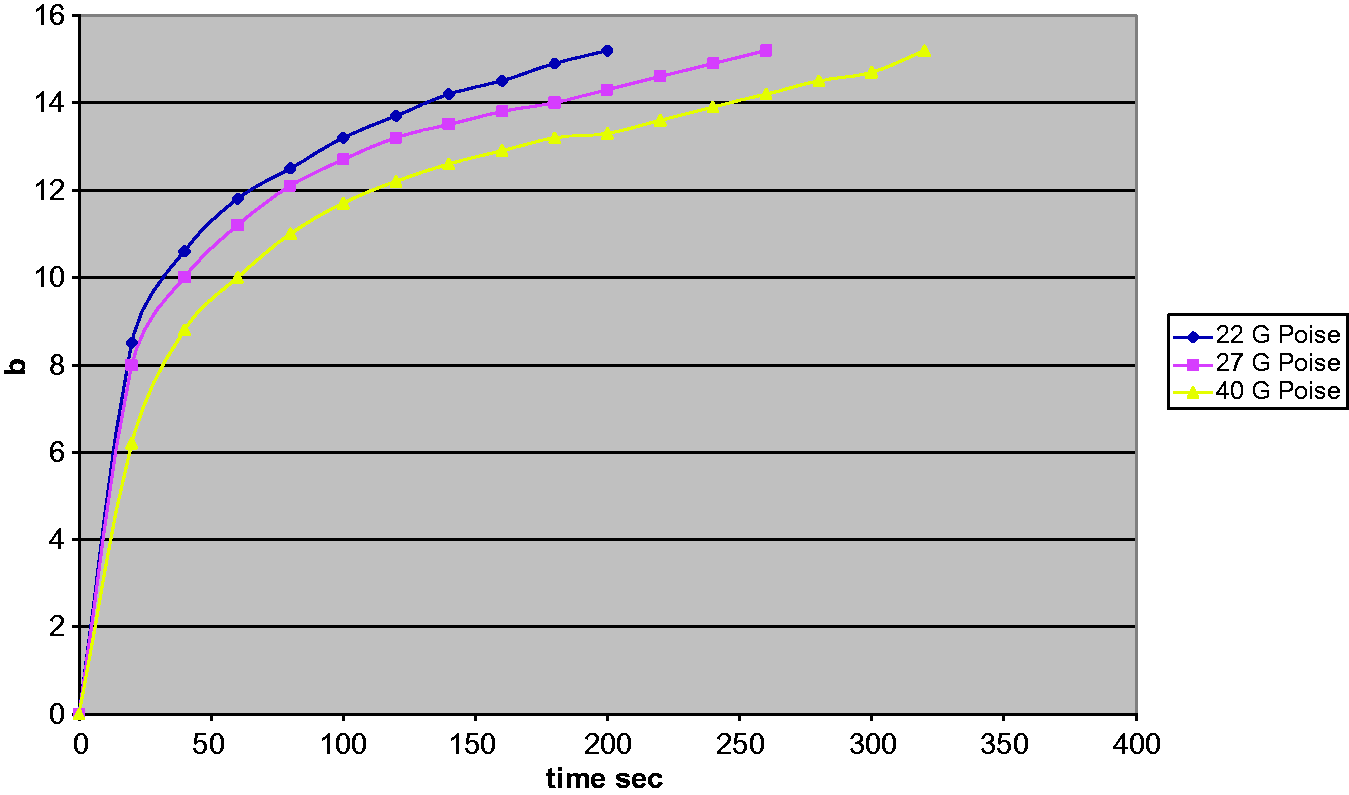
for 110℃ and visualized in Figure 10. The same calculation was performed for different melt viscosities: 143E vo = 22 × 109, PS 1vo = 27 × 109, and 168 N vo = 40 × 109 Poise, keeping the pentane content constant at 5% in Figure 11.
Calculated expansion b of PS with the same viscosity as PS-143E comprising 5%, 8%, and 10% pentane at 110℃ according to the viscosity model with bo = 0.015. Calculated expansion b of PS with different melt viscosities with 5% pentane according to the viscosity model with bo = 0.015.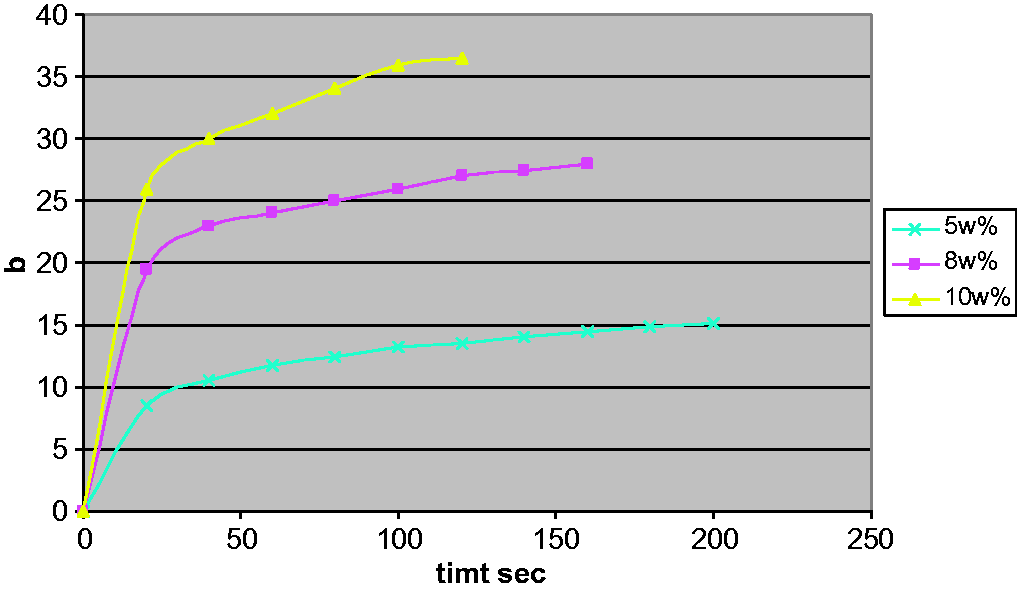
Comparison experimental data of foaming PS-143E/pentane in a silicone bath with calculated data according the viscosity model.
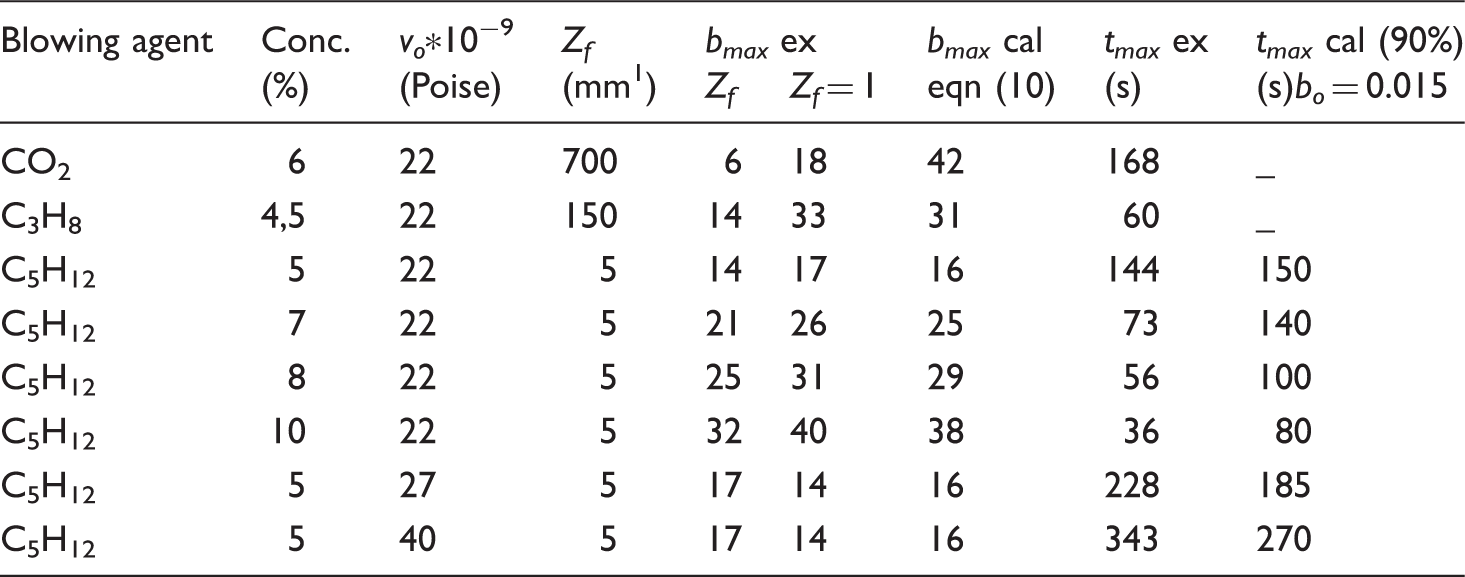
The increase of t max with increasing melt viscosities was expected and was already predicted by the energy of activation for the maximum foaming time, which correlated with 220 kJ/mol, which is the activation energy of the melt viscosity as shown in Table 5.
In the experiment, b max was dependent on Zf1/6. Both models included no influence of Zf on b max , because b max was calculated by the ideal gas equation. In the viscosity-controlled model t max was infinite, the only way to get figures for t max was to determine the time at 90% b max .
In the experiment, t max was proportional to 1/Zf. In the diffusion model t max was proportional to 1/Zf2. Also, shrinkage was proportional to 1/Zf2. The increase of t max with the viscosity of the PS was determined experimentally and was calculated by the viscosity model. In Table 13, experimental data of small samples with high heating rates in silicone oil were compared with those calculated according to the viscosity model.
Conclusion
Of special interest was the production of low-density closed-cell microcellular foam with favored properties of high mechanical properties and low thermal conductivity, which could be realized when PS was impregnated with carbon dioxide or propane at RT, and high pressures near or above the critical pressures. After removal from the pressure vessel nucleation occurred, and assemblies comprising a hole surrounded by a ring of fanned cavities were observed. During foaming, these fanned cavities grew to cells. The foaming in water vapor at 100℃ took place under stretching conditions, therefore very rigid, porcelain-like low density foams of 35 kg/m3 and tear strength of 5.5 MPa were obtained. Owing to the small cell size, the gas movement was restricted and the heat conductivity reduced to 0.027 W/m.K.
In the extrusion process, the condition for high nucleation, at a low temperature of 20℃ and high pressure of 7 MPa, could not be established, and in no case was microcellular low-density foam obtained. The extruded foams with 35 kg/m3 foam density showed a cell diameter of 100 µm, 0.5 MPa tear strength, and 0.035 W/m.K heat conductivity.
Equations were set up for the maximum expansion b
max
and the foaming time t
max
, until the maximum expansion was reached, for foaming in baths

The maximum blowing time t max was in reverse proportional to Zf, but in the diffusion-controlled model t max as well as the maximum time of shrinkage were in reverse proportional with Zf2.
In the diffusion-controlled model, b max was calculated by the ideal gas equation and t max was obtained by applying Fick's law for the diffusion in plates. The calculated data were in agreement with the data from the extrusion process.
When the equation for viscosity-controlled foaming was used, t max for 90% b max could be calculated for small samples with high heating rates. In this model, the influence of the amount of blowing agent and the influence of the melt viscosity vo of PS on t max was correctly reported.
Microcellular foams with desired properties could only be achieved by storing the samples at RT under high pressure followed by foaming in water vapor.
Footnotes
Declaration of Conflicting Interests
The author(s) declared no potential conflicts of interest with respect to the research, authorship, and/or publication of this article.
Funding
The author(s) received no financial support for the research, authorship, and/or publication of this article.