
Abstract
Styrene–ethylene–butylene–styrene and its blends containing 10, 30 and 50 wt% polystyrene were subjected to batch foaming using physical blowing agent carbon dioxide. At higher foaming temperatures (80–110℃), complex viscosity (η*) and storage modulus (E′) were found to control the volume expansion ratio and the shrinkage of foams. For a given composition, optimal volume expansion was achieved at temperatures close to the glass transition temperature (T g ) of the polystyrene phase of that composition, indicating the presence of a complex viscosity window favourable for the foaming process. Blends with 30% and 50% polystyrene content possessed higher values of E′ and η*, and produced stable foams having higher volume expansion ratio, when foamed within their respective η* windows. At a much lower foaming temperature (35℃), polystyrene was found to have a nucleating effect. However, irrespective of rheological properties, all foams showed prominent shrinkage. A higher polystyrene content resulted in a lower volume expansion ratio, as well as shrinkage over a shorter period of time and a greater extent of shrinkage in the same time span. This can be attributed to the selective foaming of the ethylene–butylene phase, hindered by the stiff polystyrene aggregates.
Introduction
Foaming of thermoplastic elastomers (TPEs) is an area of immense interest, but having limited understanding. The replacement of any solid polymer with its foamed counterparts leads to reduced material and fuel consumption, and also expands the possibility of property modification for new applications. In the present world of increased environmental awareness, TPEs are a much sought after class of materials that possess the properties of thermoset rubbers, yet can be processed like thermoplastics. They, therefore, bridge the gap between conventional thermoset rubbers and thermoplastics, and address the problem of environmental concern which thermoset rubbers face due to their non-recyclability. Foaming, would thus give a further boost to sustainability, by lowering the material consumption.
Amongst the TPEs, styrene–butadiene–styrene (SBS) and its hydrogenated form styrene–ethylene–butylene–styrene (SEBS) are of great commercial importance. SBS accounts for about 50% of the global consumption of TPEs. 1 SEBS is prepared by selective hydrogenation of the butadiene mid-block of SBS. Since the elastomeric mid-block of SEBS is saturated, compared to SBS, SEBS shows a much superior resistance to weathering and a higher thermal stability, resulting in superior processability at higher temperatures. 2
In spite of its advantages over vulcanized rubbers, SEBS is seldom used as a neat polymer. 3 This is because its creep resistance, permanent set and compression set resistance are inferior to those of cured rubbers. One method of enhancing the properties of SEBS is by blending with homopolymers. 4 When the added homopolymer is polystyrene, control of morphology and properties may be achieved without the use of an external compatibilizer. Blends of SEBS and PS have potential for applications like permeable containers or breathable packaging, in which SEBS can facilitate transport of gases. 5 Foaming of such blends would help in lowering the weight and cost.
The limited understanding of the foaming behaviour of TPEs arises out of their complex microstructure. TPEs comprise two phases, the thermoplastic phase and the rubber phase, the phases having widely different viscoelasticities. It is probably because of this reason that there is scanty literature on the foaming of SEBS/PS blends.
The dynamic rheological properties of a polymeric material have a profound influence on its foaming behaviour. Zhang et al. 6 investigated the foaming behaviour of various grades of ethylene-co-octene (EOC) and polypropylene (PP). They found that higher complex viscosities (η*) resulted in increased melt expansion. Bhattacharya et al., 7 in their studies on batch foaming of high melt strength PP nanocomposites, have proposed that the melt viscosity should be sufficiently high to restrict cell size and prevent cell coalescence. However, it should be sufficiently low for the survival and growth of the nucleated cells. Gendron and Vachon 8 conducted studies on foaming and cross-linking of EOC in injection moulding. According to them, the complex viscosity can be linked to the onset of bubble growth, i.e. the force against which the bubbles have to fight in order to make their growth successful. A resin which is too viscous makes this task difficult. On the other hand, the polymer should exhibit elastic properties in order to sustain the growing cells for a stable morphology. Gunkel et al., 9 in their studies on the foaming behaviour of PP/EOC blends, have shown that there is an optimal complex viscosity ‘window’ for achieving a homogeneous and fine cell structure of foams. Sharudin and Ohshima 10 have established the importance of storage modulus in the foamability of SEBS and its blends with PS. Fan et al., 11 in their studies on the extrusion foaming of poly(ethylene terephthalate) have shown that lower values of tan δ and higher values of elasticity result in closed-cell foams with lower density.
The morphological properties of a polymeric material also largely influence its foaming behaviour. In general, amorphous materials have better foamability than semi-crystalline materials. The presence of heterogeneous nucleating agents results in increased cell density and hence improvement of foaming behaviour. According to Wang et al., 12 the presence of particles induces a local stress variation in polymer/gas solutions, thereby reducing the critical bubble radius according to the classical nucleation theory, 13 which results in lowering of the energy barrier for cell nucleation. Heterogeneous nucleation is observed not only in filled polymers, but also in polymer blends, in which one of the components serves as the nucleating agent.14,15 The efficiency of heterogeneous nucleation in blends and filled polymers depends on the quality of dispersion.
The morphological and rheological properties of a polymeric material are intimately related, both having a profound influence on foaming behaviour. Maani et al. 16 conducted studies on the foaming behaviour of thermoplastic olefin blends (TPOs). They found that compatibilization resulted in a finer blend morphology. Compatibilized blends were also found to have higher values of complex viscosity and storage modulus, as compared to uncompatibilized blends. Kim et al., 14 in their studies on the foaming behaviour of TPOs found that the cell density was maximum at an optimal size of the dispersed elastomer. This optimal size could be achieved by varying the viscosity ratio between the blend components. Other research groups,7,10,17 in their studies on foaming, have also reported the influence of morphology on the rheological properties of polymeric materials.
In this paper, the foaming behaviour of SEBS/PS blends has been systematically analysed with respect to dynamic rheological properties. An attempt has been made to relate the rheological properties and foamability to the morphological characteristics. Focus is on the study of foam shrinkage, so as to produce stable foams with appreciable volume expansion. Also, this is the first work to report the nucleating effect of PS at lower foaming temperatures. The paper is expected to provide guidelines for design of the foaming process of TPE-based materials.
Experimental
Raw materials
SEBS (Kraton G1643 M, reported to have 20 wt% styrene blocks) of Kraton Polymers India and PS (SC202EF) of Supreme Petrochemicals India were used in this study. SEBS and PS were found to have MFI values of 17.95 g/10 min (230℃, 2.16 kg) and 5.17 g/10 min (200℃, 5 kg), respectively.
Melt state rheological characterization of SEBS and PS
Melt state dynamic rheological properties of SEBS and PS were studied using a rotational rheometer with parallel plate geometry (Anton Paar MCR 302, P-ETD 400), having 25 mm plate diameter. One mm thick compression moulded discs were used for studies. These discs were prepared using a temperature of 210℃ and pressure of 15,000 lbf for 5 min. Frequency sweep in the range 0.01–100 rad/s was carried out at 200℃, using a strain of 0.5%, after determination of linear viscoelastic (LVE) region at the same temperature. LVE was determined by carrying out amplitude sweep at a frequency of 10 rad/s.
Blend sample preparation
T g values as determined from DMA studies.
DMA studies
The DMA studies were conducted using a Q800 Dynamic Mechanical Analyser of TA Instruments. Temperature sweep in the range –60℃ to 120℃ was carried out at a frequency of 1 Hz, using a strain of 0.057% and a temperature ramp of 5℃/ min. From the experimental values of storage modulus (E′) and loss modulus (E′′) obtained experimentally, complex viscosity (η*) was calculated using the following equations:18,19


Value of ν for calculations was taken as 0.5 (typical value for most polymers).
Batch foaming
Pressure quench batch foaming of the moulded specimens of SEBS and the blends was carried out in a high pressure autoclave by gas saturation at the desired foaming temperature and a pressure of 50 bar for 24 h, followed by depressurization in approximately 25 s. Foaming temperatures of 110℃, 100℃, 90℃, 80℃ and 35℃ were used for the study. Foaming temperatures of 110℃ and 100℃ were chosen to study the foaming behaviour at temperatures close to the T g 's of the PS phase of SEBS-30PS and SEBS-50PS, as determined from extrapolated onset of storage modulus drop (ASTM E1640 - 13) in the DMA studies. Similarly, foaming temperatures of 90℃ and 80℃ were selected as these temperatures were close to the glass transition temperatures (T g ) of the PS phase of SEBS-10PS and SEBS, respectively. Foaming was conducted at 35℃, a temperature close to the ambient temperature, in order to see whether the elastomer phase of SEBS and the blends can be selectively foamed at a temperature higher than the T g of the ethylene–butylene phase but lower than that of the PS phase, and also to see whether PS shows any nucleating effect under such conditions.
To gain a better understanding of the foaming temperature window, as explained subsequently, SEBS-50PS was also foamed at 98℃, 99℃, 112℃ and 113℃.
Shrinkage of foams with time
The shrinkage of the foams was measured by determining the decrease in volume expansion ratio with time. Volume expansion ratio (VE) was determined from density measurements, as described in literature.
14
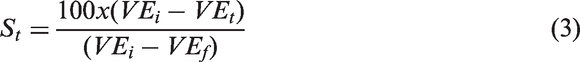
A comparison of the shrinkage behaviour of the different compositions was made by comparing the values of S20, S
x
and t
f
. S20 and S
x
were calculated using the following equation:
SEM studies of blends
Samples of SEBS, the blends and foams were cryo-fractured inside liquid nitrogen, carbon-coated and subjected to SEM studies in back-scattered electron imaging mode, using a FEI Quanta 200 instrument, so as to get a contrast based on the difference in chemical composition.
Results and discussion
Melt state rheological characterization of SEBS and PS
Figure 1 shows the frequency dependence of the complex viscosity of SEBS and PS. SEBS shows rapid shear thinning even in the low-frequency region, unlike PS, which shows a Newtonian Plateau at low frequencies. As compared to PS, SEBS has much higher values of complex viscosity at lower frequencies. However, at frequencies in the range of 50–100 rad/s, which is fairly representative of the shear rate range used in conventional extrusion process,14,20,21 the viscosity values are comparable. This indicates that a good dispersion of phase-separated PS aggregates (observed later in the SEM studies) is expected in blends.
Complex viscosity curves of SEBS and PS.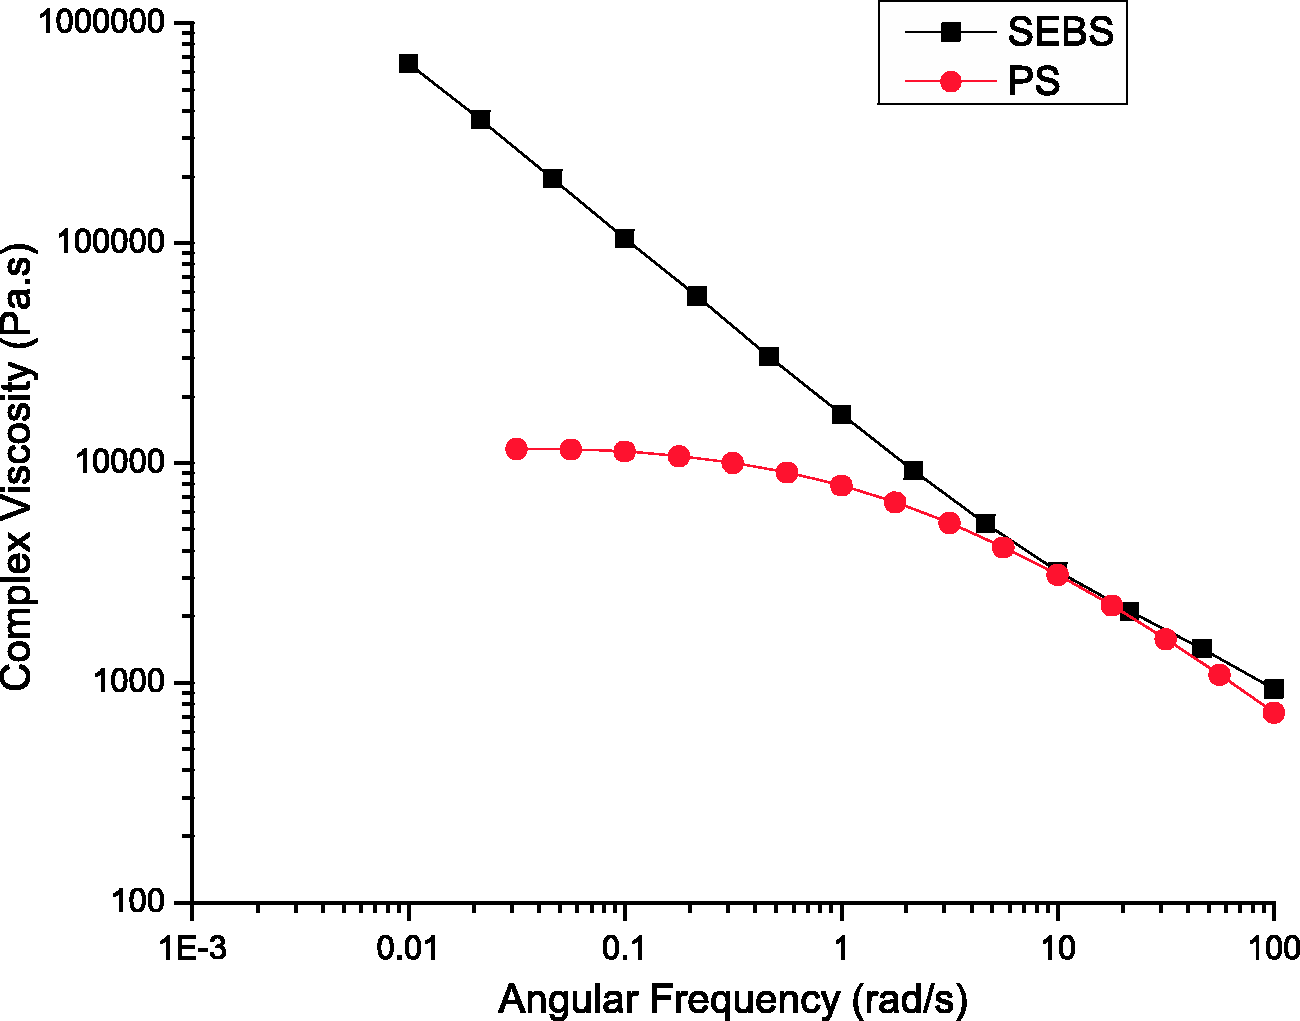
SEM studies of SEBS and blends
Figure 2 shows the fractured-surface SEM images of SEBS and the blends In the SEM image of SEBS (Figure 2(a)), domains of PS are not visible at the magnification used for studies. Figure 2(b) shows the morphology of SEBS-10PS.The PS phase is visible as whitish nanometer-sized particles, as well as a small number of micrometer-sized particles. The fact that nanometer-sized particles can be observed at the same magnification at which styrene domains of SEBS were not visible indicates an increase in domain size. A portion of the added PS has also phase separated forming micrometer-sized aggregates. Thus, the added PS is partially miscible in the styrene blocks of SEBS. Increase in PS content of blend results in further increase in domain size and an increase in the number of micrometer-sized aggregates, as shown in Figure 2(c) and (d). In SEBS-50PS, phase-separated PS is present as dispersed aggregates and there is also a certain extent of co-continuity (Figure 2(d)). Such increase in domain size and the formation of phase-separated aggregates of PS have been earlier reported in literature.4,10
SEM images at 10K magnification of (a) SEBS, (b) SEBS-10PS, (c) SEBS-30PS, (d) SEBS-50PS.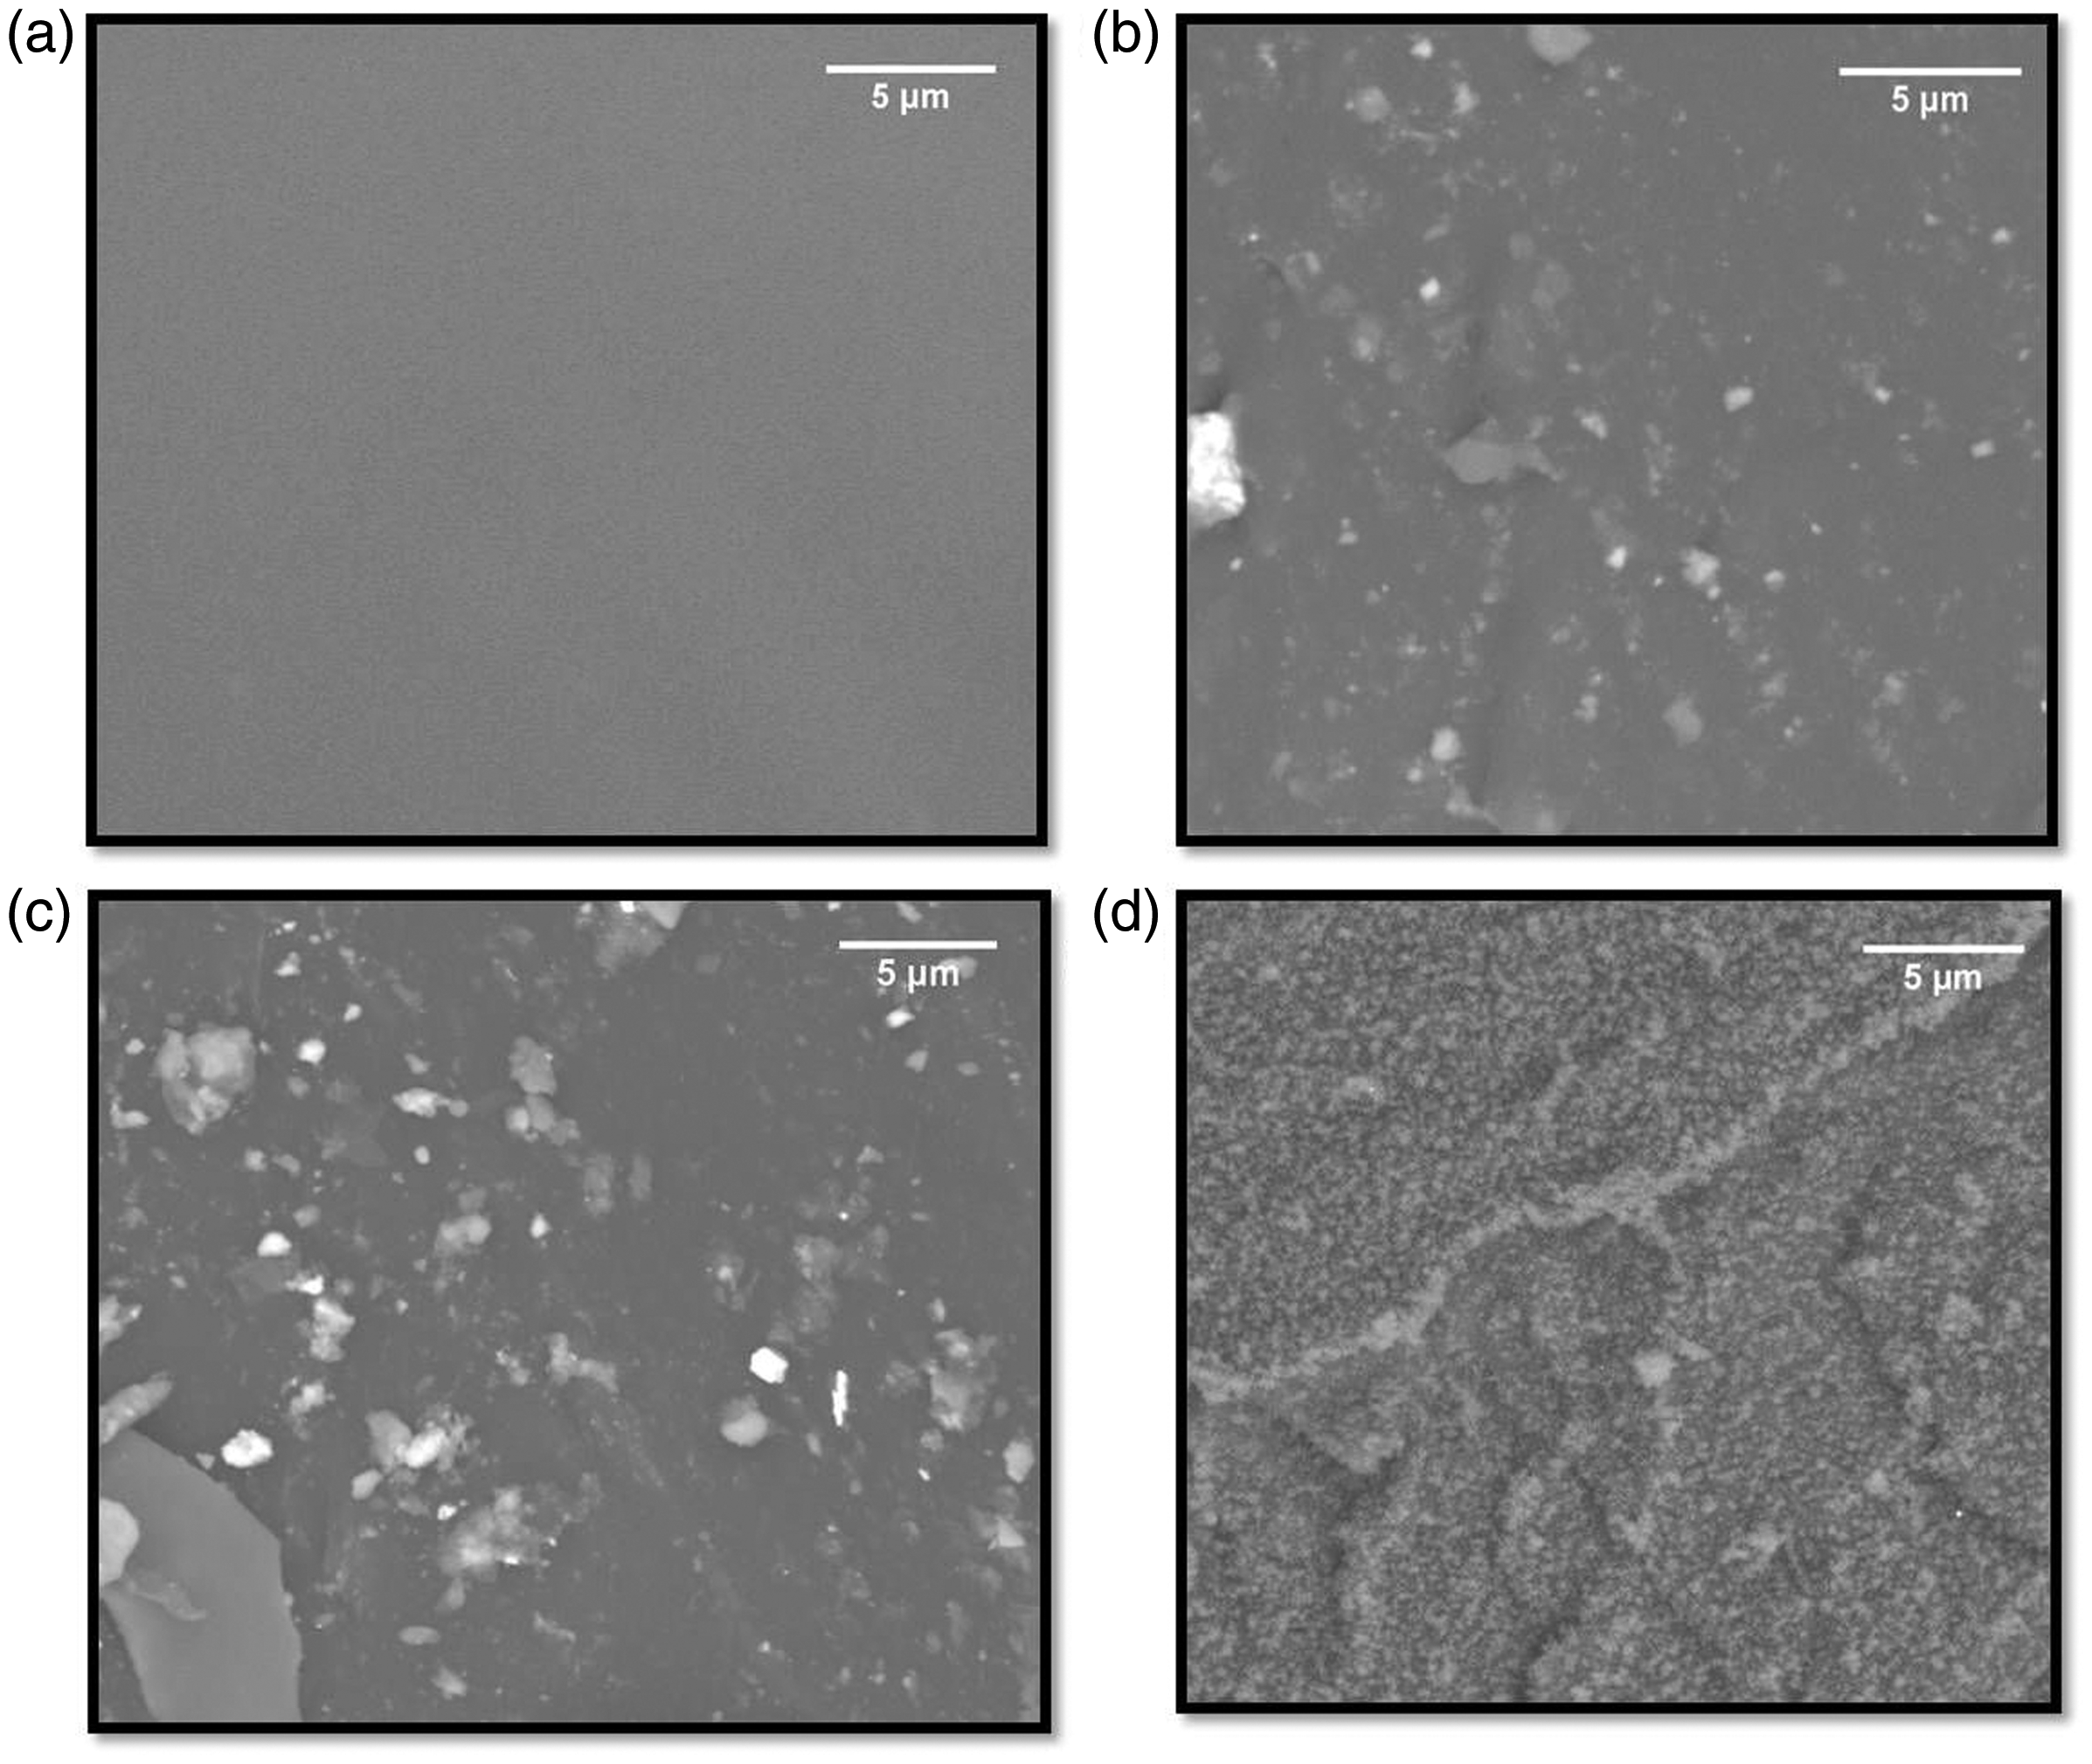
DMA studies
Figure 3(a) and (b) shows the temperature dependence of storage modulus (E′) and loss modulus (E′′) of SEBS, PS and the blends. As expected, PS has higher E′ than SEBS and all the blends. SEBS-10PS has lower E′ than SEBS at temperatures lower than 97℃. This may be attributed to the larger domain size.
10
The unique features (physical performance similar to that of cured rubbers at lower temperatures) of block copolymer type of TPEs are a consequence of microphase separation of the immiscible block components, in which the dimensions of the microphases are of the order of dimensions of the polymer molecules. The microphases form a highly organized domain morphology, which has a profound influence on the viscoelastic properties of the TPEs.2,3 Thus, a change in domain size adversely affects the unique features arising out of the inherent morphology of SEBS, which results in lower rheological properties of SEBS-10PS at lower temperatures. At higher temperatures, when the microdomains soften and the polymer flows like a thermoplastic, rheological properties are governed by the styrene content, irrespective of the morphology at lower temperatures. Thus, at higher temperatures ( >97℃), E′ values of SEBS-10PS are greater than those of SEBS. Further increase in PS content (SEBS-30PS and SEBS-50PS) results in increase in E′ over the entire range of temperature used for study. This is possibly due to the over-riding effect of the phase-separated stiff PS aggregates.
Temperature dependence of (a) E′ and (b) E′′.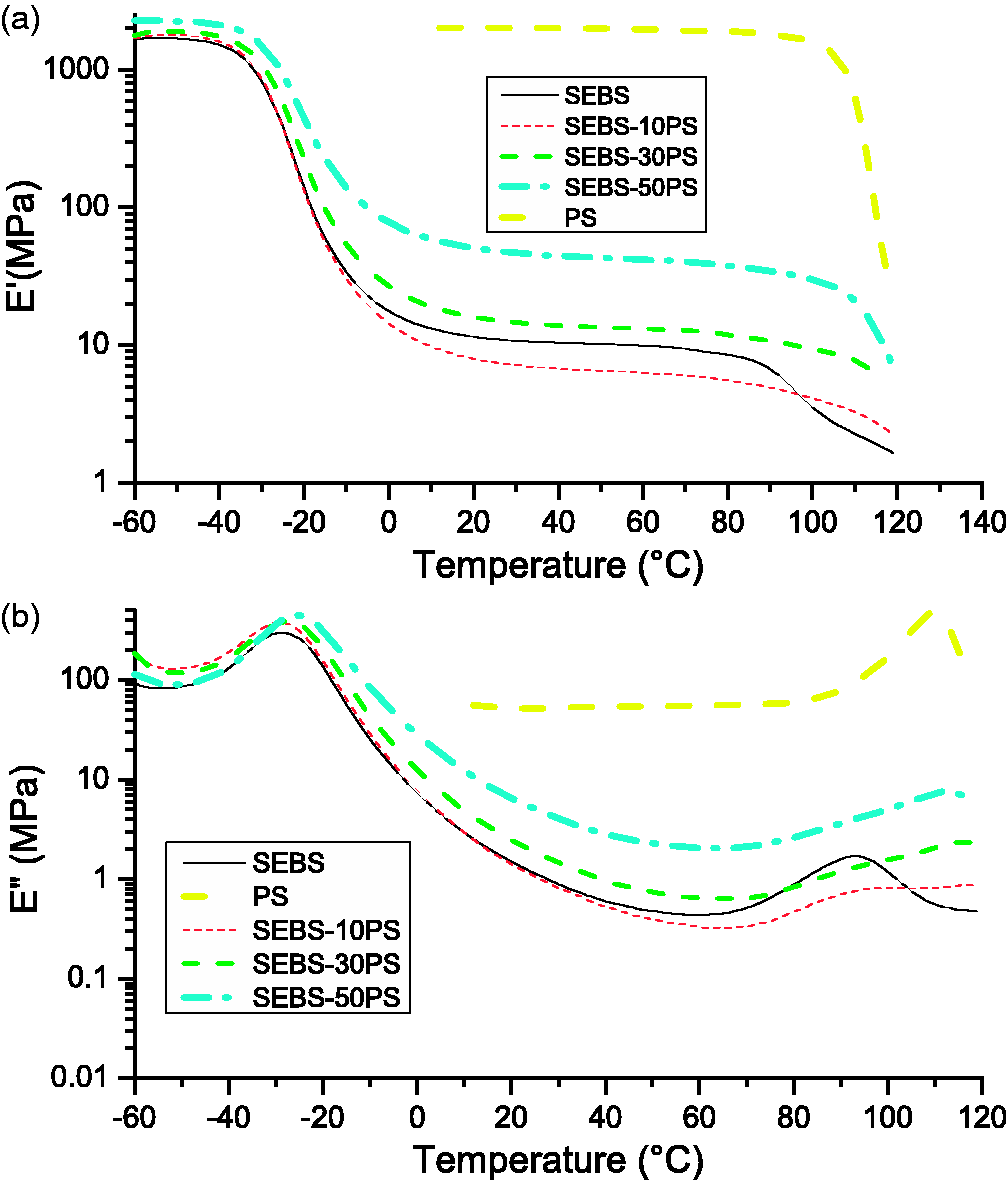
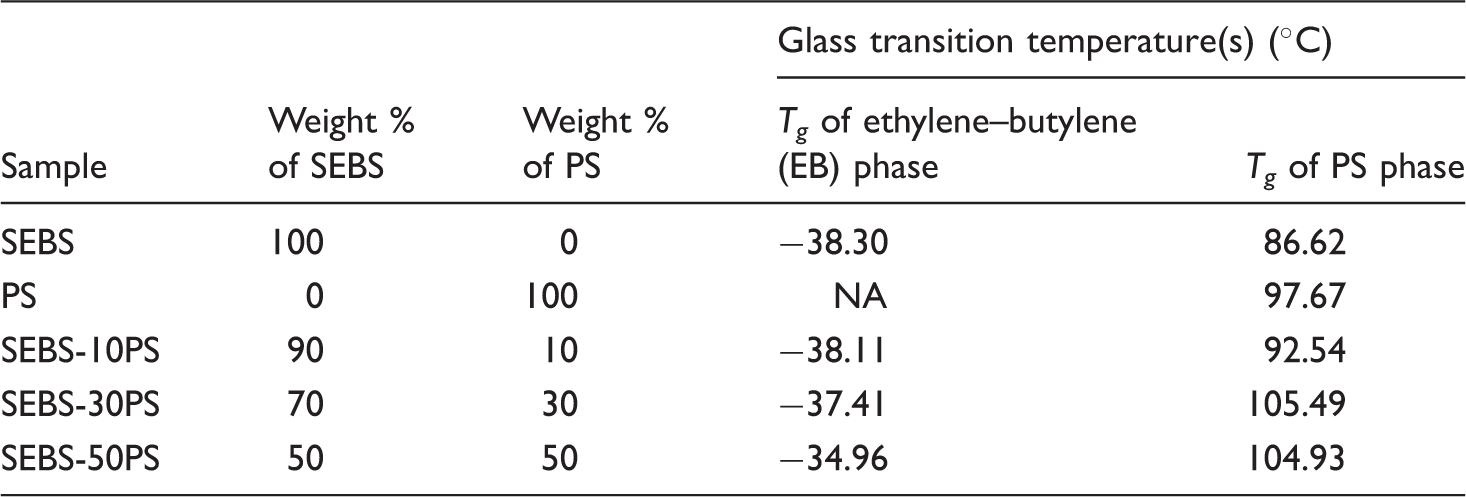
Table 1 shows the T g values of SEBS, PS and the blends, as determined from extrapolated onset of storage modulus drop. The T g , E′ and η* values obtained in DMA studies have been used to analyse the foaming behaviour at different temperatures subsequently.
Shrinkage of Foams with Time
Figure 4 shows the change in VE of the foams with time, when foaming was conducted at different temperatures. In case of occurrence of shrinkage, it can be observed that there was an initial rapid decrease in volume expansion, followed by a much slower decrease over a longer period of time. S20 and S
x
values, as shown in Table 2 have been used for comparing the extent of shrinkage in the same period of time (20 min and Shrinkage of foams produced at foaming temperatures of (a) 110 ℃, (b) 100 ℃, (c) 90 ℃, (d) 80 ℃, (e) 35 ℃. Rheological properties of the compositions and their foaming behaviour at different temperatures. x = t
f
/2 (in min).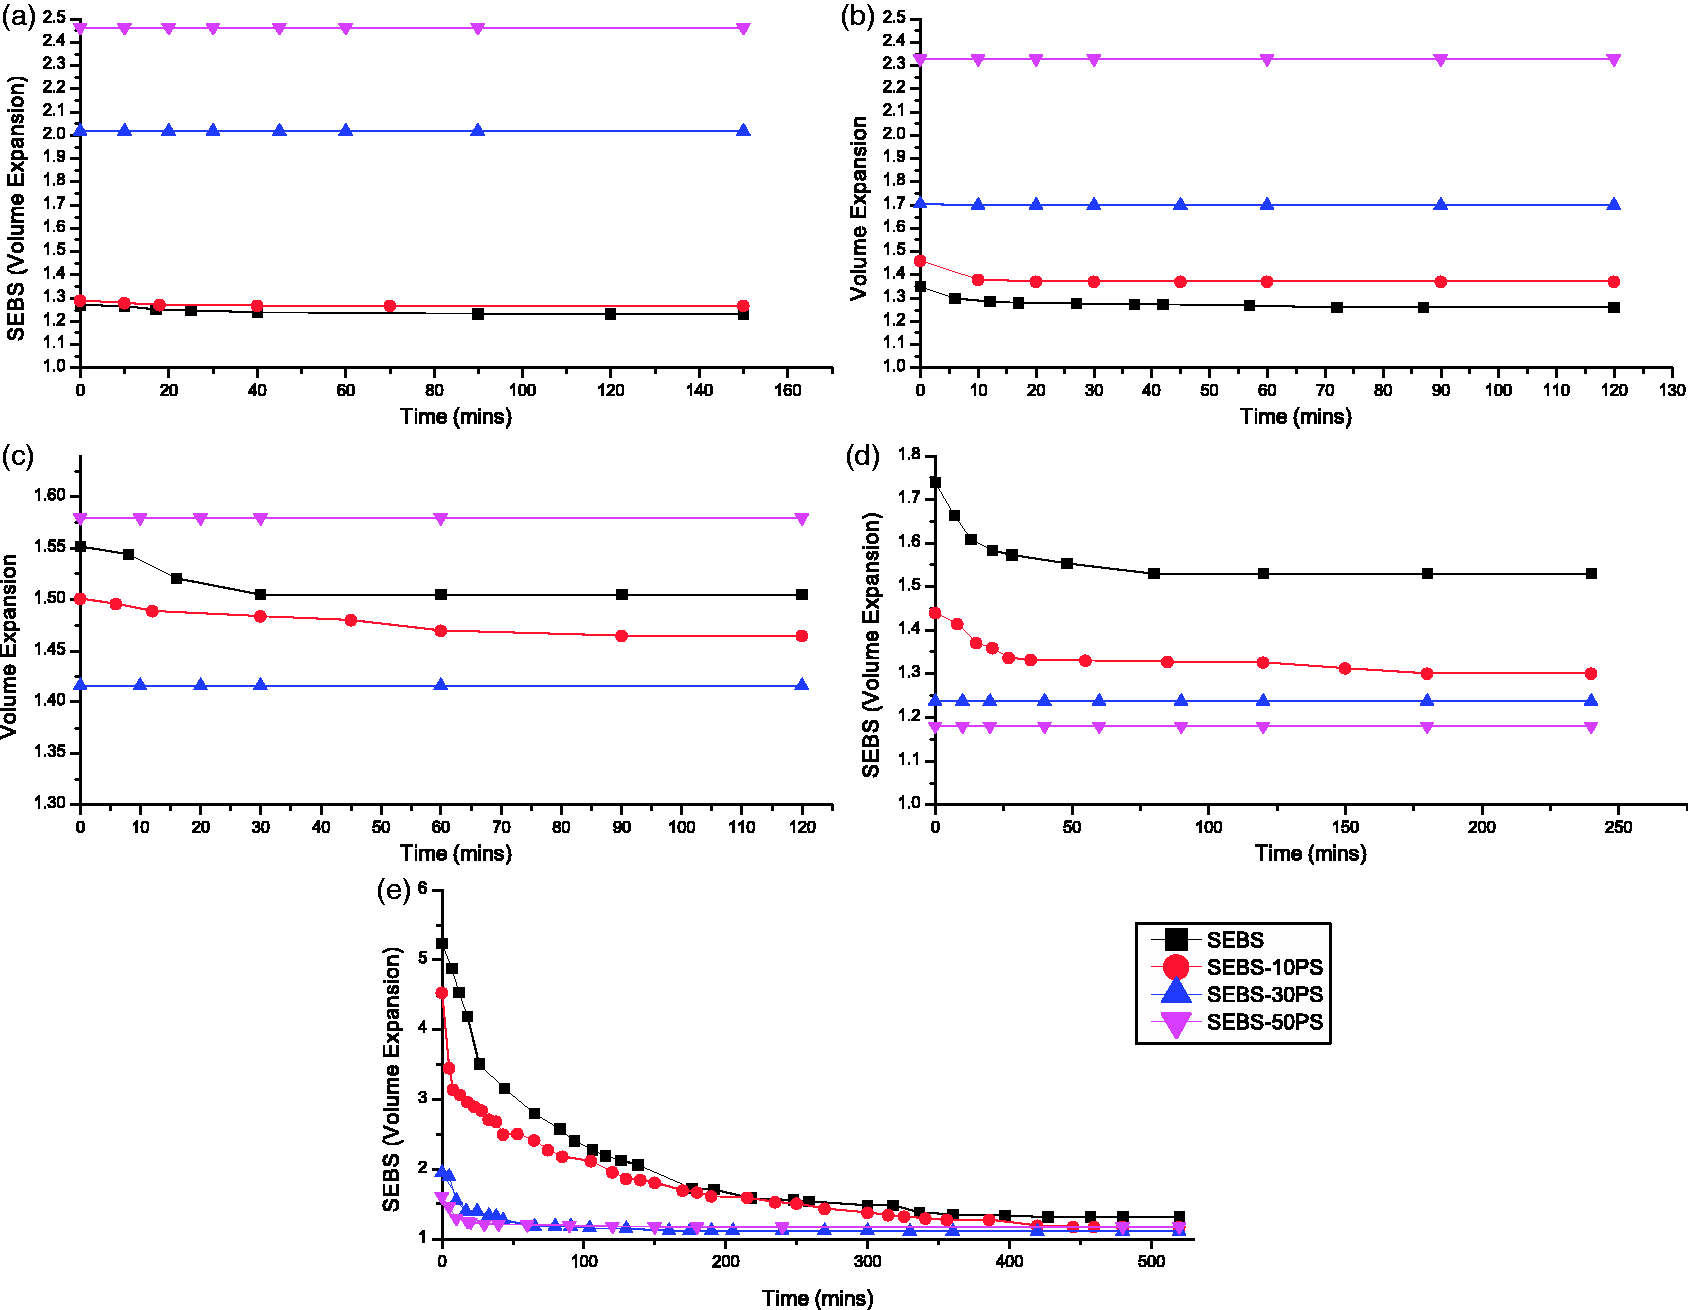
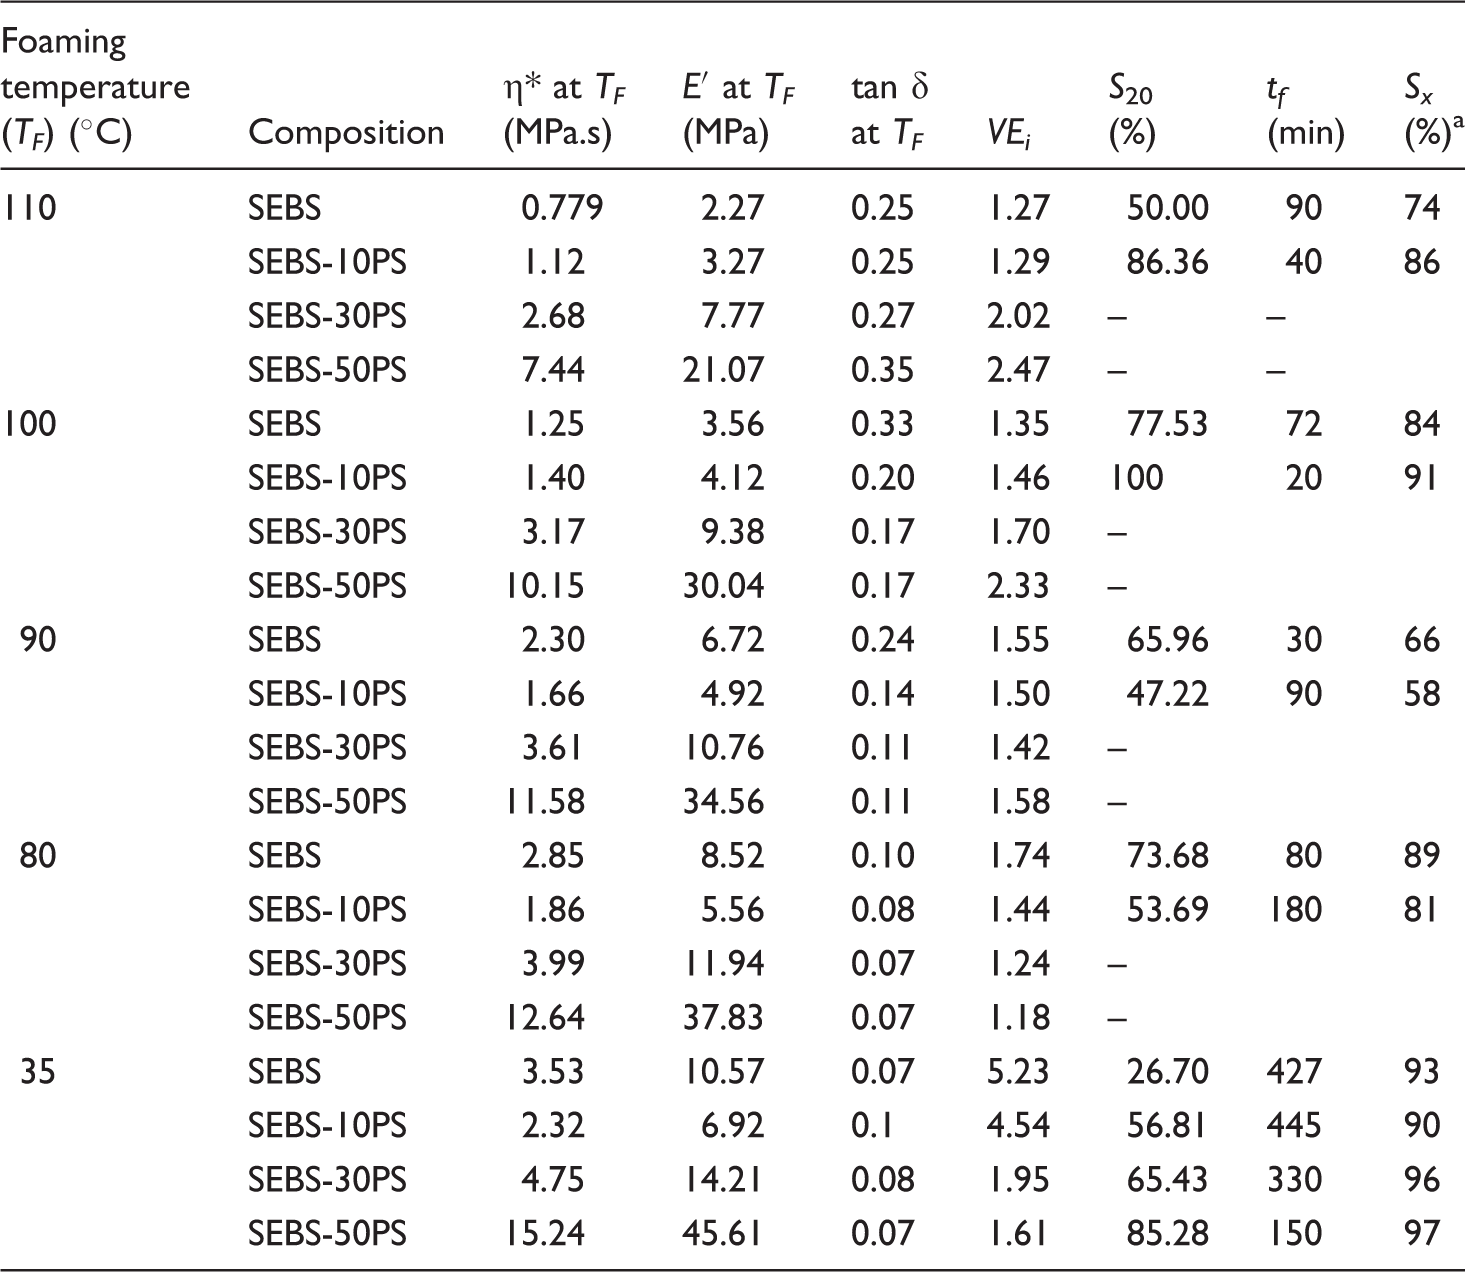
At higher foaming temperatures, the foaming behaviour of the different compositions can be explained on the basis of their rheological properties at these temperatures, as also seen in Table 2. When foaming was carried out at 110℃, higher values of η* and E′ resulted in higher VE and better foam stability (reduced shrinkage) (Figure 4(a)). SEBS-30PS and SEBS-50PS, which had significantly higher values of E′, produced stable foams, as compared to SEBS and SEBS-10PS. Amongst SEBS and SEBS-10PS, SEBS, which had lower E′, exhibited shrinkage over a longer period of time, as evident from lower values of S20, S x and a higher value of tf.
The same trend was observed when foaming was done at 100℃, as shown in Figure 4(b). However, VE values of SEBS-50PS and SEBS-30PS at 100℃ were less than those at 110℃, whereas for SEBS and SEBS-10PS, which had lower values of T g of the PS phase, VE values at 100℃ were more than those at 110℃. This observation indicates that there is a complex viscosity window for optimal volume expansion (VE) for a given composition. This window is observed close to the T g of PS phase of that composition. The presence of this complex viscosity window is confirmed by the foaming behaviour of the different compositions at 90℃ and 80℃ (Figure 4(c) and (d)). The VE values of SEBS and SEBS-10PS further increased and those of SEBS-30PS and SEBS-50PS decreased when foaming was carried out at 90℃. When foaming temperature was lowered to 80℃, SEBS, which had the lowest T g value (86.6℃) of the PS phase among all compositions, showed a significant improvement in VE, unlike the remaining compositions. SEBS-30PS and SEBS-50PS showed very low values of VE at 80℃ (lower than those of both SEBS and SEBS-10PS) and even SEBS-10PS which had a higher value of T g (92.5℃) of the PS phase, as compared to that of SEBS, exhibited a lower VE at 80℃ than at 90℃.
However, it can be observed that in the foaming temperature range 80–110℃, the maximum values of VE obtained for SEBS and SEBS-10PS were much lower than those for SEBS-30PS and SEBS-50PS. In other words, when two compositions were foamed within their respective complex viscosity windows, the one with a higher value of η* exhibited a higher VE (Table 2).
To gain a better understanding of the foaming temperature window, SEBS-50PS was foamed at 98℃, 99℃, 112℃ and 113℃. VE values of SEBS-50PS foam at 98℃ and 99℃ were found to be 1.76 and 1.97, respectively. These values were significantly lower than 2.33 (the VE value at 100℃). Moreover, the VE values at 112℃ and 113℃ were 2.24 and 1.84, respectively. Thus, the foaming temperature window of 100℃ to 112℃ was suitable for producing SEBS-50PS foams with volume expansion ratios greater than 2. The variation of volume expansion ratio in this temperature window was approximately 9.3%. This is in sharp contrast to the foaming behaviour of SEBS-10PS, in which the variation of VE in the temperature range 80–100℃ was only 4%. This indicates that the foaming temperature window of SEBS-10PS was much broader than that of SEBS-50PS.
The width of the foaming temperature window and its dependence on composition can be further realized by examining the nature of the complex viscosity curves in the higher foaming temperature range, as seen in Figure 5. It is observed that the foaming temperature window of a composition was the region corresponding to the change in slope of its complex viscosity curve close to T
g
of the PS phase. The sharper the change in the slope, the narrower was the foaming temperature window. A much sharper change in slope in the complex viscosity curve was observed at temperatures close to T
g
of the PS phase, for SEBS-50PS as compared to SEBS-10PS. This can be attributed to the predominance of the phase-separated PS in the blend of higher PS content. Thus SEBS-10PS had a much broader foaming temperature window than SEBS-50PS. However, the values of VE of SEBS-10PS were much lower than those of SEBS-50PS due to lower values of η*.
Temperature dependence of complex viscosity.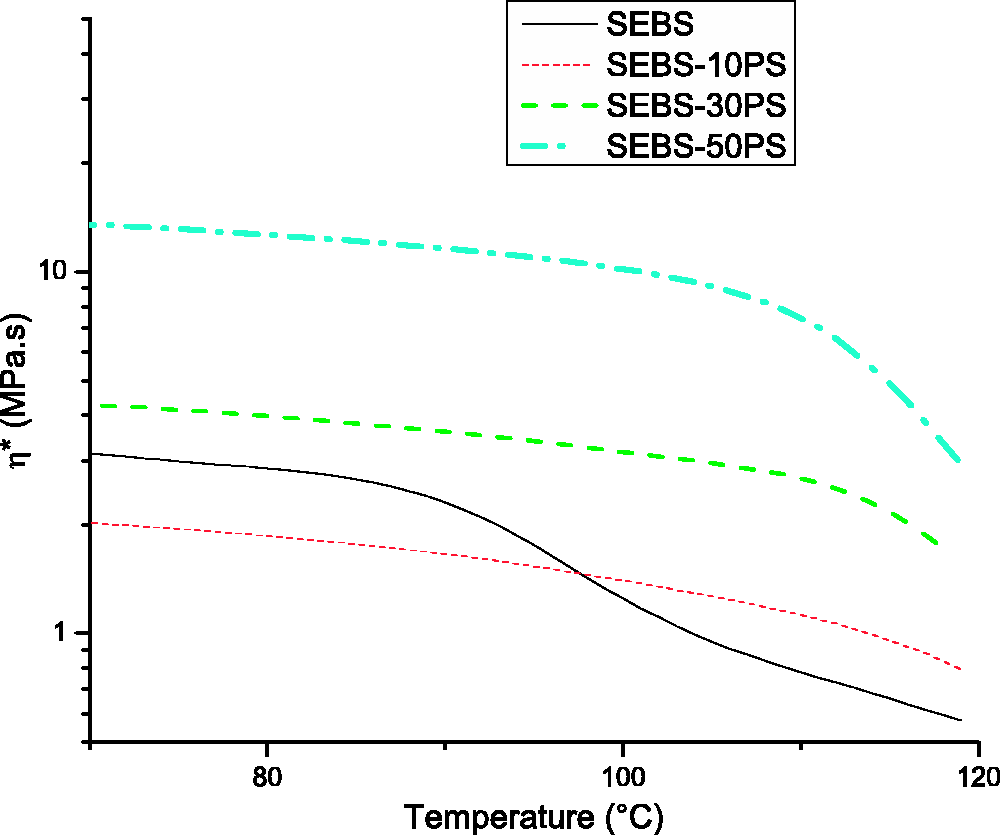
It was further observed that the lower limit of the foaming temperature window was below the T g of the PS phase of the respective composition. This may be attributed to the depression in T g of PS due to plasticization effect of CO2.22,23 The upper limit extended beyond T g , possibly because softening happened over a range of temperature.
As far as shrinkage is concerned, in the higher foaming temperature range (80–110℃) used for studies, SEBS-30PS and and SEBS-50PS produced stable foams, irrespective of the value of foaming temperature. Foams of SEBS and SEBS-10PS exhibited shrinkage, the composition with a lower value of E′ showed shrinkage over a longer period of time (higher value of t f ), a lower extent of shrinkage happening in the same time span (lower values of S20, S x ).
When foaming was carried out at 35℃, blends having higher PS content exhibited lower VE, completion of shrinkage in a shorter period of time and a greater extent of shrinkage in the same time span (Figure 4(e)), irrespective of rheological properties. This anomaly can be explained by the complex microstructure of the blends. At 35℃, the elastomeric phase remained well above its T g and was foamed, but the PS phase remained stiff. As the elastomeric phase expanded in volume, it pushed against the PS domains/ aggregates. The rigid PS resisted deformation and compressed the expanded cells (gas compression). Greater the PS content, greater was this effect resulting in a lower VE, higher S20, S x and lower t f . Exception was SEBS-10PS. Though S20 of SEBS-10PS foam was higher than that of SEBS foam, S x was lower and t f was higher. This could be due to the fact that the increase in domain size in SEBS-10PS resulted in lowering of stiffness, partially off-setting the effect of phase-separated PS aggregates. In blends with higher PS content, the effect of phase-separated PS aggregates was over-riding. Thus with further increase in PS content, not only S20 increased, but there was also increase in S x and decrease in t f .
At higher foaming temperatures, as the stiffness of PS decreased and PS participated in the foaming process, foam shrinkage for all the blends decreased. Because of participation of PS in foaming, it has been assumed that the gas compression effect was the same in all foams produced at higher foaming temperatures.
All compositions showed a higher initial VE at 35℃ as compared to foaming at higher temperatures. This may be attributed to a higher solubility and a lower diffusivity of gas at lower foaming temperatures, which in turn results in a dissolution of a higher amount of gas and lowering of the amount of gas lost to the surroundings, leading to higher VE.10,24,25 Solubility and diffusivity studies are outside the scope of this work.
The values of tan δ are lower than 1 for all samples, which facilitates good VE and foamability.11,26
SEM studies of foams
Foaming temperature of 35℃
Figure 6(a), (d), (g) and (j) shows the SEM images (at 500 × magnification) of foams produced at 35℃. The cell size distribution of the foams (Figure 6(c), (f), (i) and (l)) was obtained by analysis of these images using ImageJ software. It can be observed that up to 30 wt% PS loading, an increase in PS content of the blends resulted in a greater cell density, a smaller cell size and a narrower cell size distribution. These observations are indicative of the nucleating effect of PS. As the PS content of the blends increased, up to 30%, there was an increase in the number of phase-separated aggregates (Figure 2(a) to (c)), and hence an increase in the nucleating effect. With further increase in PS content, cell size increased, cell density decreased and cell size distribution became broader. This may be attributed to selective foaming of the elastomeric phase in a co-continuous morphology (Figure 2(d)).
SEM images (500 × and 10,000 × magnification) and cell size distribution graphs of (a–c) SEBS, (d–f) SEBS-10PS, (g–i) SEBS-30PS, (j–l) SEBS-50PS foams produced at 35℃.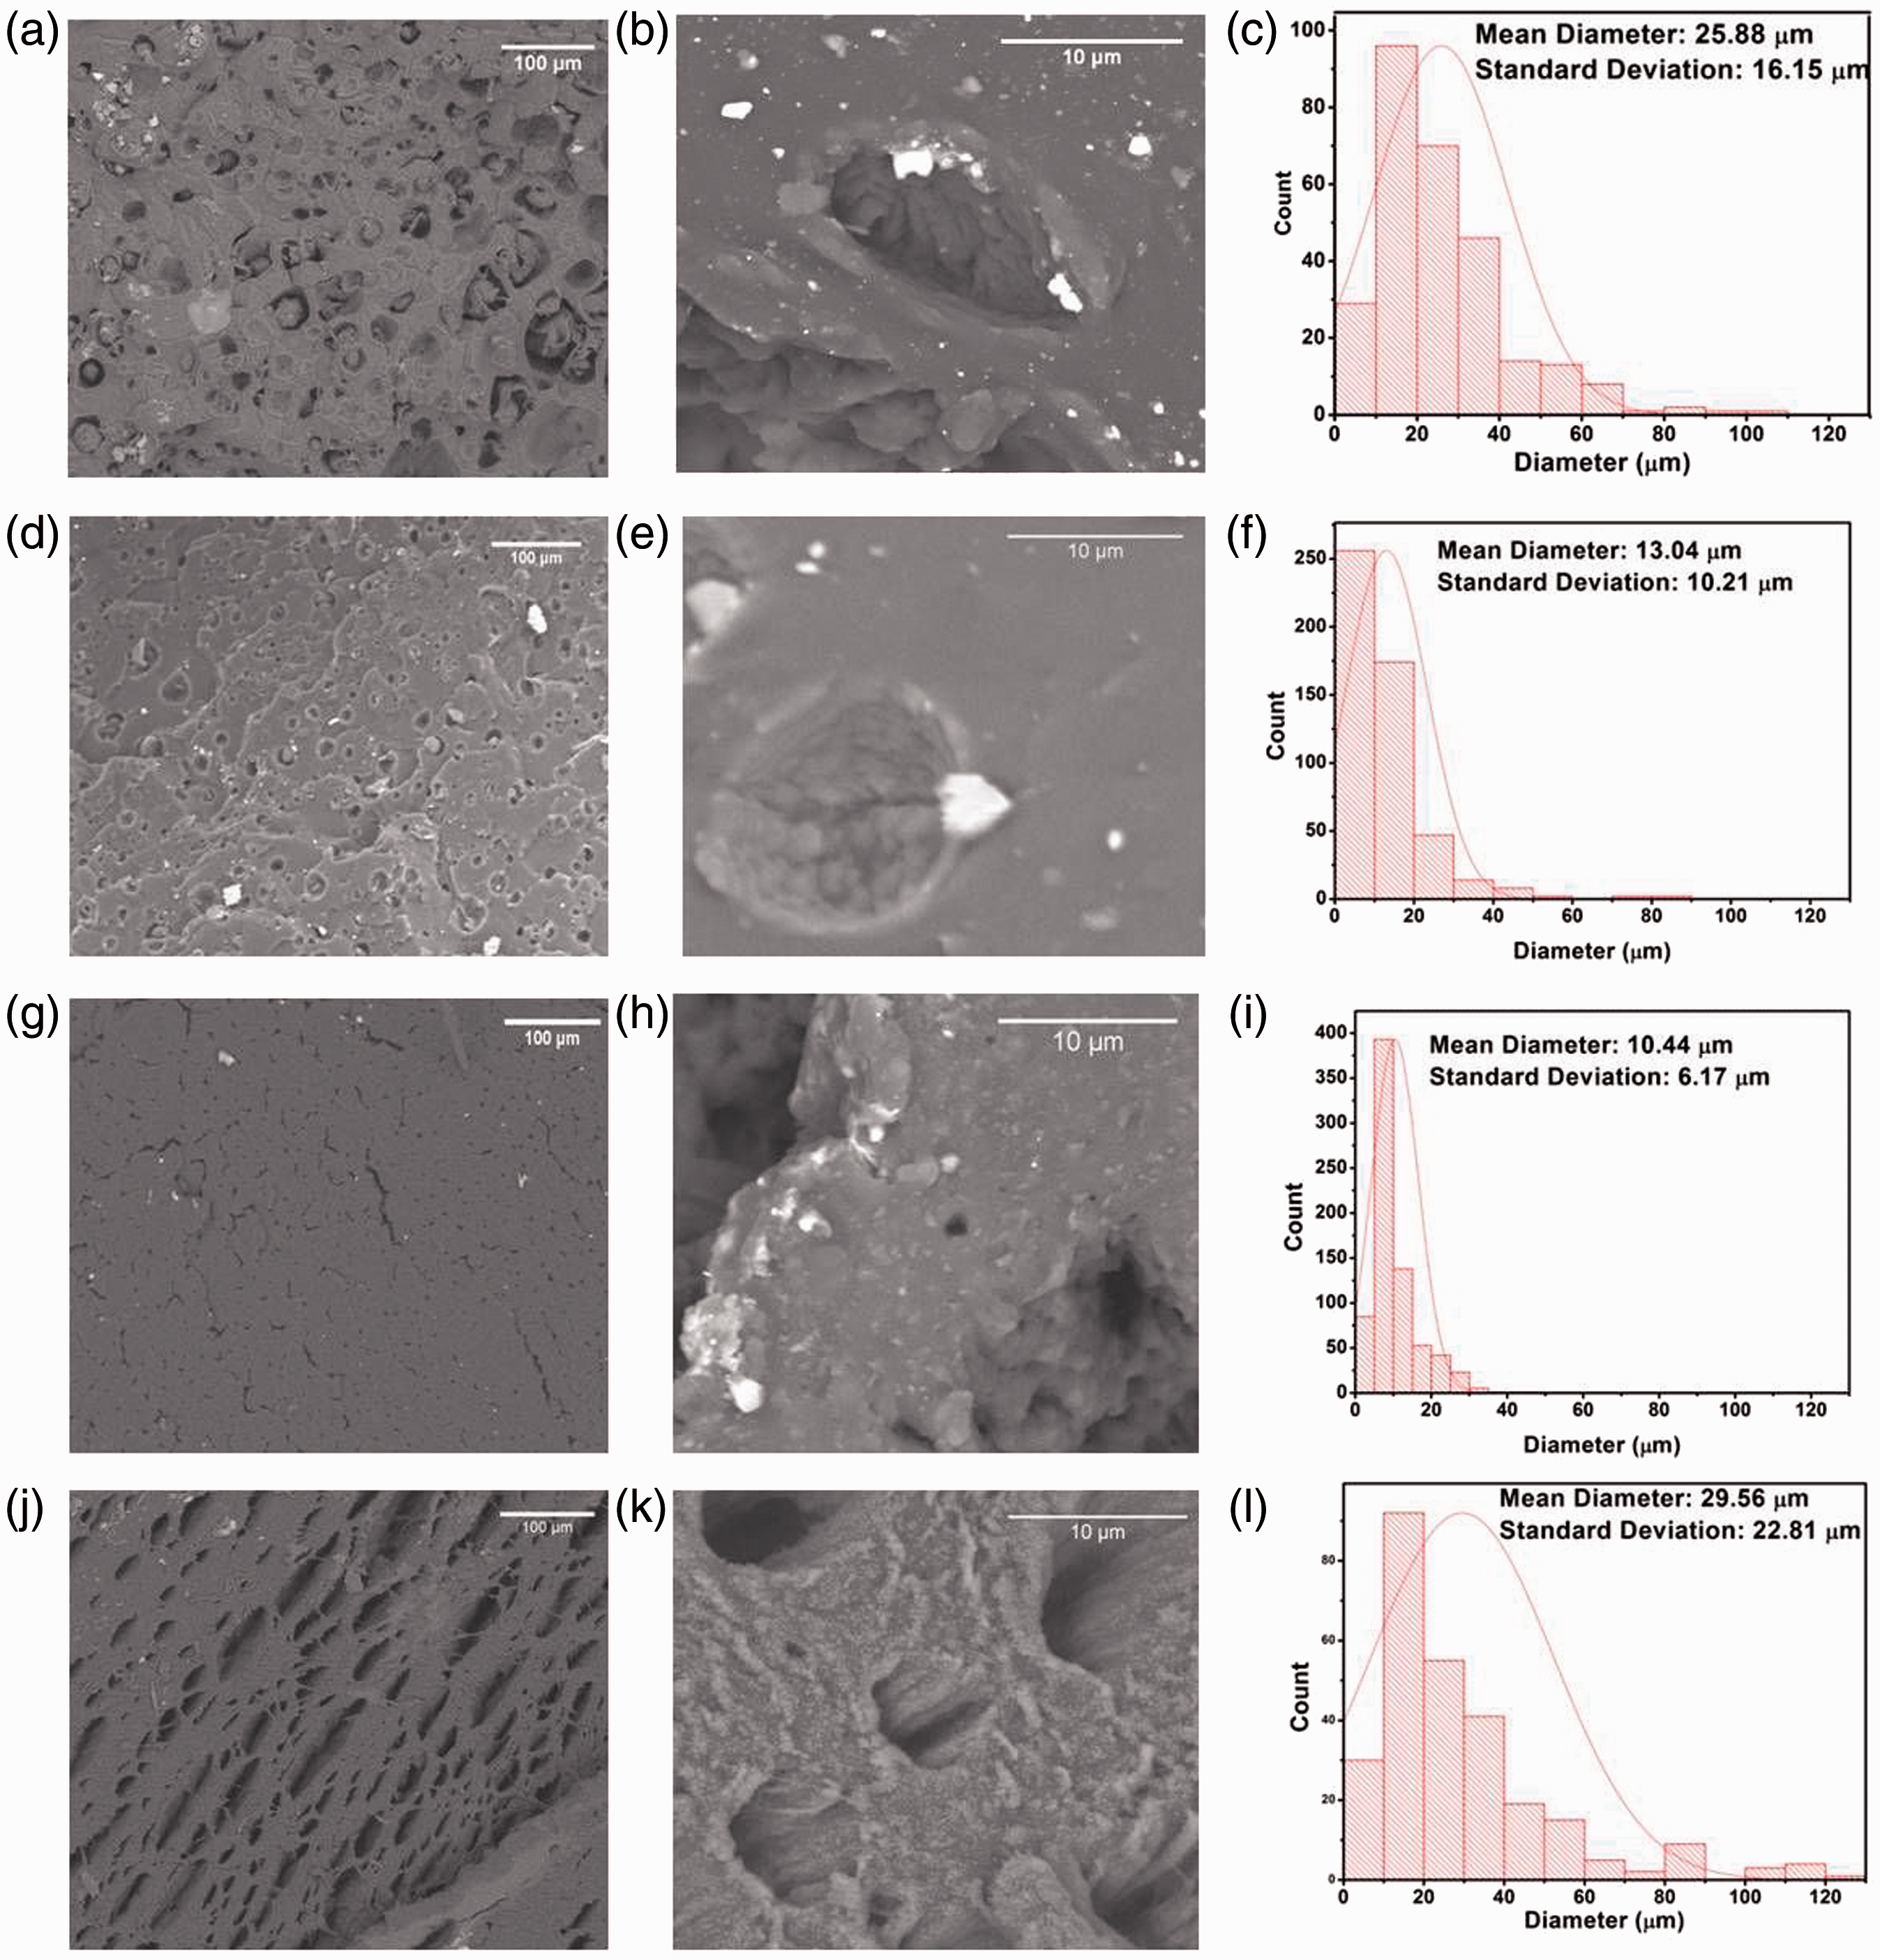
Figure 6(b) shows the SEM image of an individual cell of SEBS foam at higher magnification. Cell with shrunken cell walls was observed. PS clusters can also be observed along the edge of the cell. Since the foaming temperature was much below the T g of PS, only the elastomeric phase was foamed with the PS domains acting as the nucleating agent. The shrunken cell walls and the increased size of PS particles as compared to the domain size of SEBS suggest a change in microstructure due to expansion and shrinkage. The PS domains have come closer and have fused together forming micrometer sized aggregates. The presence of many PS aggregates along edge of a single cell indicates coalescence of closely spaced cells which had nucleated around different PS particles.
Foam of SEBS-10PS shows a similar morphology, as seen in Figure 6(e). The foam of SEBS-30PS was found to have a large number of tiny shrunken cells and cracks. Focus on the cracks of SEBS-30PS foam, as shown in Figure 6(h), revealed the presence of PS aggregates along the crack edges. Also, the inside walls of cracks resemble the shrunken cell walls of the SEBS foams. The cracks are actually coalesced cells which may have formed along a line.
Figure 6(k) shows the cells of SEBS-50PS foam at higher magnification. The cells are found to be prominently lined by PS aggregates even in co-continuous morphology.
Higher foaming temperatures
At higher foaming temperatures (80–110℃), all foams were found to have large irregularly shaped cells. Figure 7 shows the SEM images of foams produced at 100℃.
SEM images at 100 × magnification of foams of (a) SEBS, (b) SEBS-10PS, (c) SEBS-30PS and (d) SEBS-50PS produced at 100℃.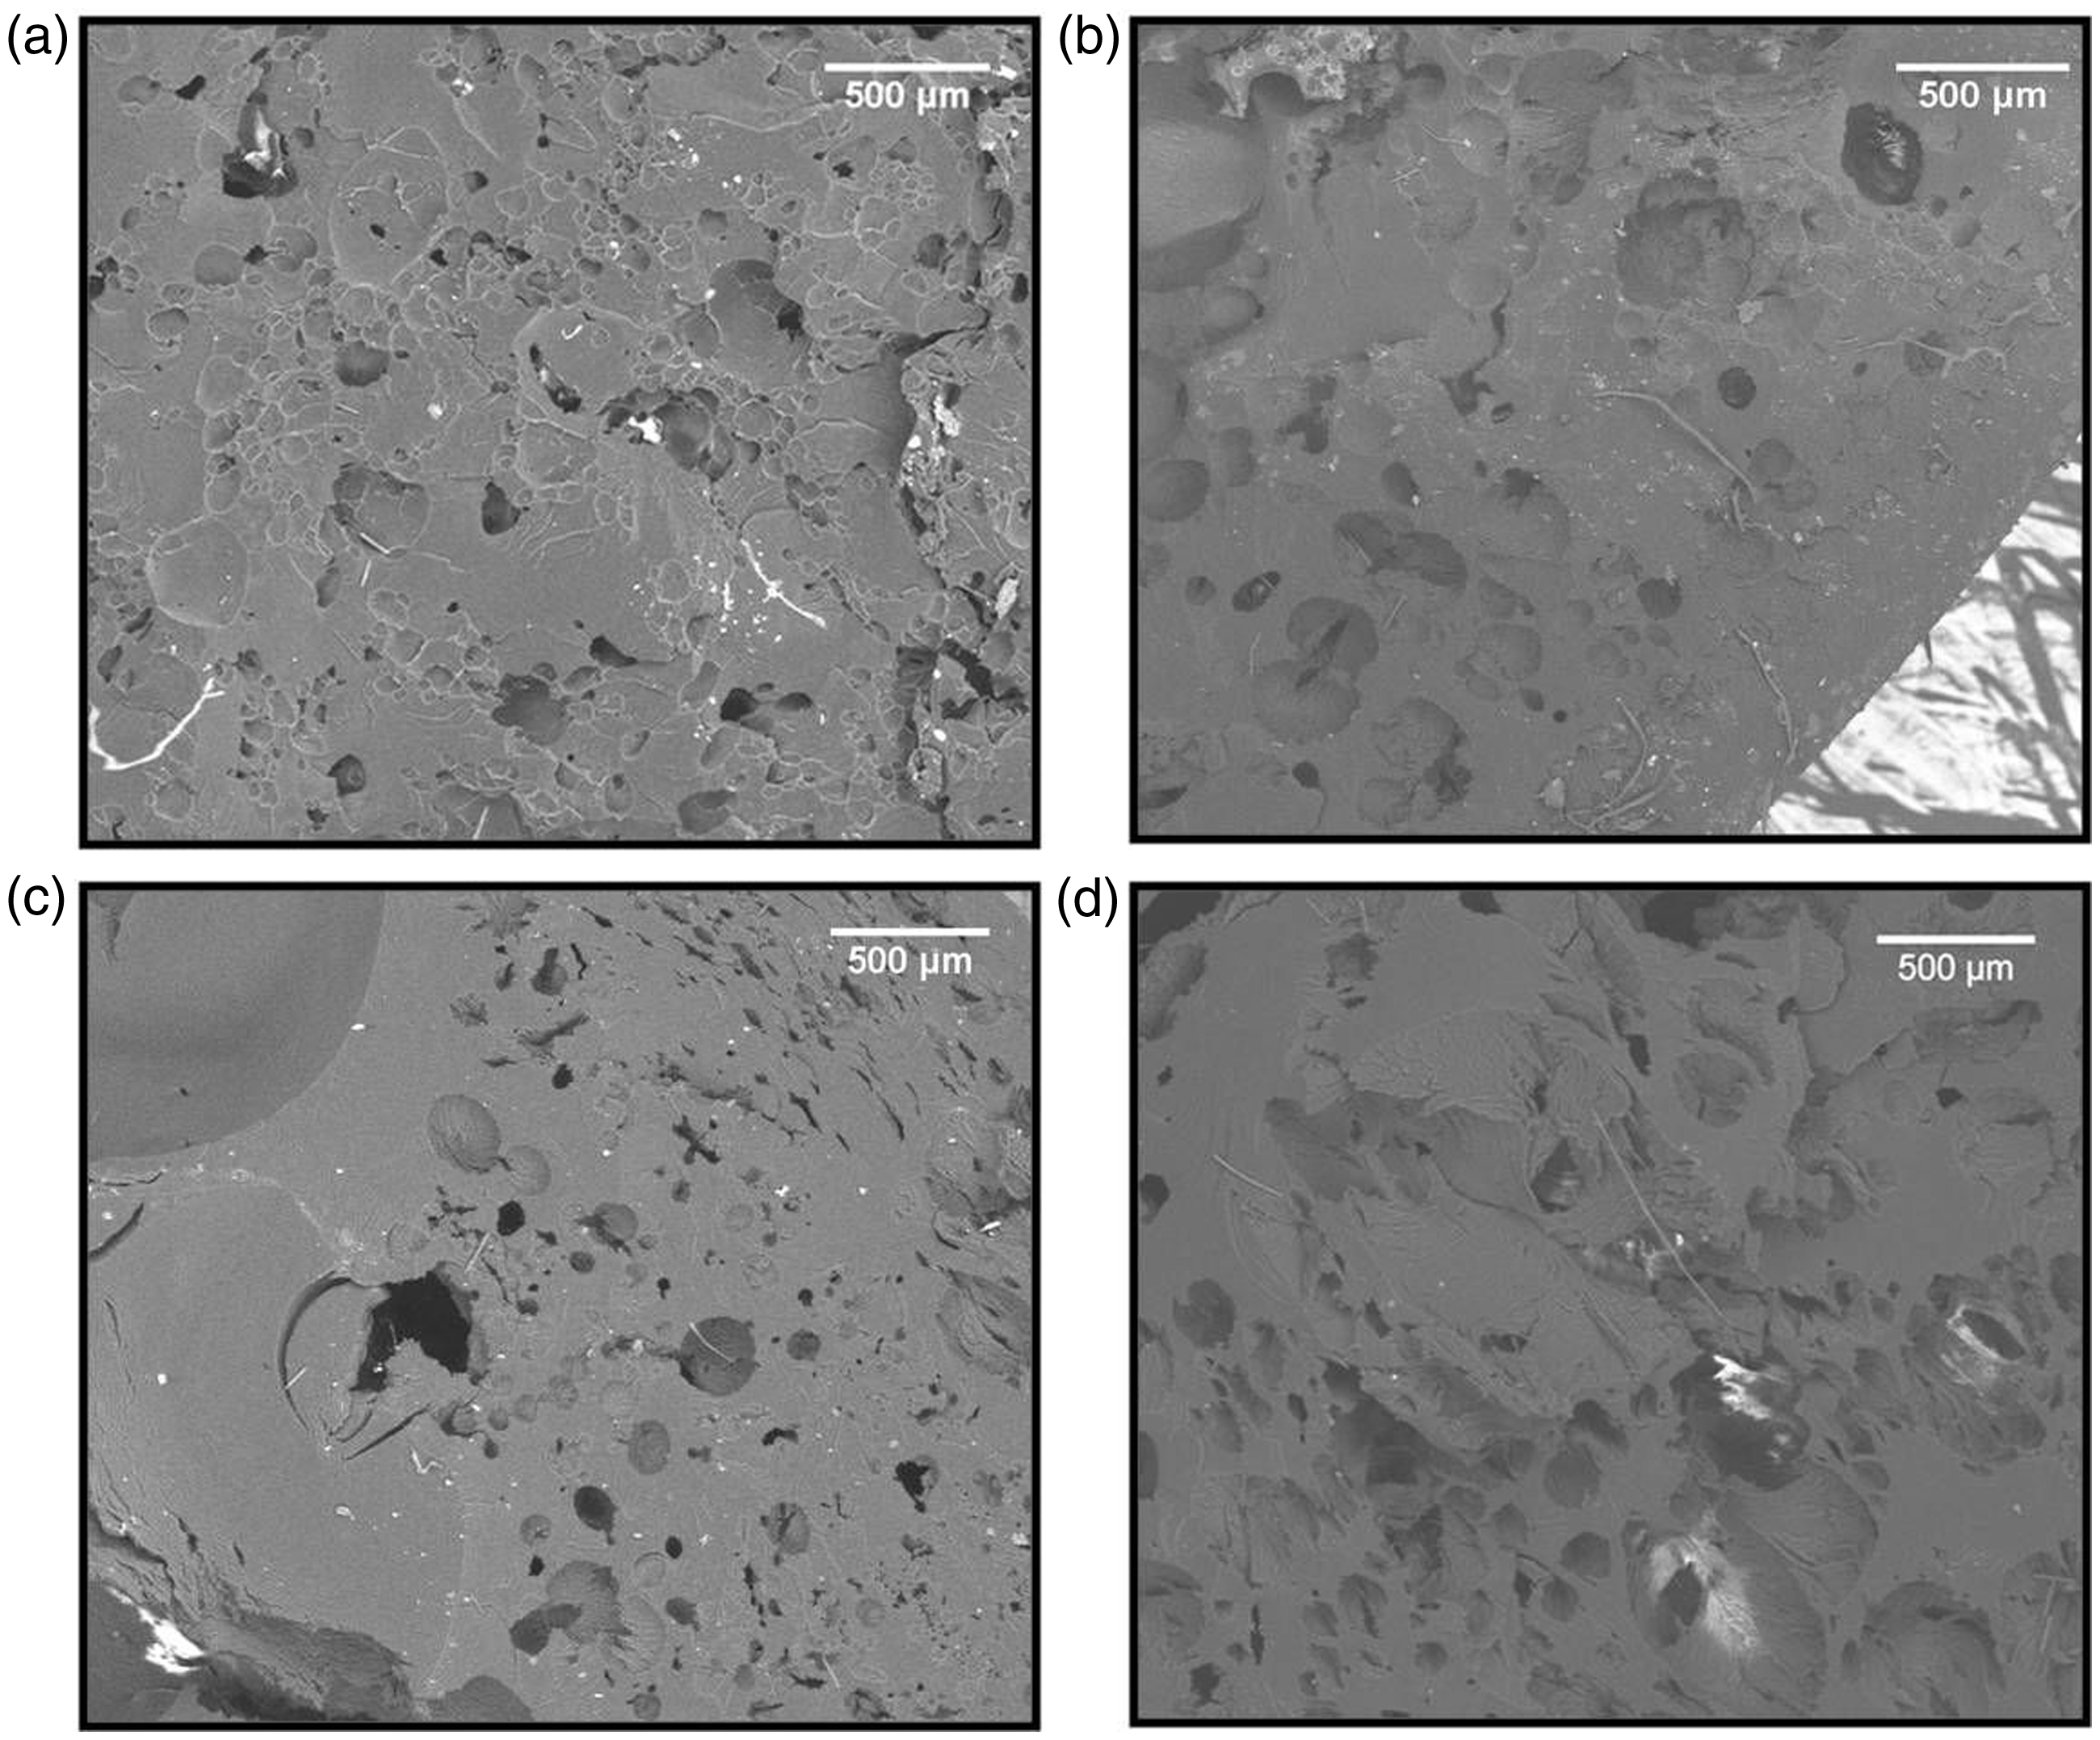
Such larger cell size and greater irregularity in shape indicate a larger extent of cell coalescence at higher foaming temperatures. A better control in cell coalescence in the foaming of block-copolymer type of TPE (ethylene-co-octene), by selecting a lower foaming temperature has also been reported by Zhai et al. 27
Also, in Figure 7, some white patches can be observed smeared along the cell walls, indicating the participation of PS in the foaming process at higher temperatures, unlike the foams produced at 35℃, in which PS had an exclusive nucleating role and was present as aggregates along the edges of the cells. In the SEM images, it is not possible to distinguish between cells of SEBS and those of PS, possibly due to a very large extent of coalescence of both kinds of cells, resulting in their fusion.
Conclusions
The foaming behaviour of SEBS–PS blends is by and large governed by material characteristics and the foaming temperature:
At foaming temperatures close to the glass transition temperature of the PS phase, foaming behaviour is ruled by the rheological properties. Higher complex viscosity in suitable complex viscosity window and higher storage modulus result in foams having higher volume expansion and lower shrinkage. When foaming is done at temperatures much below the T
g
of the PS phase but higher than that of the EB phase, the EB phase is selectively foamed and PS phase shows nucleating effect. Irrespective of rheological properties all foams show prominent shrinkage. A higher PS content results in lower volume expansion and a more rapid shrinkage.
In order to produce stable foams having appreciable volume expansion, compositions with higher PS content need to be chosen and foaming is to be carried out at temperatures close to T g of PS phase of that composition. However, such foams are expected to have a very large extent of cell coalescence. Control of morphology, through lowering of cell coalescence, possibly by studies on melt strength and its enhancement will be the future course of work of this research group.
Footnotes
Acknowledgement
One of authors (Ritima Banerjee) would like to acknowledge the Ministry of Human Resources Development (MHRD), Government of India for providing her with scholarship during the course of this research.
Declaration of Conflicting Interests
The author(s) declared no potential conflicts of interest with respect to the research, authorship, and/or publication of this article.
Funding
The author(s) received no financial support for the research, authorship, and/or publication of this article.