
Abstract
Syntactic foams are composite materials consisting in the association of hollow particles, called “microspheres” and a polymer matrix. The use of soft shell microspheres confers to the foam interesting properties but in return increases significantly its compressibility. Therefore, understanding and predicting the relationship between pressure and volume change is a crucial issue for the development of this type of material. The present study focuses on a high void fraction syntactic foam made with soft shell polymer microspheres embedded in a polyurethane matrix. Compression tests are performed using a capillary rheometer and a PVT accessory for the hydrostatic compression, and a more conventional apparatus for the confined compression. The experimental results are compared with De Pascalis’s pressure/volume model predictions, using Fok and Allwright’s model to determine the critical buckling pressure of the microspheres. The model proves to be fairly accurate at low pressure and high pressure, despite a notable deviation in the mid-pressure range. The influence of key model parameters such as microsphere size distribution and microsphere and matrix elastic properties is investigated. It is shown that the reinforcement of the matrix seems to be the only efficient way to limit the compressibility of such a syntactic foam.
Keywords
Introduction
Syntactic foams are composite materials consisting in the association of hollow particles, called “microspheres” and a polymer matrix (thermoplastic or thermoset), allowing obtaining relevant properties in terms of industrial applications. Syntactic foams have lower density, higher specific strength, lower coefficient of thermal expansion and are often cheaper than the base matrix. Most of the applications are related to the marine applications 1 where the buoyancy obtained from lightweight materials with high compressive strength and modulus is a key parameter. Thermoplastic-based (for example Polyethylene 2 , 3 and Polyurethane 4 syntactic foams are now commonly used as thermal insulation materials in many offshore applications such as pipelines. It should be noted that developments from epoxy-thermoset are still ongoing. 5 , 6
Syntactic foams are often used for underwater applications and thus are subjected to constant hydrostatic pressure. Pressure changes the apparent volume ratio of voids inside the syntactic foam, which consequently affects the required properties. However few works are reported in the literature on the variations of the specific volume versus the loading pressure. Therefore, understanding and predicting the pressure–volume relationship of syntactic foams is important for the development of this type of material.
A wide range of work on the modeling of the mechanical behavior of syntactic foam under compressive stress is available in the literature. Gaunaurd et al. 7 treated the problem as that of the compression of a porous material, where microspheres were replaced by air inclusions without shells. Bardella and Genna 8 or Gupta and Woldesenbet 9 , 10 chose to homogenize the mechanical properties of the polymer/microsphere composite, considering only the linear domain. Using a table tennis ball, Shorter et al. 11 , 12 showed that the buckling of the microspheres can explain the non-linear aspect of the pressure/volume curve, which makes the comprehension of the microsphere buckling inside an elastic medium a crucial issue. Surprisingly, few works have been conducted on that subject. Indeed, most of the researches addressing the buckling of microspheres are limited to the case where the pressure is applied on the surface of the shell itself (see Wesolowski, 13 Koiter, 14 Wang and Ertepinar 15 ). Fok and Allwright 16 and Jones et al. 17 are among the few groups who considered a spherical shell actually embedded in an unbounded uniform elastic medium. De Pascalis et al. 18 have developed a mathematical model predicting the pressure/volume relationship of syntactic foam using Shorter’s work. He proposed the idea of modeling the compression as a two-step process: linear and non-linear, using the critical pressure defined by Fok and Allwright to set the transition between them. However, De Pascalis’s work lacks experimental data to validate his model. Furthermore, he only considered very low microsphere volume fractions ranging from 5% to 10%.
The present study focuses on syntactic foam made with soft shell microspheres. Pressure applied to such a material tends to crush the microspheres, which eventually affects the properties. Understanding the relationship between pressure and volume is a crucial issue to generalize the use of soft shell microspheres. In order to extend the work of De Pascalis, several compression tests on a model syntactic foam with a high-void volume fraction up to 20% are performed. Then, the experimental results are compared with De Pascalis’s pressure/volume predictions, using Fok and Allwright’s 16 model to determine the critical buckling pressure of the microspheres. Finally, the influence of key model parameters such as microsphere size distribution and microsphere and matrix elastic properties is investigated and discussed.
Confined and hydrostatic compression tests
Several compression tests were conducted on a syntactic foam based on a polyurethane matrix. The matrix is a thermosetting polyurethane elastomer and the soft shell microspheres have been bought from AkzoNobel. Note that the indices m and s refer to the matrix and the microspheres respectively. Dynamic mechanical analysis has been performed on the polymer matrix in the linear domain of the viscoelasticity using a Q800 DMA provided by TA Instruments. At room temperature, the storage modulus E′ shows an equilibrium modulus which has been measured at 1 Hz. This value is closed to the value of the Young modulus measured by tensile strength experiments. Note that tensile measurements are often less accurate for Young modulus determination. Xu and Gupta 19 addressed a work to convert the frequency domain storage modulus obtained from DMA to elastic modulus over a wide range of temperatures and strain rates. Finally, the Young modulus was determined as Em = 6 MPa.
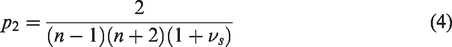
This elastomer is considered as incompressible. Actually, it can considered that the PU is amorphous and behaves like a rubber since its glass temperature and Tα (= –68°C) are below the room temperature. Therefore it is assumed that the polymer has the same Poisson’s ratio as rubber: νm = 0.49. The shear modulus μ
m
is deducted from the relation
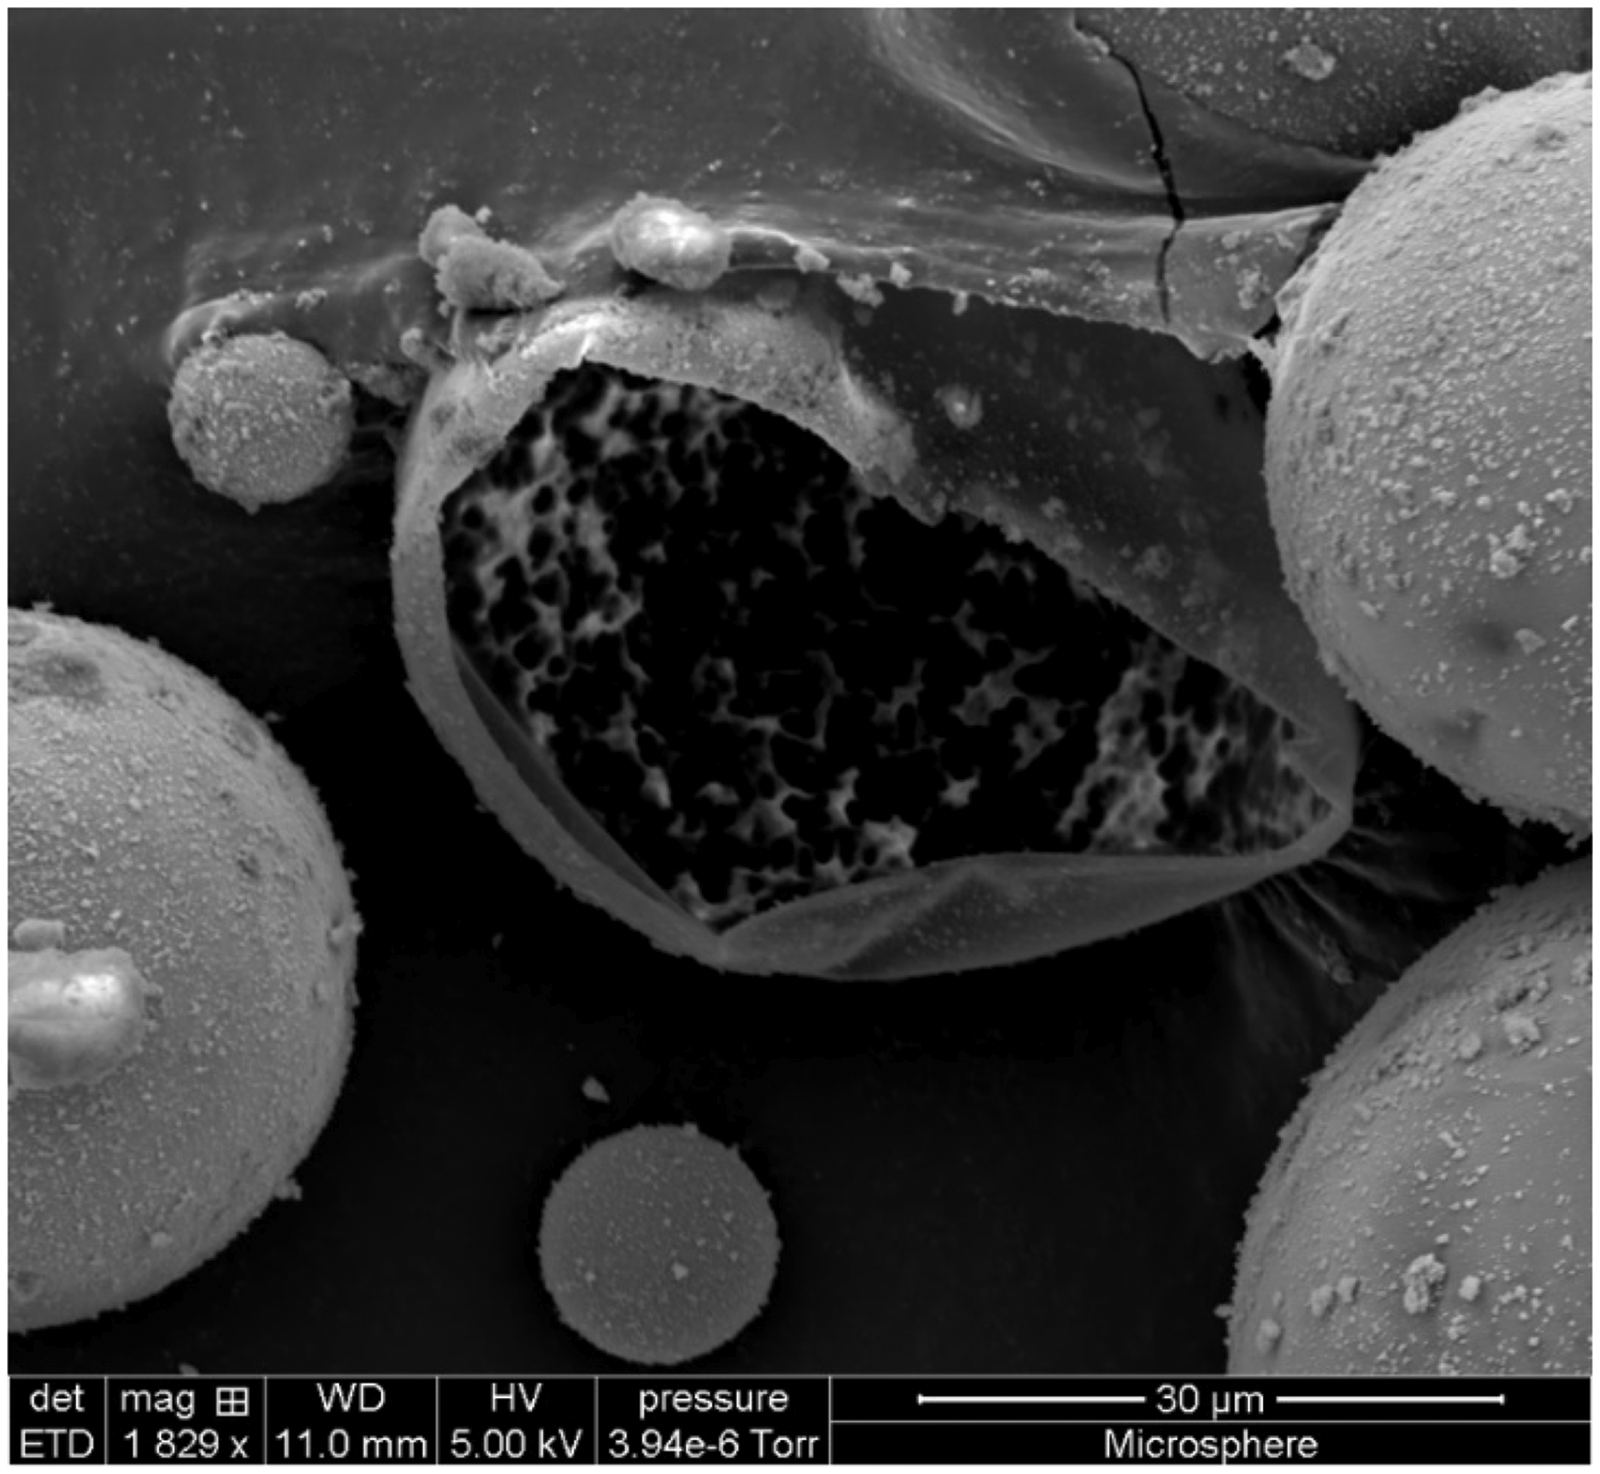
Example of an open microsphere image used to measure the shell thickness H.
The syntactic foam has been studied under a pressure P ranging from 0.1 to 17 MPa. Two different compression tests have been used: a confined compression test and a hydrostatic compression test. The confined compression has been carried out on cylindrical samples (diameter Ø = 30 mm, height h = 30 mm,) using a universal testing machine with a specific accessory (Figure 2). The compression rate has been set at 0.5 mm/min.
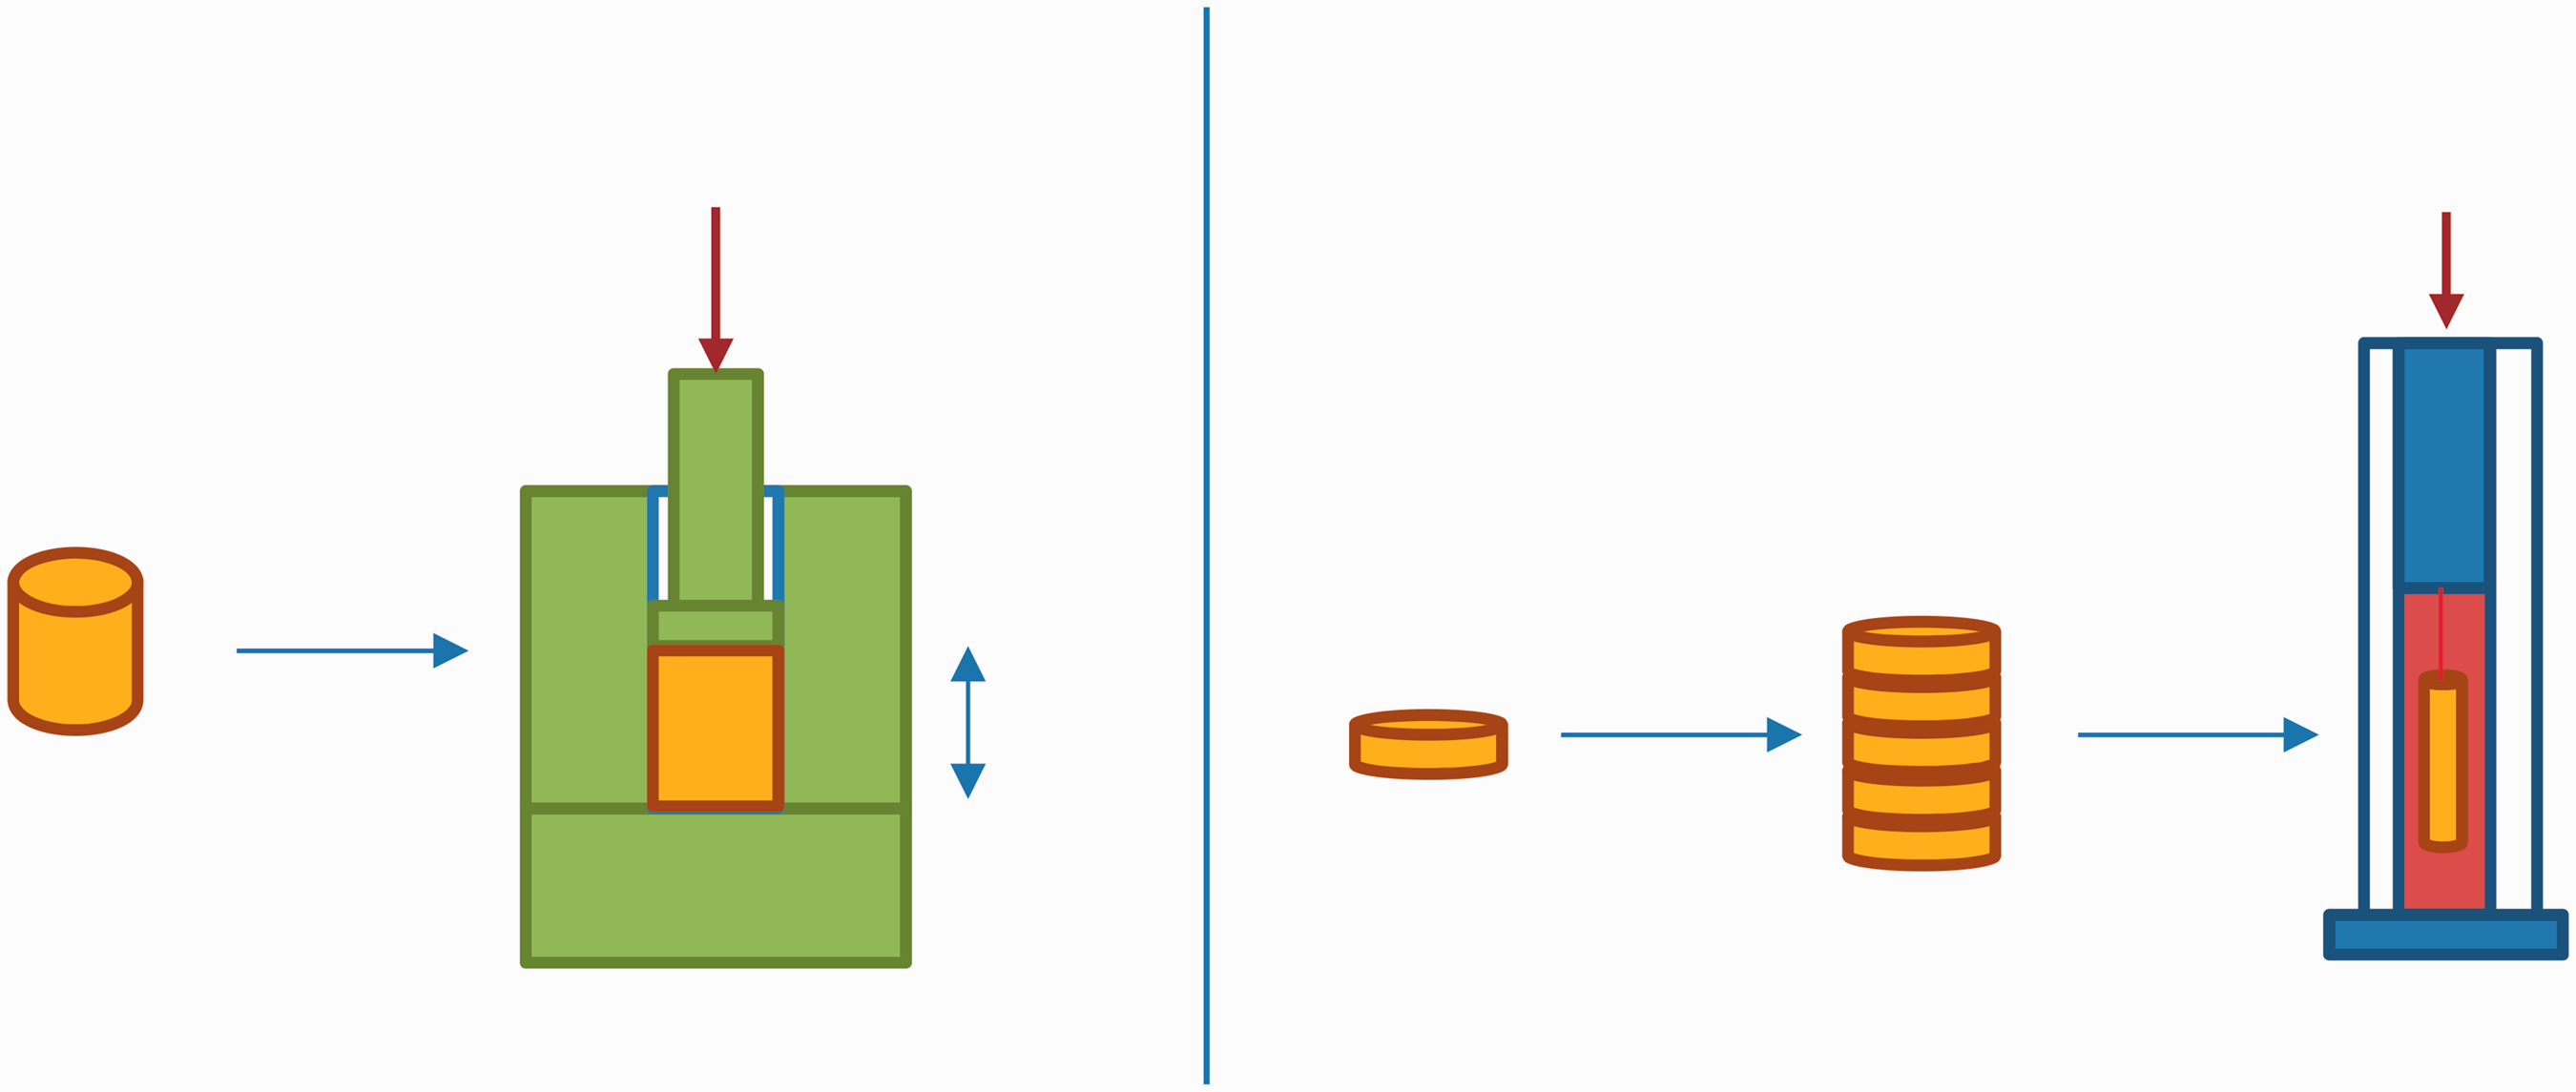
Confined compression (left) vs. hydrostatic compression (right).
The hydrostatic compression has been performed using a capillary rheometer (Malvern DR7) equipped with a PVT accessory to measure the volume change of the syntactic foam under pressure. The quality of the sealing is checked by performing a compression on water, without sample. If any leakage or bubbles appear during this test in the studied pressure range, the sealing is redone. The foam is cut into small cylindrical parts, which are then stacked to obtain a significant volume of foam. To ensure that the pressure applied is purely hydrostatic, the parts are attached in the middle of the rheometer’s chamber with a metallic string whose compressibility is here neglected. The chamber is filled with a solvent -which is in that case water- to prevent a possible swelling of the polyurethane. The compression rate is set at 1 mm/min. The pressure is applied by a piston, whose displacement is recorded and converted into the volume change of the rheometer’s chamber. The data are then corrected considering the slight deformation of the chamber filled with water under the same range of pressure. The relative volume change of the syntactic foam versus pressure in both hydrostatic and confined compressions is shown in Figure 3.
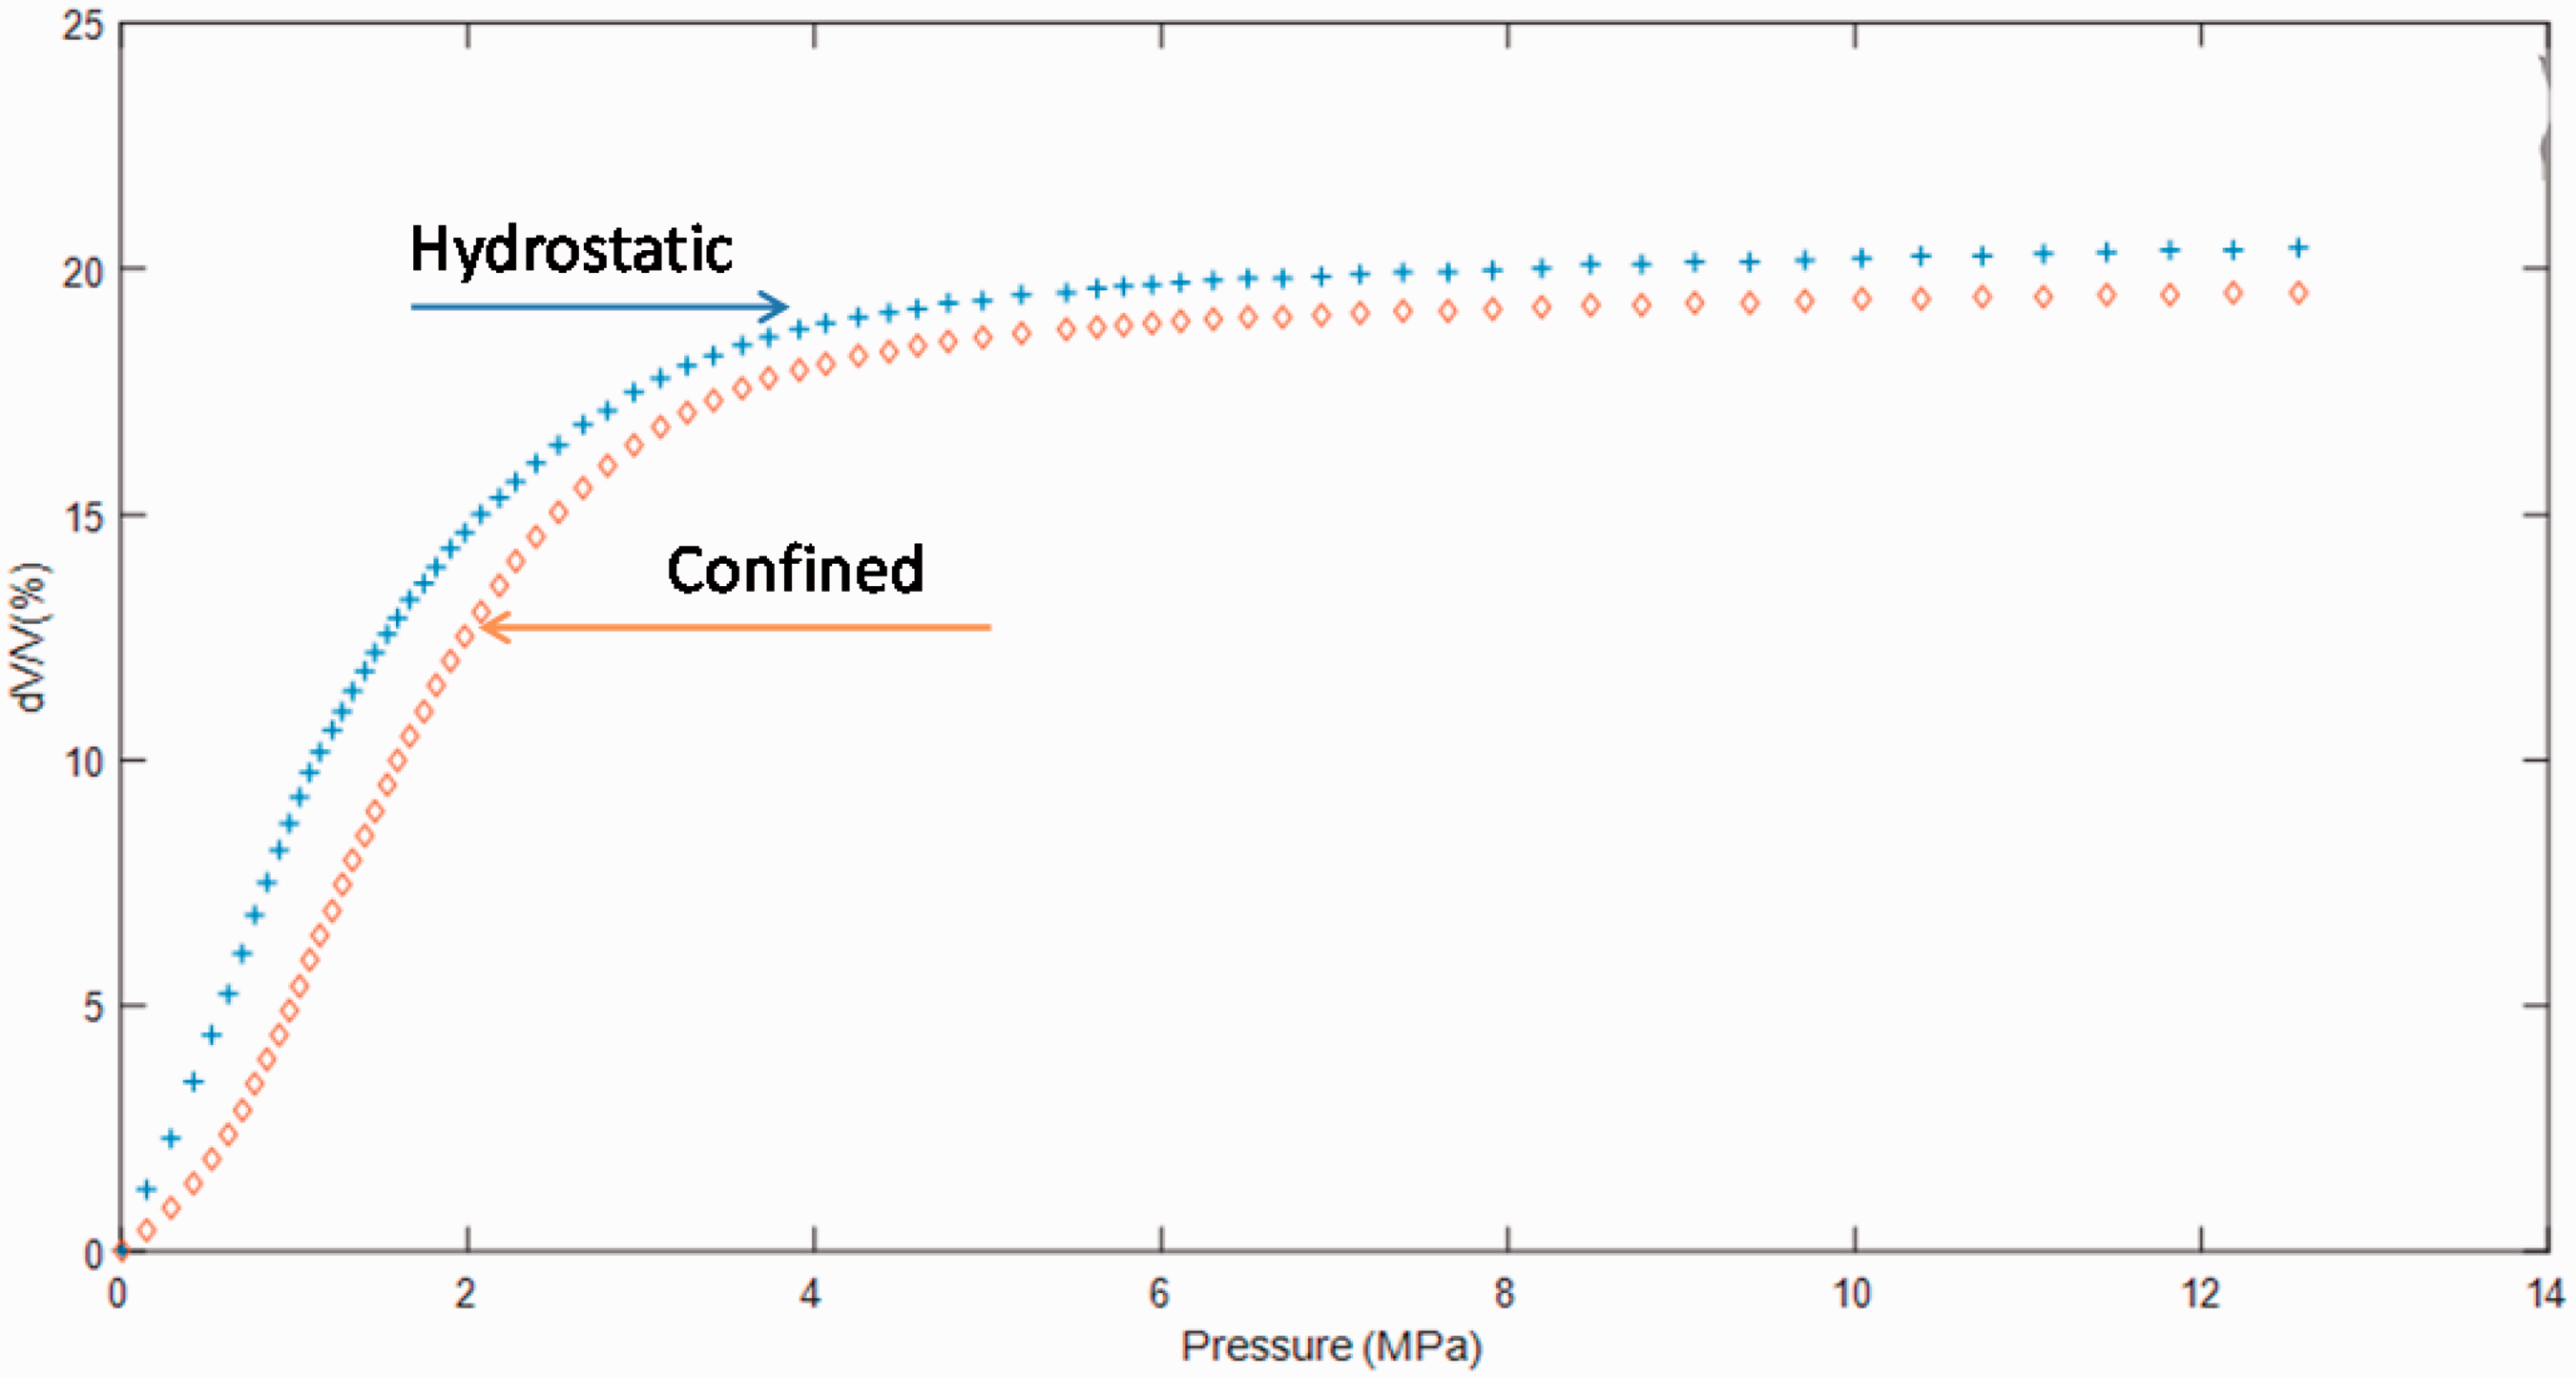
Behavior of the syntactic foam under hydrostatic and confined compressions. Variation of the compressibility dV/V versus pressure.
A compression test on microspheres without the host material has been performed to determine the Young modulus of the polymer constituting the microspheres shell. The microspheres were incorporated in ethanol, which is a more suitable solvent than water for the microspheres, and tested in a capillary rheometer using the protocol described earlier. The mixture microsphere/ethanol was then filtered to retain the microspheres, from which a few fractured microspheres (Figure 1) were extracted in order to measure the shell thickness.
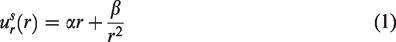
Knowing the thickness H, the previous compression test on microspheres has been used to determine their mechanical properties. The pressure is considered as hydrostatic and the following approximation is assumed: the radial displacement of the shell
Microsphere compression test and determination of the Young modulus Es of the polymer constituting the microsphere shell.
As was the case with the polymer matrix, it is assumed that the polymer constituting the microspheres has the same Poisson’s ratio as rubber: νs = 0.49. The shear modulus is then deduced from the Young modulus according to the relationship:
Model predicting the pressure/volume relationship
The modeling approach considers microspheres embedded in an unbounded host material with a hydrostatic pressure P applied in the ‘far-field’. The host material is a homogeneous elastomer assumed incompressible. The distribution of microspheres is characterized by their (outer) radius A, their shell thickness H (shell thickness to radius ratio X = H/A) and by their volume fraction Φ. The average radius  = A − H/2 and the average shell thickness to radius ratio
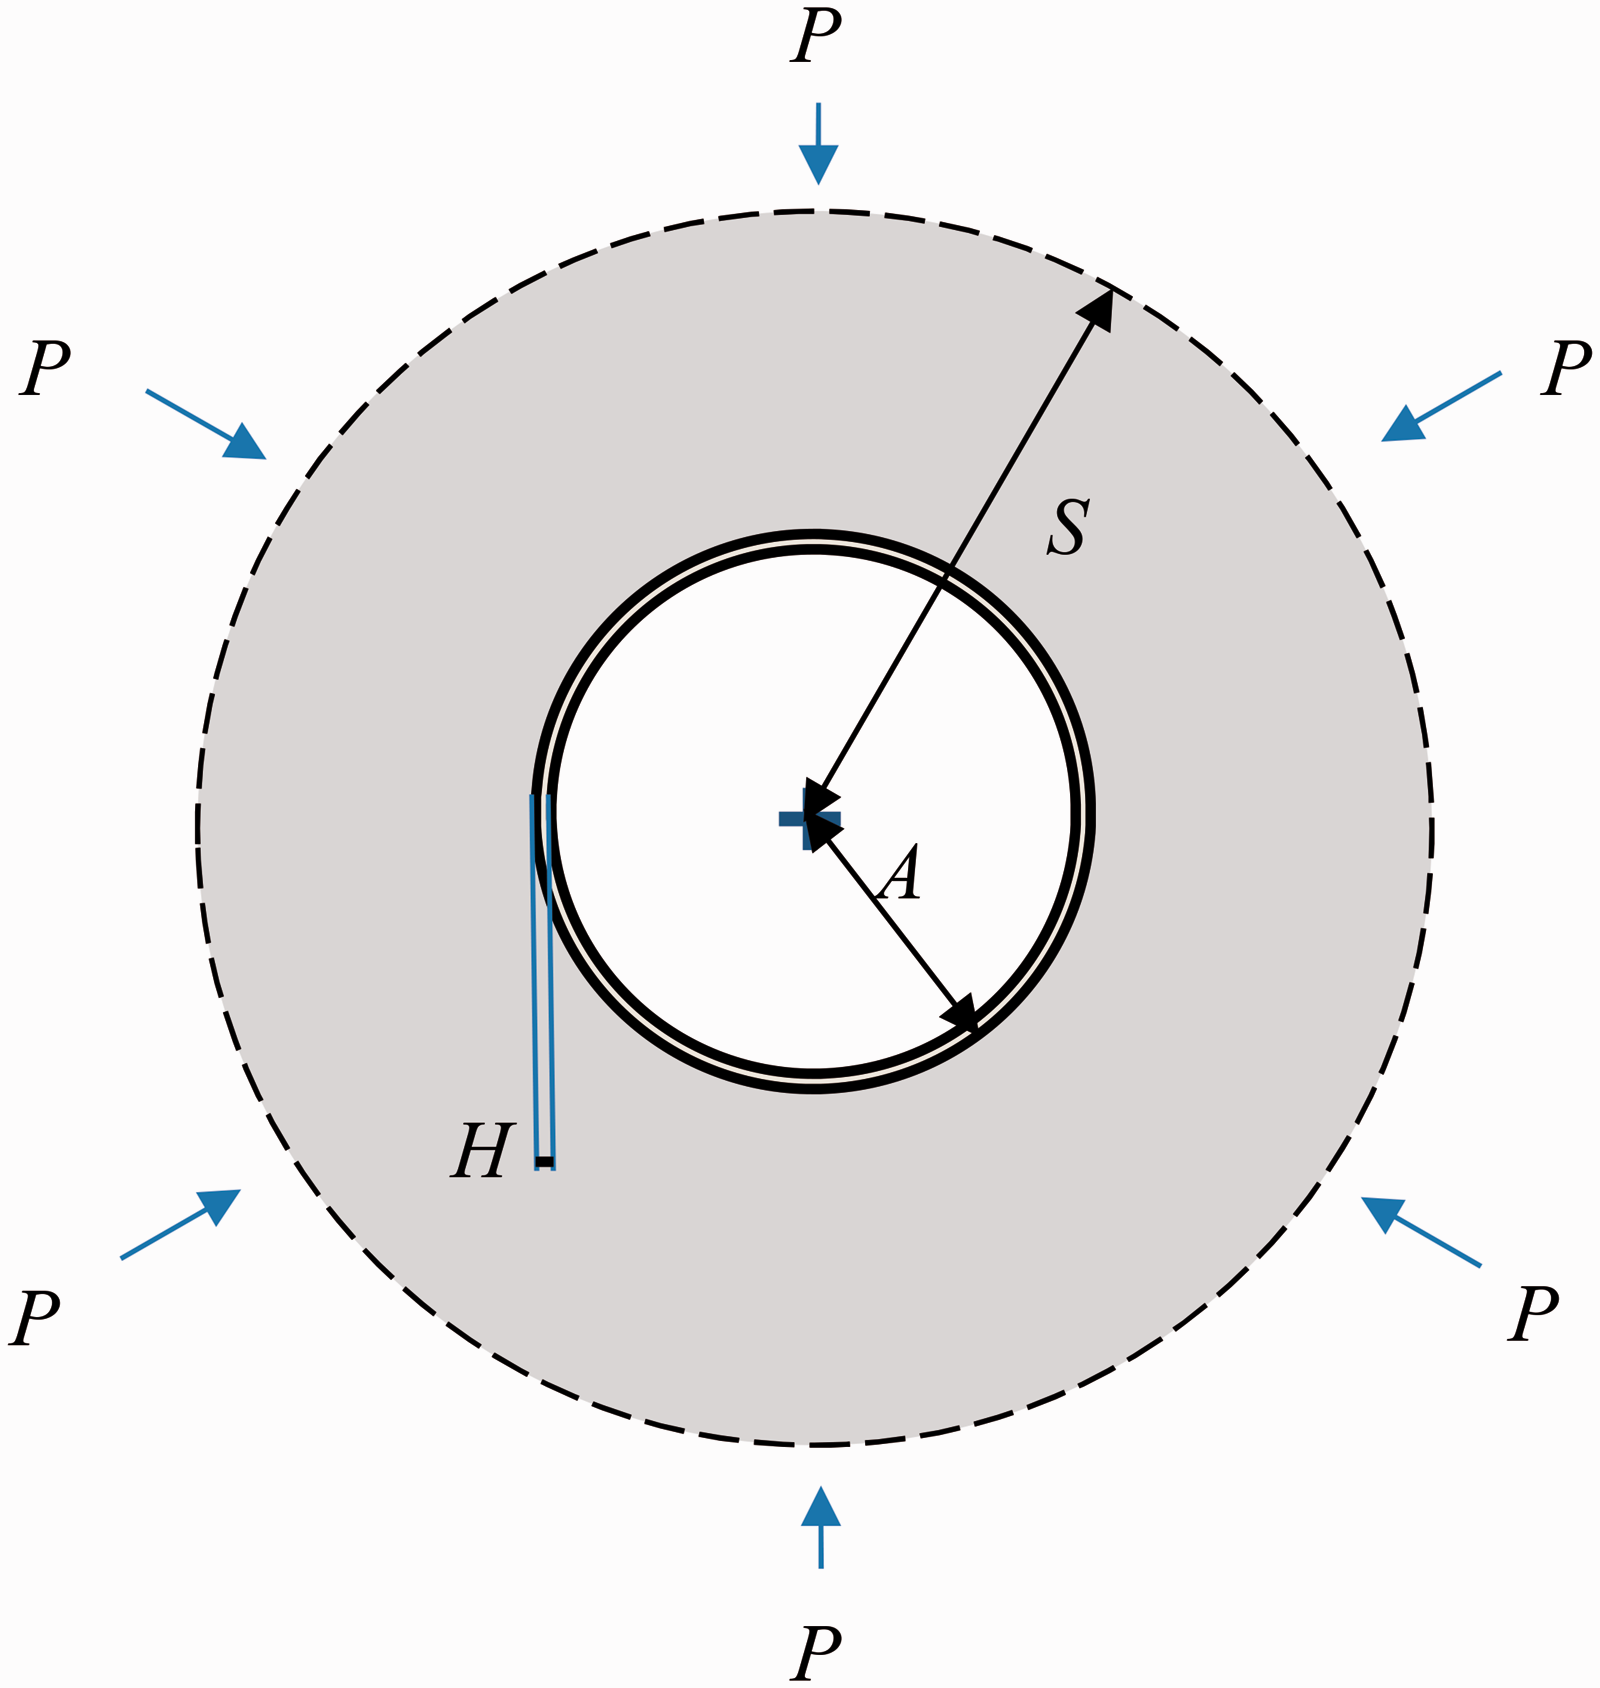
Representative volume element of the syntactic foam.
Critical pressure
De Pascalis et al. 18 chose to incorporate the notion of “critical pressure” in their model. The critical pressure Pc has been defined by Fok and Allwright 16 as the pressure which separate two different mechanical states of the medium. If P < Pc, the microsphere and the matrix remain in their linear domain and the problem is linear elastic (pre-buckling). If P > Pc, the microsphere buckles, becomes non-spherical and thus the problem is nonlinear (Figure 6).
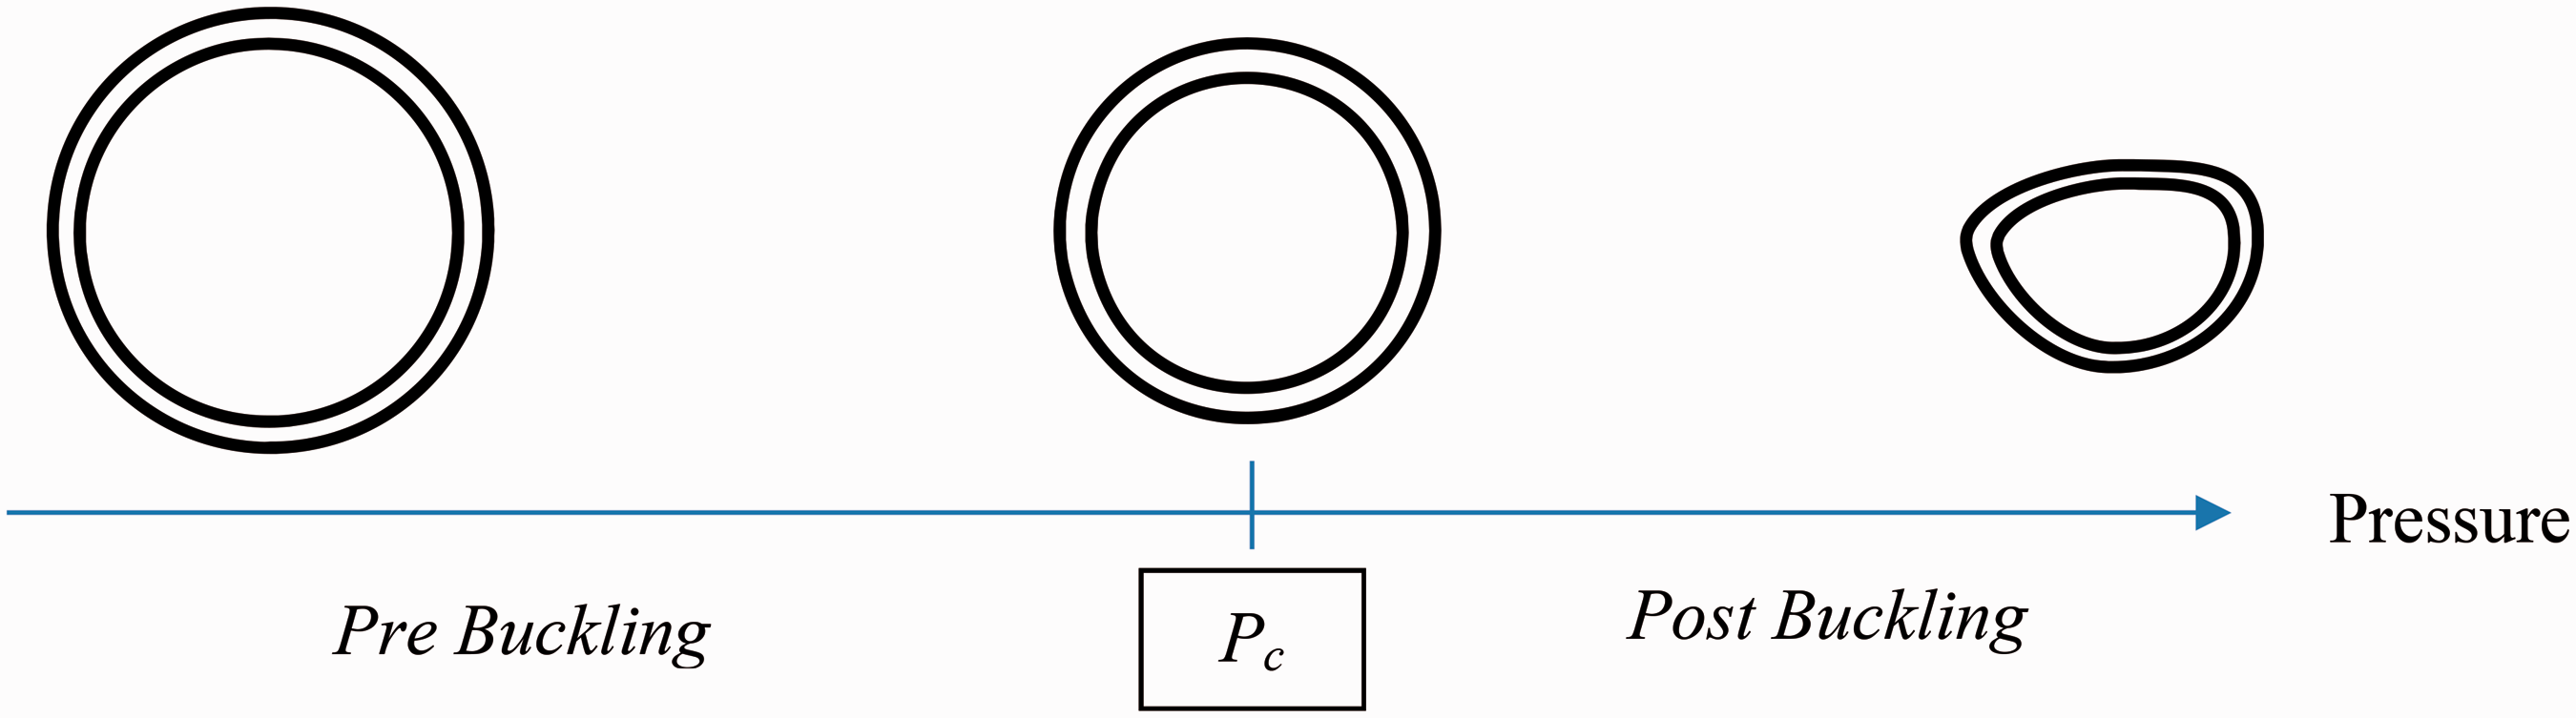
Definition of the critical pressure Pc.
In order to find Pc, Fok and Allwright
16
develop an analysis based on the energy method together with a Rayleigh–Ritz trial function. They derive a function p(

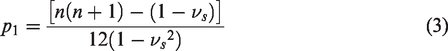

From these equations, several pairs
Pre-buckling state: P < Pc
In the pre-buckling state and under the assumption of linear isotropic elasticity, the governing equations of the corresponding static boundary value problem with no body forces are given as follows
18
:
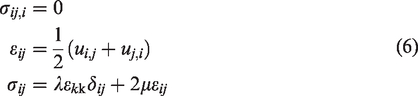
σij, εij, and ui denote the components of the stress and strain tensors and the displacements, with δij the Kronecker delta tensor. λ is the first Lamé constant defined by
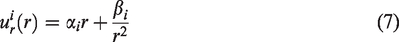

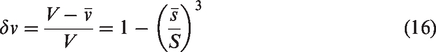
The deformed radius of the elementary portion of medium is determined as s = S +
Post-buckling state: P > Pc
If P > Pc, the microsphere buckles and the problem becomes more complex. De Pascalis et al.
18
proposed then to consider a statically equivalent problem, where the microsphere is replaced by an inclusion of gas with an artificial pressure

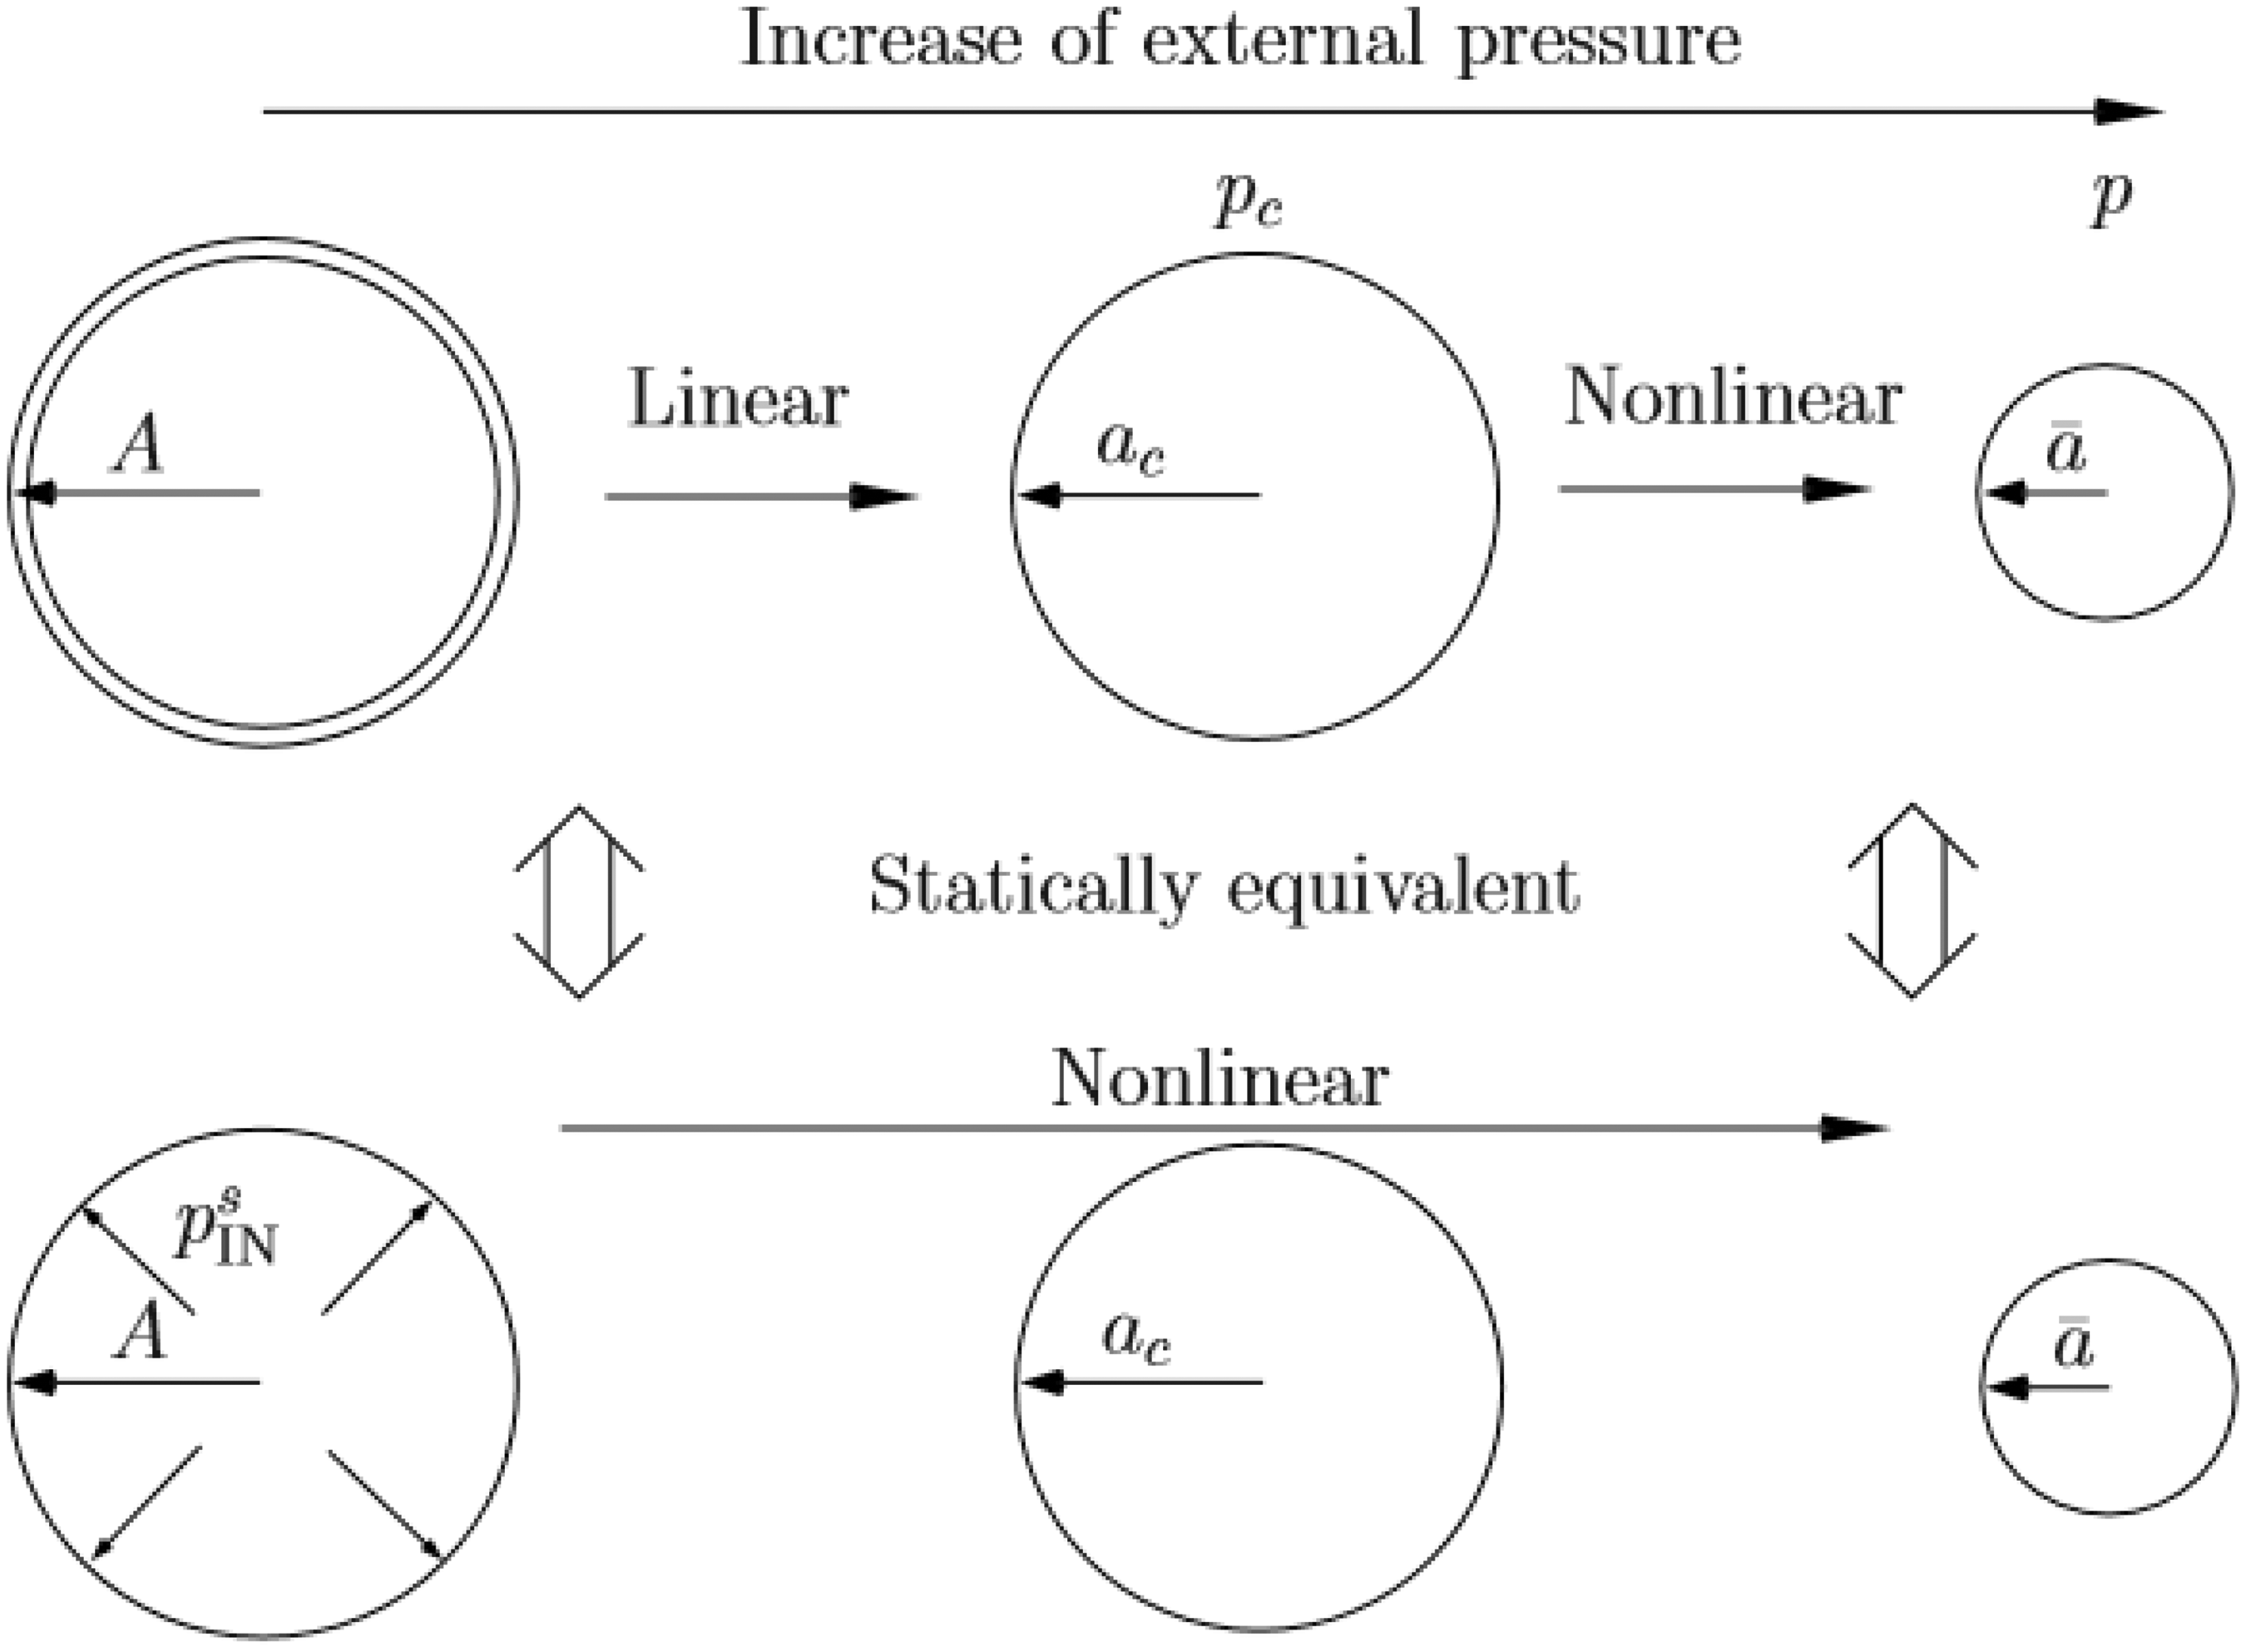
Statically equivalent problem with internal pressure Pins, which ensures the correct radius for P = Pc.
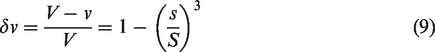
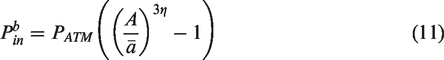
De Pascalis also considered that, since the volume change in the post-buckling state can be very important, the gas inside the cavity can be compressed so much as to act to stiffen the material. They introduced a Boyle’s law type relation for a massless ideal gas, of the form:

In the radially symmetric case, assuming the matrix is incompressible and the absence of body forces, the compressive stress is given by the single ordinary differential equation:


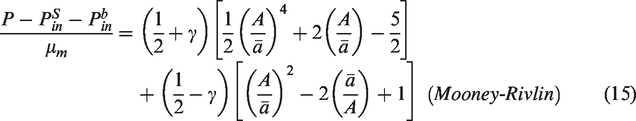
It is noteworthy that De Pascalis did not use the usual empirical material constants C1 and C2 for the Mooney-Rivlin model. Instead, he chose to set
Predicted vs. measured compressibility
Numerical results yielded by the model described in the previous part are compared to the pressure-volume measurements performed on the polyurethane syntactic foam. Using the equation of Fok and Allwright,
16
the critical pressure is determined for each size of microsphere before applying De Pascalis’s model. The material constant
Predicted and experimental pressure/volume curve of a syntactic foam.
Interestingly, the best fit is obtained for
Comparison between De Pascalis’s and Gaunaurd’s models.
Despite the problems mentioned earlier, De Pascalis’s model is overall better than Gaunaurd’s model. It fits better the measurements at low pressure and the maximum volume change is reached later than with Gaunaurd’s model.
However, the De Pascalis model does not correctly predict the buckling pressure Pc. In fact, the simulation shows that this critical pressure is three times higher than the theoretical one from the best fitting of the experimental curve in Figure 9. Unfortunately we did not try any observation of this buckling mechanism. The SEM images show the largest broken spheres at the end of the pressure experiment. This mechanism has been studied in the literature (see for example Lachambre et al. 20 and Kartal et al. 21 ) for glass-sphere syntactic foam under hydrostatic pressure using X-Ray tomography. Bardella et al. 22 recently studied the different failure modes depending on whether the surface of the composite is painted/coated or not. In fact, these studies show that the mechanisms of buckling or failure are complex and of a different natures.
Critical parameters of the model
Influence of microsphere size and distribution
The importance of key parameters appearing in the model has been assessed, starting with the predefined size of the microspheres and their size distribution. The approach consists in analyzing the pressure/volume curves predicted by the model for several Gaussian distributions (Table 1) with various standard deviation and mean size. The distribution “A” is the actual size distribution of the microspheres used in the synthesis of the syntactic foam. All the other material parameters are those used earlier and remain unchanged.
Gaussian size distributions tested.
Distributions A, B, C have the same mean value but different standard deviations, as illustrated by Figure 10(a). It appears that the standard deviation has a very limited impact on the compressive behavior of the syntactic foam (Figure 10(b)). The only change concerns the transition between linear and non-linear state in the model, which appears to be smoother with a larger distribution, in agreement with De Pascalis’s work. A quite narrow distribution of microsphere (A) has been used for the synthesis of the syntactic foam tested earlier, which can explain why the linear to non-linear transition seems rather sharp in the previous pressure/volume curves.
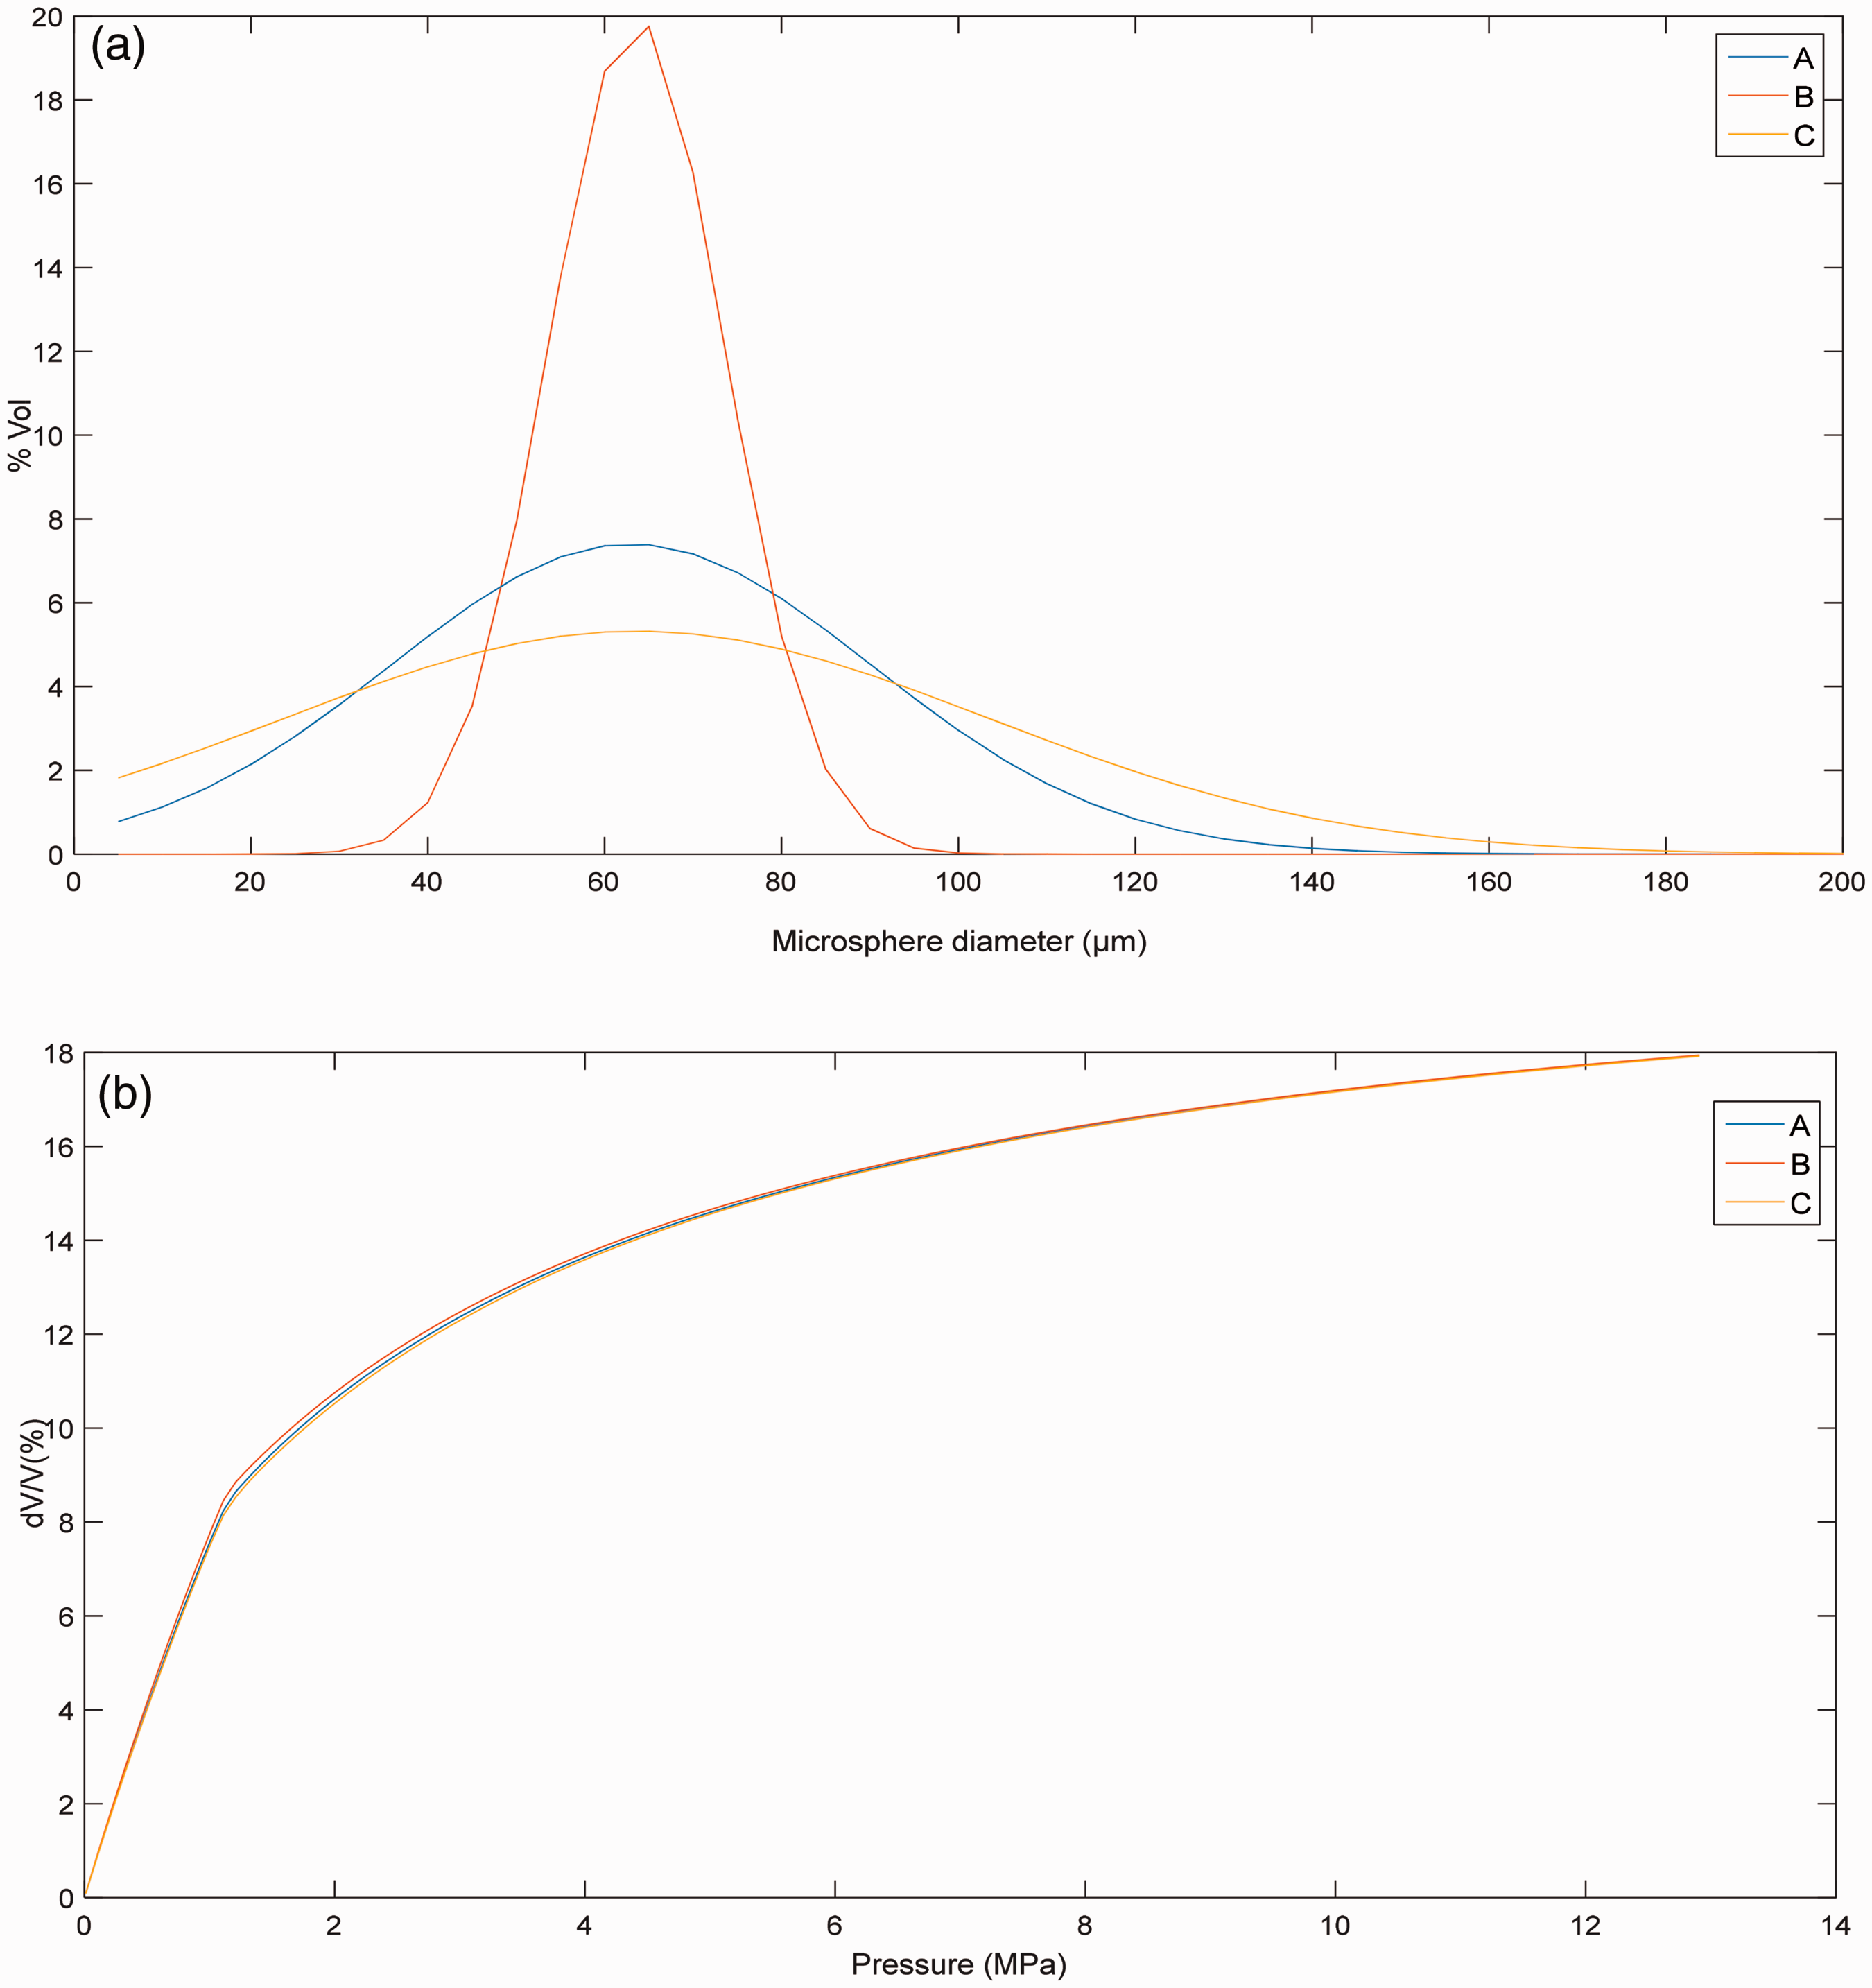
(a) Microsphere size distributions A, B and C. (b) Predicted compressive behavior of syntactic foams using microsphere size distributions A, B and C.
Distributions A, D, E have the same standard deviation but different mean values, as illustrated by Figure 11. In other words, we model the compression of syntactic foams made with larger microspheres but with the same microsphere volume fraction of. Again, the model predicts no significant impact of the mean value of microsphere radius.

(a) Microsphere size distributions A, D and E. (b) Predicted compressive behavior of syntactic foams using microsphere size distributions A, D and E.
Influence of Em and Es
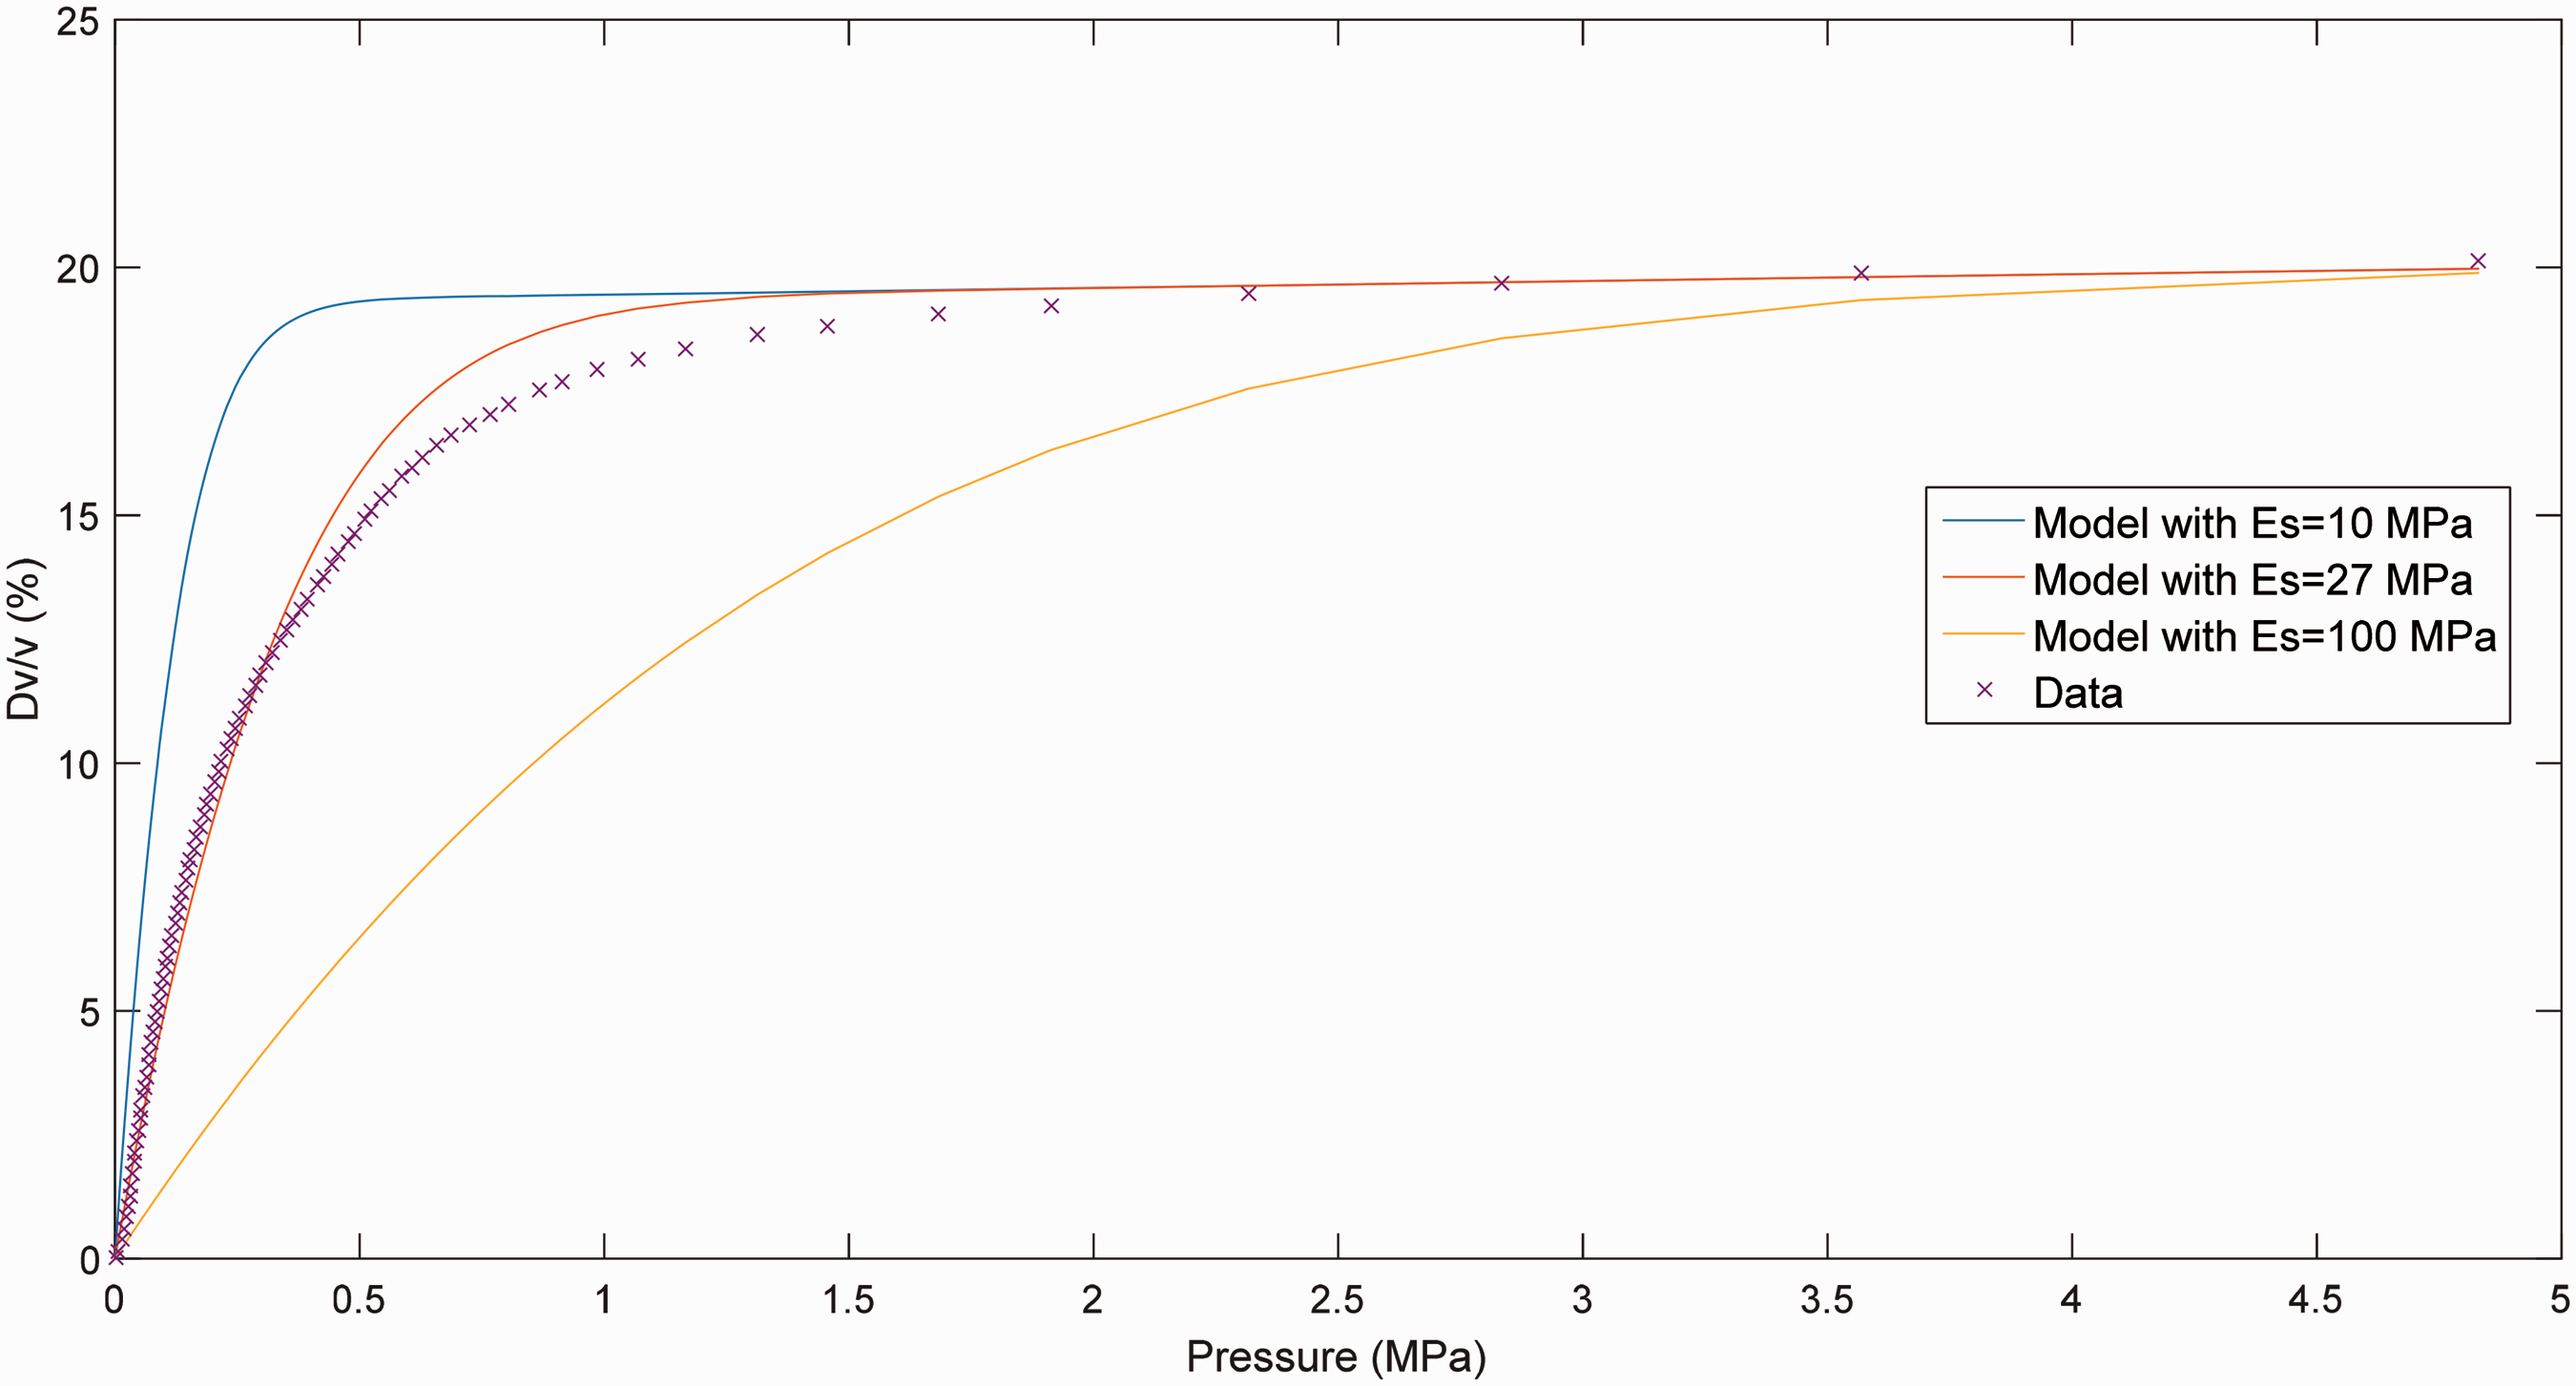
The influence of the mechanical properties of both the microsphere material and the matrix material on the compression behavior of the syntactic foam is investigated. The default microsphere distribution “A” is used in this part. Figure 12 shows the influence of the Young modulus of the shells Es, ranging from 10 to 40 MPa. It appears that higher values of Es lead to lower volume changes at intermediate pressure (2 to 4 MPa), but final volume changes converge at high pressure in all cases.
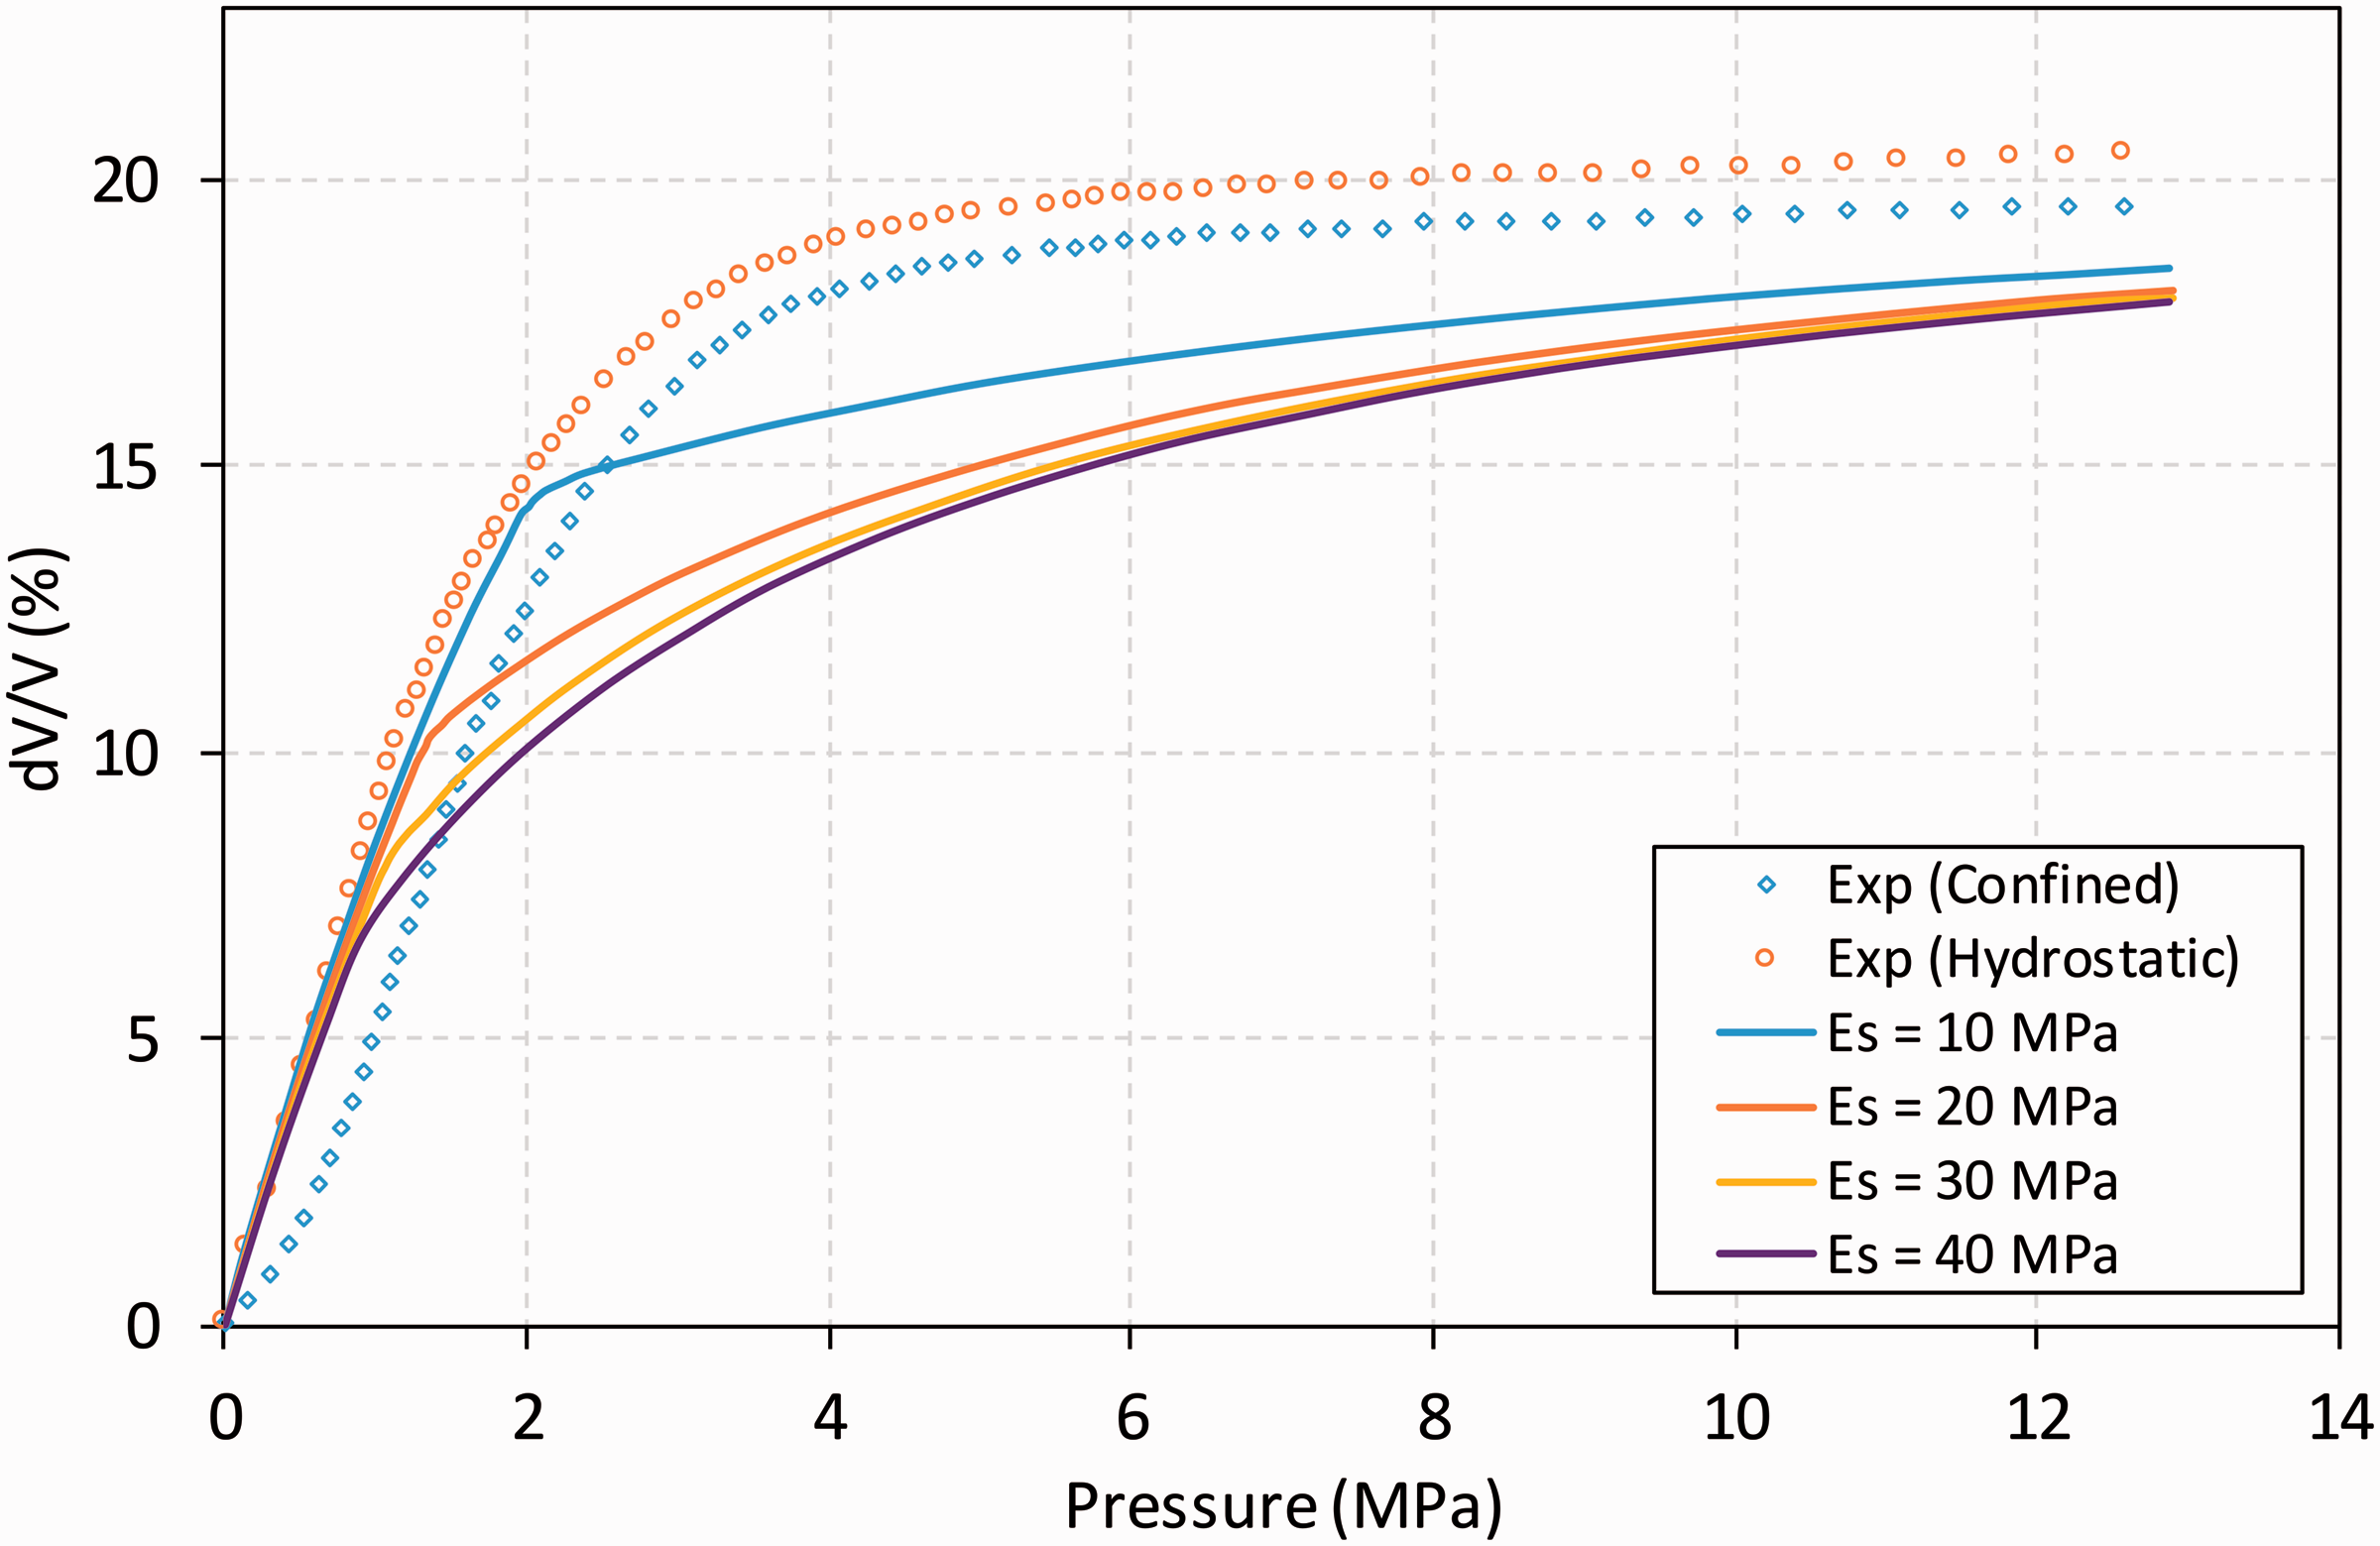
Predicted compression behavior of syntactic foam for various values of Es (experimental measurements reported for reference).
Figure 13 shows the influence of the Young modulus of the matrix Em, ranging from 1 to 15 MPa. As expected, a significant reinforcement of the foam is observed, with a lower volume change at both intermediate and high pressures. Therefore, it appears that reinforcing the matrix of the syntactic foam is the only way to change its behavior under pressure.
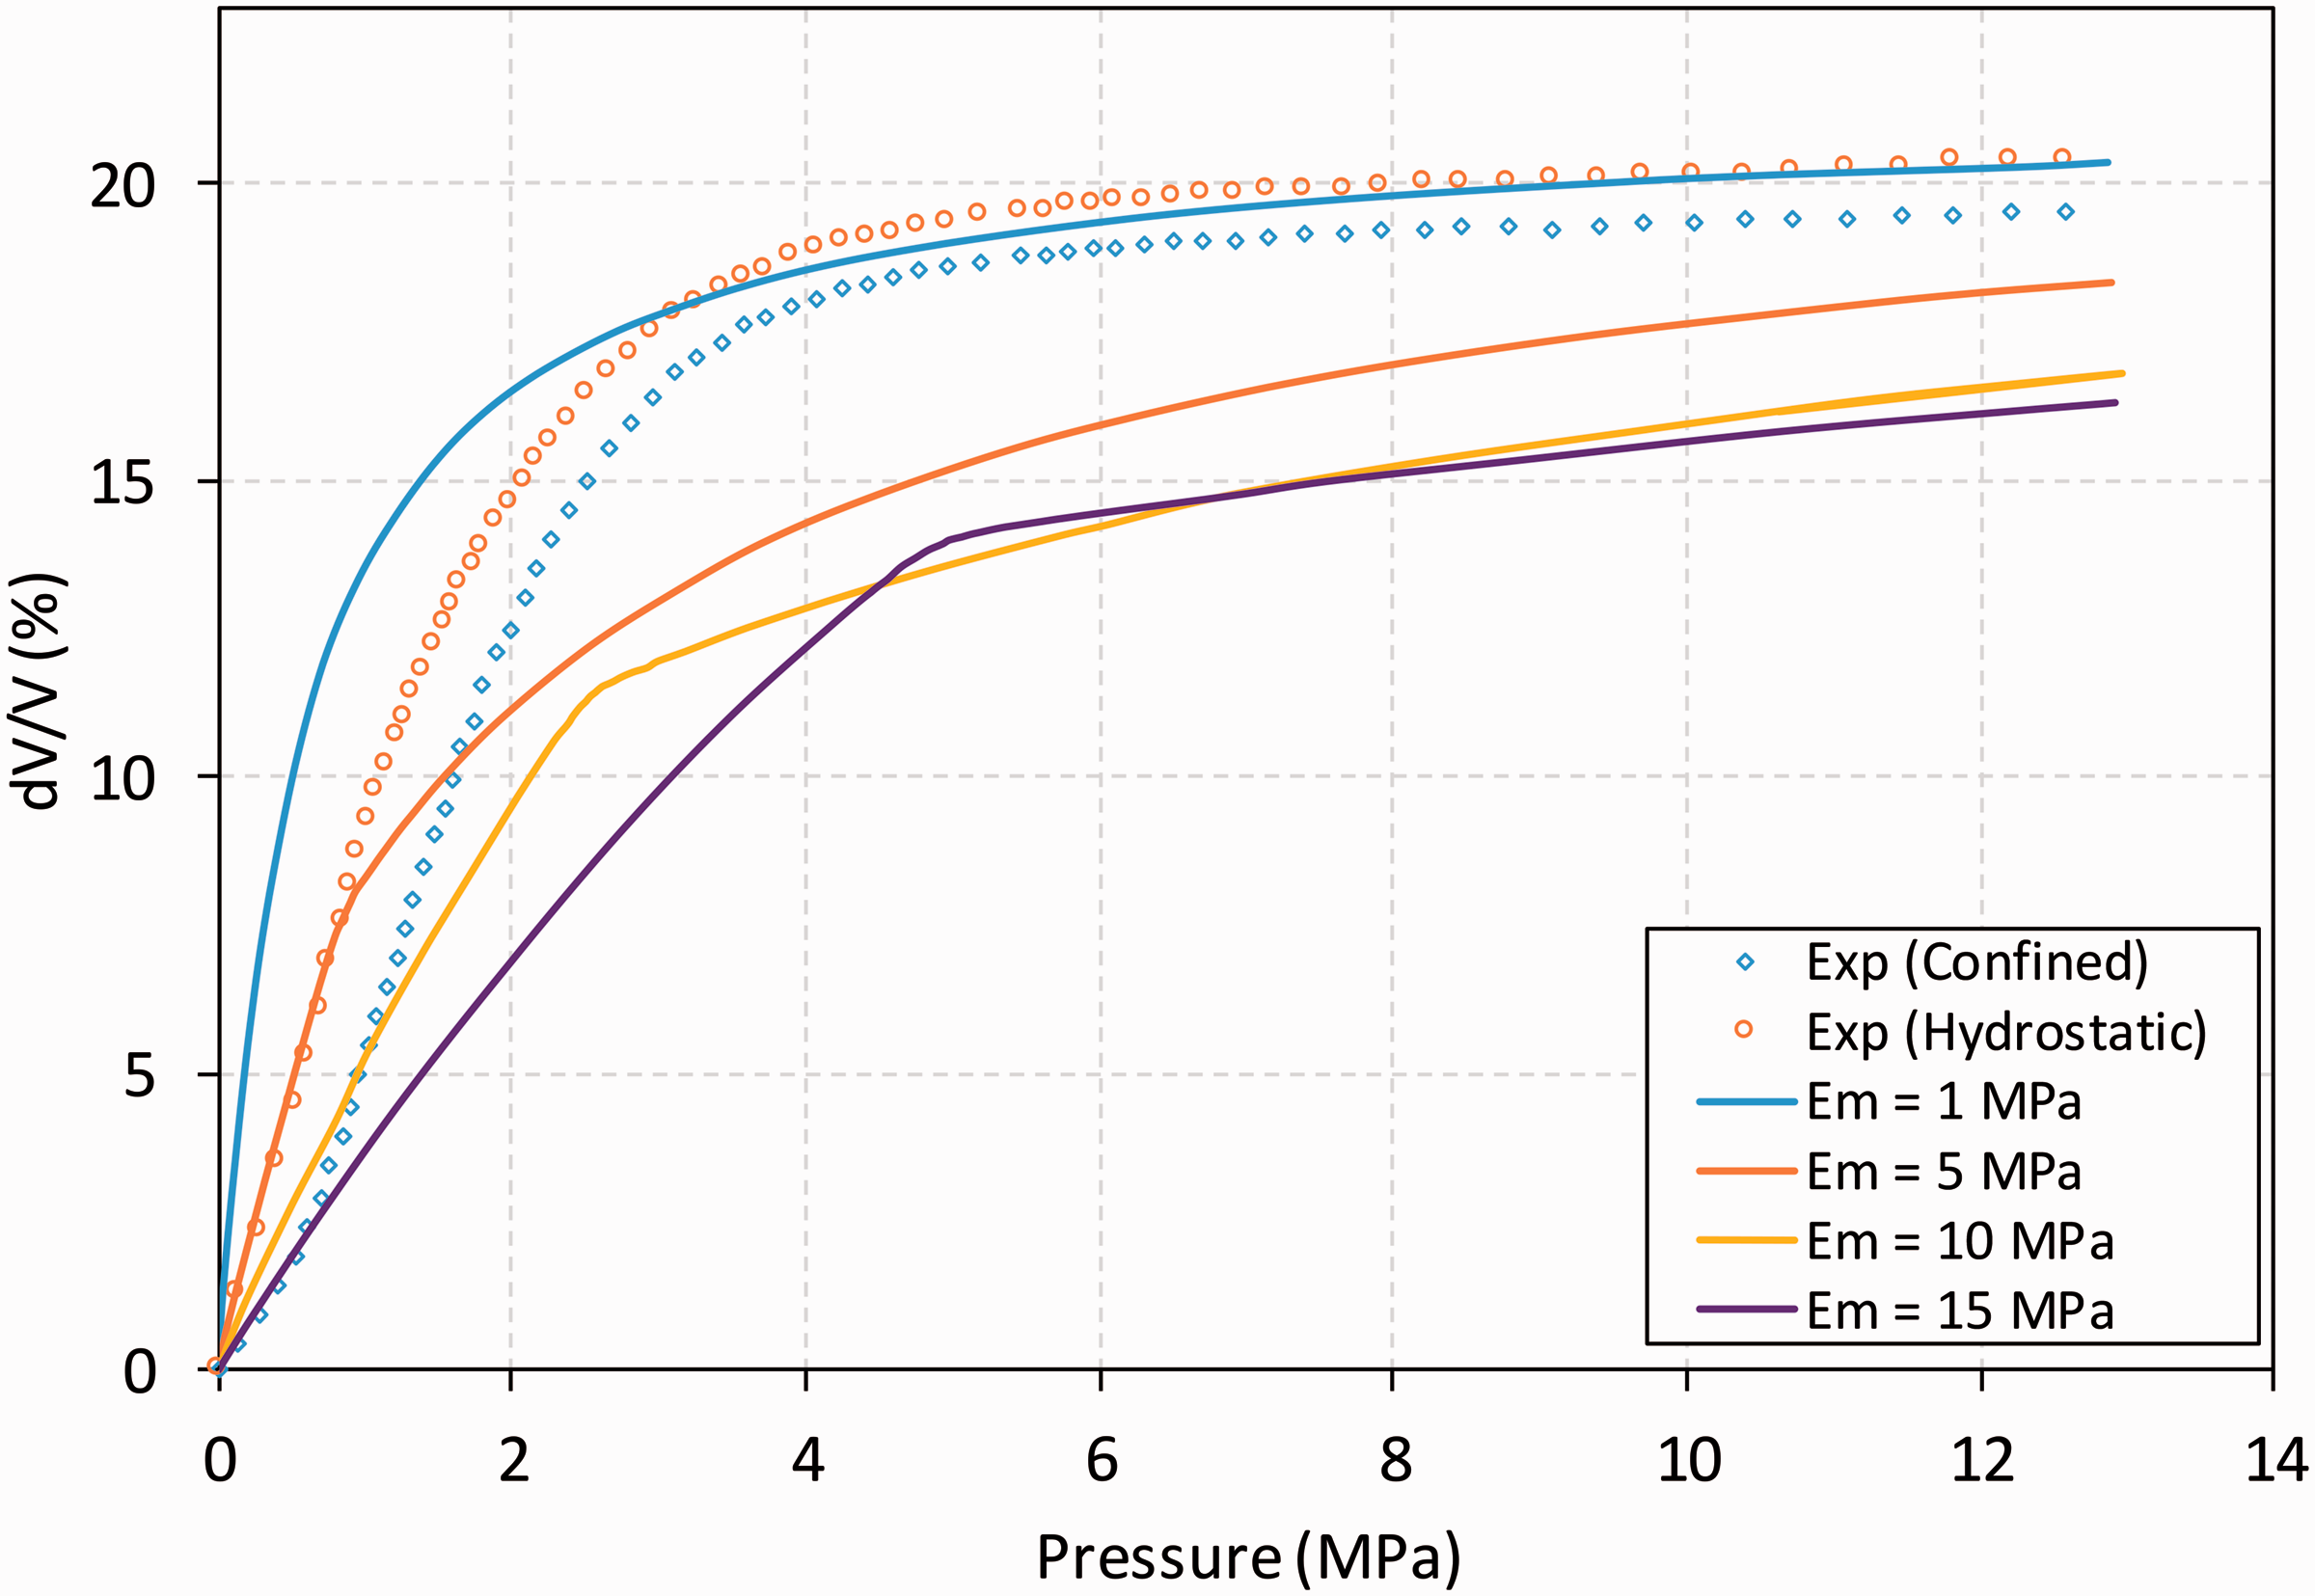
Predicted compression behavior of syntactic foams for various values of Em (experimental measurements reported for reference).
Conclusions
A comparison between the pressure-volume relation predicted by De Pascalis 18 and the actual compression data of a syntactic foam has been presented. The compression tests have been performed in an innovative way with the help of a capillary rheometer and a PVT accessory for the hydrostatic compression, and a more conventional system for the confined compression. Both tests lead to quite similar behavior except that the confined compression is delayed with respect to the hydrostatic compression. This difference is probably due to the fact that in the confined experiment, the compression is purely uniaxial until the sides of the cylindrical sample come into contact with the walls of the apparatus.
The model proves to be fairly accurate at low pressure and high pressure, despite a notable difference the mid-pressure range. The use of the critical pressure Pc, determined in accordance with the theory of Fok and Allwright, 16 seems to be applicable to the compression of such a foam. Indeed, few differences were observed between the experimental data and the model results in the pre-buckling state. De Pascalis’s model seems better than most models currently being used.
The poorer quality of the prediction at intermediate pressure can be explained by the use of the material parameter γ instead of a more accurate hyperelastic material model, such as the original Mooney-Rivlin formulation. Moreover, De Pascalis’s model neglects any mutual interaction between microspheres in both the buckling analysis and the determination of the volume change of the composite foam, which can affect to some extent the validity of the far-field pressure assumption. Hence, this simplification could also explain the discrepancies in volume change between the model and the experimental data, since a relatively high volume fraction (Φ = 0.2) is used for the present foam.
Nevertheless, the model can be used confidently to determine which material parameter affects the most the compression. It is shown that within the range of parameters considered in this study and for higher pressures, the size distribution of microspheres and the mechanical properties of the microspheres’ shell have a limited influence on the compression behavior. As a result, in the present conditions (in particular for the range of achievable microsphere shell module values), reinforcement of the matrix seems to be the only efficient way to limit the volume change of the syntactic foam under pressure.
Footnotes
Declaration of conflicting interests
The author(s) declared no potential conflicts of interest with respect to the research, authorship, and/or publication of this article.
Funding
The author(s) received no financial support for the research, authorship, and/or publication of this article.