
Abstract
Simulation of the microstructure of materials is not usually an efficient approach to estimate the mechanical response in the macro-scale porous components. This paper establishes an adaptive numerical model which reflects the effective mechanical properties of the elastomeric foam materials in the macro-scale, based on the material response in local points. The proposed adaptive model is capable of characterizing the dominant state of stress at each section point and assigning the corresponding mechanical properties from a developed material library. This material library can propose different stress-strain responses of the foam material based on mechanical characterization experiments and using the best-fit energy functions. The material of study is an elastomeric foam with a blend of Polyethylene/Ethylene-vinyl acetate (PE-EVA). The efficiency and performance of the adaptive model were examined using two practical case studies, in which the material was exposed to multiaxial stress conditions (a foam beam and a composite sandwich beam with a foam core under a concentrated loading). The adaptive model accurately predicts the dominant response of the foam beam and composite sandwich beam under flexural loading conditions. However, the uniaxial hyperelastic material models, calibrated by the pure tensile or compressive response of the foam material, dramatically overestimate or underestimate the experimental results.
Keywords
Introduction
Nowadays, there is an increasing demand for the application of syntactic porous materials such as foams in the various industrial fields such as biomechanical, aeronautical, naval, chemical, and civil engineering due to their specific advantages such as the high ratio of energy absorption and resilience with high elasticity. 1 However, there is a lack of fundamental understanding of the complex mechanical response of these materials under various loading conditions. Generally, the mechanical response of the foams is governed by two following physical characteristics of these materials: (1) the mechanical properties of the base material (i.e., the mechanical response of constituent materials of the cells) and (2) the morphology of the cellular structure (e.g., the density of the pores, the lengths of the ligaments, and structural geometry of the cells).1–4 From the mesoscale point of view, the deformation of the cell components in the foams depends on the mechanical properties of the base material. For example, the stretches of the cell walls in an elastomeric foam are mainly recovered due to the resilience of the material, 5 while the ultimate strength of the cell ligaments in a metallic foam is determined based on plastic response. The porous materials such as composites are comprised of the base material from which the components of the cell are made and the pores with zero response. The pores provide enough space for internal movements in the cell network. These movements are estimated by attributing rotational degrees of freedom in the joints between the ligaments.6,7 The establishment of a bridge between the micro/meso-mechanical features of the foams and their macro-scale mechanical properties has been extensively studied in recent decades.8,9
Some researchers investigated the mechanical response of the complex materials by selecting a representative unit volume (RUV) from the bulk volume to investigate and understand the load-carrying mechanism in this RUV.10–13 Then, the simulated mechanism based on the RUV was adopted for the simulation of the macro-scale load-carrying behavior of the bulk material under various loading conditions. Yu and Tang14,15 used a variational asymptotic method to homogenize a unit volume for the foams, which led to the development of accurate FE models to calculate the effective properties of the foams under various loading conditions.8,9,16,17 Skrzat and Eremeyev
18
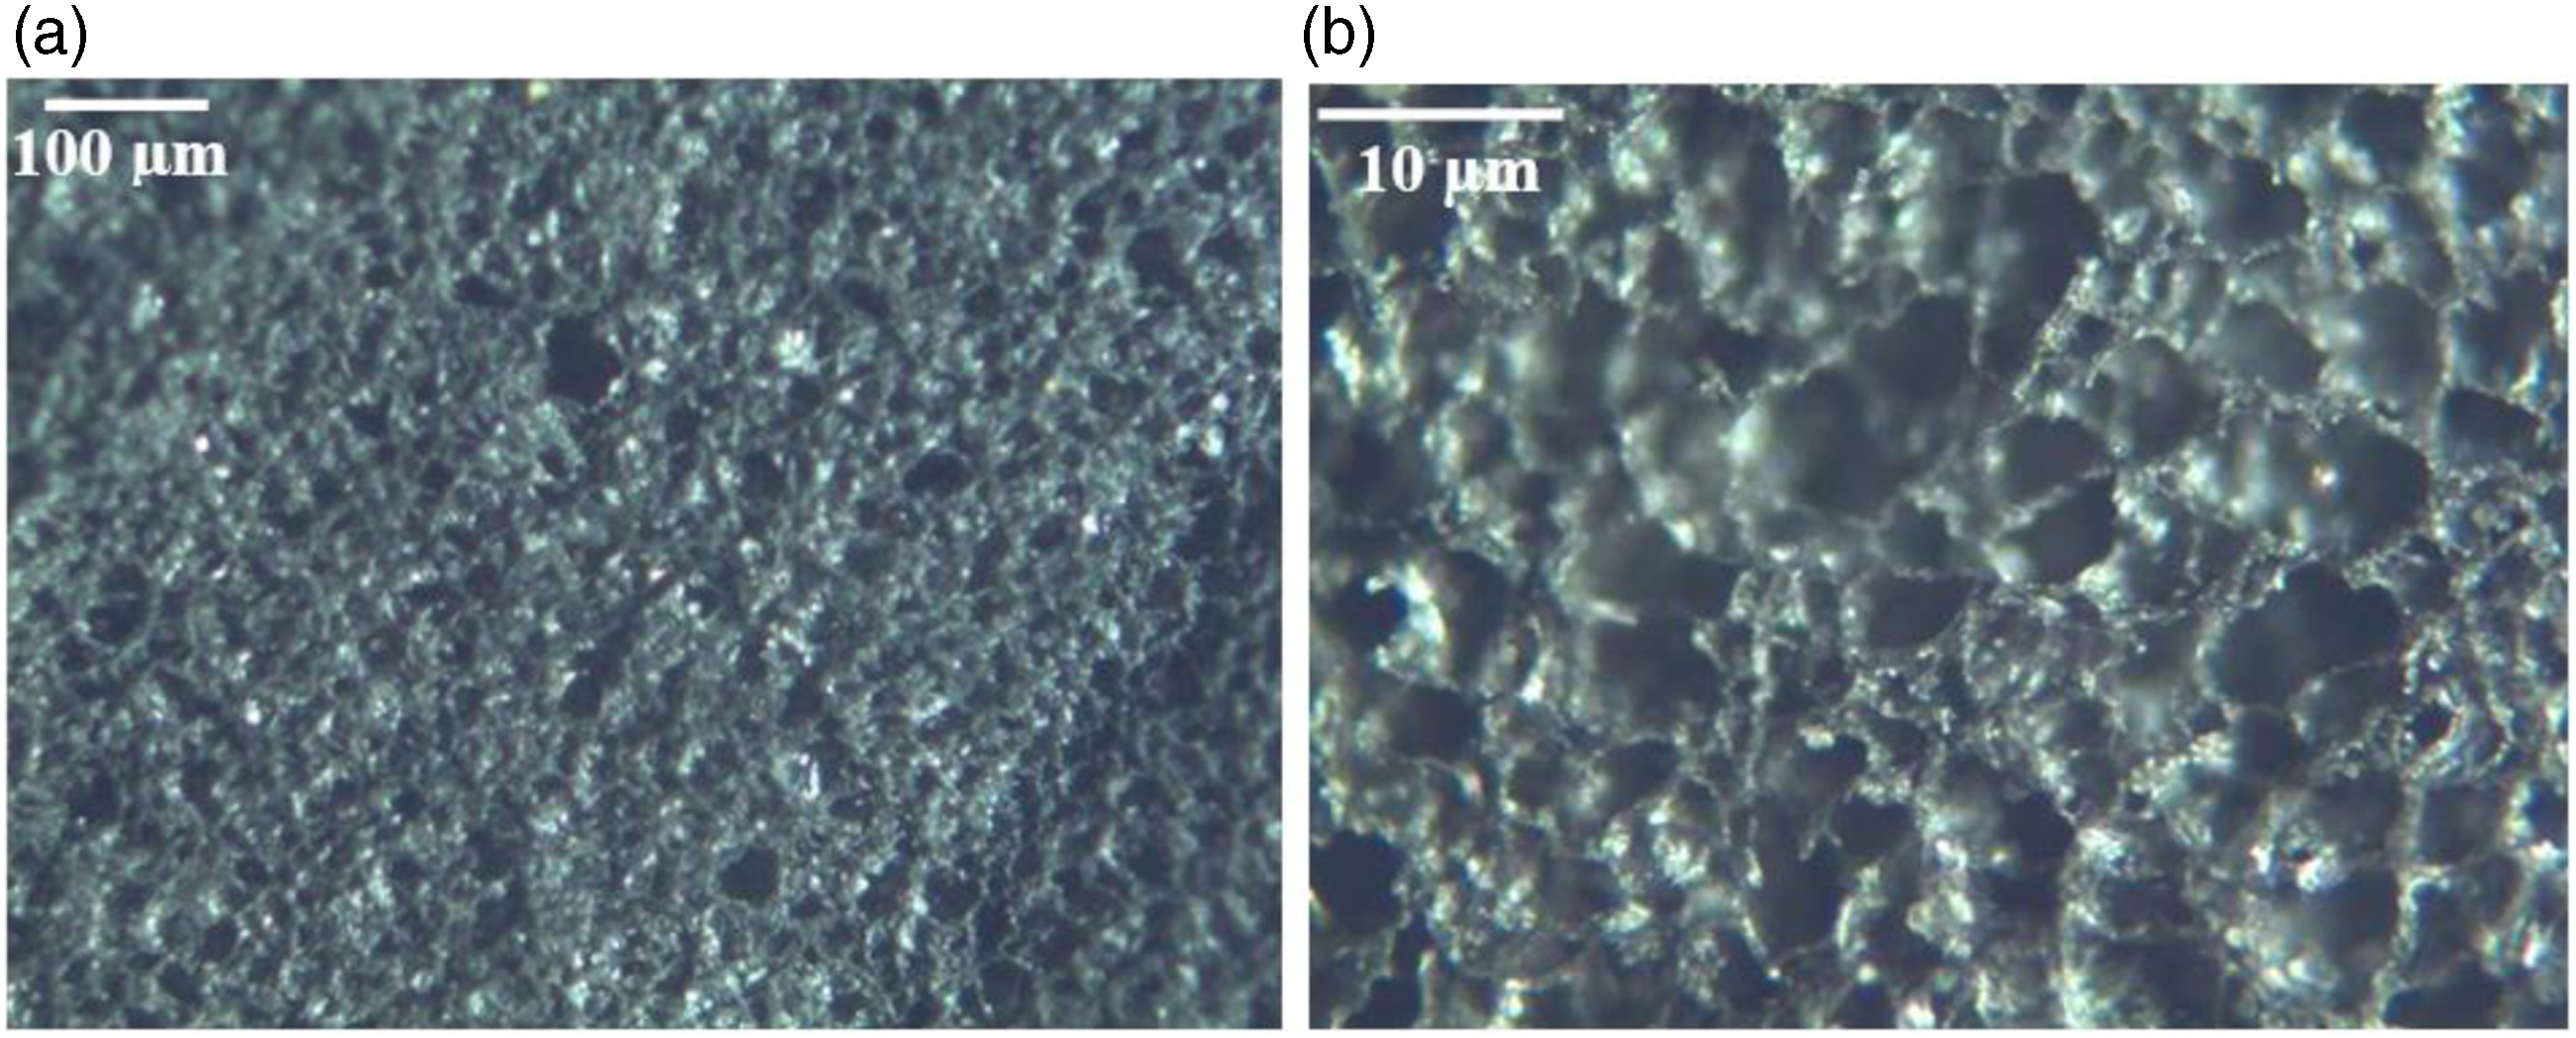
used tomography of an Aluminum foam specimen to develop its geometric model to examine the response of the foam under various stress conditions and obtain the elasticity tensor. The application of the RUV method, although can provide accurate predictions from the material response, it can lose efficiency in the simulation of the elastomeric foams with irregular space of pores in terms of size and orientation such as PE-EVA (Polyethylene/Ethylene-vinyl acetate) foam, as shown in Figure 1.
19
Additionally, the material of the unit cells such as the Kelvin cell, considered for developing RUVs, usually has a linear stress-strain response.
20
However, this is not representative of the actual behavior of the elastomeric foams. Therefore, a well-known strategy seems to be the application of calibrated models to approximate the real behavior of the materials under various loading conditions. For example, a plasticity criterion has been implemented by Deshpande and Fleck21,22 for simulating the crushable foams. The strain energy functions were also largely utilized to model the hyperelastic response of the elastomeric foams.
23
Since the objective of this paper is related to the application of the strain energy functions, the following section discusses the current state-of-the-art of these energy functions and the research needs. Porosity space in an elastomeric foam (PE-EVA) obtained by an optical microscope with two magnification factors: (a) 40X and (b) 600X.
16
Strain energy functions
The customary strain energy functions to model the hyperelastic response of the materials consist of: (i) the polynomial functions which are determined using the stretch invariants, known as the Mooney-Rivlin models 24 and (ii) the functions which are established by incorporating the stretch ratios in the principal directions such as Ogden model. 25 Sussman and Bathe 26 described the performance of some rubber-like materials using a displacement-pressure finite element formulation based on Mooney-Rivlin and Ogden models. Markmann and Verron 27 categorized 20 hyperelastic models, proposed by various researchers into three groups of phenomenological, empirical, and physically-based models. Also, in the case of compressible elastomeric materials, some pseudo-elastic models were proposed to comprise additional terms associated with volumetric deformations.28–31 Zhang et al. 32 proposed a pseudo-elastic function based on the Ogden model for the simulation of the stress-strain response in polypropylene foams and captured the residual strain effects in the energy function. However, their study was limited to the investigation of the response of the foams under simple loading conditions.
Investigation of the effective properties in complex materials has been discussed in the literature, especially in the case of composite materials.33–35 Barzegari and Rodrigue 36 investigated semi-rigid foam beams under three-point-bending (3PB) conditions and indicated that an accurate model for the flexural response must consider the compression modulus of this material different from the tensile modulus depending on the type of stress on the section points. Nazari et al.19,37 calibrated various strain energy functions using different mechanical experiments for the elastomeric foam. Yang et al. 38 considered the performance of polypropylene foam under uniaxial and biaxial compressive and 3PB conditions to calibrate an energy function according to the Ogden model which is capable of simulating the material response under cyclic loading conditions. Carranza et al. 39 conducted tensile, compressive, and punch shear tests on the PVC foams and calibrated the mechanical parameters using the formula proposed by Deshpande and Fleck 21 to simulate the load carrying and damage response of the foam under indentation test. While several studies have investigated foam materials under complex stress conditions, the concern is that by exposing an elastomeric foam to a complicated stress condition, the effective mechanical properties of the material may not be taken into account by a unique energy function fitted by irrelevant experimental data.
Usually, it is recommended that for obtaining a more valid energy function to simulate the comprehensive response of foam materials under various loading conditions, the energy function needs to be calibrated by the various experimental data obtained from different tests. However, it seems that such a suggestion may provide acceptable accuracy when a relatively low range of loading is applied to the foam. By the increase of the stress level, the stress-strain responses under different states of dominant stress on the material (compression, tension, or shear) diverge largely.40–42
This paper proposes a novel adaptive model that uses a material library composed of different energy functions, calibrated by the different responses of a hyperelastic material under various states of stress, capable of reflecting the effective mechanical properties at each section point of a component according to the dominant stress conditions. The validity of this model first was investigated by simulation of the simple experiments in the elastomeric foams. Then, the adaptive model was exploited to estimate the load-carrying mechanism of the foam under multiaxial states of stress, observed in a bending foam beam and a bending foam-cored composite sandwich beam.
Evaluation of the accuracy of the well-known strain energy functions
This section investigates the efficiency and accuracy of the well-known energy functions to utilize for the adaptive modeling of foam materials. These functions have been used in previous studies
43
for simulation of the hyperelastic response in elastomeric and rubberlike materials. Using ABAQUS,
40
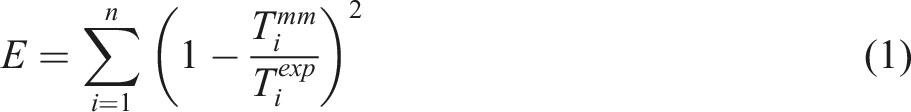
given a set of data for each mechanical characterization experiment, the constants for each energy function were determined through the least-squares-fit procedure. The accuracy of these energy functions is independent of the morphology and size of the cells in the foam such as cell size distribution, cell shapes, and cell wall thickness. For n pairs of stress-strain data, the relative error, E, was computed according to equation (1).
Polynomial form
The polynomial energy function is a custom function that has been used for modeling compressible elastomers. According to equation (2), in this function, two terms, associated with incompressible and volumetric deformations, are included.


Neo-Hookean form
This function usually provides the simplest description of a hyperelastic behavior, according to equation (6), where C and D are the function parameters.

Ogden form
This function is determined based on the deviatoric stretches according to equation (7), where λi denotes the principal stretches. μ
i
, α
i,
and D
i
are the material parameters that can be obtained by fitting the numerical results to the experimental data.

Arruda-Boyce form
The Arruda-Boyce form (i.e., eight chain model) determines the strain energy potential according to equation (8), where λ
m
denotes the locking stretch at which the upturn of the stress-strain curve may rise significantly; D is twice the inverse bulk modulus; μ
0
is the initial shear modulus; and μ is obtained using equation (9).


The fitting constants of these energy functions depend on the temperature condition of the experiment, however; it was assumed that the experiments were conducted at constant room temperature (25°C).
Characterization experiments
Three mechanical experiments were conducted in this study to characterize the most common responses of the material under various loading conditions comprised of pure tension, pure compression, and simple shear tests. These stress-strain responses may exist on the material under a general practical loading condition. The ASTM standards were followed in conducting the experiments. The examined elastomeric foam was a blend of linear low-density polyethylene (LLDPE) and ethylene vinyl acetate (EVA), crosslinked to improve the mechanical properties with a melting index equal to 3 g/10 min, and density of 224 kg/m3 at room temperature (25°C). According to the data provided by the manufacturer, the ratio of EVA in the blend was 28% and the average size of the closed cells in the foam was equal to 8 μm. The foam specimens were precisely cut from a bulk foam sheet using a laser cutting machine to minimize the damage to the cut edges of the specimens. Two replicate specimens were tested per experiment to determine the variability. Negligible variation was obtained between replicate specimens.
Uniaxial tests
Examination of the foam response under compressive stress was carried out by conducting a compression test according to ASTM D395.
44
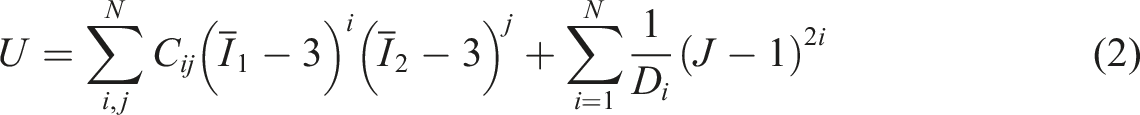
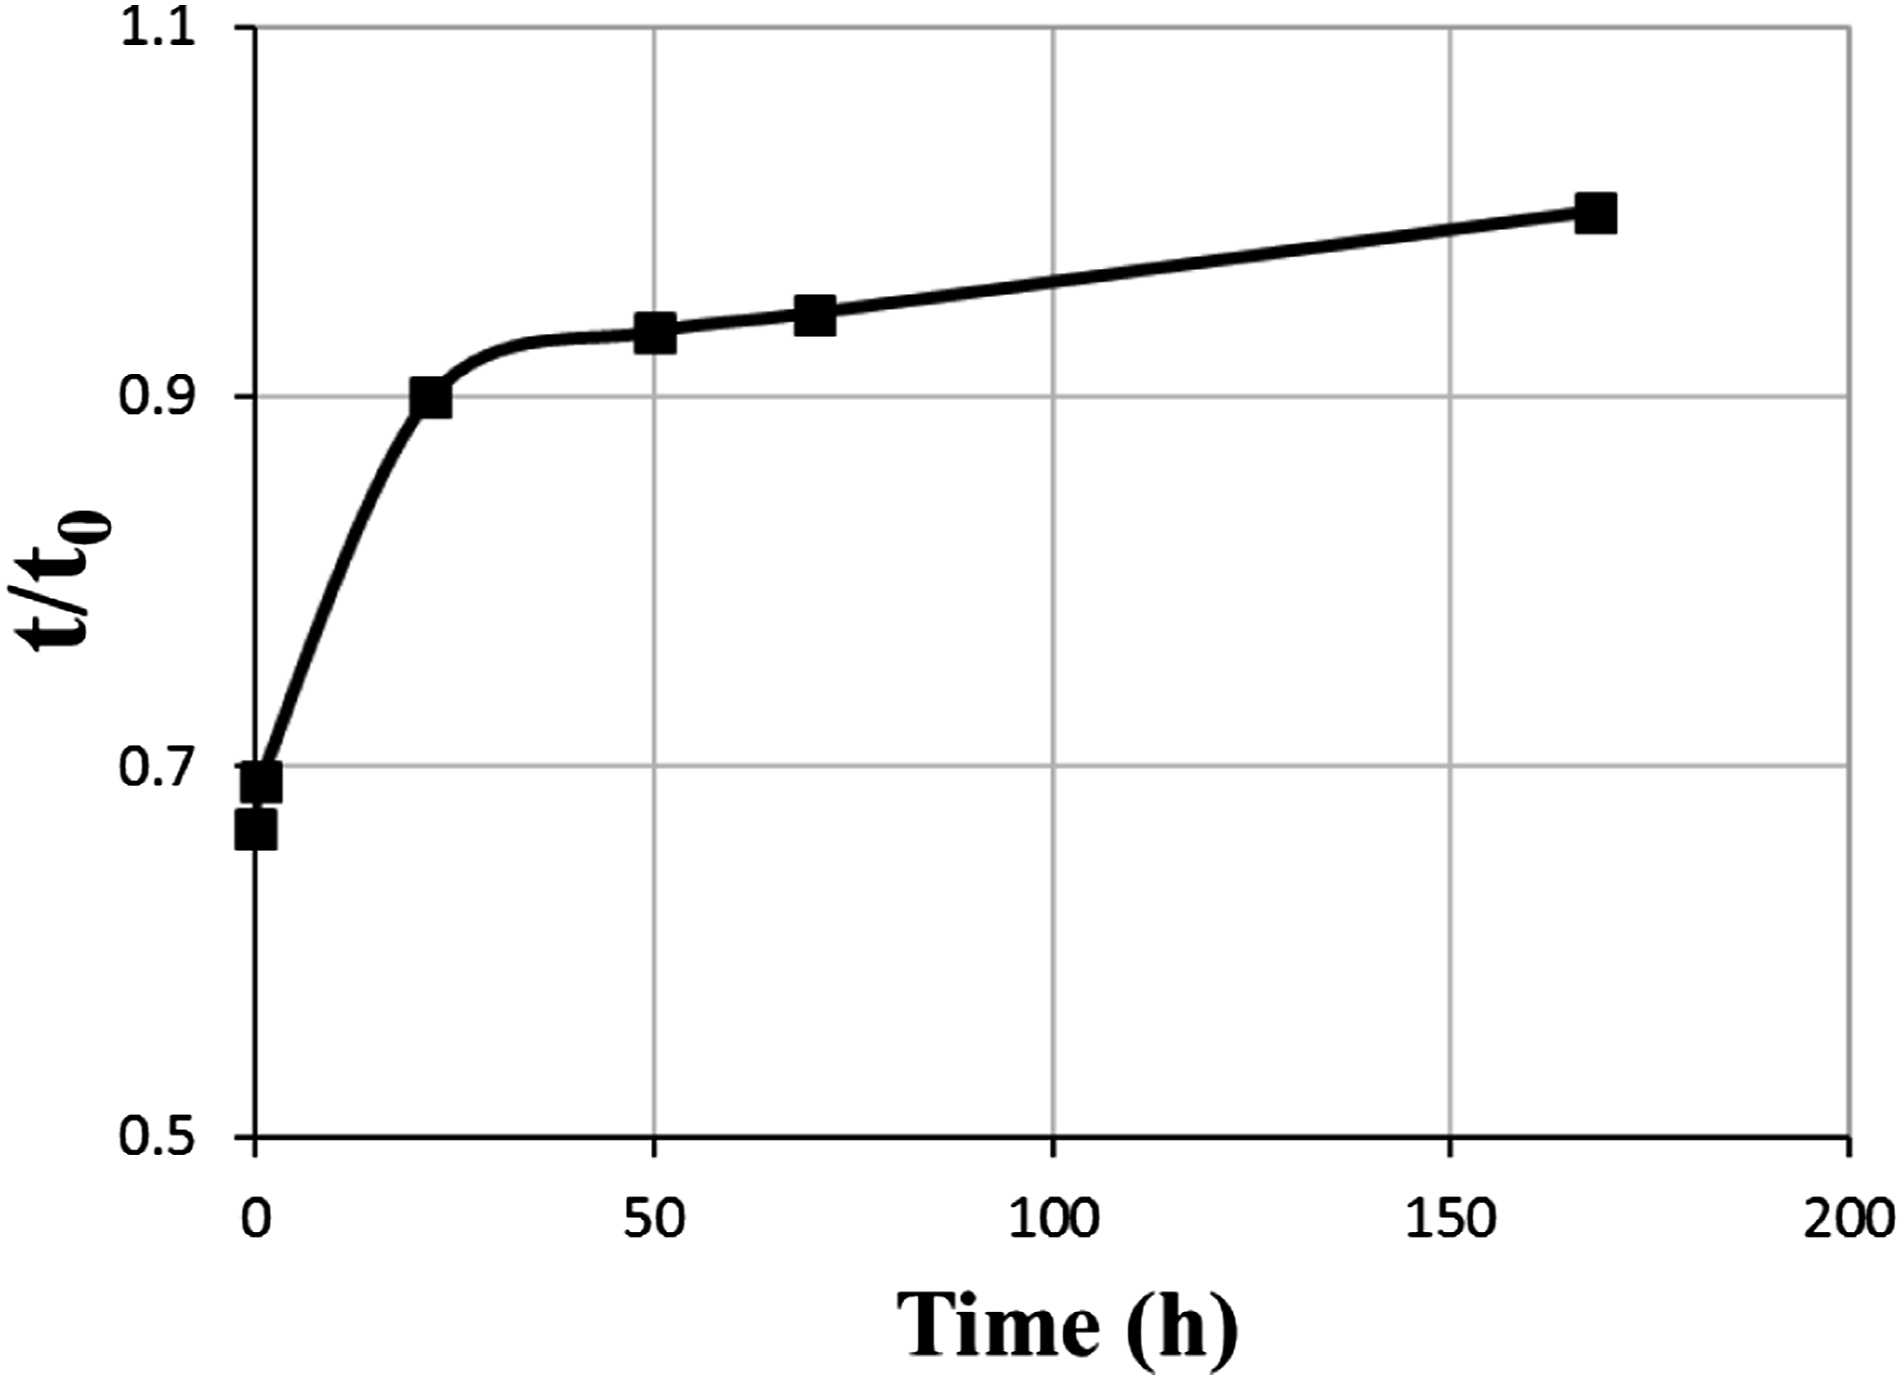
The material stress-strain response under compression forces was used to calibrate the strain energy functions for numerical simulation. The ASTM standard recommends the geometry of the cylindrical specimen as 13 mm in diameter and 6 mm in thickness, as seen in Figure 2(a). The loading machine was GALDABINI and the velocity of the machine crosshead was 3 mm/min to conduct the displacement-controlled loading. The test results show that most of the deformation in the foam is recoverable after 22 h, due to the absorption of the air through the cells. Figure 3 shows the variation in the thickness of the foam specimen as a function of time after the unloading. The experimental specimens for uniaxial tests: (a) compressive specimen (b) tensile specimen. Variation of the thickness (t) of the compressive foam specimen relative to the initial thickness (t0), versus time after unloading.
For the tensile test, the dumbbell-shaped specimens with dimensions recommended by ASTM D638 45 were prepared (Figure 2(b)). To measure the Poisson’s coefficient using a high-resolution camera, some highlighted lines were drawn on the gauge length of the specimens. The velocity of the displacement-controlled load for the tensile test was 3 mm/min. The tensile test was followed by rupture of the specimen at the gage length. Accurate measurement of the lateral displacement for the examined foam specimens showed almost a fixed Poisson’s coefficient of 0.278 and 0.1 under tensile and compressive loads, respectively.
Simple shear test
The type of deformation of the cells network of foams under shear stresses can be different from that of foam specimens under normal loads. The deformation of the cellular structure can be impacted mainly by the rotation of the cells from connection joints under shear stresses. To obtain this response, a simple shear test on a rectangular double-lap specimen was conducted using the test setup displayed in Figure 4. The modulus and ultimate strength of the adhesive were high enough that the deformation of the adhesive film was found to be negligible relative to the deformation of the foam specimens. Also, the adhesive between the specimens and the supports remained undamaged. The shear specimen consisted of two foam cubes with dimensions of 70 × 70 × 10 mm3. This test was conducted by the DARTEC testing machine with a velocity of 1 mm/min. The simple shear test on a double-lap test specimen.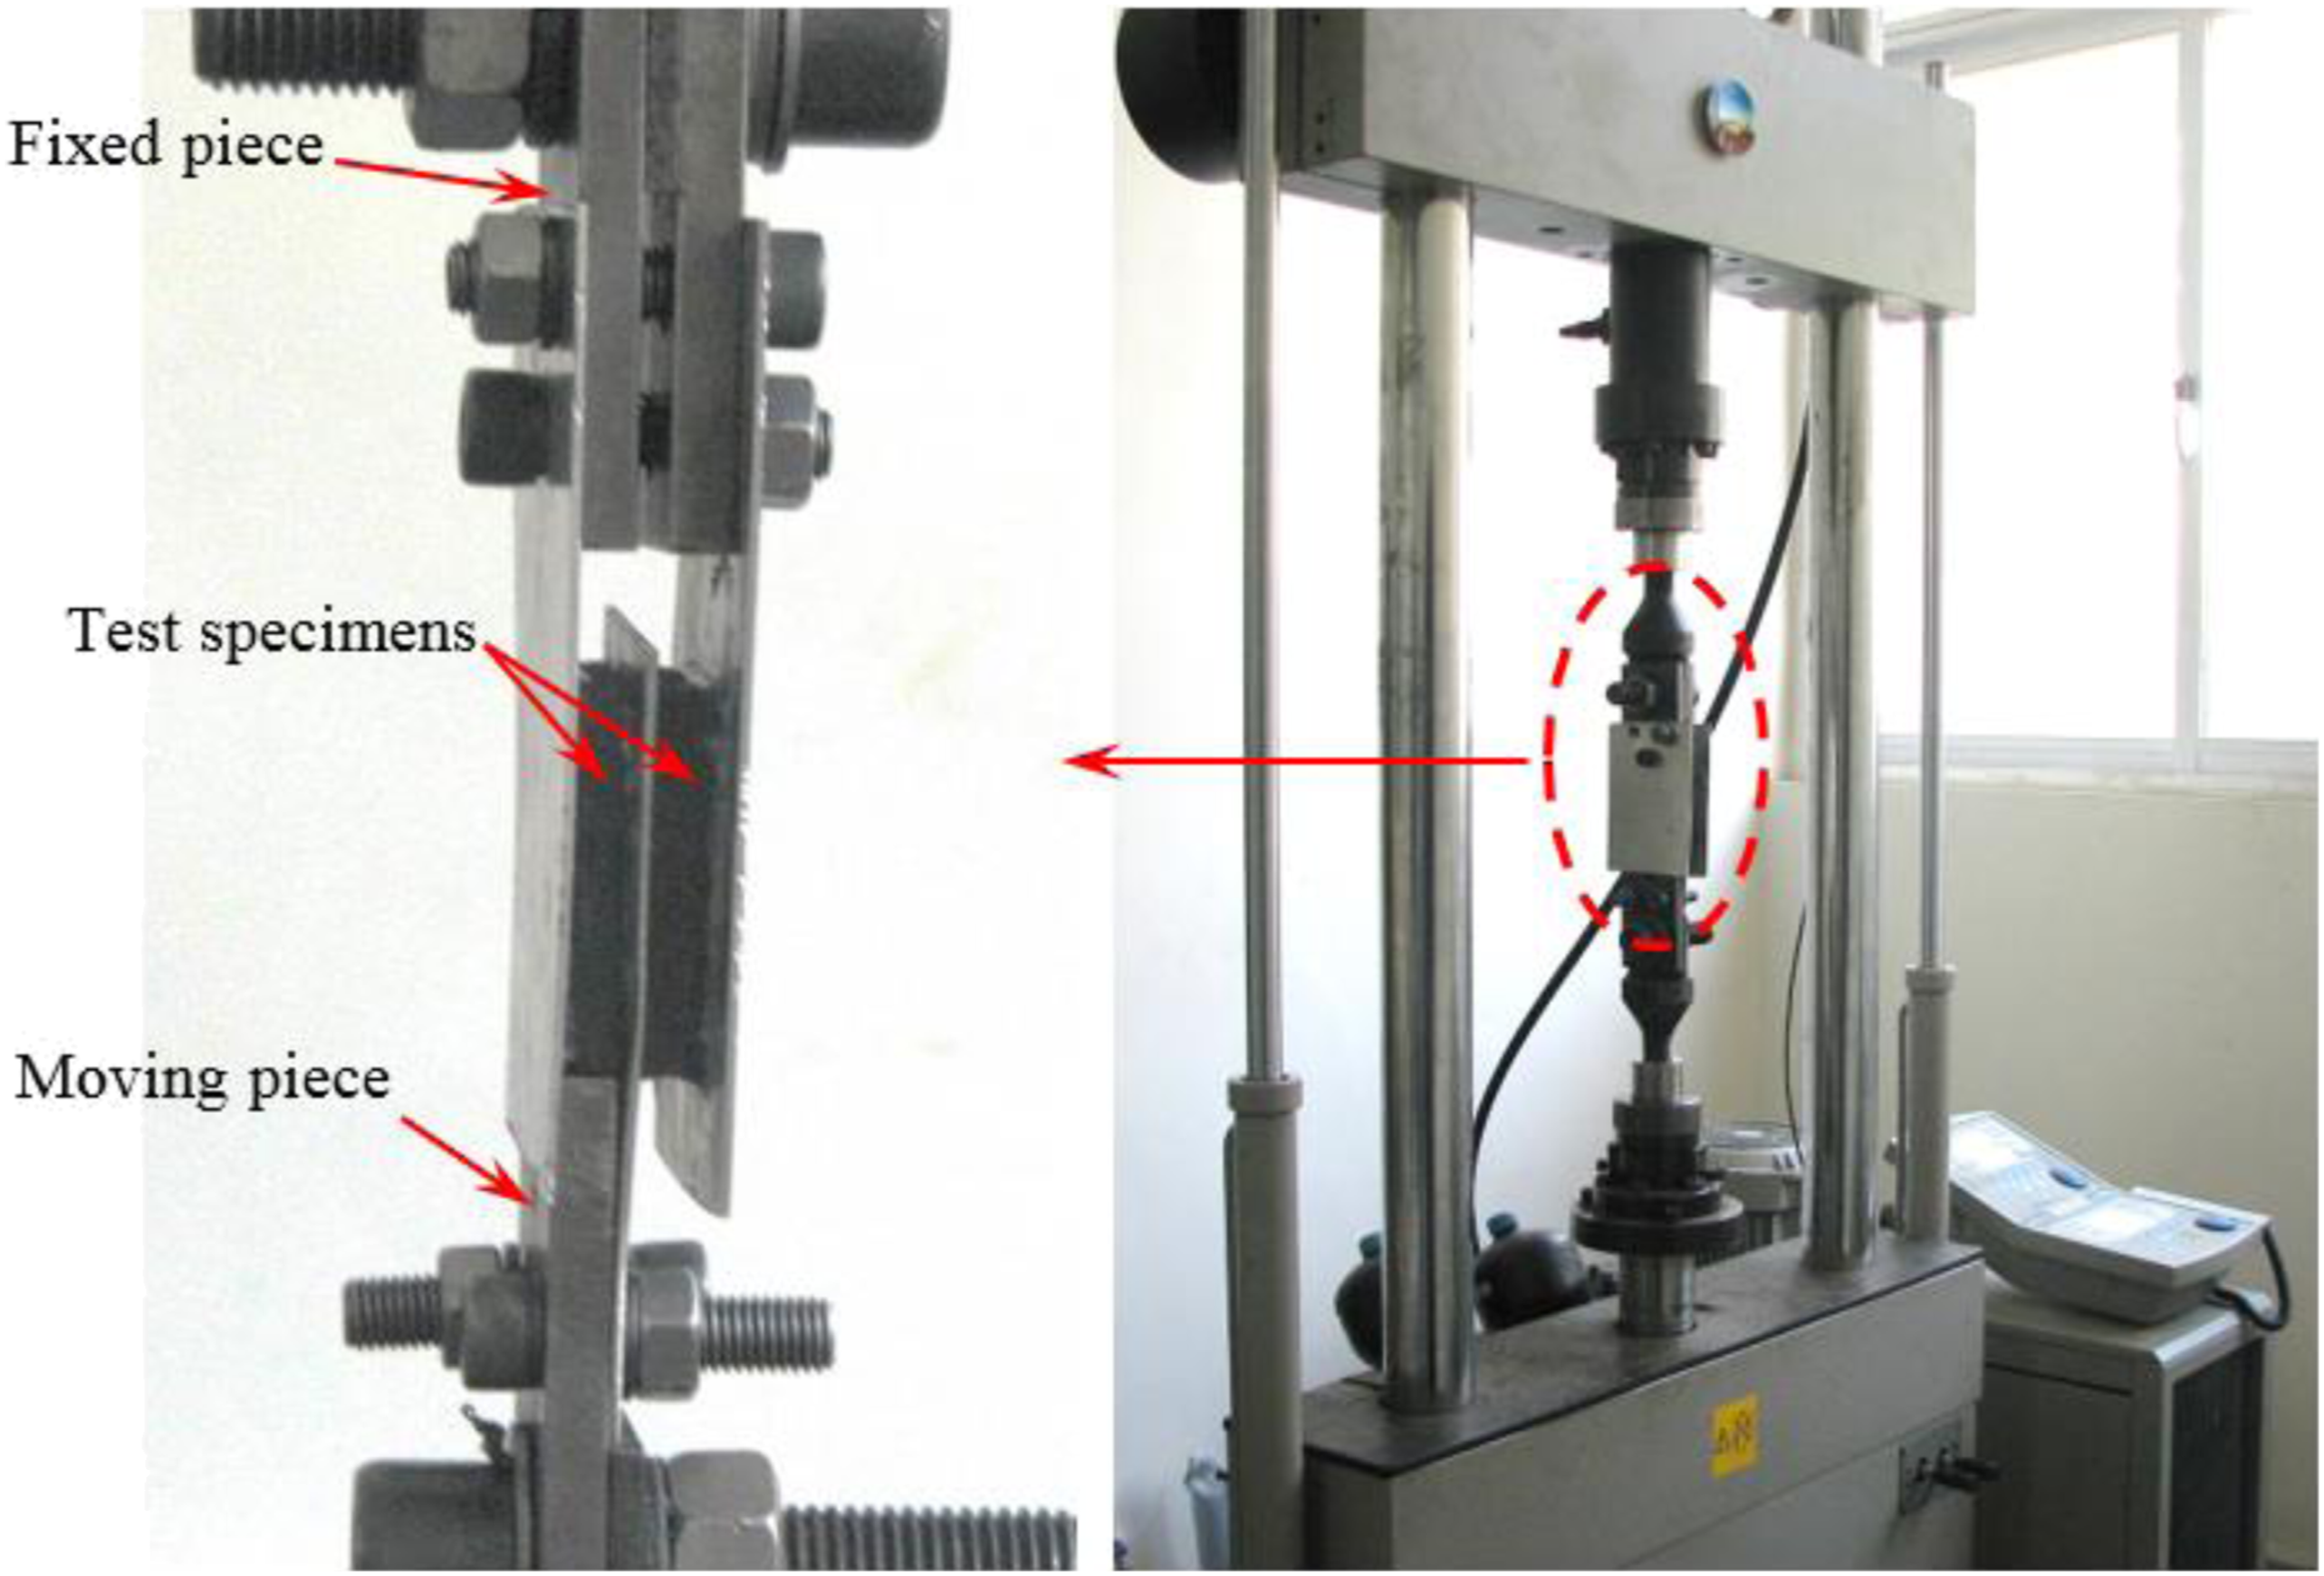
Results and discussions
In the following, first, the best-fit energy function which illustrated the most accurate numerical results was determined to numerically estimate the results of the uniaxial and shear experiments. Second, the procedure of the developed adaptive FE model was discussed. Then, the characterization experiments were simulated by the FE models to validate the FE modeling procedure. Additionally, the efficiency and performance of the adaptive model for simulation of the multiaxial stresses in the foam were investigated.
Selection of the best-fit energy function
Previous studies have demonstrated that the accuracy of the energy functions in simulating a specific hyperelastic material depends on the type of nonlinearity of the material stress-strain response.
42
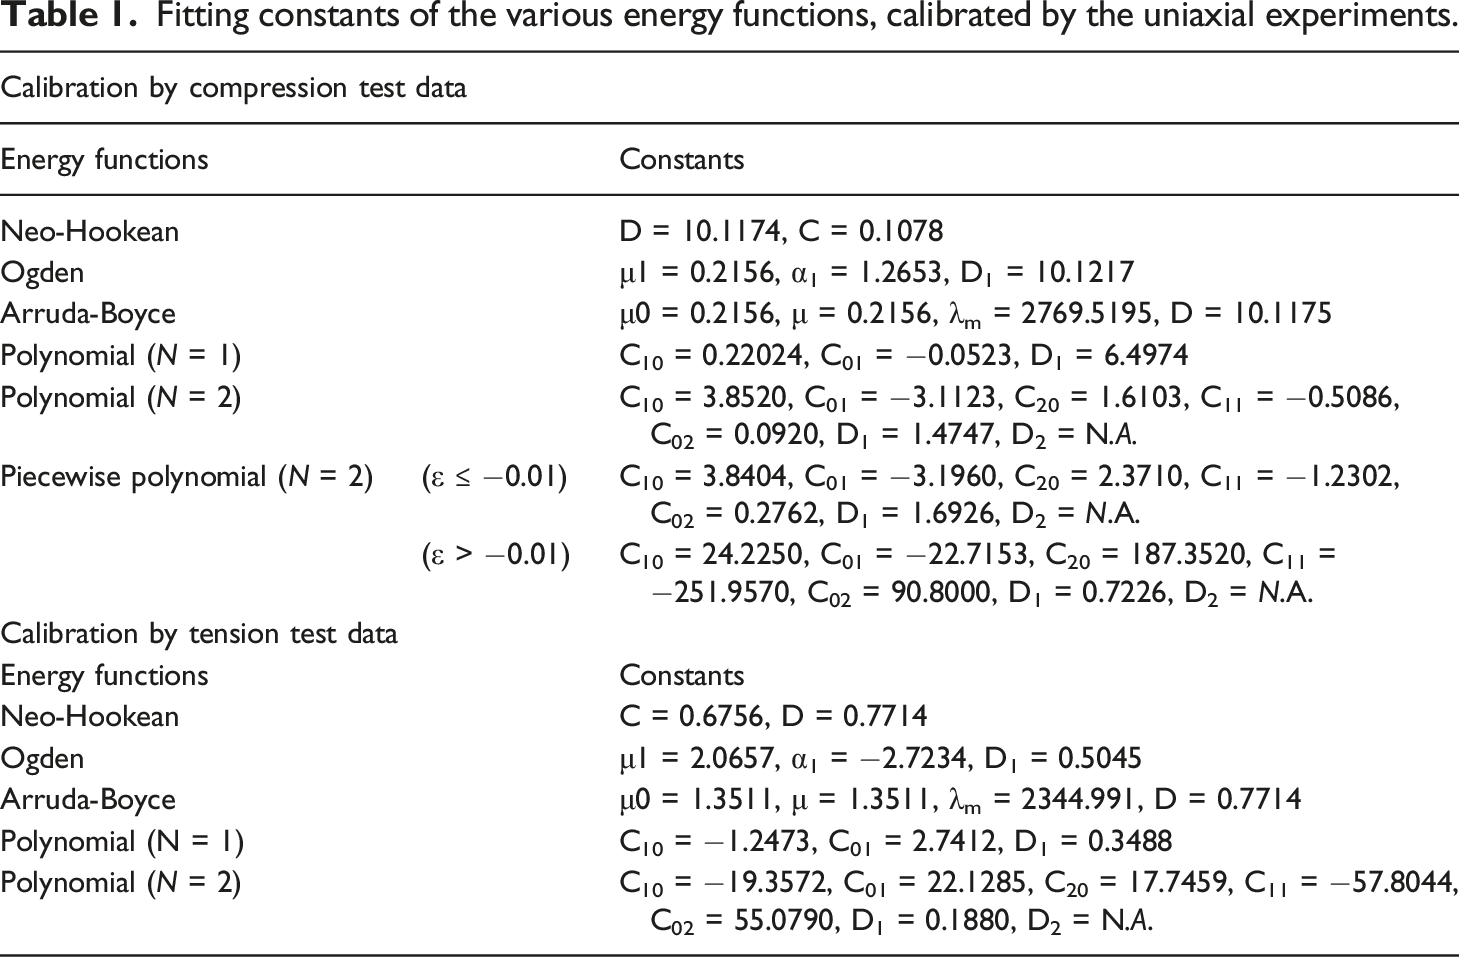
Therefore, in this section, the calibration of various energy functions using the uniaxial and shear experiments is discussed. Figure 5 shows the experimental as well as the numerical results using different energy functions for the simulation of the compressive and tensile responses of the foam sample. All the stress-strain curves in this paper indicate the engineering stress versus engineering strain. The fitting constants of the different energy functions, obtained through the calibration with the experimental data, are summarized in Table 1. A smoothing degree of 5 was used for fitting the energy functions to the discrete experimental data. According to Figure 5, the second-order polynomial function (Polynomial, N = 2) shows the most accurate numerical results for both tensile and compressive responses of the foam when compared to the experimental results. Therefore, the second-order polynomial function was selected for the simulation of the material responses under various loading conditions. Additionally, by close observation of the correlation between the experimental and numerical results at the low strain range, the accuracy of the second-order polynomial function seemed not to be satisfactory, thus, a more accurate fitting was achieved by the application of a piecewise function with two amplitudes (ε > −0.01 and ε ≤ −0.01). The results of this model are presented in Table 1 as piecewise polynomial, N = 2. Stress-strain curves, obtained by various forms of energy functions calibrated using the experimental data for (a) compression test, (b) tension test. (Note: “EXP” and “P. Polynominal, N = 2” denote experimental data and piecewise second-order polynomial function results, respectively). Fitting constants of the various energy functions, calibrated by the uniaxial experiments.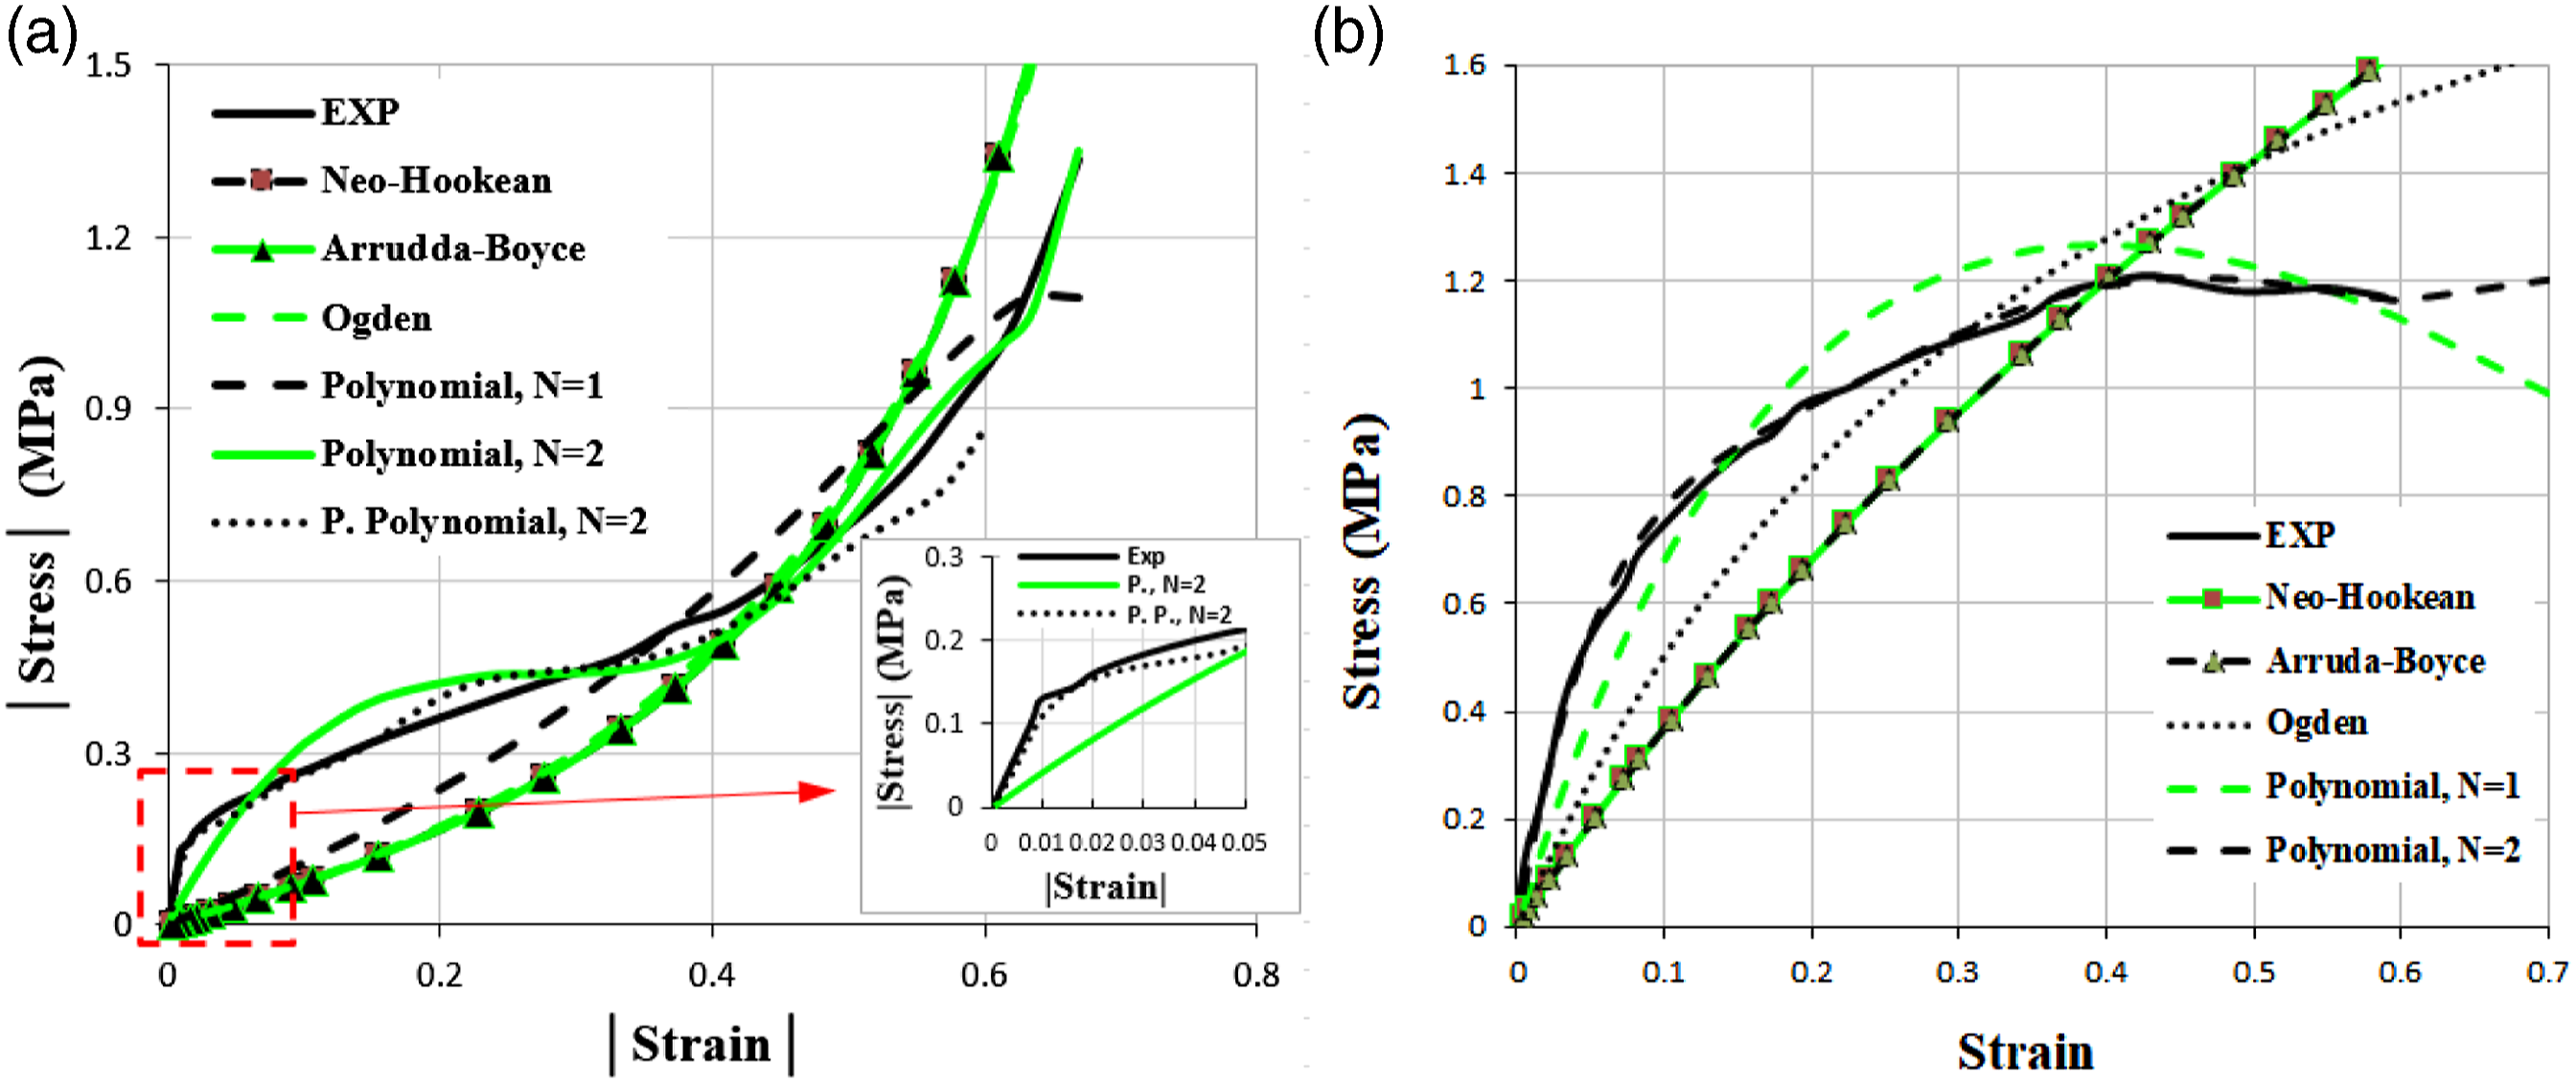
The calibration of energy functions using the shear test results was also performed to examine the advantage of the application of these functions in the simulation of the behavior of foam materials under large shear stresses. The calibration of the energy functions using the shear experimental data was only carried out by the second-order polynomial function as this form of energy function provided the most accurate numerical results when compared to the uniaxial experiments. As previously noted, for calibration of the energy function by the shear test, it is necessary to include the uniaxial test results in addition to the shear test data to obtain a comprehensive response under various loading conditions.
40
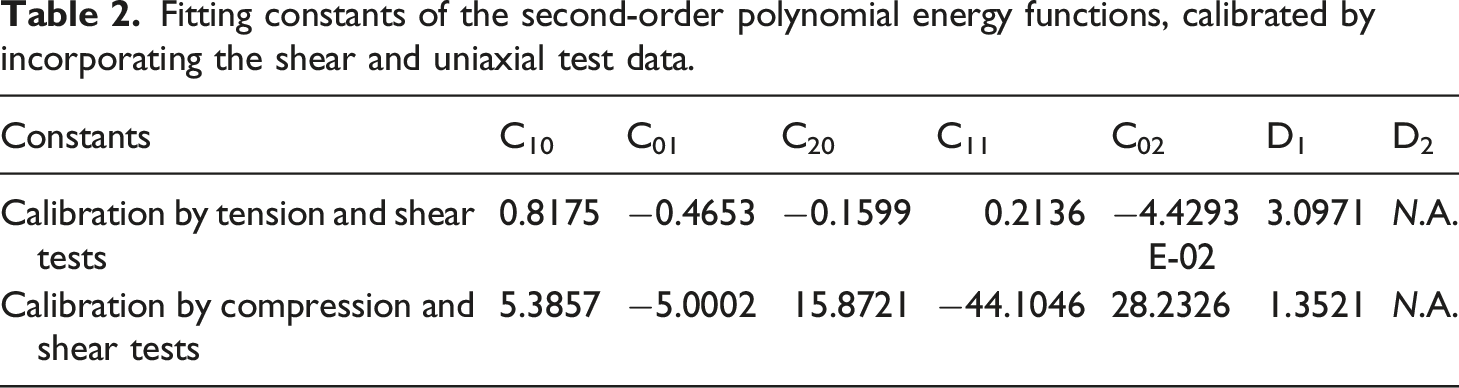
Therefore, regarding the different responses of the foam under tension and compression, two different calibration methods were examined: a calibration using the tension and shear test results, and the other one by implementing the compression and shear tests data. The results of the second-order polynomial energy function in comparison to the experimental data are presented in Figure 6, while the related energy function constants are given in Table 2. As was expected,40,42 according to Figure 6, the calibration method by multiple sets of experimental data showed a relatively weaker accuracy compared to the shear experiment. Stress-strain curves, obtained by the shear test and the second-order polynomial energy functions, calibrated using the uniaxial and shear test results. Fitting constants of the second-order polynomial energy functions, calibrated by incorporating the shear and uniaxial test data.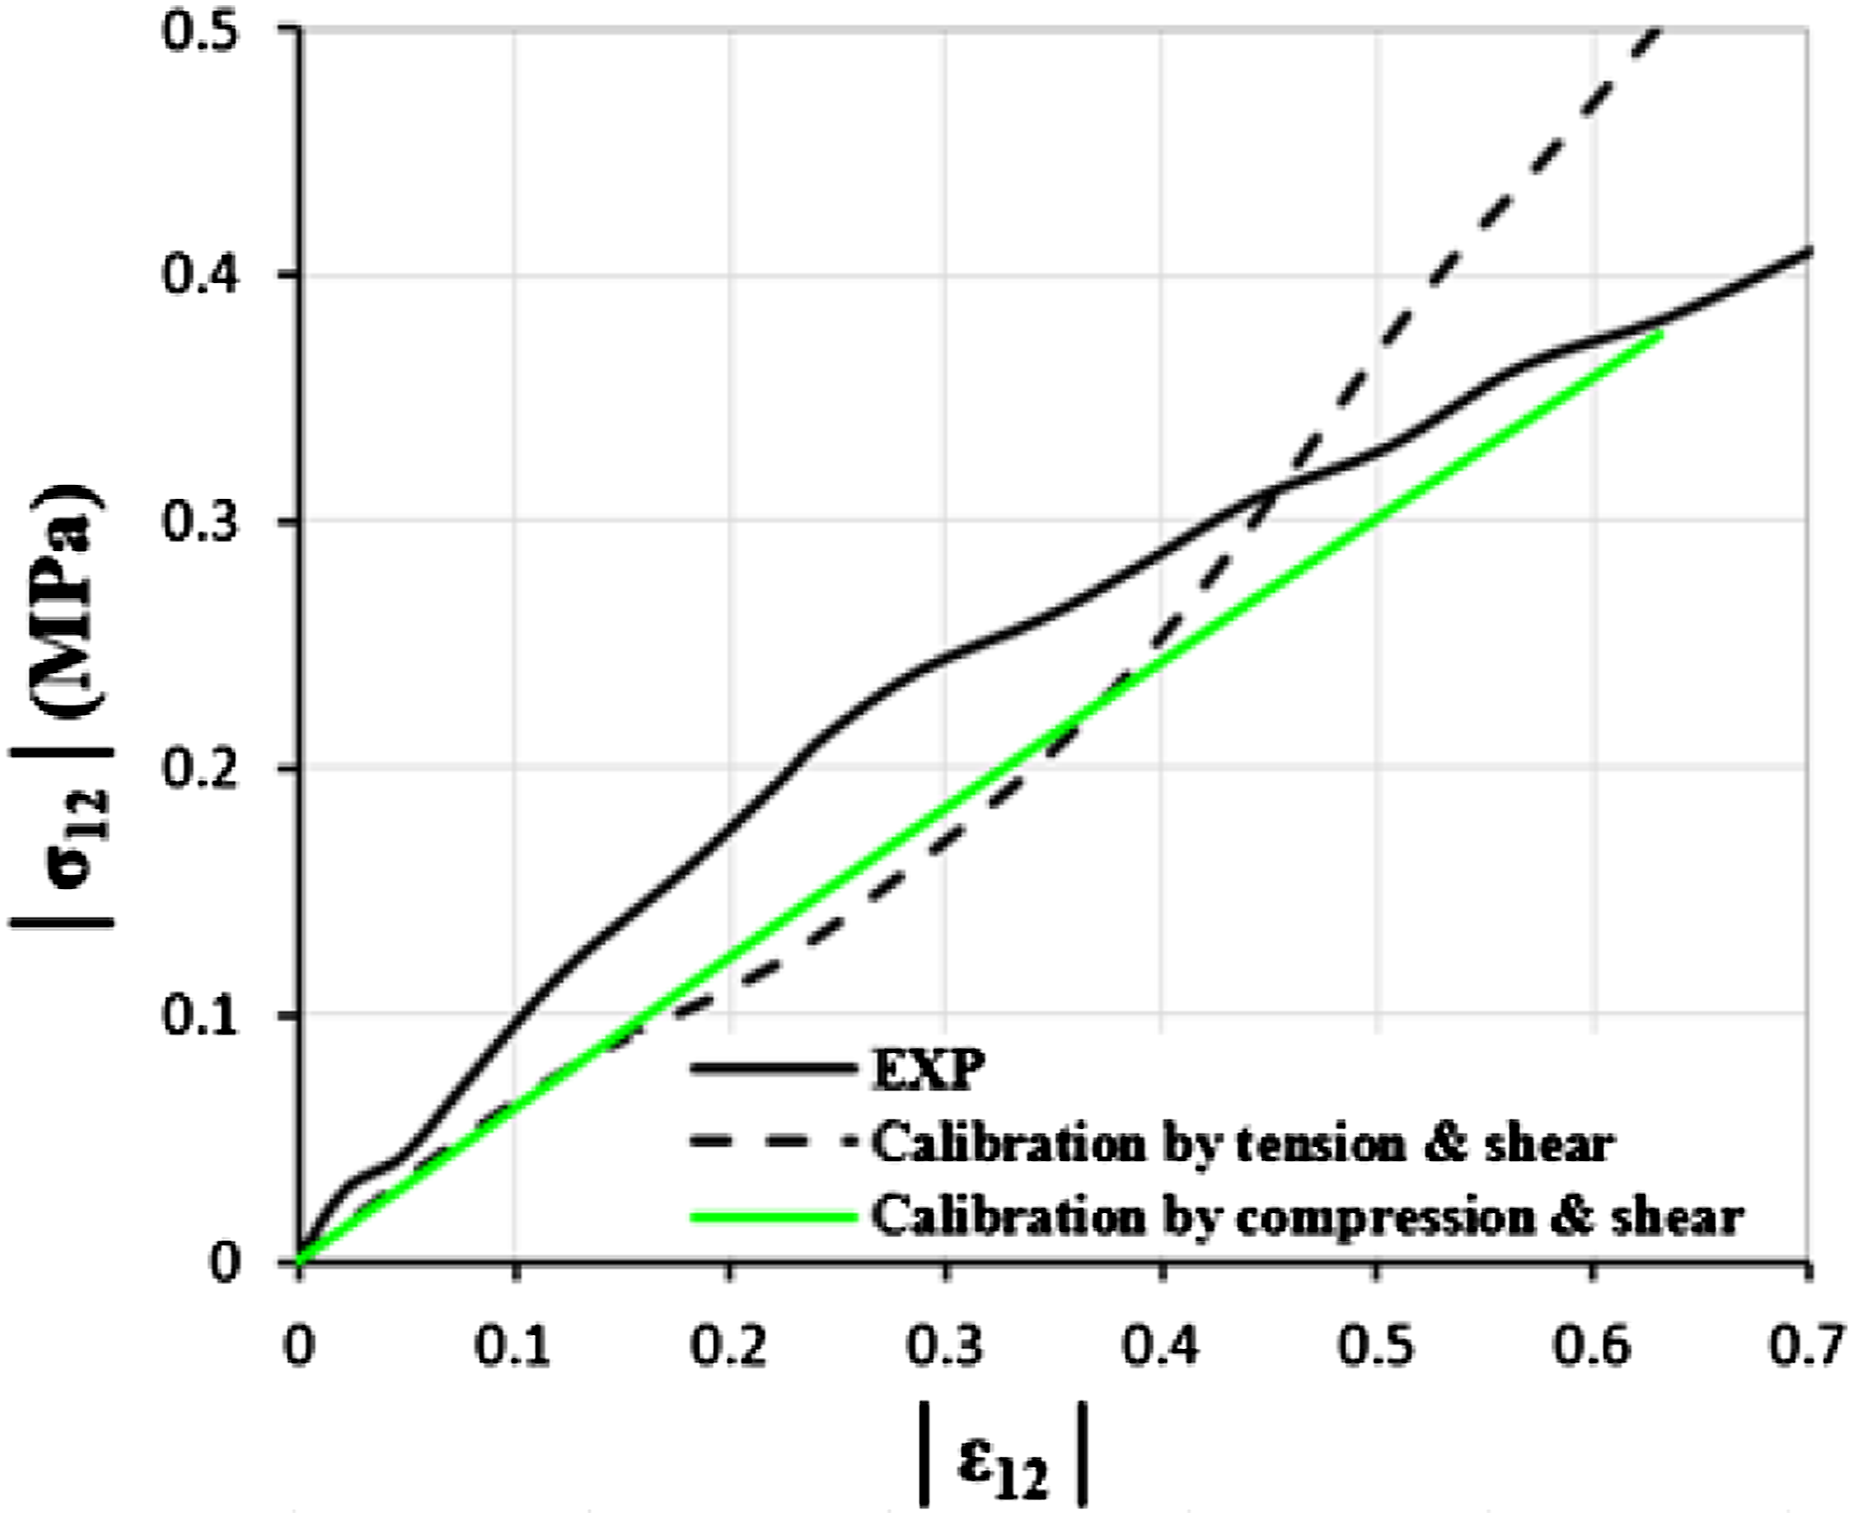
Development of the adaptive FE model
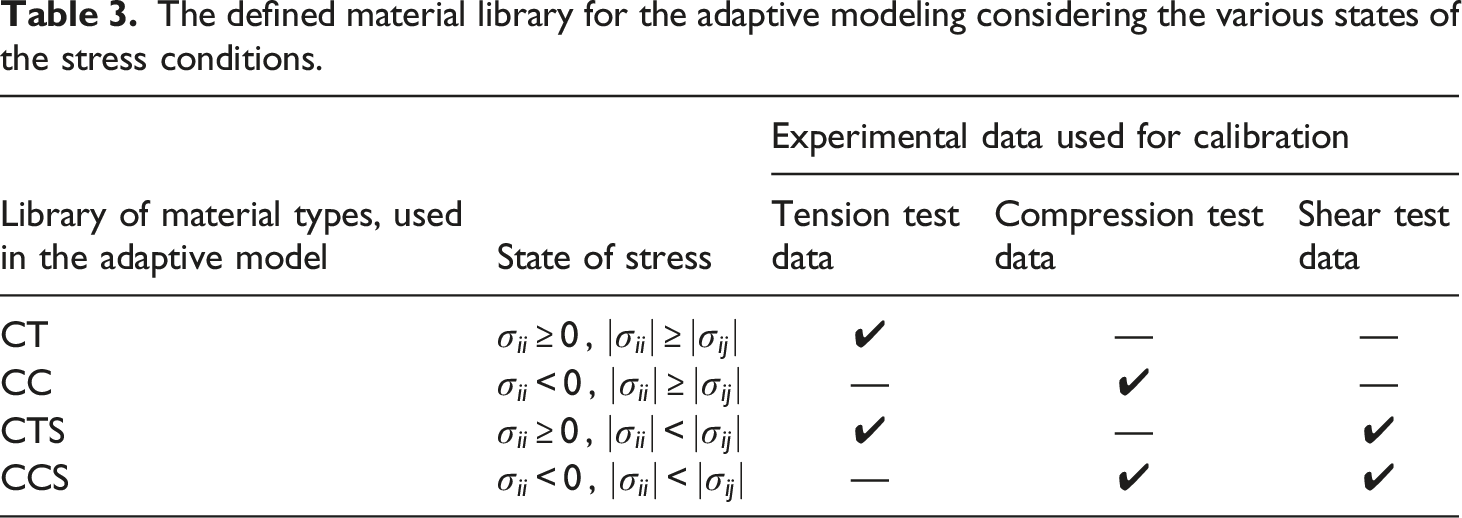
As discussed, the application of a comprehensive energy function (calibrated using multiple stress-stress responses of the materials) can lead to a large deviation between numerical and experimental results for the simulation of certain behavior of the foam materials. In other words, a more comprehensive material model (calibrated using combined stress-stress responses) can result in less amount of accuracy in predicting the behavior of the regions under pure stress conditions. For example, using a unique material model by incorporating both compressive and tensile stress-strain responses is not expected to provide satisfactory accuracy in the simulation of foam materials due to the occurrence of different modes of deformation (e.g., the cell walls buckle under compression and stretch under tensile stress). Therefore, in the present study, an adaptive model was developed which uses a material response library to designate intelligently the relevant energy function (i.e., effective mechanical properties) at each section point according to the dominant stress condition for each load increment. In the adaptive model, a Cauchy-elastic material is utilized in which the stress is only affected by the state of deformation in an infinitesimal neighborhood of each point in the material, 24 while, it satisfies the requirements of the material objectivity. In adaptive modeling, the impact of cell size and morphology is implicitly considered using the mechanical properties of the foam materials as input parameters. Therefore, a change in microstructural characteristics of the foams such as cell shapes and cell wall thickness does not influence the accuracy of the model and it does not constrain the application of the developed adaptive modeling for other elastomeric materials.
The defined material library for the adaptive modeling considering the various states of the stress conditions.
Verification of the FE modeling procedure
To validate the accuracy of the FE modeling technique, the simple stress conditions observed in the characterization experiments were simulated, so the same approach is applied to investigate the foam response in the advanced experiments. The loading and the boundary conditions of the models were selected to simulate the test setup (i.e., the bottom support was fixed while the top one was moving per its vertical displacement). The rate of loading was assigned equal to the one imposed in the experiments. The mesh size adopted for the simulation of the compressive specimen was maximum in the plan (1 mm), and it was reduced from the center to the perimeter. The mesh size was reduced to 0.75 mm over the depth. The type of elements for the specimen and the support plates, located at the top and bottom, were solid 3D eight-node reduced-integrated element (C3D8R) and rigid four-node shell element (S4R), respectively. Using Tie constraint, the degrees of freedom (DOFs) for the top and bottom ends of the specimens were defined as the slave elements as a function of the DOFs of the master points, determined at the center of the rigid plates. Figure 7(a) shows the FE model of the compressive test specimen at the initial state of loading. By physical evaluation of the surface roughness,
46
the friction coefficient between the compressive specimen and the rigid plates was assigned equal to 0.1. The results obtained by Tabaddor
47
examined the influence of the frictional contact between the surfaces of the support plates and the compressive specimens on the performance of the hyperelastic materials by FE study. The loading and constraining clamps in the tensile tests were simulated by rigid S4R elements and for the specimen the elements were C3D8R. The implementation of a narrowing mesh scheme from the clamped region to the gauge length for dog-bone tensile test specimens has shown accurate results.
36
According to Figure 7(b) and (a) narrowing mesh scheme was applied in the FE model. The size of the elements at the gauge length in the longitudinal direction and over the depth was equal to 2 mm and 0.06 mm, respectively. Figure 7(b) shows the longitudinal stress distribution in the tensile specimen at the state where the nominal loading stretch was equal to 0.4. FE models of the uniaxial test specimens related to (a) the compressive test specimen at the initial state of load carrying, and (b) the tensile test specimen when the nominal loading stretch was equal to 0.4.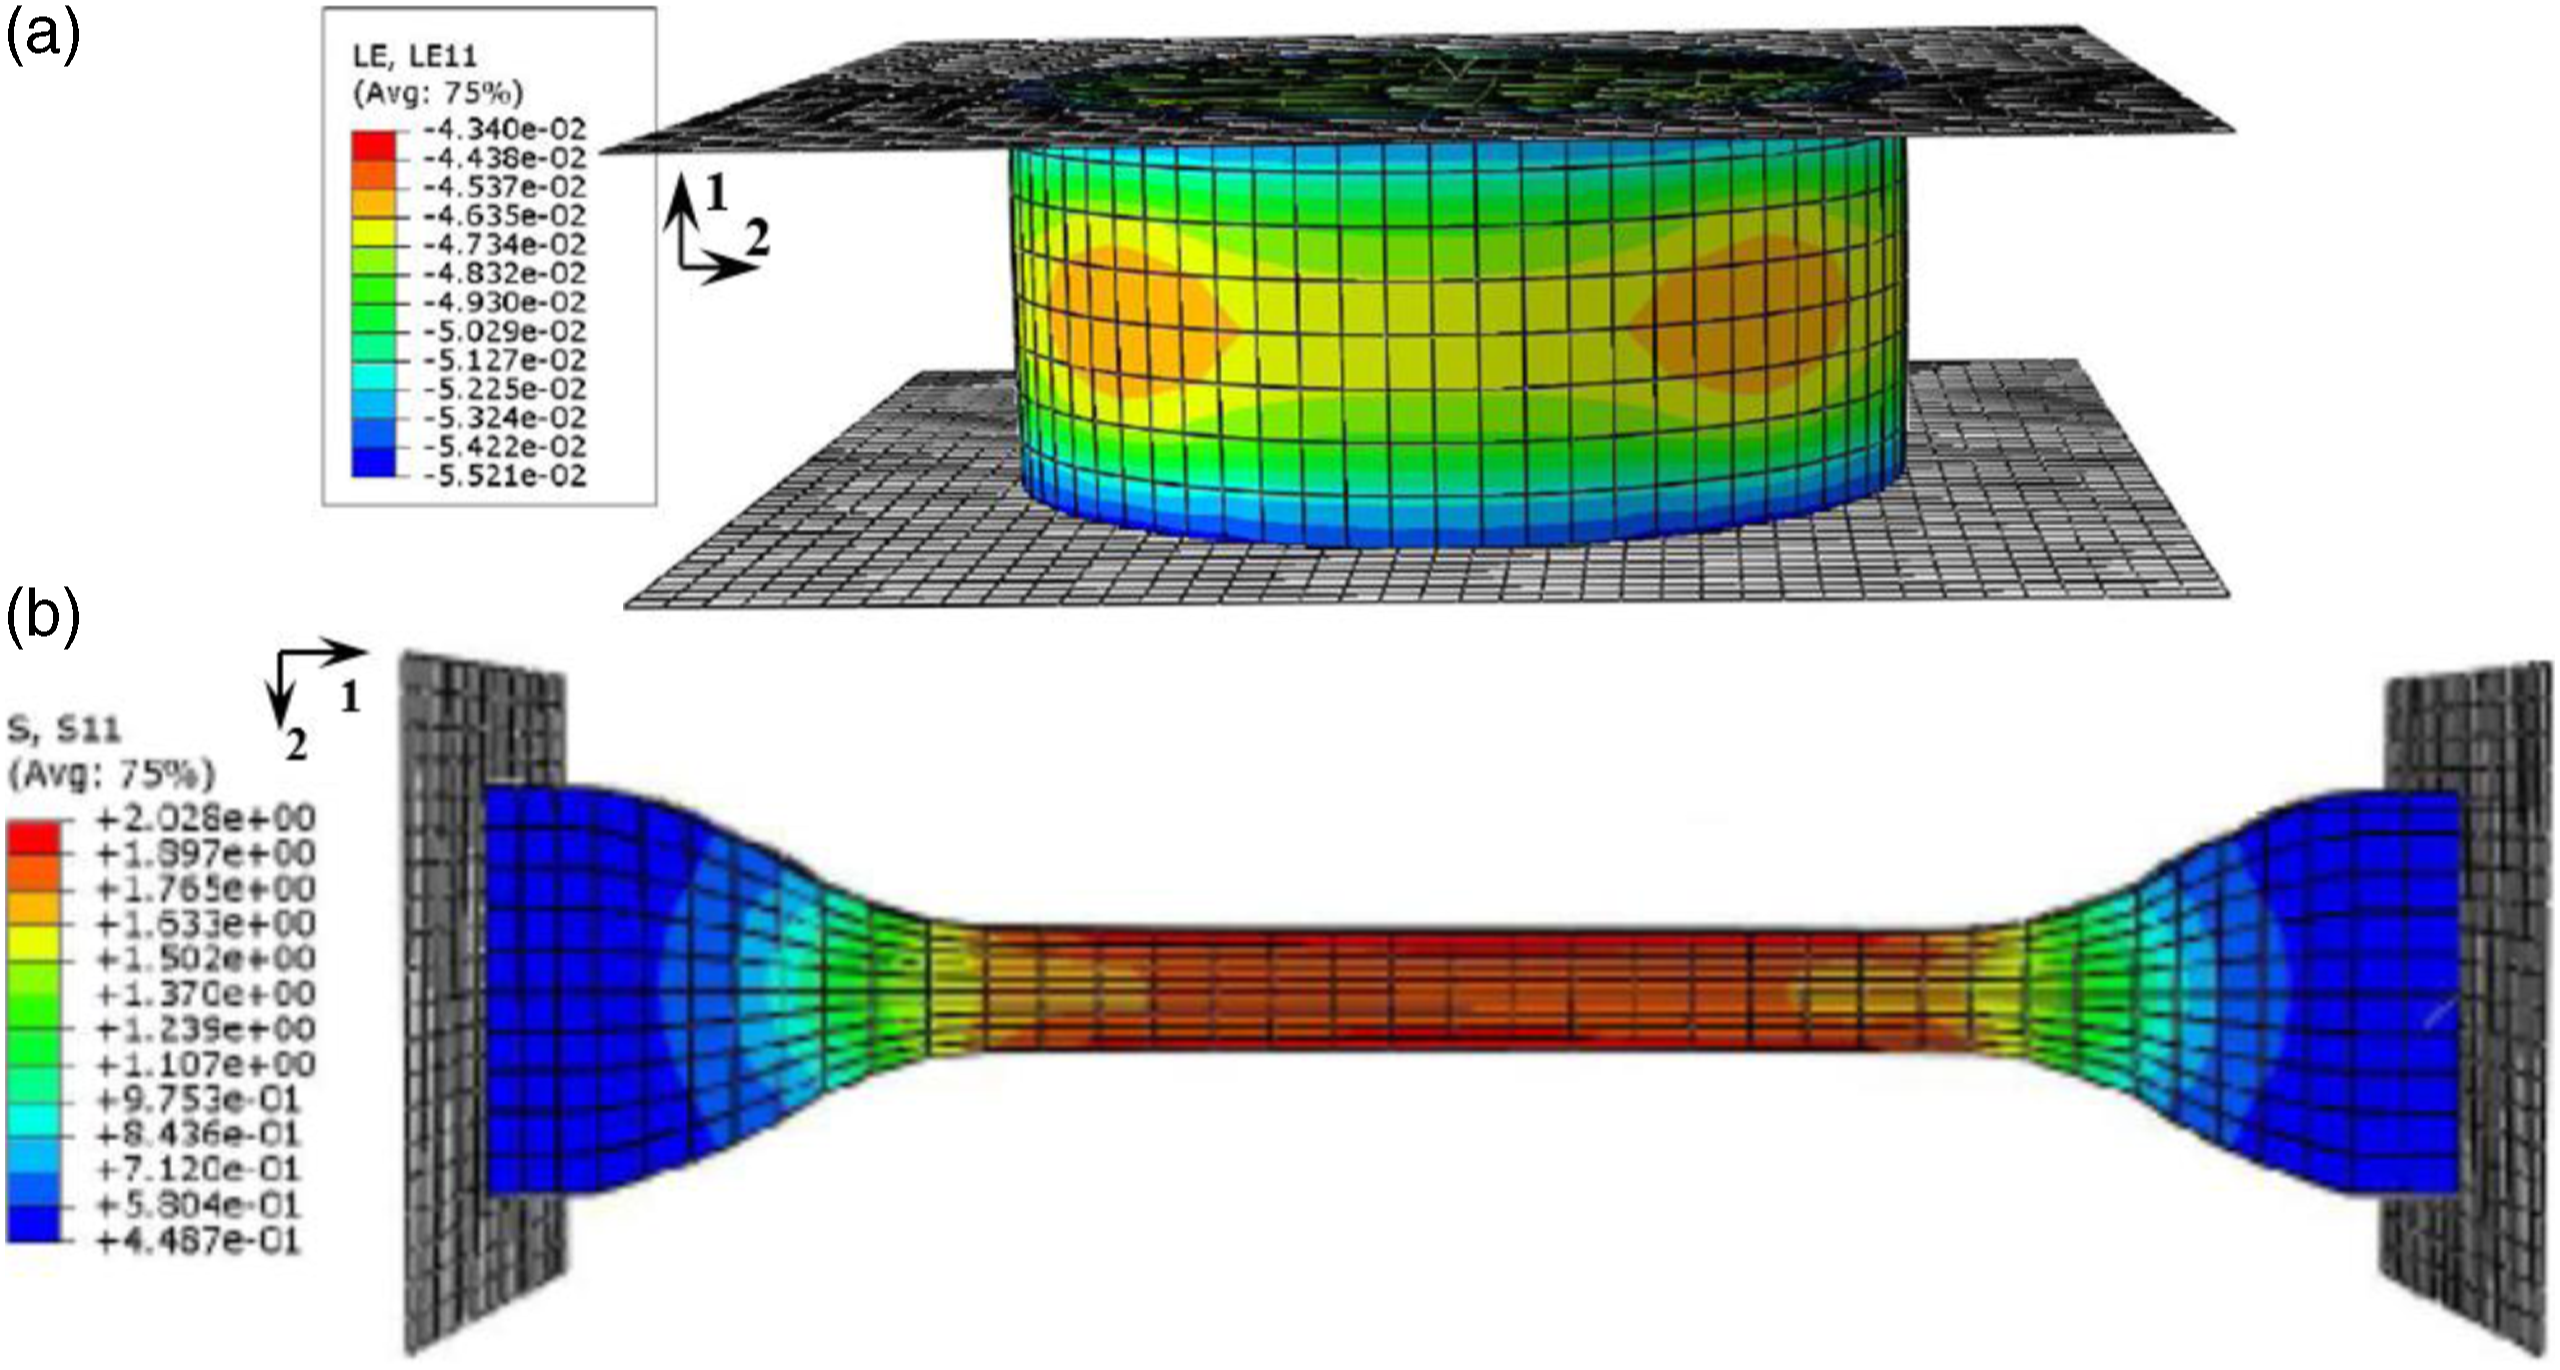
Figure 8 shows the numerical results for compression and tensile experiments using two material models, one calibrated by the uniaxial response of the foam materials and the other one calibrated by the incorporation of the combined shear and uniaxial stress-strain responses. Based on Figure 8, the FE models show good correspondence with experiments when the energy function was calibrated using pure uniaxial tests. However, there is a large deviation between the numerical and experimental results in the cases where the energy function was calibrated by both uniaxial and shear tests. As expected, the FE models with the inclusion of the shear test data for calibration of the energy functions underestimate the load-carrying capacity of uniaxial experiments. This is attributed to the low capacity of the examined foam under shear stresses. Stress-strain curves obtained by the FE models, applying the various material models in comparison to the experiments: (a) compressive test and (b) tensile test.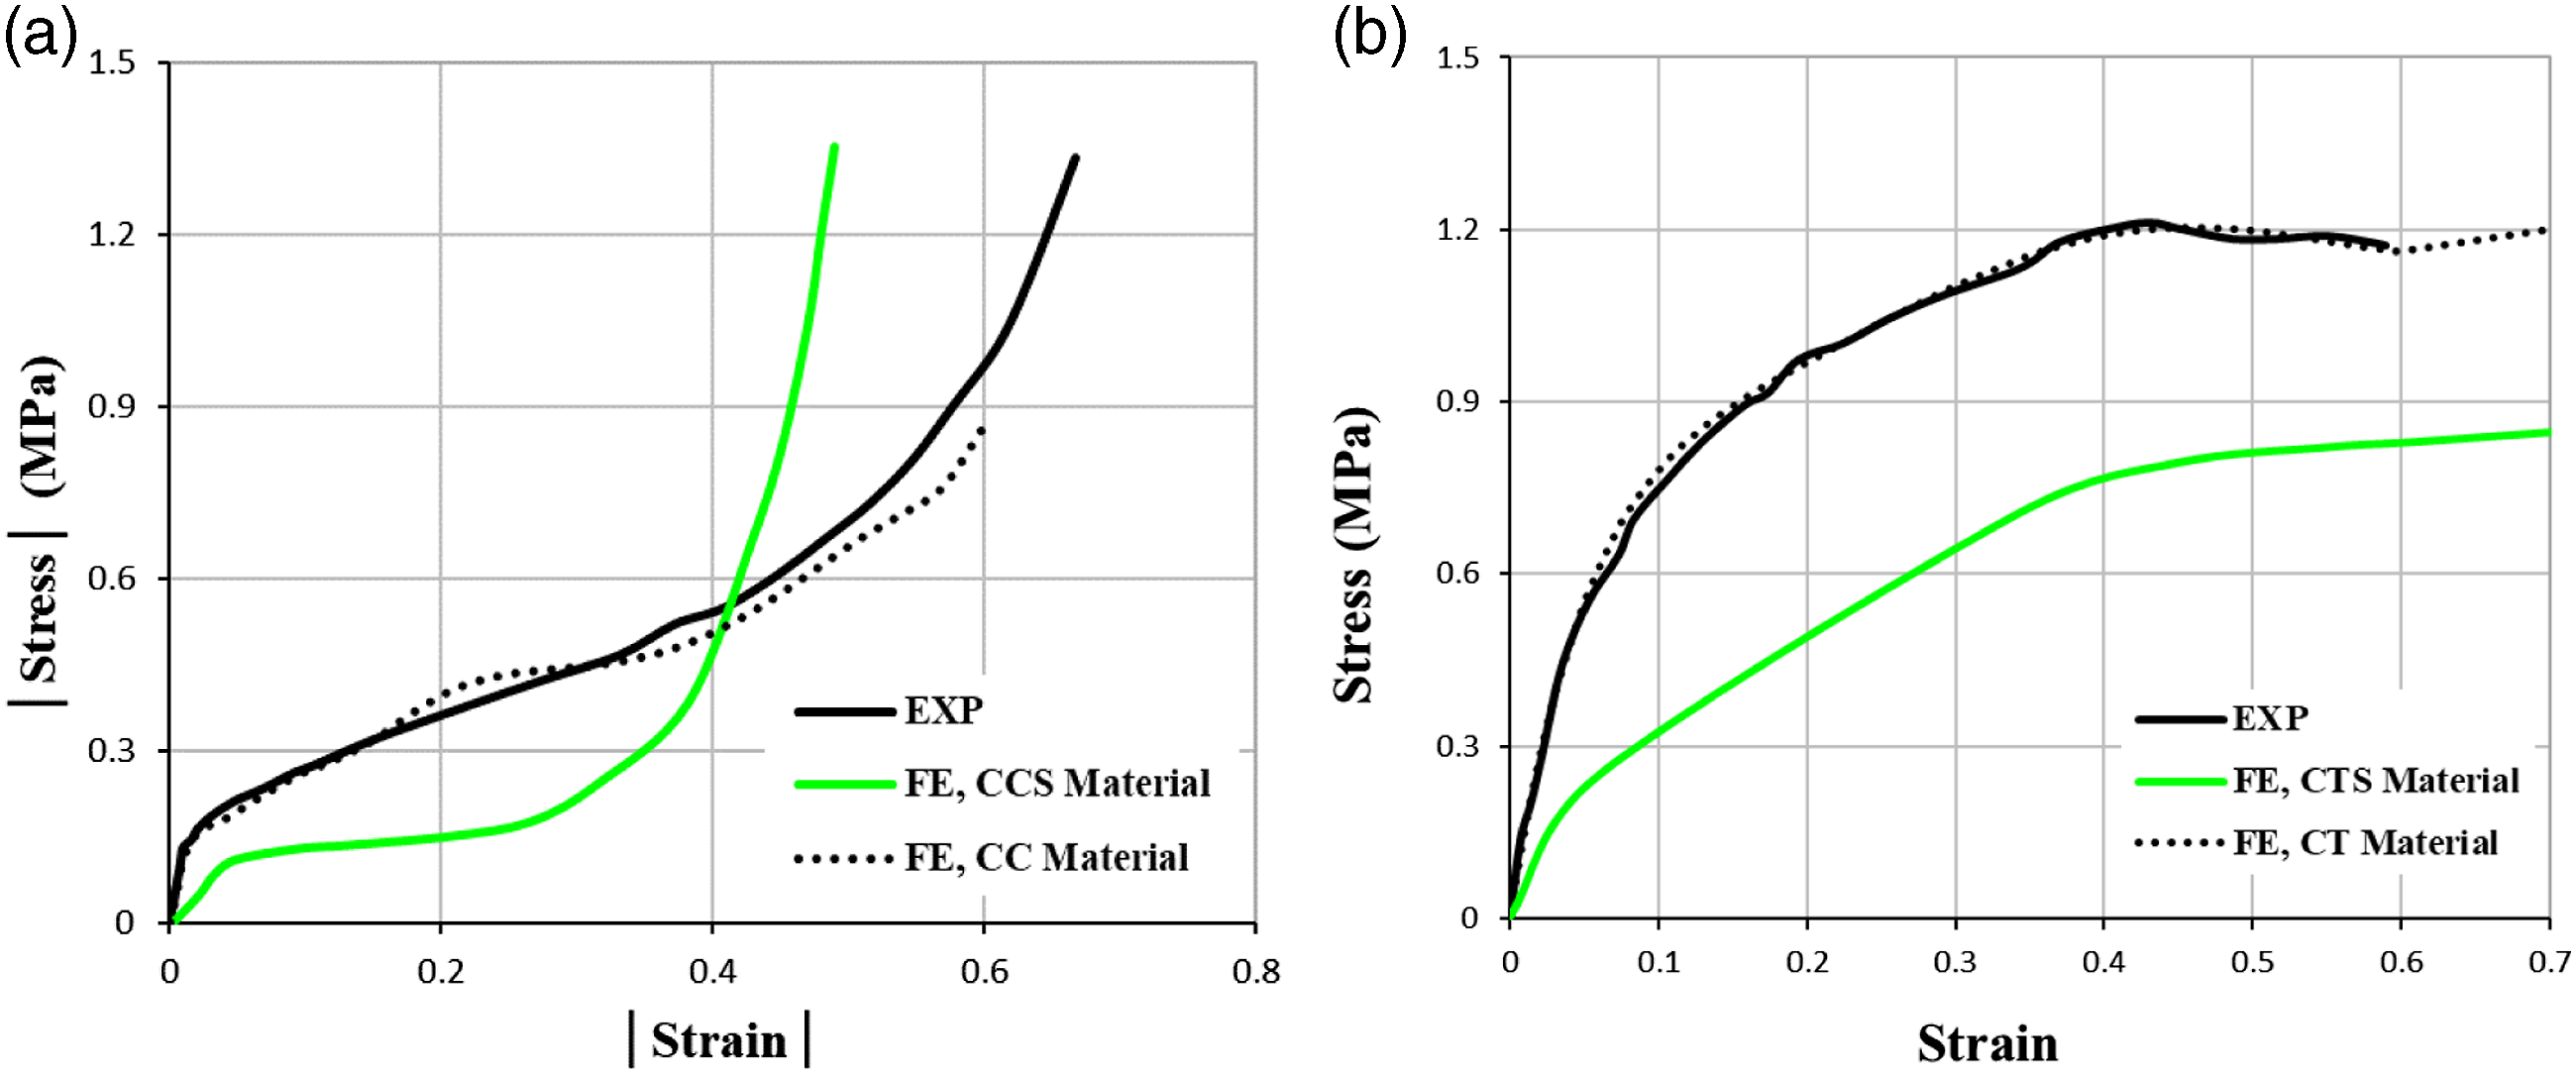
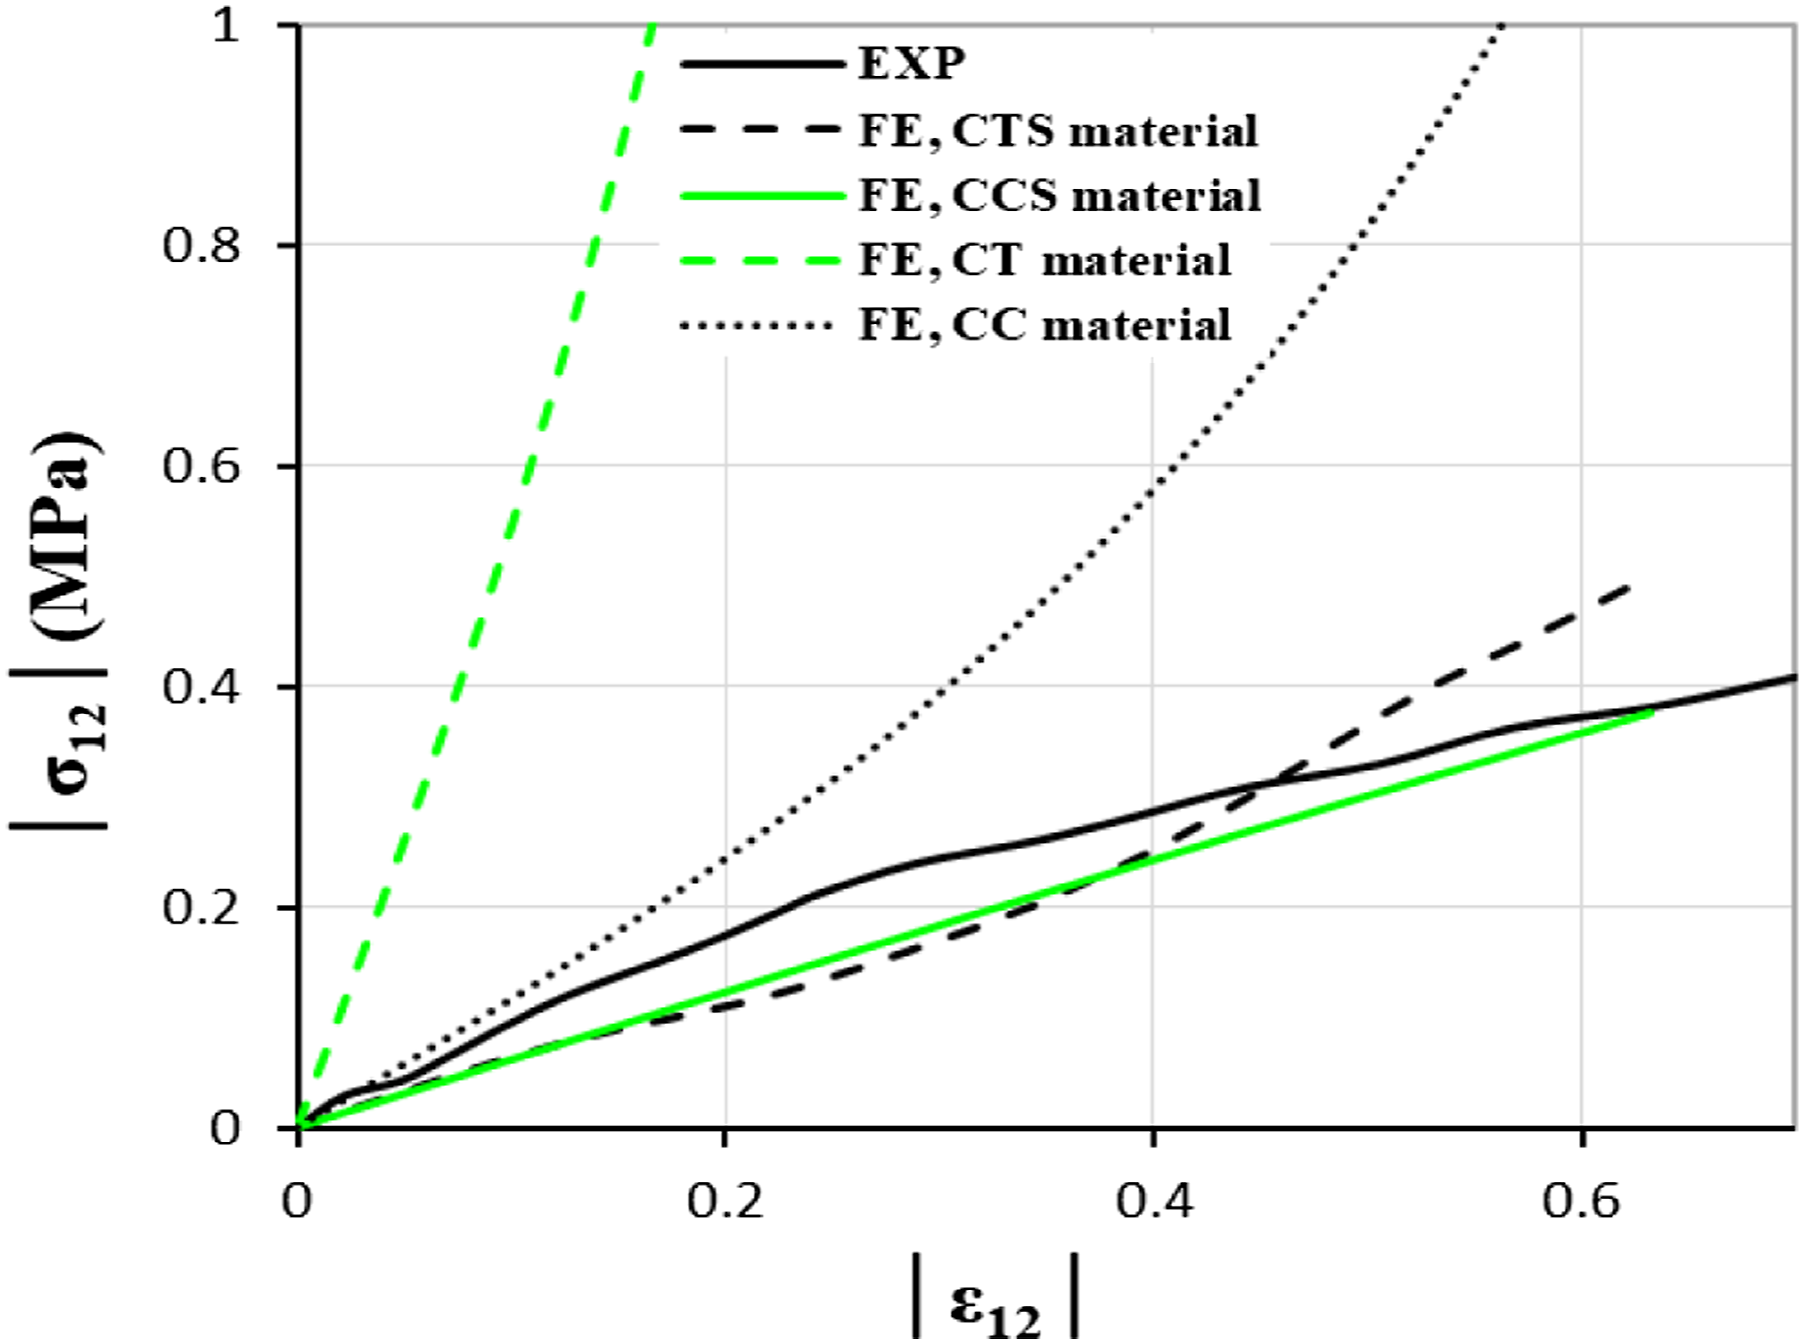
The FE model of the shear test specimen was also created according to the experimental setup, considering a middle rigid plate moving in the loading direction while the lateral rigid plates were fixed. The boundary conditions were applied to the reference points and assigned for each rigid plate, according to the technique described for the uniaxial FE models. The discretization of the shear test specimens was conducted using 2-mm elements. The interaction between the specimens and the rigid plates was simulated by applying a Tie constraint between the components. Figure 9 shows the existence of uniform shear stress on the specimens at the state that the nominal loading strain was equal to 0.4. A comparison of the numerical and experimental results for the shear test is presented in Figure 10. The FE models with application of the energy functions calibrated using the combined shear-uniaxial test data show a good agreement with the experimental results, especially using the CCS material model. However, as expected the application of material models calibrated by the uniaxial experiment results in a large deviation between the FE models and experiments. FE model of the shear test specimen at the state that the nominal loading strain was equal to 0.4. Stress-strain curves obtained by the FE models, applying the various material models in comparison to the shear experiment.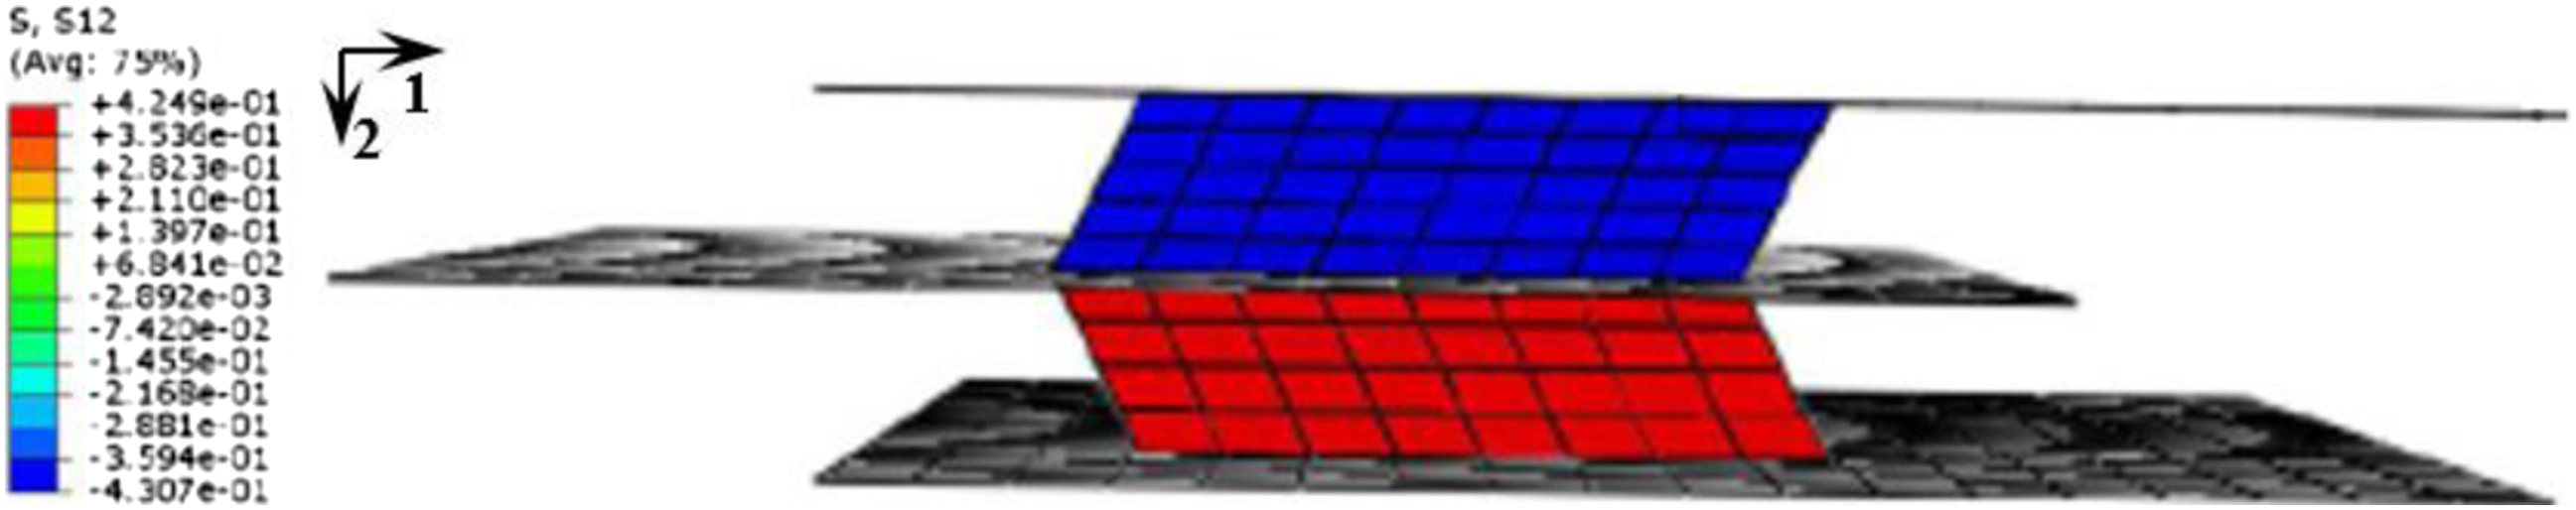
Evaluation of the adaptive model
The accuracy of the FE results, examined in the case of characterization experiments, proved the validity of the FE modeling procedure. In the following, to examine the performance of the adaptive model in simulating the stress-strain response of the elastomeric foam under practical loading conditions, two common application cases are examined: (1) a bending foam beam under a concentrated load at the beam mid-span and (2) a composite sandwich beam with an elastomeric foam core. The results of the adaptive model are compared to the experimental data as well as the numerical simulations, established by the various material models.
Case 1: Bending elastomeric foam beam
The flexural performance of the elastomeric foam beam was examined to create a multiaxial state of stress on the material, so its simulation can challenge the efficiency of the adaptive model. ASTM D790 standard
48
proposes a test method to determine the flexural properties of the reinforced and unreinforced plastics, however; the specified specimen dimensions by ASTM D790 were not deemed applicable to the elastomeric foam materials under study, due to their low stiffness. On the other hand, to the best of the authors’ knowledge, there is no specific standard, recommended for examination of the flexural response in non-Hookean materials. Therefore, the dimensions of the elastomeric foam beam, examined here, were selected rationally to keep stable loading increments on the beam while observing large enough stresses (the maximum stress was in the range of 90% of the ultimate strength). Figure 11(a) shows the dimensions of the experimental setup for this specimen and Figure 11(b) shows the flexural test setup and the elastomeric foam beam under the loading. (a) Dimensions (mm) of the bending foam beam specimen, (b) bending foam beam specimen under loading, and (c) FE model of the bending foam beam specimen at Δ = 30 mm (normal σ11 stress distribution obtained by the adaptive model).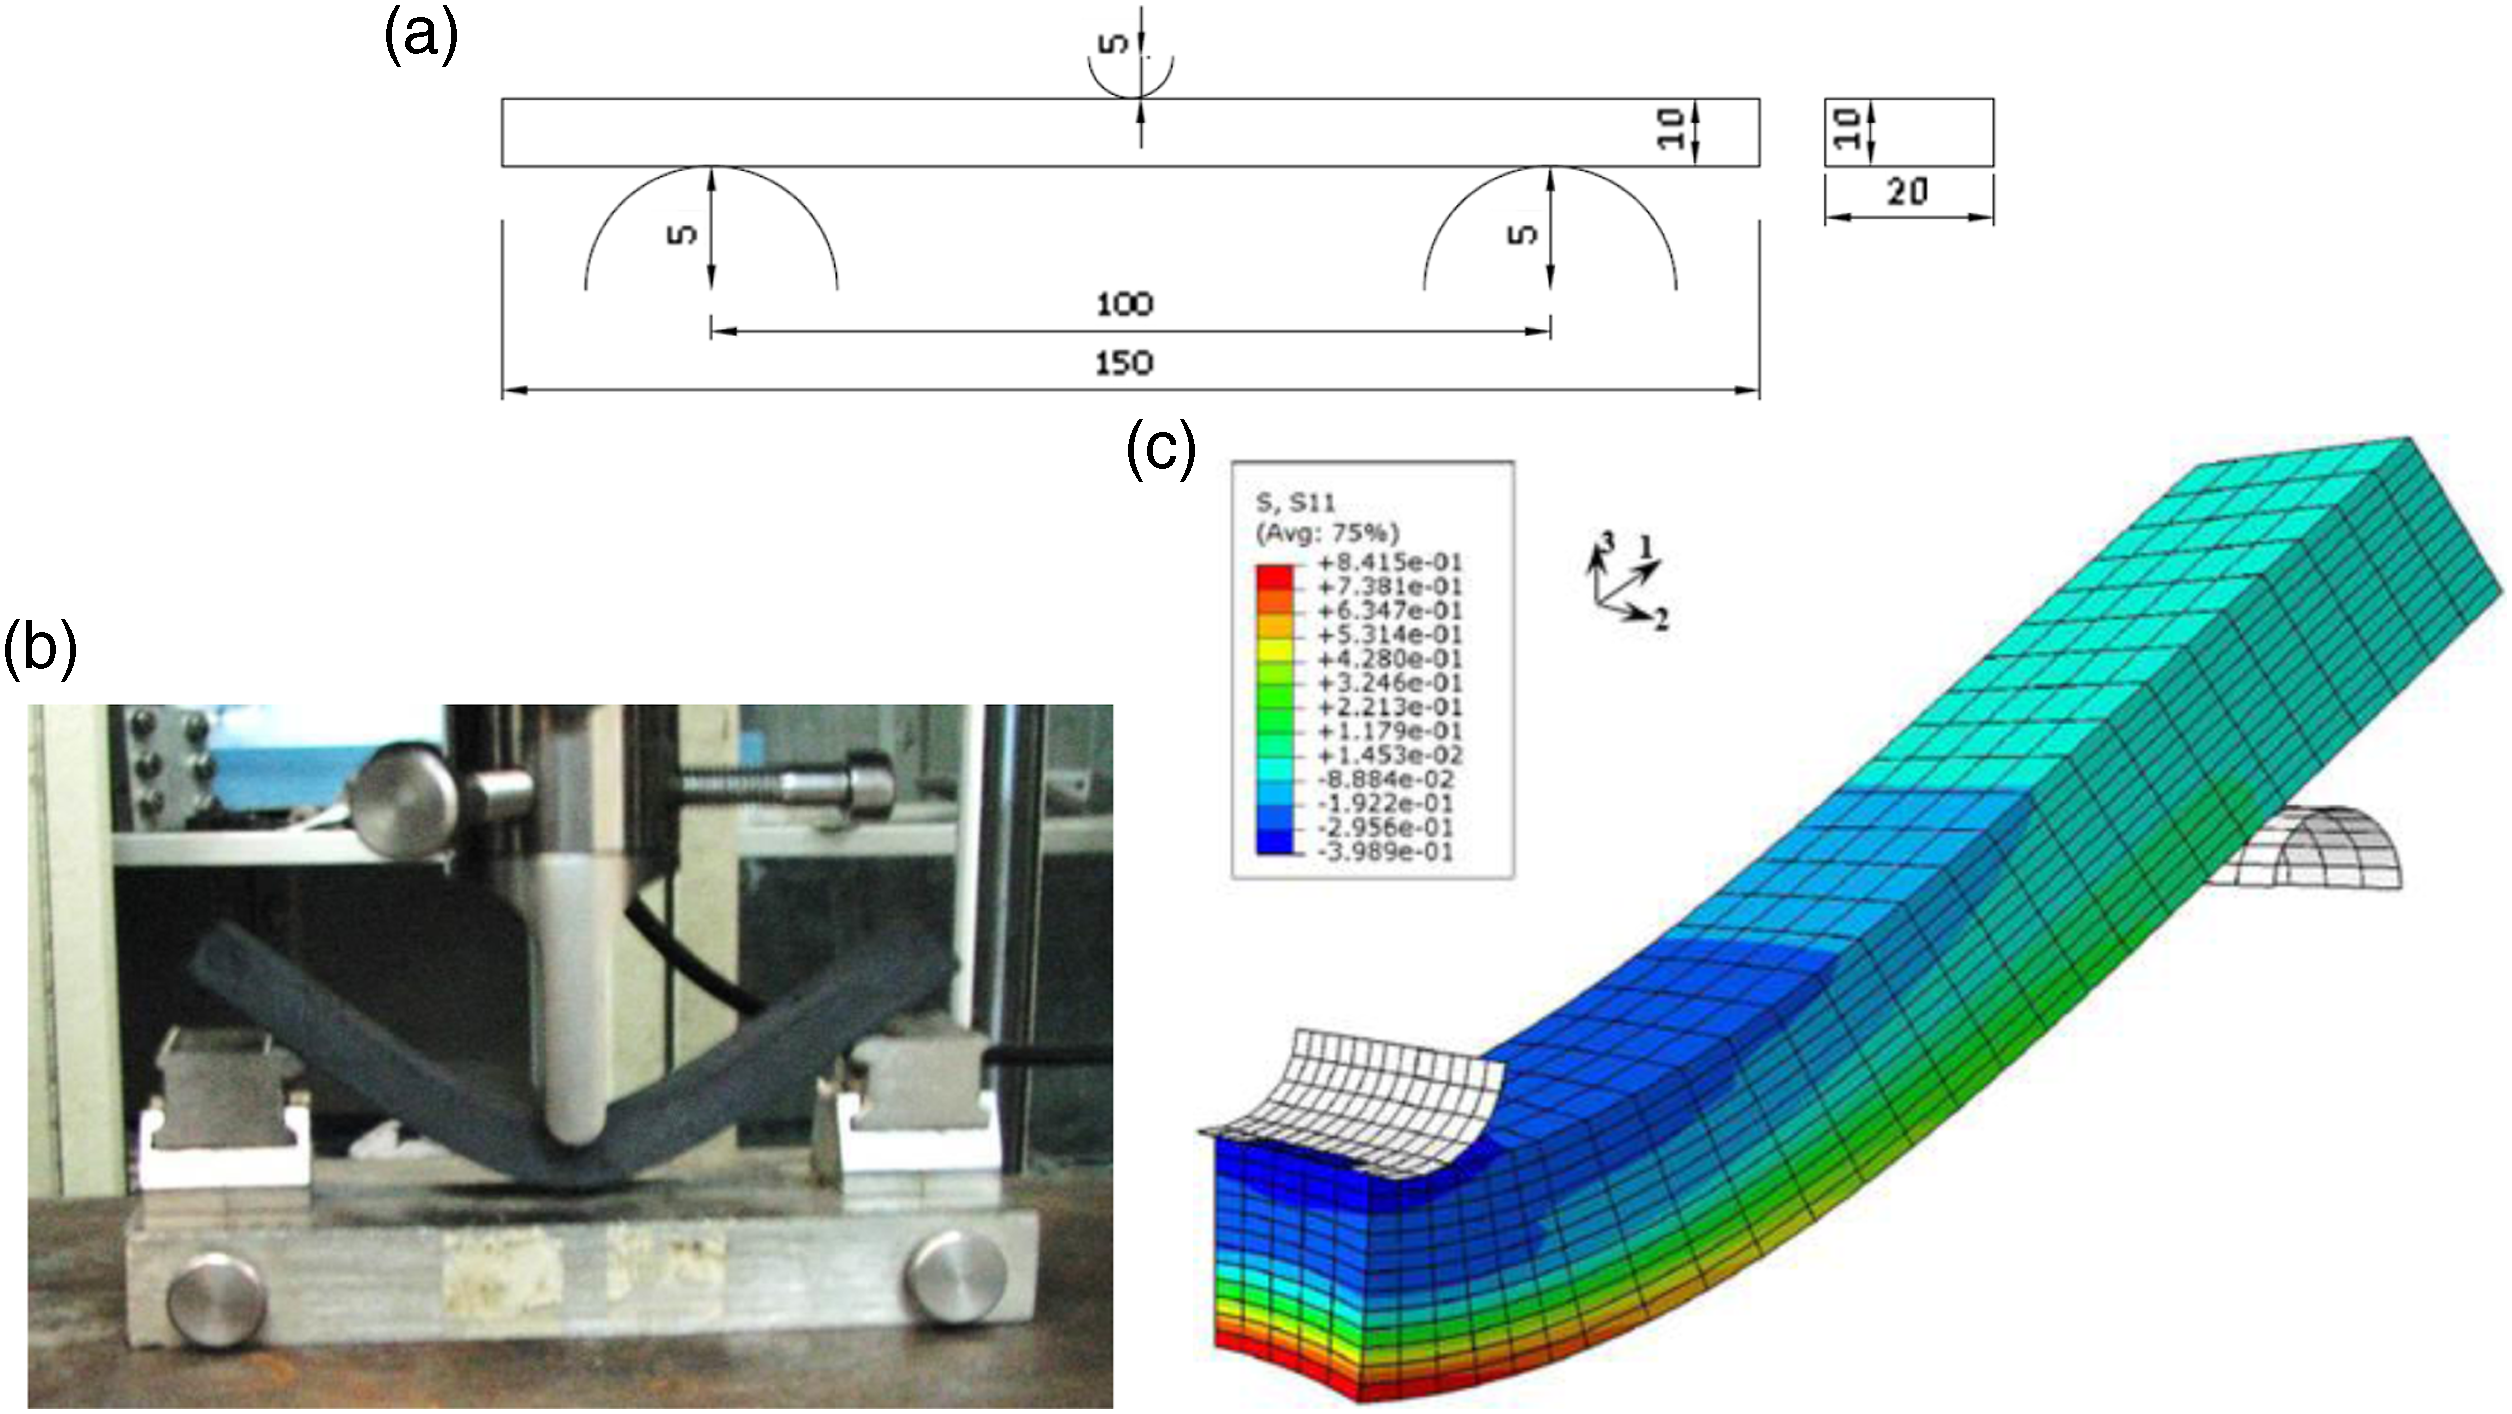
The brick C3D8R and shell S4R elements were used for FE modeling of the beam supports and the loading head, respectively. To reduce the analysis time of the adaptive model, half of the specimen under test was simulated by considering appropriate boundary conditions on the plane of symmetry. To simulate the contact between the various components in the test setup, a hard non-diffusible contact in the normal direction and a frictional contact in the tangential direction were defined. To nullify the influence of the deformations in the supports and the loading head, these components were defined by rigid elements. Then, to apply the boundary conditions, a reference point was determined for each component. Using a master-slave interaction, the DOFs in the rigid components were tied to the DOFs of the related reference points. The reference points were fully restrained, just a vertical movement in the vertical loading direction for the loading head, left free. A mesh convergence study was conducted for the selection of the optimum mesh size for the elements. Based on the mesh convergence study, the element size of 1.5 mm was used at the beam mid-span area, where the elements were exposed to the larger gradient of stress. However, 3 mm elements were implemented in the other regions. Also, the assignment of 12 elements per 10 mm of depth in the beam showed enough accuracy. Figure 11c shows the FE model of the foam beam when the mid-span deflection, Δ, was equal to 30 mm.
For the simulation of the flexural response in the elastomeric foam beam, the efficiency of the various material models, as well as the response predicted by the adaptive model were considered. Figure 12 shows the load-deflection curves, obtained by the FE simulation of the beam in comparison to the experimental results. In the load-deflection graphs, P and Δ denote the applied load and the mid-span deflection, respectively. This comparison shows the promising performance of the adaptive model, and also indicates an underestimation of the results associated with the calibration of the material models by shear test data (CTS and CCS materials). The material model calibrated using the compressive test data (CC material) shows the second accurate prediction which indicates the high dominancy of the compressive response of the foam beam under flexural loading conditions, especially under the loading head. In addition, the results indicate the negligible influence of the shear stress on the load-carrying performance of the elastomeric foam beam. Load-deflection curves for the foam beam specimen, obtained by the FE models, applying the various material models in comparison to the experiment.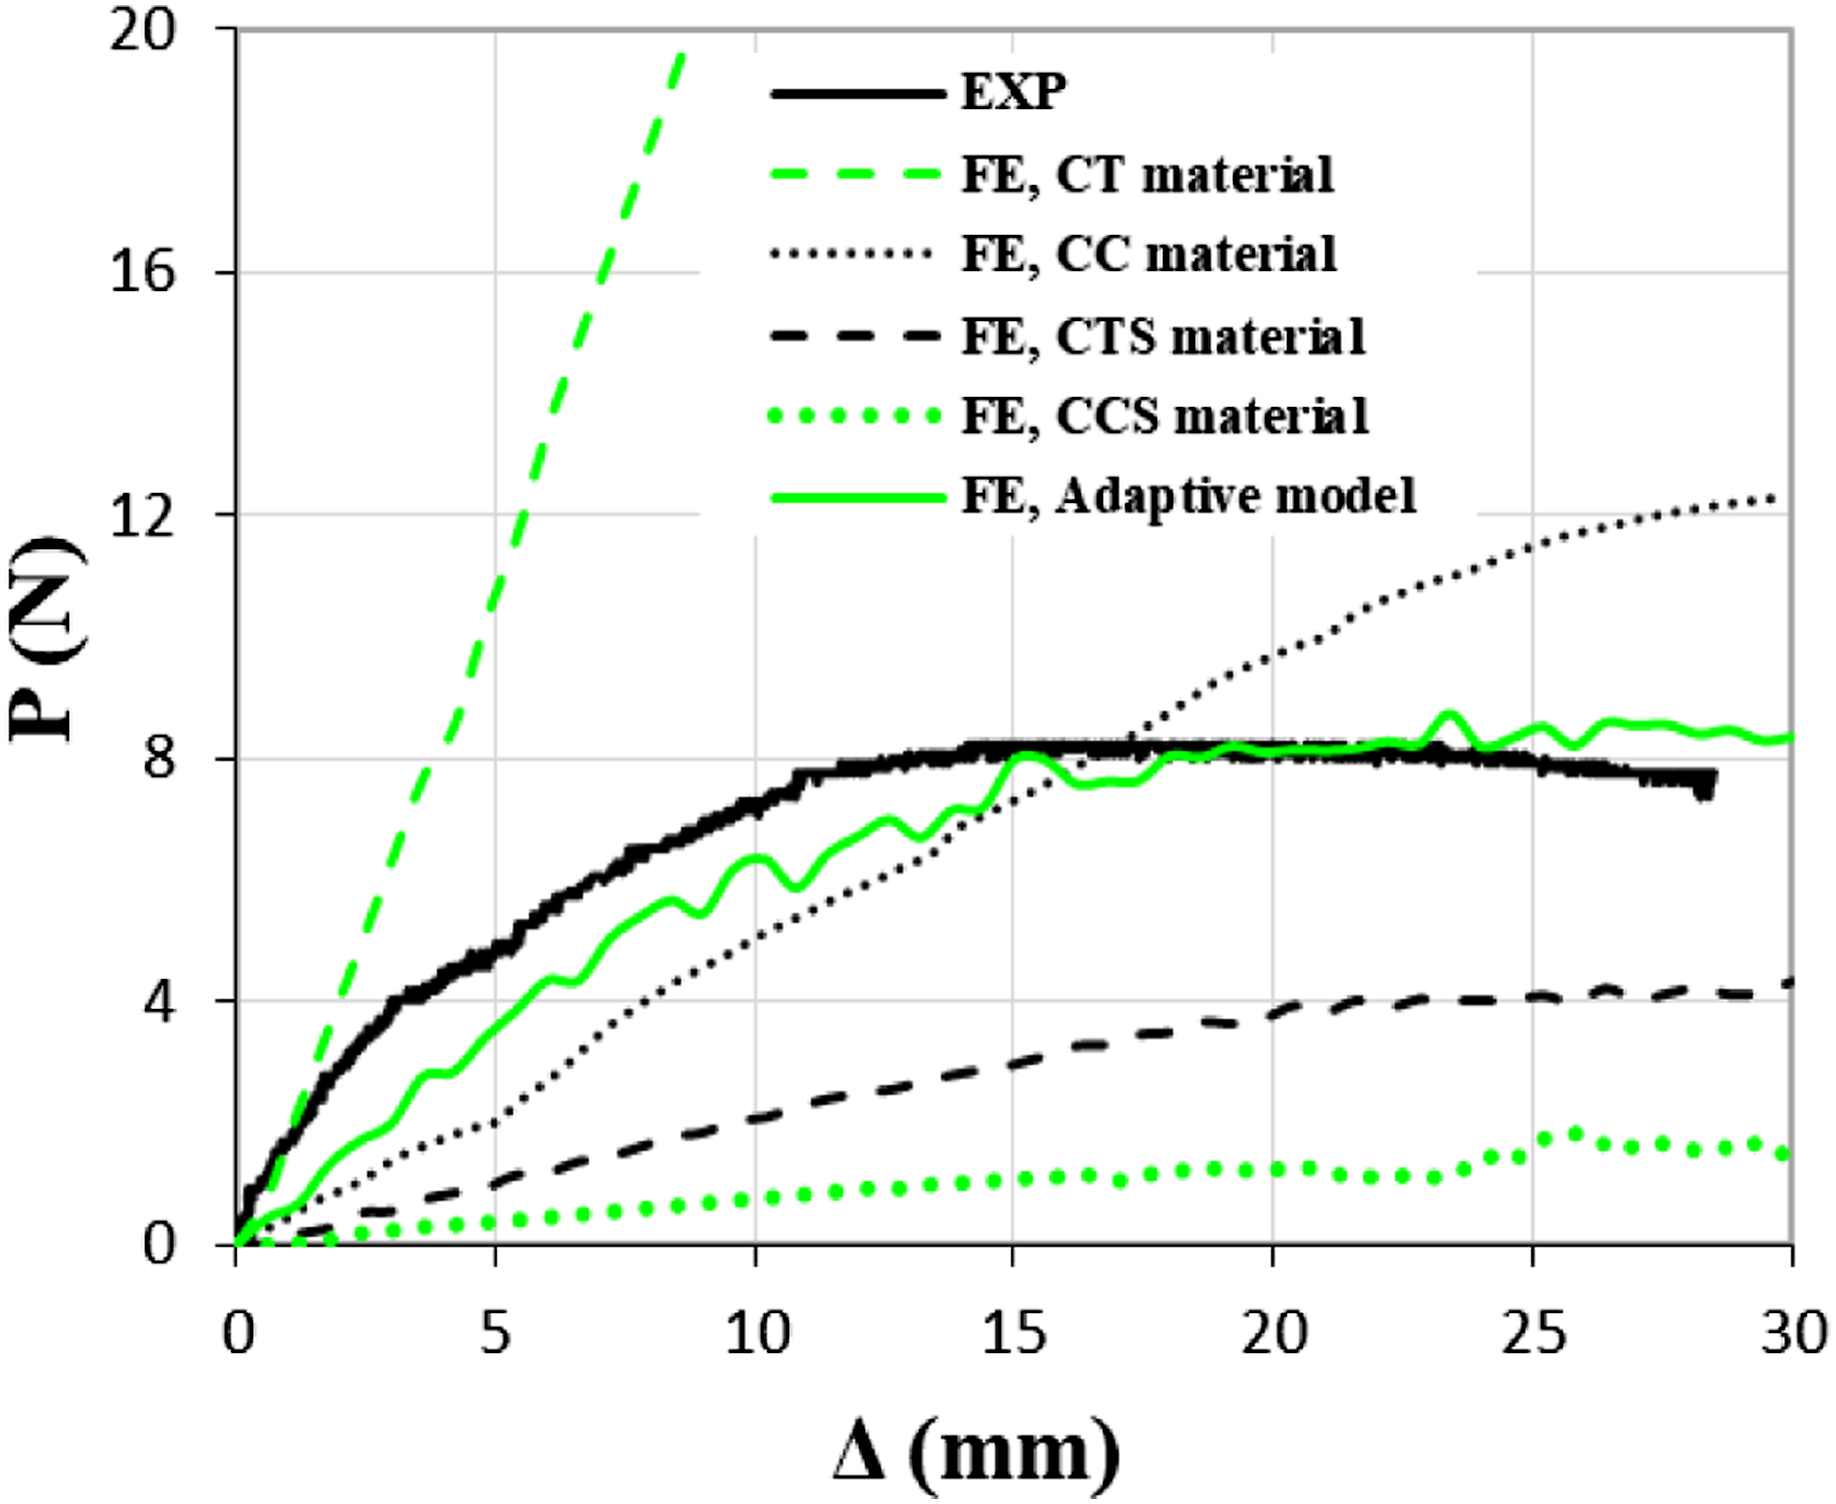
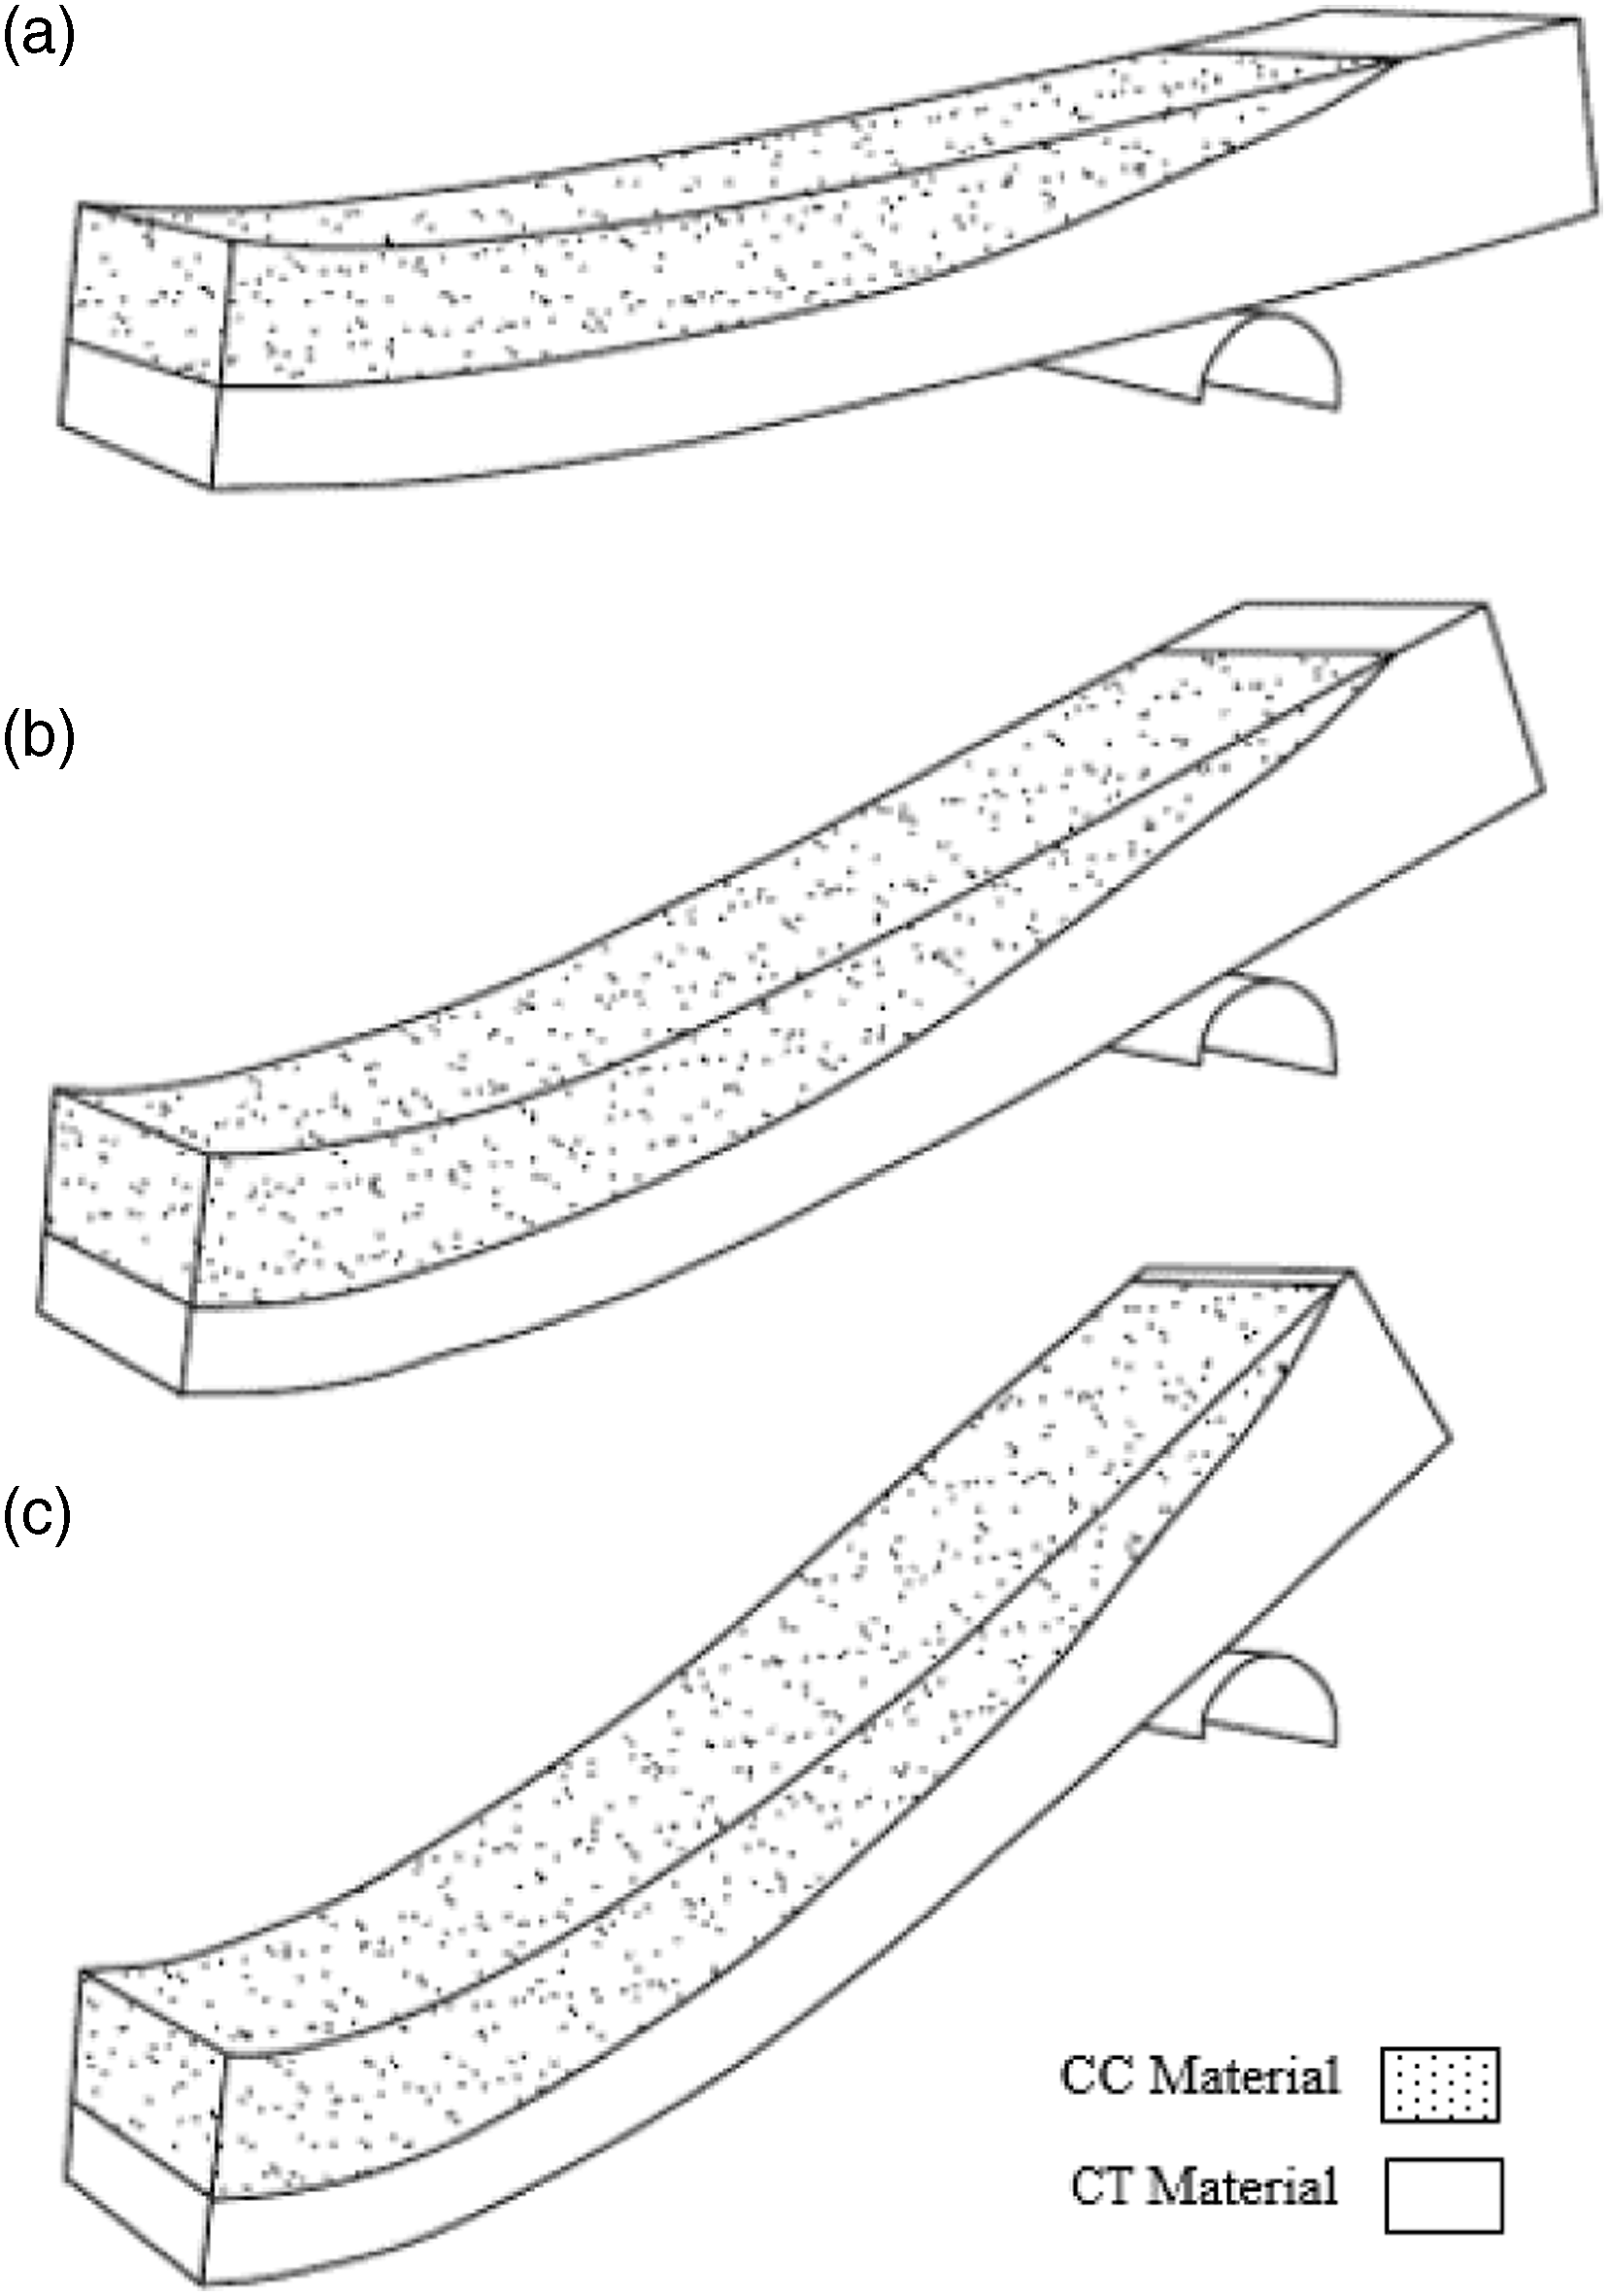
Additionally, as discussed the position of the neutral axis on the beam cross-section can vary along the beam length. This is attributed to the different ratios of the stiffness between the tensile and the compressive response of the foam through the different sections of the hyperelastic stress-strain response of the material. Figure 13 shows the distribution of the normal stress (σ11) over the beam cross-section at Δ = 23 mm, obtained by the adaptive model for three different distances from the beam mid-span (x = 1.7 mm (I–I), x = 19.6 mm (II–II), and x = 38.8 mm (III–III)). Figure 13 indicates the movement of the neutral axis toward the top region of the beam at sections away from the beam mid-span. Another expectation was the possible change in the depth of the compression and tension zones of the beam through the load-carrying period. This was verified using the adaptive model. Figure 14 shows the dominant material response in the beam at three different states under the flexural loading, estimated by the adaptive model. In Figure 14, the hatched and clear areas denote the compression and tension zones, respectively. The ratio of the volume of the compression to the tension regions in the beam was computed as equal to 40%, 43%, and 47%, corresponding to the states at Δ = 10 mm, Δ = 20 mm, and Δ = 30 mm, respectively. This result indicates that although the smaller portion of the foam beam was under compressive stresses, the compressive response of the foam beam dictates the flexural behavior of the beam for the examined dimensions. This is in accordance with the higher accuracy of the CC material model for estimating the flexural response of the foam beam when compared to the CT material model (Figure 12). Distribution of the normal σ11 stress in different distances from the beam mid-span on the cross-section of the foam beam specimen, obtained by the adaptive model at Δ = 23 mm. Dominant material response, estimated by the adaptive model at three different states corresponding to three different load carrying conditions: (a) at Δ = 10 mm, (b) at Δ = 20 mm, and (c) at Δ = 30 mm.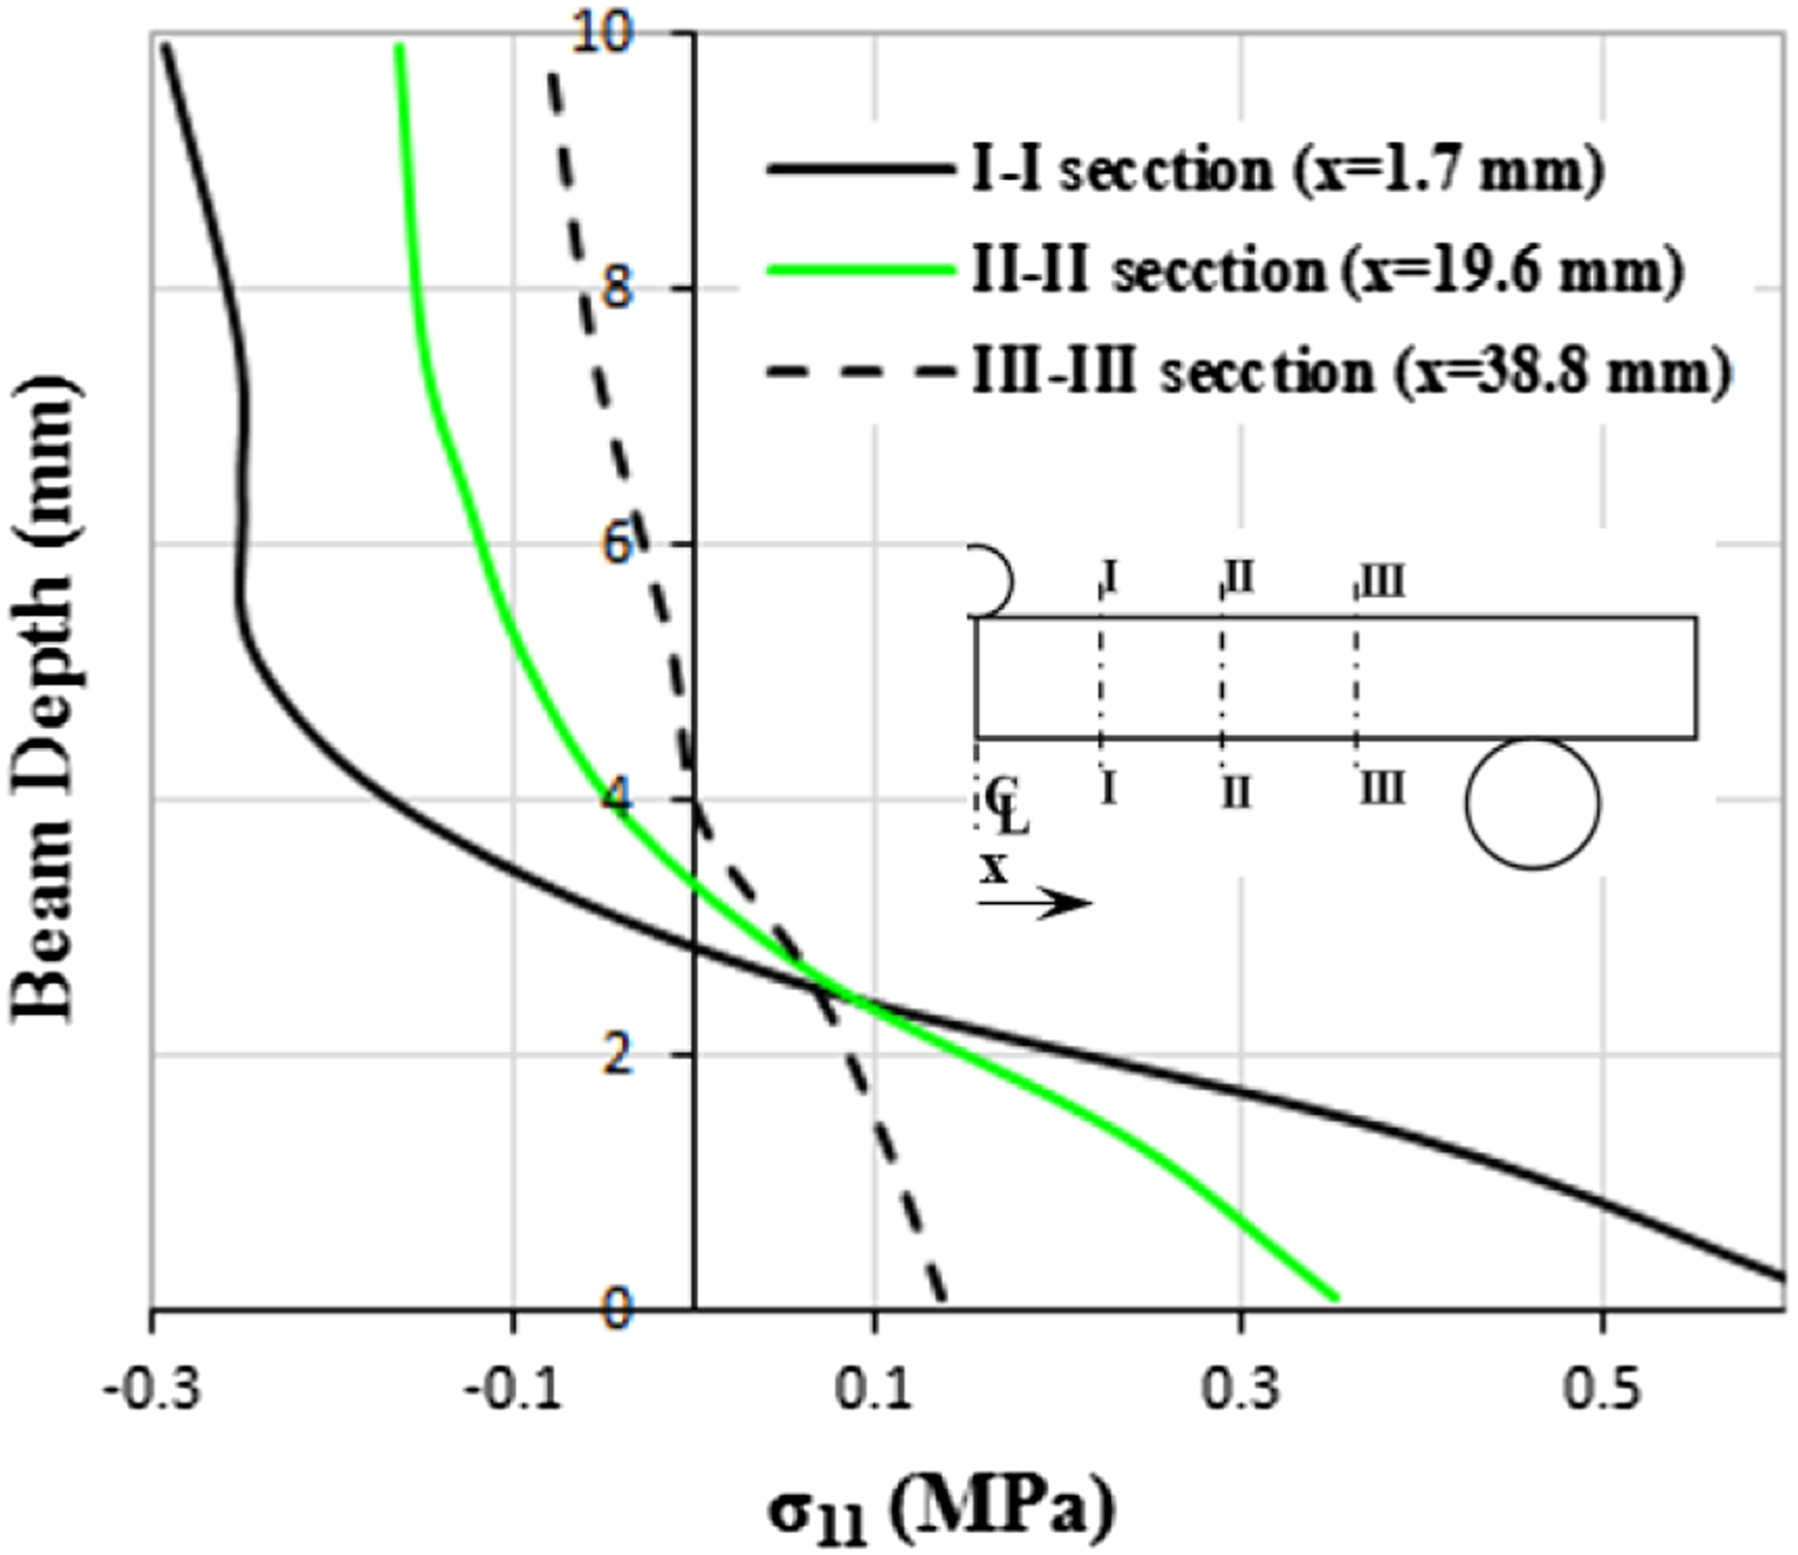
Case 2: Foam core in a composite sandwich beam
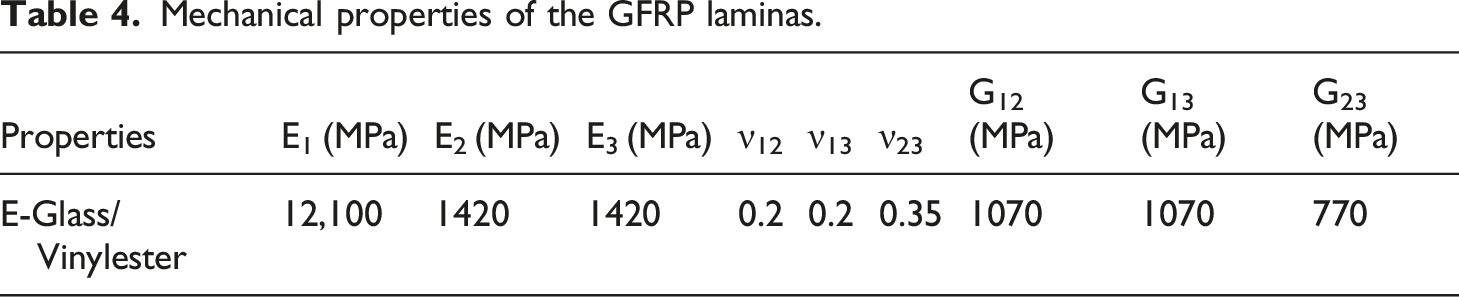
Mechanical properties of the GFRP laminas.
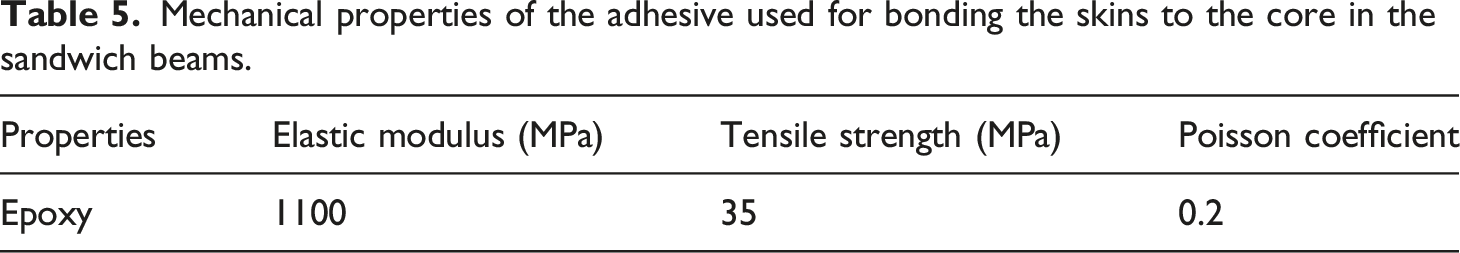
Mechanical properties of the adhesive used for bonding the skins to the core in the sandwich beams.
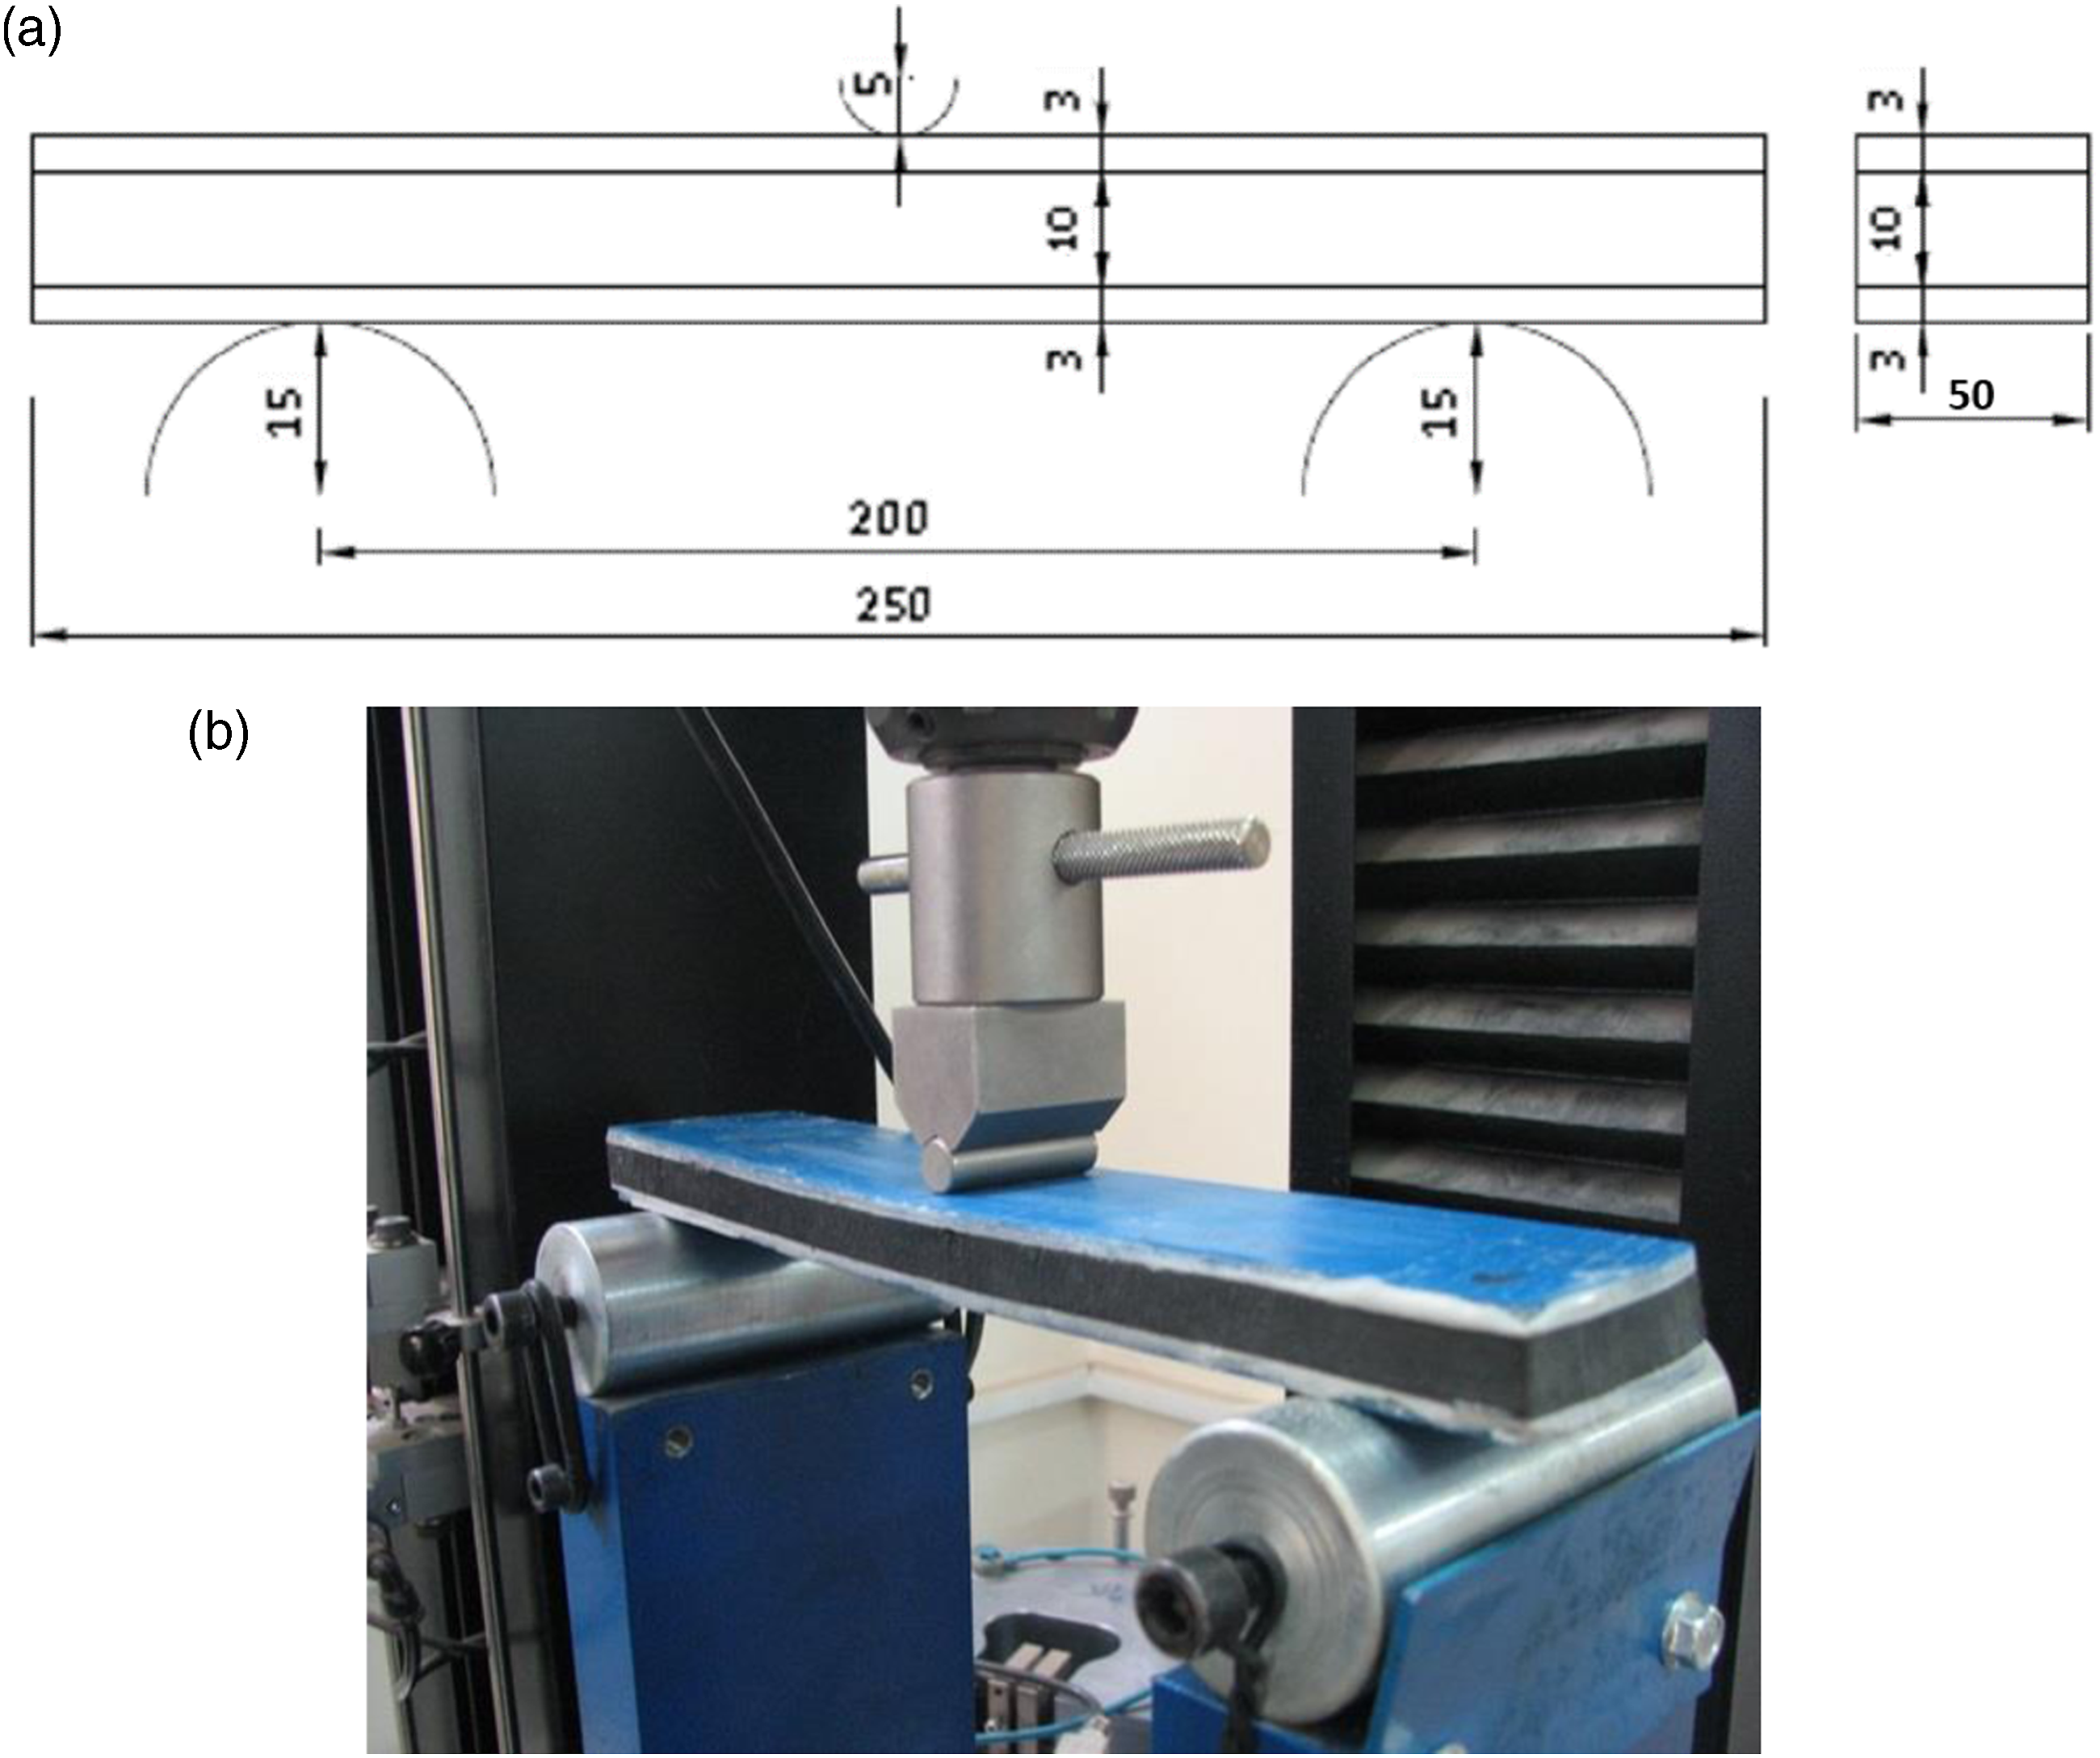
(a) Dimensions (mm) of the bending foam beam specimen, and (b) test setup for the sandwich beam specimen.
The basics of the FE model for this specimen were according to the FE model described for the foam beam in the previous section. The bond between the composite skins and the foam core during the load-carrying stage was simulated using a rigid mater-slave constraint (Tie), modeled by C3D8R elements. The elements used for modeling the general regions (i.e., the regions far from the loading region), had a 5 mm length, while the mid-span loading region, exposed to stress concentration was modeled using the 2.5 mm length elements (Figure 16). A mesh convergence study proved the sufficient accuracy of the results for the models with one element per layer of the skin laminates over the thickness and eight elements over the depth of the foam core. FE model of the sandwich beam specimen at Δ = 20 mm (normal σ11 stress distribution, obtained by the adaptive model).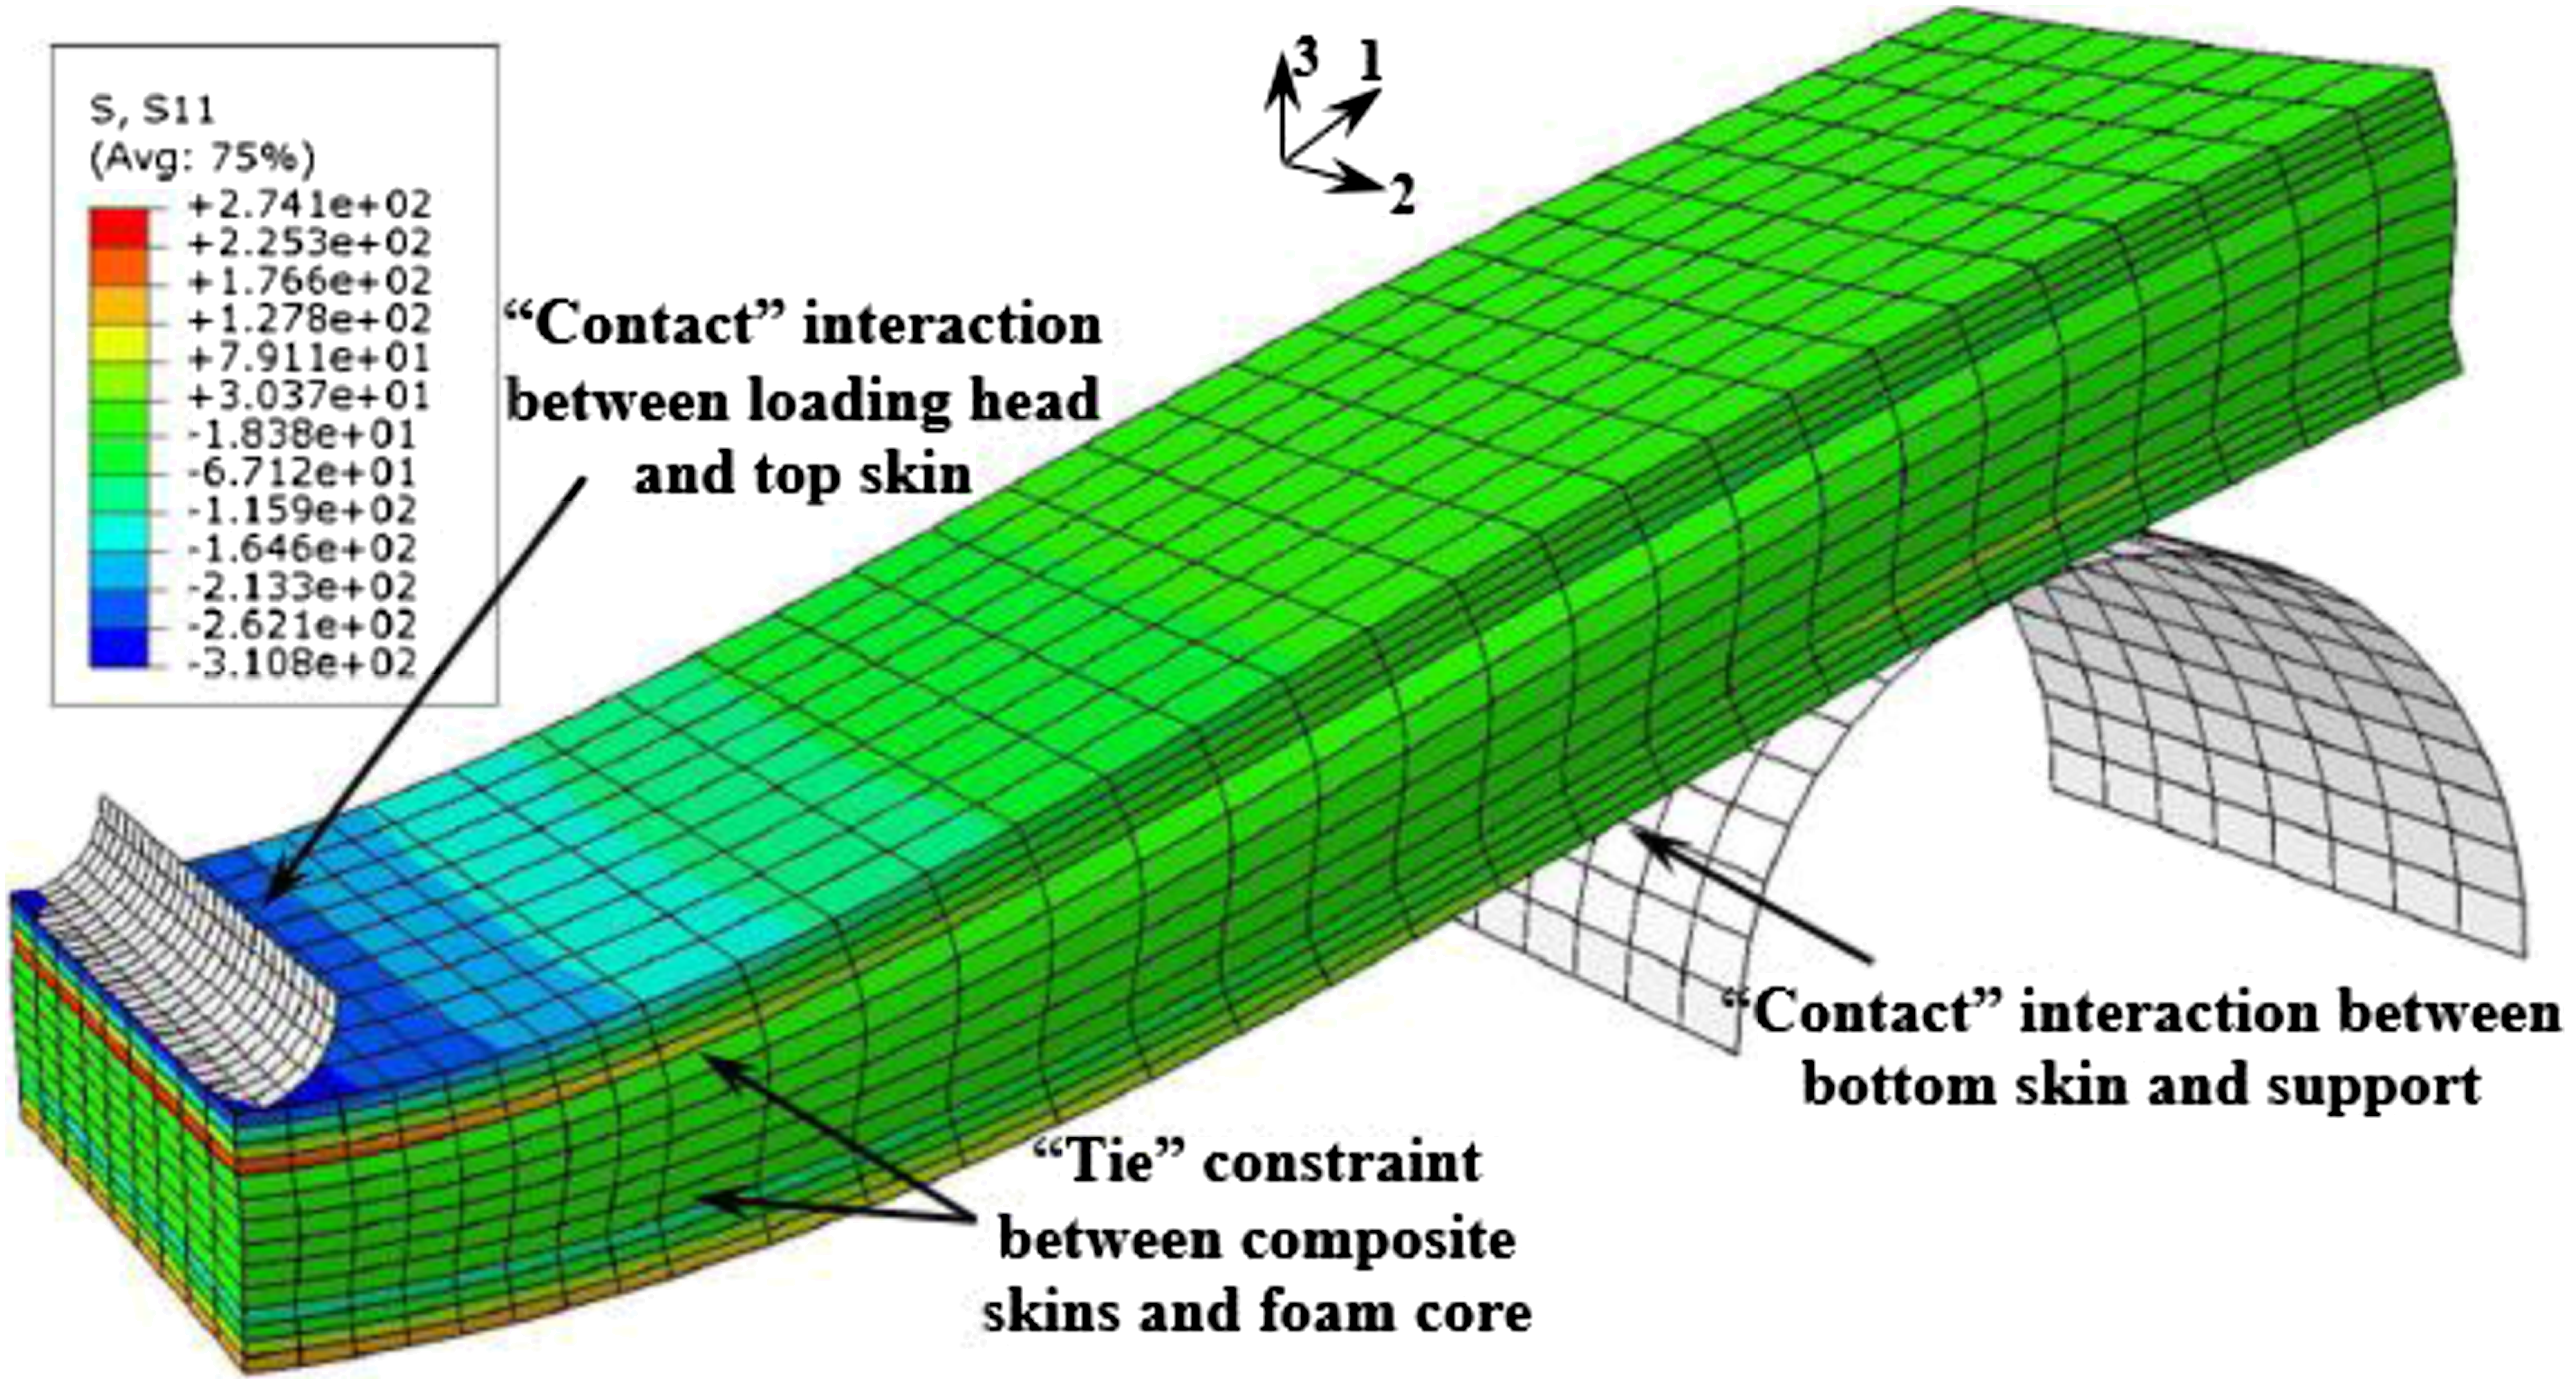
Figure 17 compares the experimental and numerical load-deflection graphs for the composite sandwich beam specimen, using various responses of the foam core in the FE models. According to Figure 17, the FE model based on the CT material model, calibrated by the tensile test data, considerably overestimates the stiffness of the sandwich beam. However, the FE material models, calibrated by the shear test data (CTS and CCS), underestimate the load-carrying capacity of the sandwich beam. The results predicted by the adaptive model show an excellent degree of accuracy compared to the experiments, followed by the CC material model, calibrated using the compressive test data. For the sandwich beam specimen, the poor correlation of the CTS and CCS material models indicates that the shear response of the foam core has less impact on the load-carrying behavior of the sandwich beam. In other words, if the shear response was effective on the performance of the sandwich beam, a lower stiffness for the sandwich beam would be observed. Based on the accuracy of the CC material model, it can be concluded that the compressive response of the core foam has the dominant influence on the behavior of the sandwich beam. Load-deflection curves for the sandwich beam specimen obtained by the FE models, applying the various foam material models in comparison to the experiment.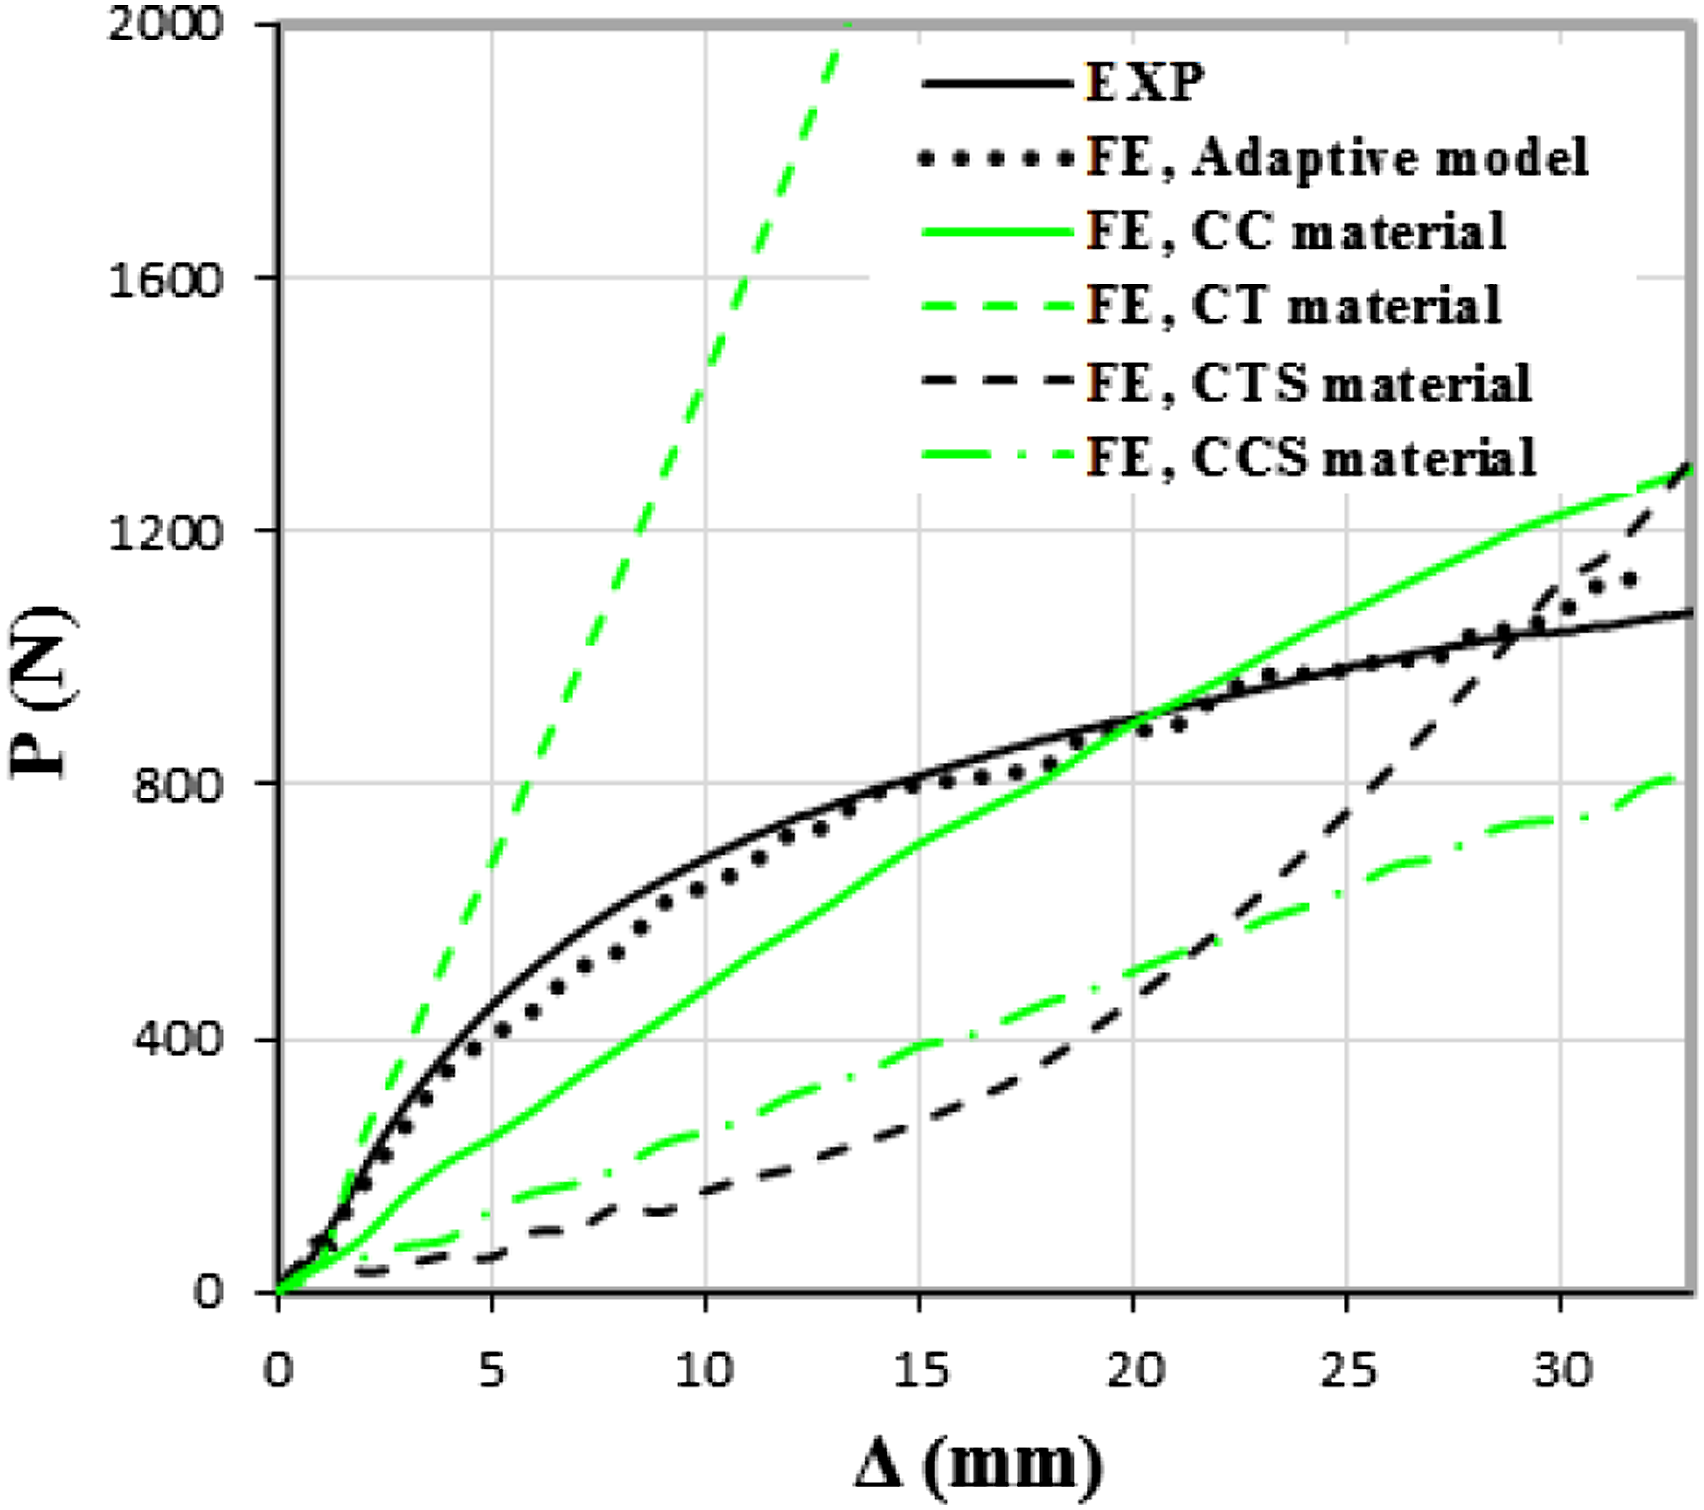
Conclusions
This study aims to develop a numerical model capable of reflecting the effective mechanical properties of porous elastomeric materials under a multiaxial state of stresses experienced under practical loading conditions. To achieve this purpose, an intelligent adaptive model was developed to utilize a material library consisting of different responses of the material under simple states of stress. An elastomeric foam made of PE-EVA was selected to examine the efficiency of the model. Two energy functions were calibrated by tensile (CT) and compressive (CC) experiments and two material models were calibrated using the combined shear-uniaxial experiments (tension and shear (CTS) and compression and shear (CCS)). The material library was linked to the ABAQUS so that the main program could update the mechanical properties at each section point of the FE models with the load increments. The second-order polynomial function illustrated the best-fit to experimental results among the well-known energy functions to mimic the hyperelastic response in the foam material.
The efficiency and performance of the adaptive model were examined using two practical case studies, in which the material was exposed to multiaxial stress conditions. In the first case study, a foam beam under a concentrated load at the mid-span was simulated. The adaptive model was able to update the effective mechanical properties according to the type of the dominant stress at each section point, and accurately estimate the location of the moving neutral axis as a function of span length. In the second case study, the adaptive model showed a promising simulation of the response of the foam core in a composite sandwich beam, in comparison to the experimental results. However, the results estimated based on the individual material models (e.g., CT or CC) were not in agreement with experimental results. By comparison of the experimental and numerical results the below remarks are outlined: - The CT material model overestimated the experimental results by observing a large stiffness for the material, measured under tension. - The CC material model underestimated the experimental results. - The inclusion of the shear test data (i.e., the use of the CTS and CCS material models) in the simulation of the experimental specimens under flexural loading conditions substantially underestimated the stiffness of the foam material. This indicates the minor influence of shear response on the load-carrying behavior of the foam material. - Using the adaptive model, a piecewise second-order polynomial energy function was employed for simulation of the strongly nonlinear response of examined foam under compressive loading, which estimated accurate stresses for the various amplitudes of loading strain.
Footnotes
Declaration of conflicting interests
The author(s) declared no potential conflicts of interest with respect to the research, authorship, and/or publication of this article.
Funding
The author(s) received no financial support for the research, authorship, and/or publication of this article.