
Abstract
In this work, we used a 3D scanner for the volume measurement of foamed samples, a long-standing problem in the density evaluation of foams. The 3D scanning density measurement method can be selected as an alternative to or in combination with well-established, classical methods that involve the use of instruments like a caliper, a pycnometer, or other devices based on displacement or flotation principles. In particular, the classical methods show some limitations when the foamed sample geometry is irregular, when the polymer is highly hygroscopic, and when it has open porosities. We have tested numerous foamed samples of different sizes, shapes, densities, materials, and morphologies. We utilized different 3D scanner configurations for their volume measurement and compared the results with geometrical and displacement methods, when possible. Results showed that the proposed method is highly accurate, reproducible, and simple, although some specific precautions should be put in place to avoid misinterpretation by the shape-reconstructing software.
Introduction
Density is a key property of materials in general. It is the most important in foams, where pores (also, cells) are purposely introduced to build the structure of these peculiar materials.
To determine the density of a foam, measurement of its volume and mass is required. The latter is generally not critical, since a technical or analytical balance having the proper precision is easily accessible and cost-effective. In the context of polymer foams, employing existing standards to measure sample volume poses significant challenges. These challenges not only diminish the precision of the measurements but, in certain instances, also hinder their practical application. In foams, the density is the main characteristic defining the mechanical, 1 thermal, acoustic, and other properties. For instance, Young’s modulus and strength have a quadratic, 2 while thermal insulation has a linear dependence on the foam density, provided, in the latter case, that the structure is a closed-celled one. 3 Moreover, density directly (linearly) defines the price of the product, since the pores are practically costless. Although the blowing agents utilized to produce the pores have a cost, on a volume basis this cost is often negligible, compared to the cost of the polymer. 4 Density measurement is an old problem since density has been used to assess products and materials since the beginning of humanity. 5 Several techniques are currently used to measure materials density.6–8 By limiting this discussion to foams, and since sample mass is an easy measurement, measuring the foam volume represents the main hurdle and is the focus of research and technical interest. 9 When uniform foamed samples of simple geometric shapes, such as a cylinder or a box, are available, a ruler or a caliper may be sufficient, depending on the required precision of the measurement. However, in most cases, the samples to be analyzed have complex and irregular shapes. For instance, in laboratories studying foams and foaming processes, as well as in industrial practice, when new products are to be developed, samples of irregular shapes are produced. Furthermore, irregularly foamed samples are usually cut into smaller pieces to study their properties.10,11 Cutting to regular shapes such as extremely compliant, sometimes fragile materials is not trivial. For the above reasons, alternative methods for volume measurements are in order.
The methods nowadays adopted to measure foam volumes are: (1) geometrical by calipers, (2) buoyancy, (3) density gradient columns, (4) picnometry, (5) tomography and (6) photogrammetry.9,12 These will be described in detail below to show their features and limitations.
This work introduces three-dimensional (3D) scanning to measure the volume polymeric foams. Nowadays, such equipment is finding wide diffusion for the development of low-cost 3D printing systems.13–18 There are several 3D scanning techniques on the market, and many products are based on them. Currently, 3D scanners priced below $ 1000 boast a resolution of 0.1 mm, which aligns seamlessly with the necessary accuracy for measuring the volume of samples investigated in this study. As the technique advances, a continuous enhancement in resolution is expected over time.
The primary objective of this work is to show that 3D scanning can accurately measure the volume of foamed samples, including the irregularly shaped or open-porosity ones, surpassing the limitations of traditional methods. Although 3D scanners have been available since the early 2000s, their use has been largely confined to design and prototyping. This paper aims to guide the proper use of 3D scanning technology to precisely measure the volume of foamed samples.
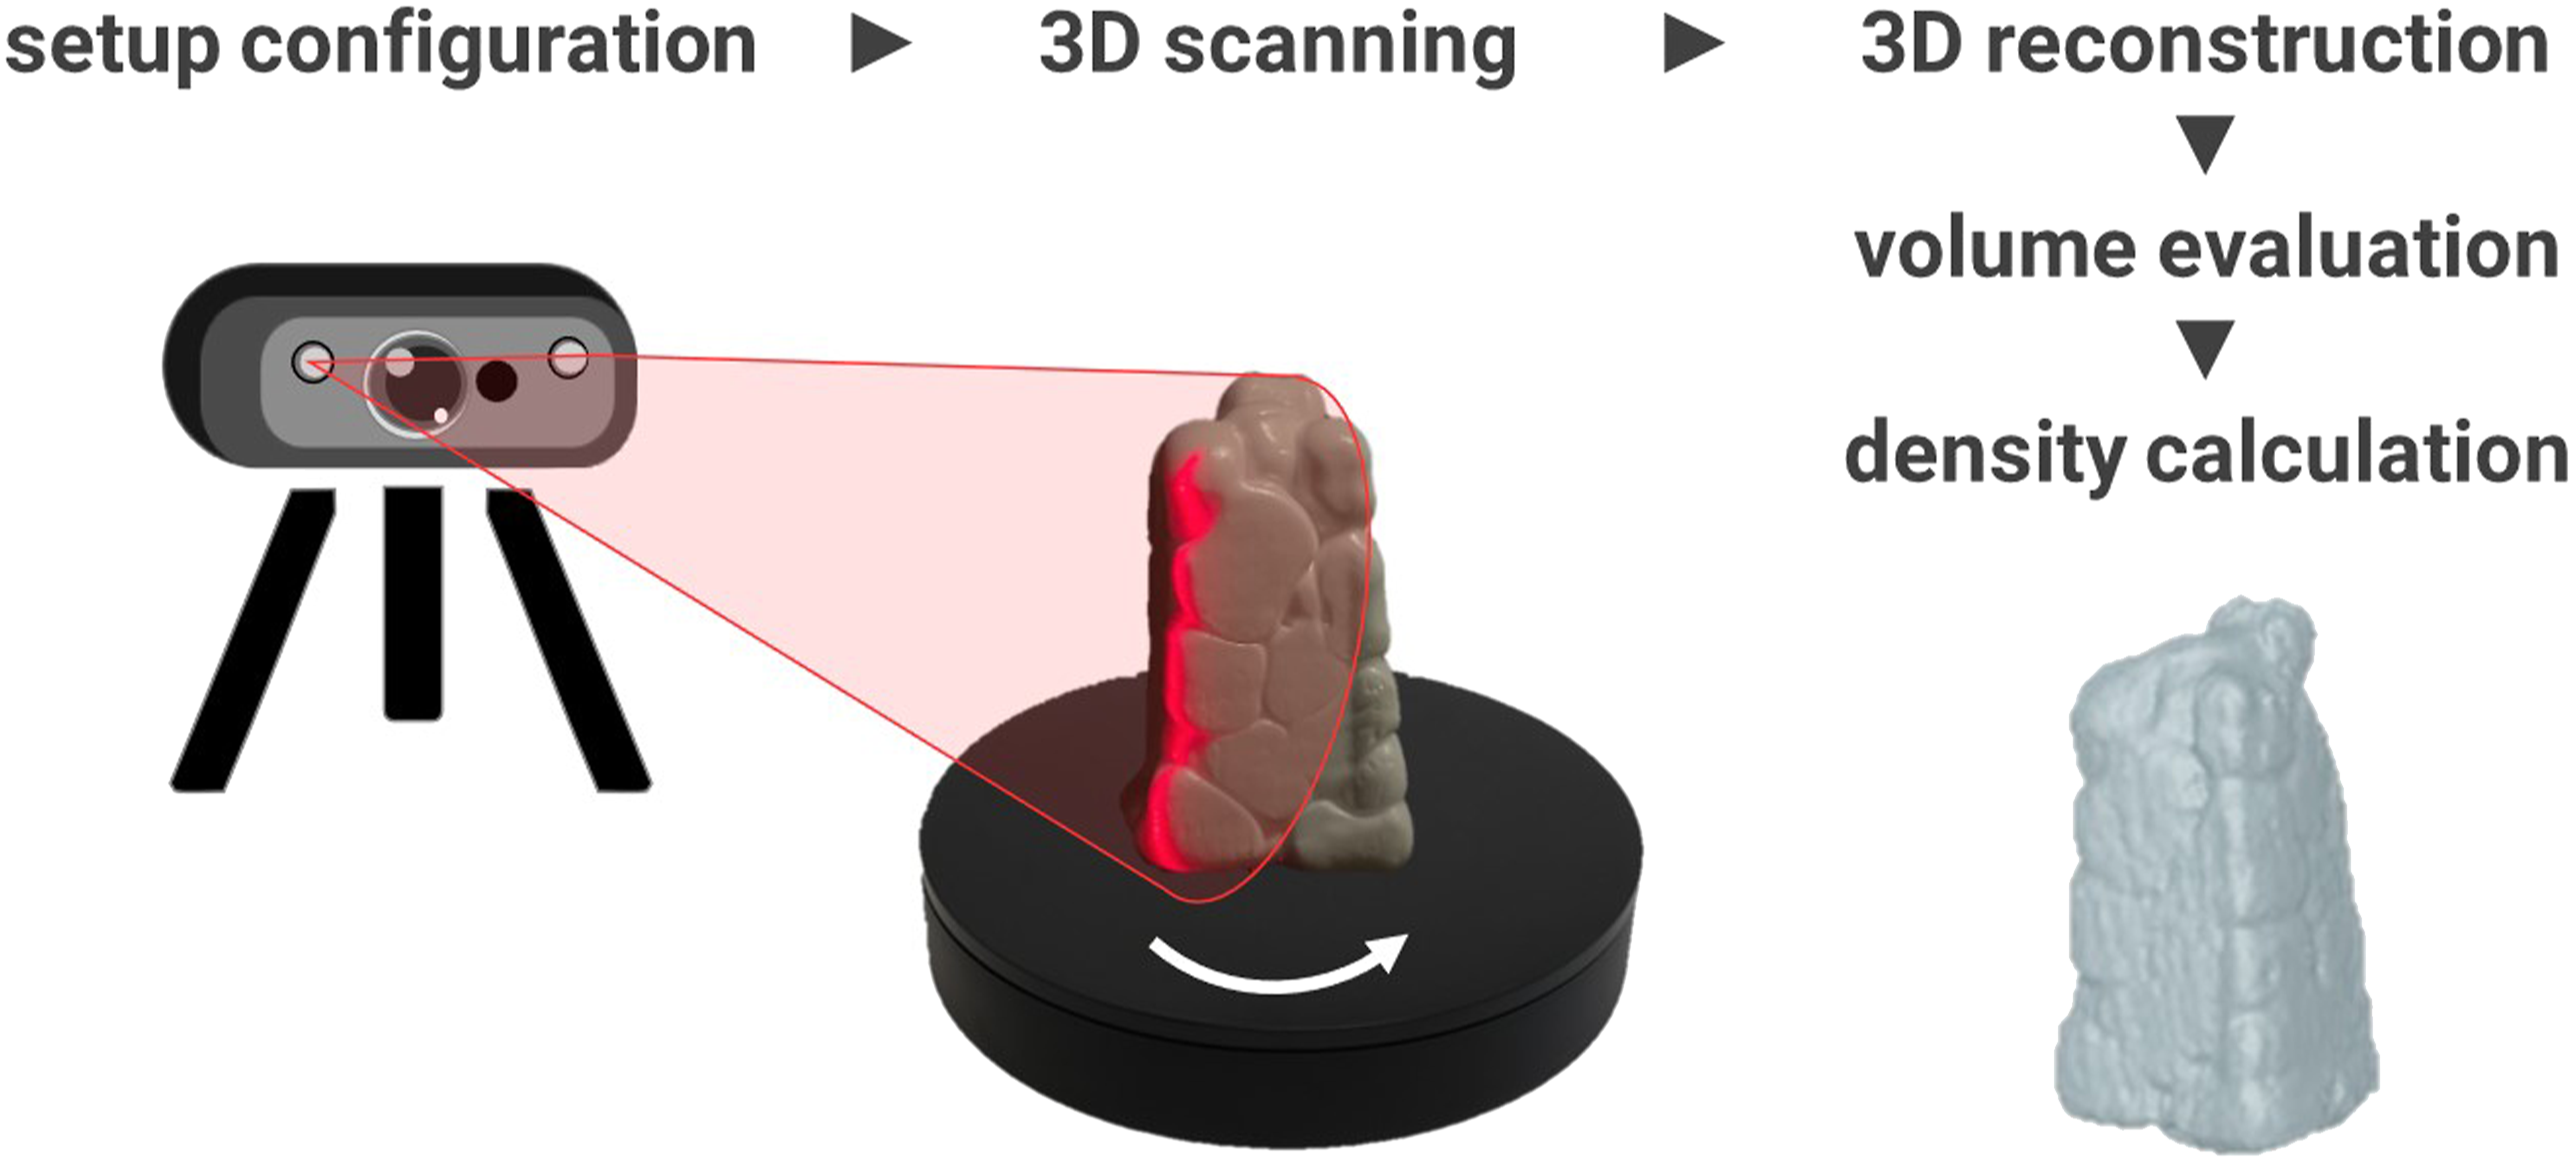
In the present work, the 3D scanner mod V2 from Matter and Form has been used. The scanner is supported by the MFStudio software from Matter and Form. The scanning is optical, with a laser (or two lasers, depending on the settings) employed to detect the object’s surface points. The data collected are elaborated by the software that reconstructs the scanned image and creates a virtual 3D model. At the same time, the software calculates the volume of the body scanned. The choice of using a 3D scanner to measure the volume of a foam arises from the need to find an alternative to the technique described by the American Society for Testing and Materials International (ASTM) D-792 standard, a reference in the industry. The latter has some critical issues related to the use of liquids when measuring the density of foams.
Geometrical method
Evaluating the volume of a sample by measuring its dimensions is a feasible method when the sample has a regular shape
19
.The method, in the case of cellular plastic, is described in ASTM D1622
20
or eqivantley in ISO 84519,21 (ISO, International Organization for Standardization). Here, we report how to measure the density of samples in the form of a rectangular parallelepiped or a right circular cylinder. In the case of foamed samples, including closed and open cells, the precision of the method relies on the measurement of the dimensions of the sample. Figure 1 Caliper measurement of an XPET foam cut by dinking die cutter.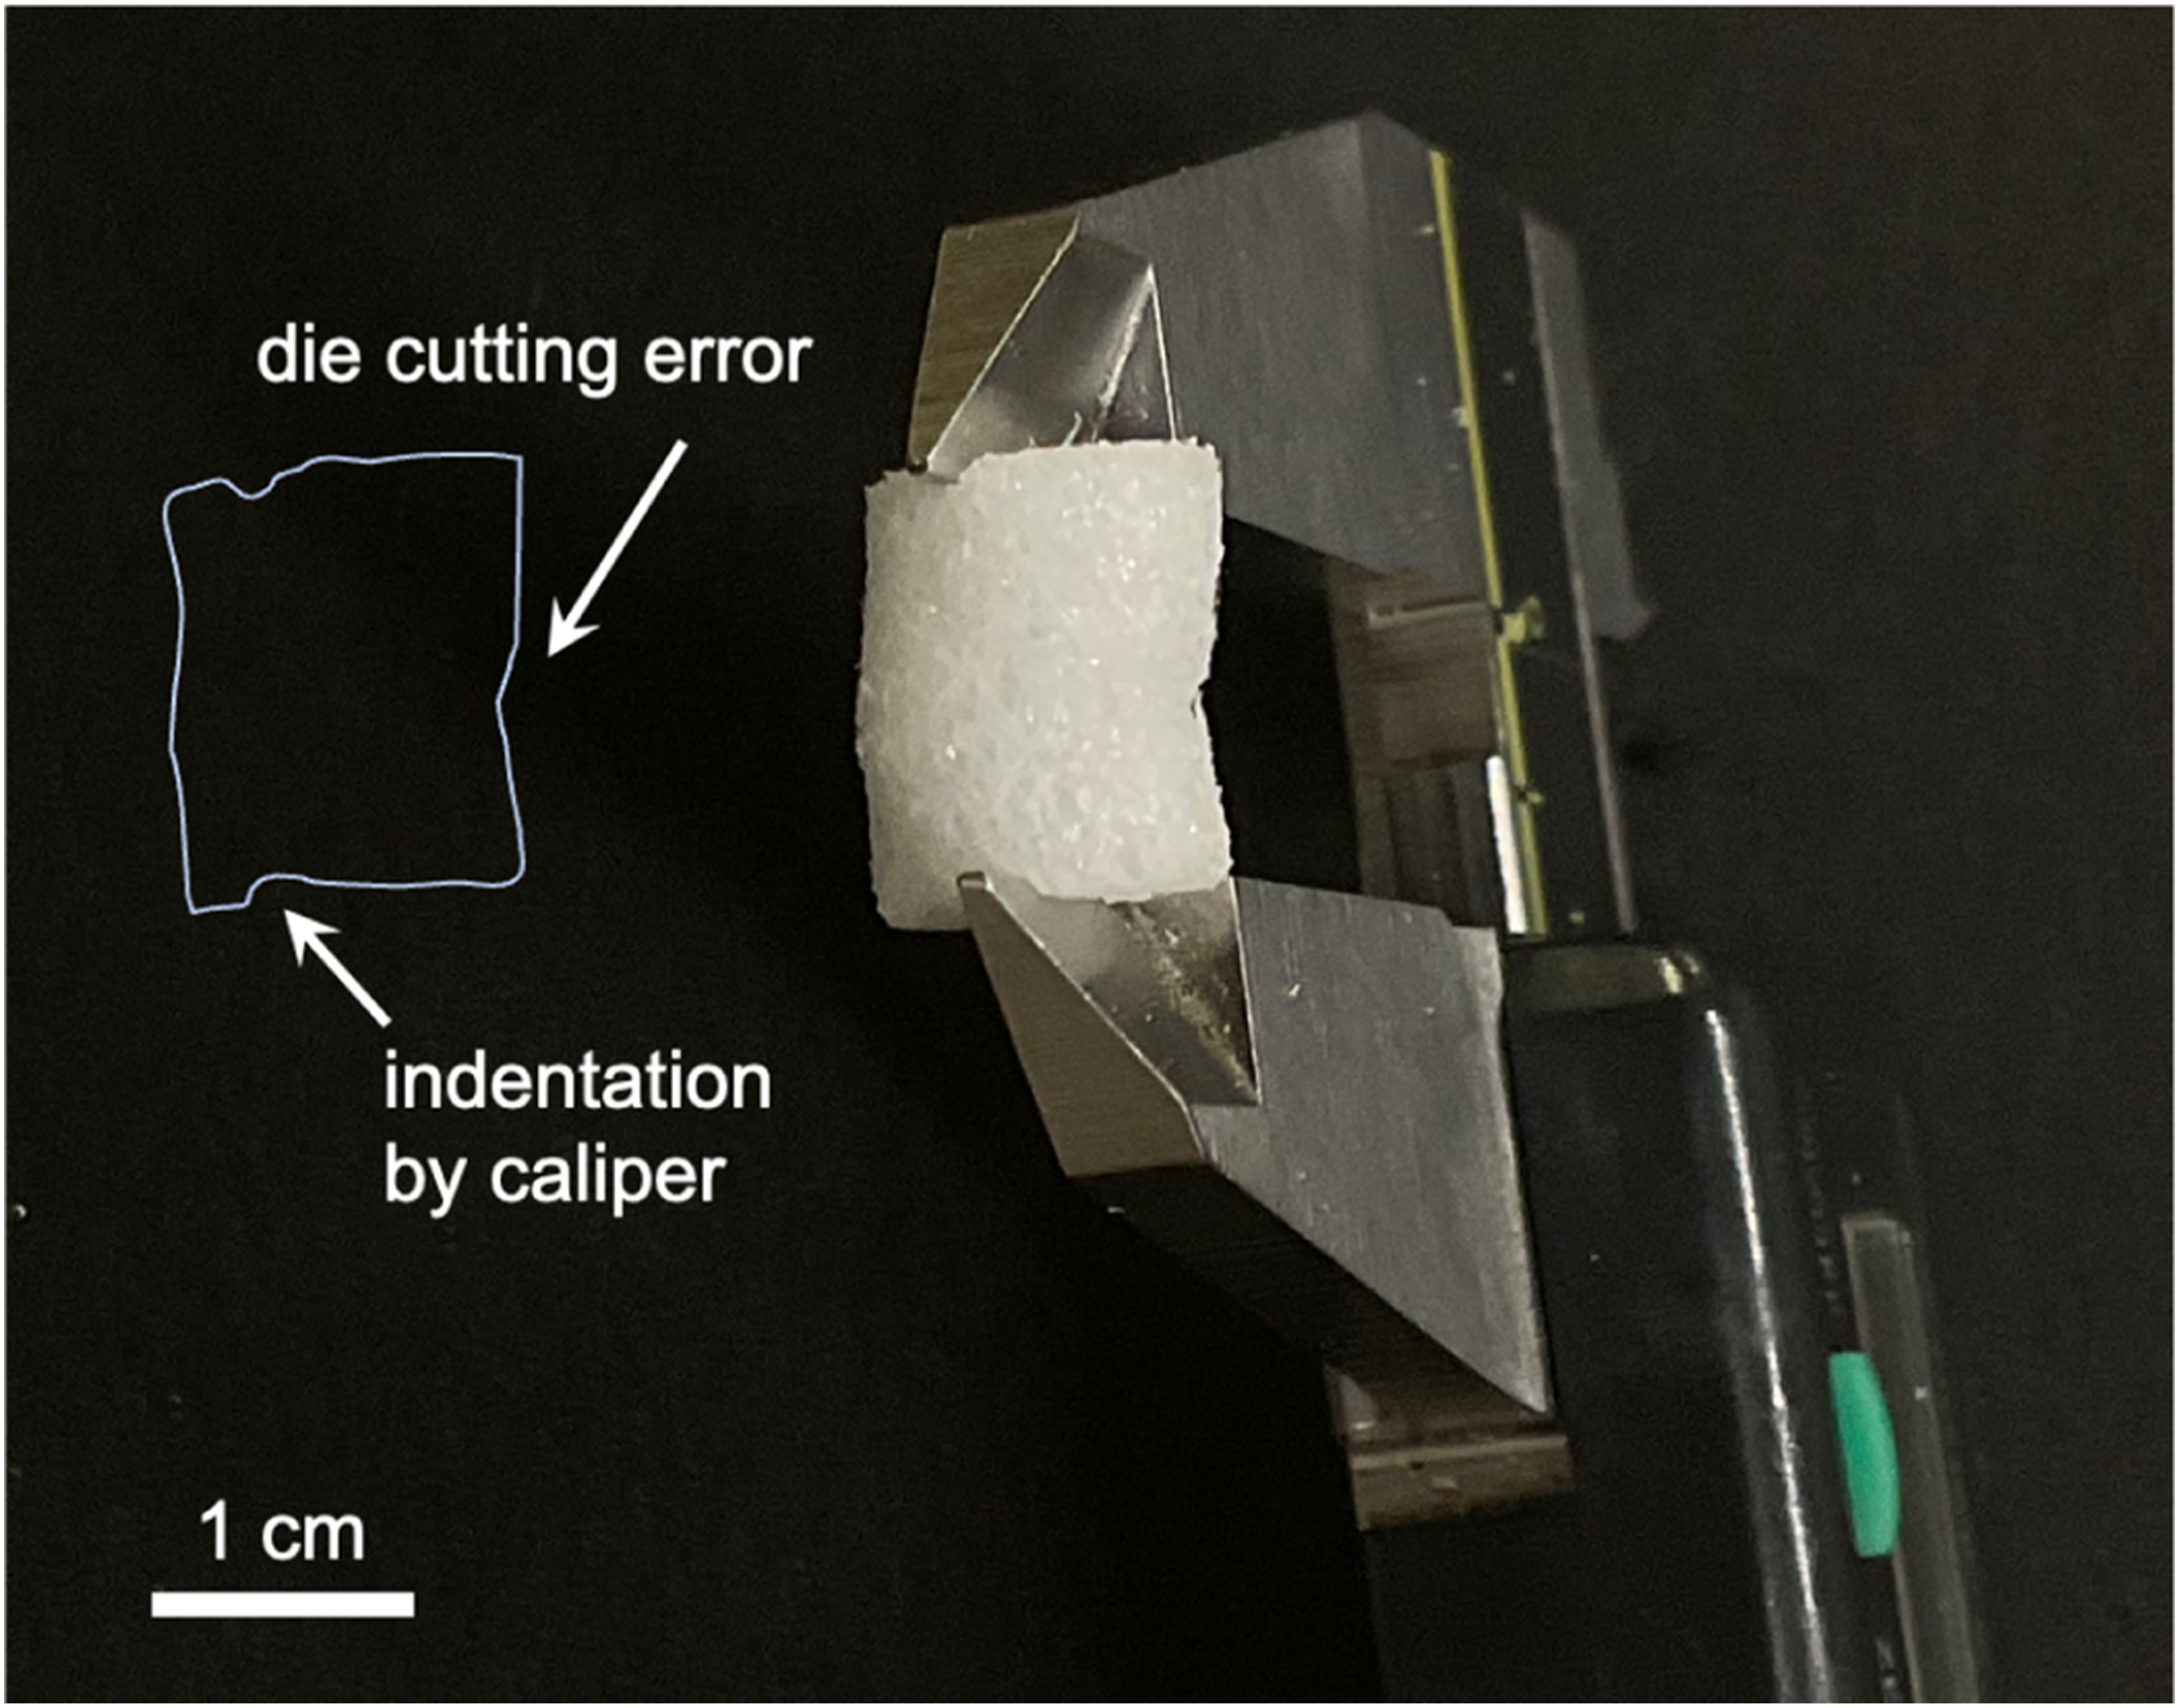
Buoyancy method
Density measurements according to the Archimedes principle are based on the assessment of buoyancy forces in a sample that is immersed in a liquid.
22
The method is illustrated in ASTM D792
23
and requires devices such as an analytical balance, a sample holder, a sinker, an immersion vessel, and a thermometer. The foam density is determined as:
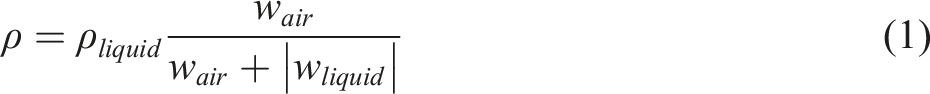
When the specimen is a polymeric foam, the method requires the use of a sinker to fully immerse the samples. The method has some drawbacks related to the assumptions and technical limits of the procedure. For example, errors related to the presence of air bubbles generated by the immersion of the sample in the liquid are common. If the bubbles are trapped below the sinker, their buoyancy force will add to the w
liquid
of the sample, erroneously decreasing the actual density of the sample (Figure 2). The error depends on the size of the sample, the chemical nature of the plastic (hydrophobicity) and the regularity (cavities that trap air bubbles). A crucial factor to consider is the existence of open cells that might be exposed to the liquid. In such instances, there is an unstable (decreasing) measurement of the liquid weight, influenced by factors such as the wettability of the polymer by the liquid, the size of the open cells, and their fraction.
24
For example, surface tension between the buoyancy liquid and the foamed sample may prevent wetting of the surfaces. This is more relevant in determining errors in measurement in the case of small samples having a high surface/volume ratio and small outer pores. Finally, the method cannot be used when the liquid exerts a solvent (in general, any physicochemical) effect on the polymer. In fact, some polymers may dissolve in the liquid used for volume measurement, potentially reducing or altering the volume of the sample and invalidating the measurement. Air bubbles trapped by an XPS sample during density measurement by buoyancy.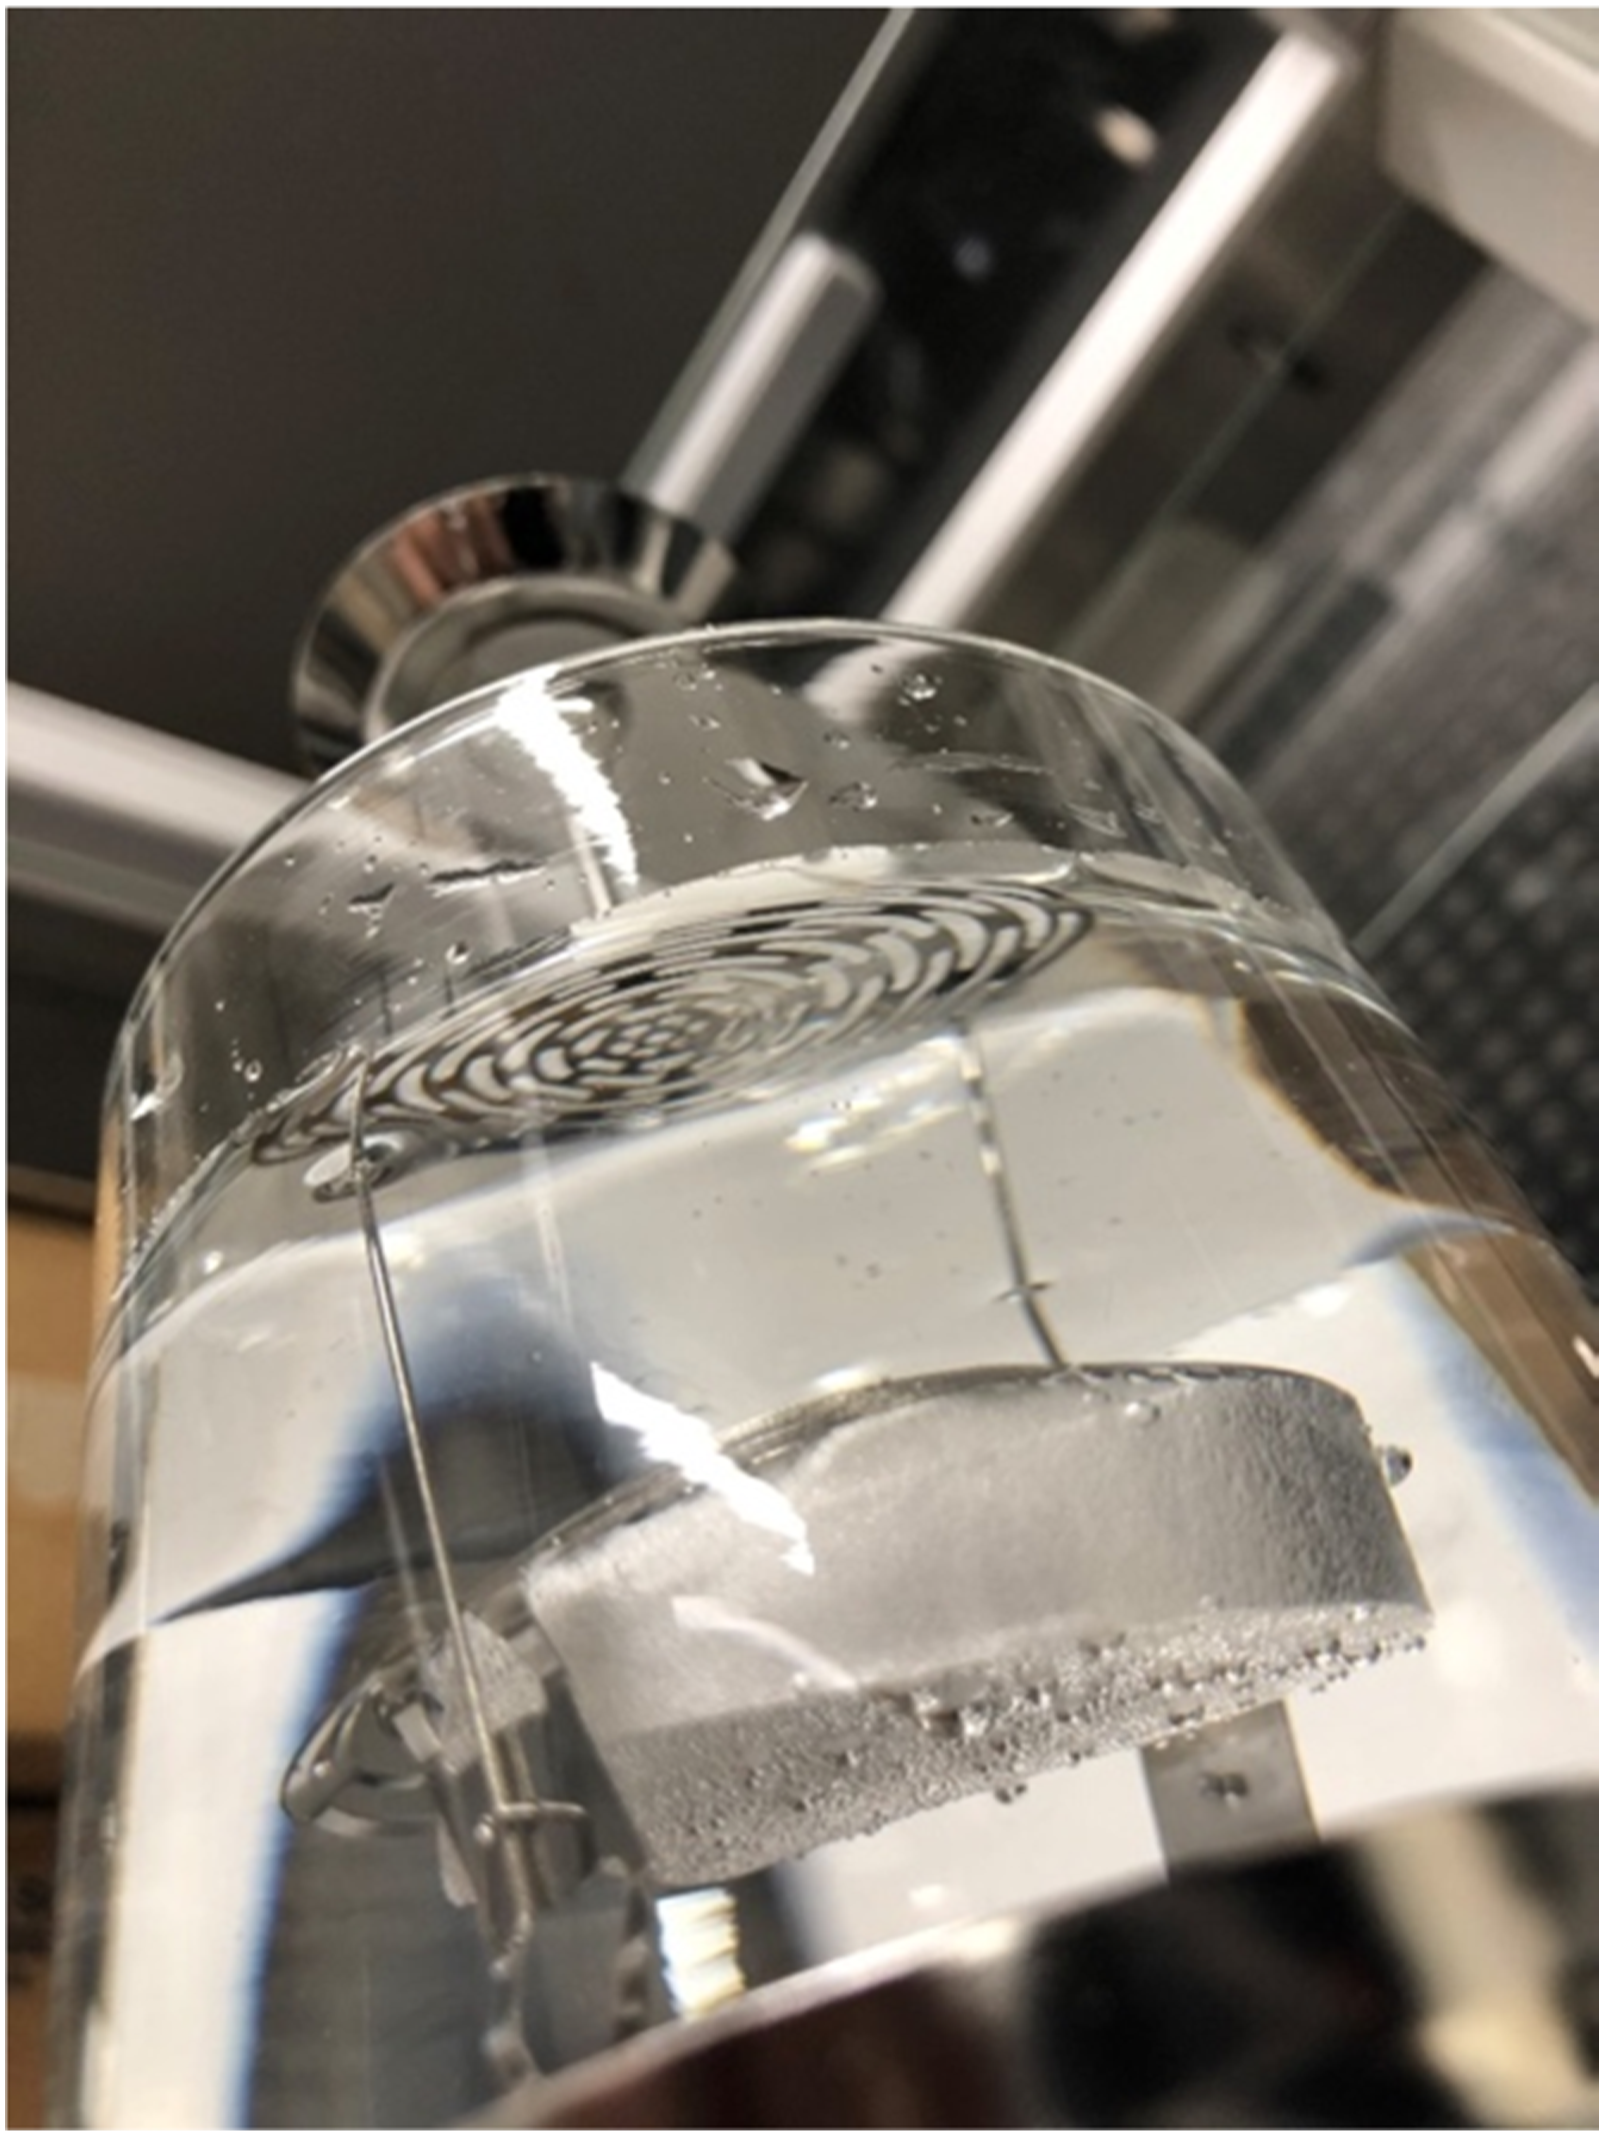
Density gradient columns method
It is a highly accurate technique for determining the density of solid samples. The measuring device consists of a one meter tall column in which a linear density gradient is obtained by mixing at least two liquid solutions. The technique is described in the ASTM D1505-18 standard method 25 or, equivalently, in the ISO 1183:1987 standard method. The density ranges from the maximum at the bottom of the column to the minimum at the top of the column. The density along the column is determined by sinking calibrated sinks, and the local value of the density is calculated by linear interpolation.
The measurement is based on observing the level to which a test specimen sinks in the column. However, the use of this method is limited to very high-density foams, due to the unavailability of liquids with a density below 0.8 g/cm3.
Pycnometry
Liquid picnometry is an effective analytical technique utilized to characterize plastic foams.26,27 The method, as described in ASTM D2320-98,
28
requires weighing (i) the sample in air, (ii) the pycnometer chamber filled with the liquid, and (iii) the sample in the pycnometer chamber while immersed in the liquid. In the case of plastic foams, mercury is the liquid that is the best suited because it has high capillarity and does not penetrate the porous structure.
16
The apparent density is determined as

Photogrammetry
Recently, another method is being used, based on photogrammetry theory, to acquire the shape and volume of an object.29–31 Through photogrammetry, a 3D modelling reconstruction of an object can be achieved by elaborating 2D photographs. The technique requires the acquisition of several images of the object from different angles and orientations. Then the software matches the data gathered from the images and generates a 3D point cloud of the object toghter with surface generation and texturing. The photo acquisition, usually manual, can be set to automatic procedures and produce dense point clouds. However, in this case, the 3D modelling software can produce errors in terms of mismatches, undesired points and lacking portions. This means the need for long term post processing checks and/or not being able to convert the cloud point into a geometrical body. This kind of volume (density) measurement is quite reliable but, before further improvements, is not easily repeatable. 32
X-ray microscopy
Soft X-ray microscopy (often called micro-CT) has been developed since the late 1970s primarily due to the potential to image biological samples. 33 It is a non-destructive imaging technique that provides maps of the internal structure of a sample from measurements of the attenuation of an X-ray beam passing through the sample at different angles of incidence.34,35 It is now a conventional technique to measure the microstructure of foamed samples, providing the details up to the micron scale of the porous structures. As a side result, the sample geometry can be retrieved from the data and, from that, the sample volume can be calculated. However, the time scale for the analysis (up to several hours, depending on the X-ray source and sample size) and the equipment cost, despite the recent availability of benchtop solutions, rule out X-ray microscopy as an effective to foam density measurement.
In the present work, an alternative volume measurement method based on the use of a 3D scanner is introduced. Nowadays popular among additive manufacturing enthusiasts, the first use of a 3D scanner dates back to 2003, 36 while in 2005 it was first used to determine the density of meteorites. 37 The 3D scanning method relies on the use of lasers, cameras, motorized sample-holding tools, and software for the 3D reconstruction of the sample geometry and, as a side result, provides the sample volume. 38
In the following sections, we describe in detail the method for measuring the density of foamed samples by 3D scanning, the hardware and software options used.
Materials and methods
The method to measure the density of foamed samples by 3D scanning (and an analytical balance) is named DensScan. Hereinafter, some details of the techniques used as a benchmark and comparison, namely the geometrical method, by caliper, and the buoyancy method (ASTM D792). The experimental details of the scanning devices and the procedures adopted are also described.
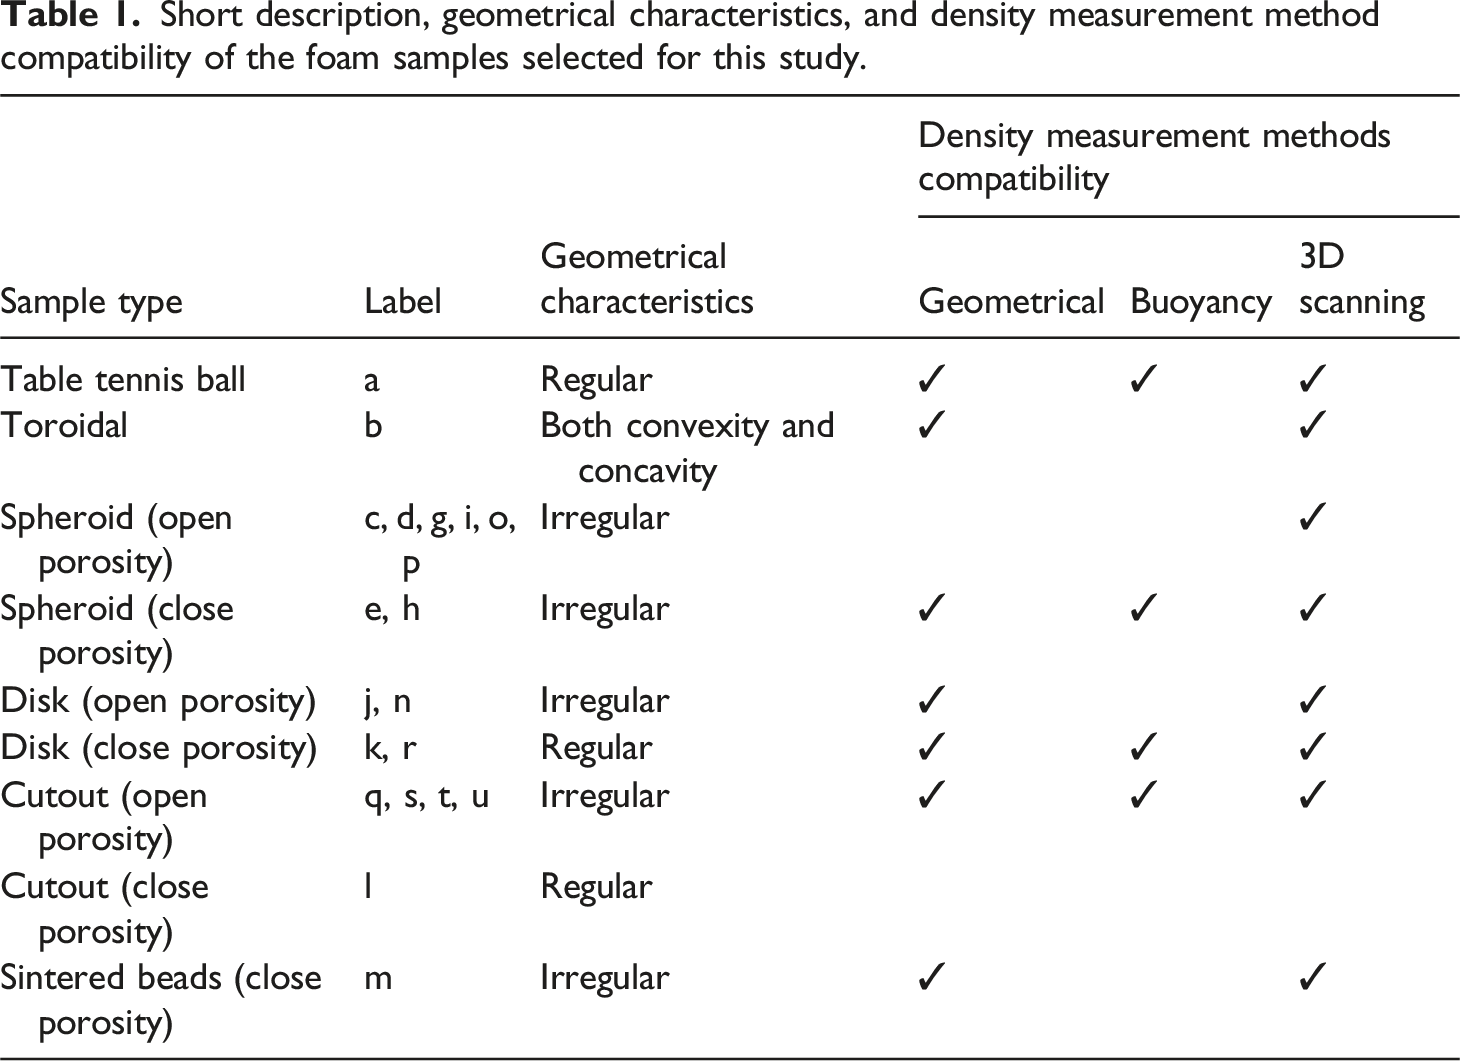
The samples examined in this study, as depicted in Figure 3, were chosen from a collection of foams produced in the laboratory or obtained from commercial packaging. Table 1 reports, for each sample, a short description, the geometrical characteristics, and the compatibility with the three density measurement methods considered in this investigation. The geometrical method was used only for the foam samples having a regular geometry (box, disk, sphere, etc.) which allowed to calculate their volume by the simple measurement of one or more dimensions. Dimensional measurement was performed using a standard digital caliper by Mitutoyo (Kawasaki, Japan). For comparison, the density of a selection of foams was measured according to ASTM D-792, using an analytical balance equipped with a standard density kit by Mettler-Toledo (Columbus, United States). The density kit consists of a glass beaker and a sinker. The first sits on a frame detached from the weighing plate, whereas the sinker is connected to the weighing plate so that the upward (in the case of foams, usually less dense than water) force is measured by the weighing system. The standard provides using a technical or analytical balance (accuracy of 0.1 mg) to perform a weighing of the dry sample (in air), Overview of the samples analyzed in the present work. Short description, geometrical characteristics, and density measurement method compatibility of the foam samples selected for this study.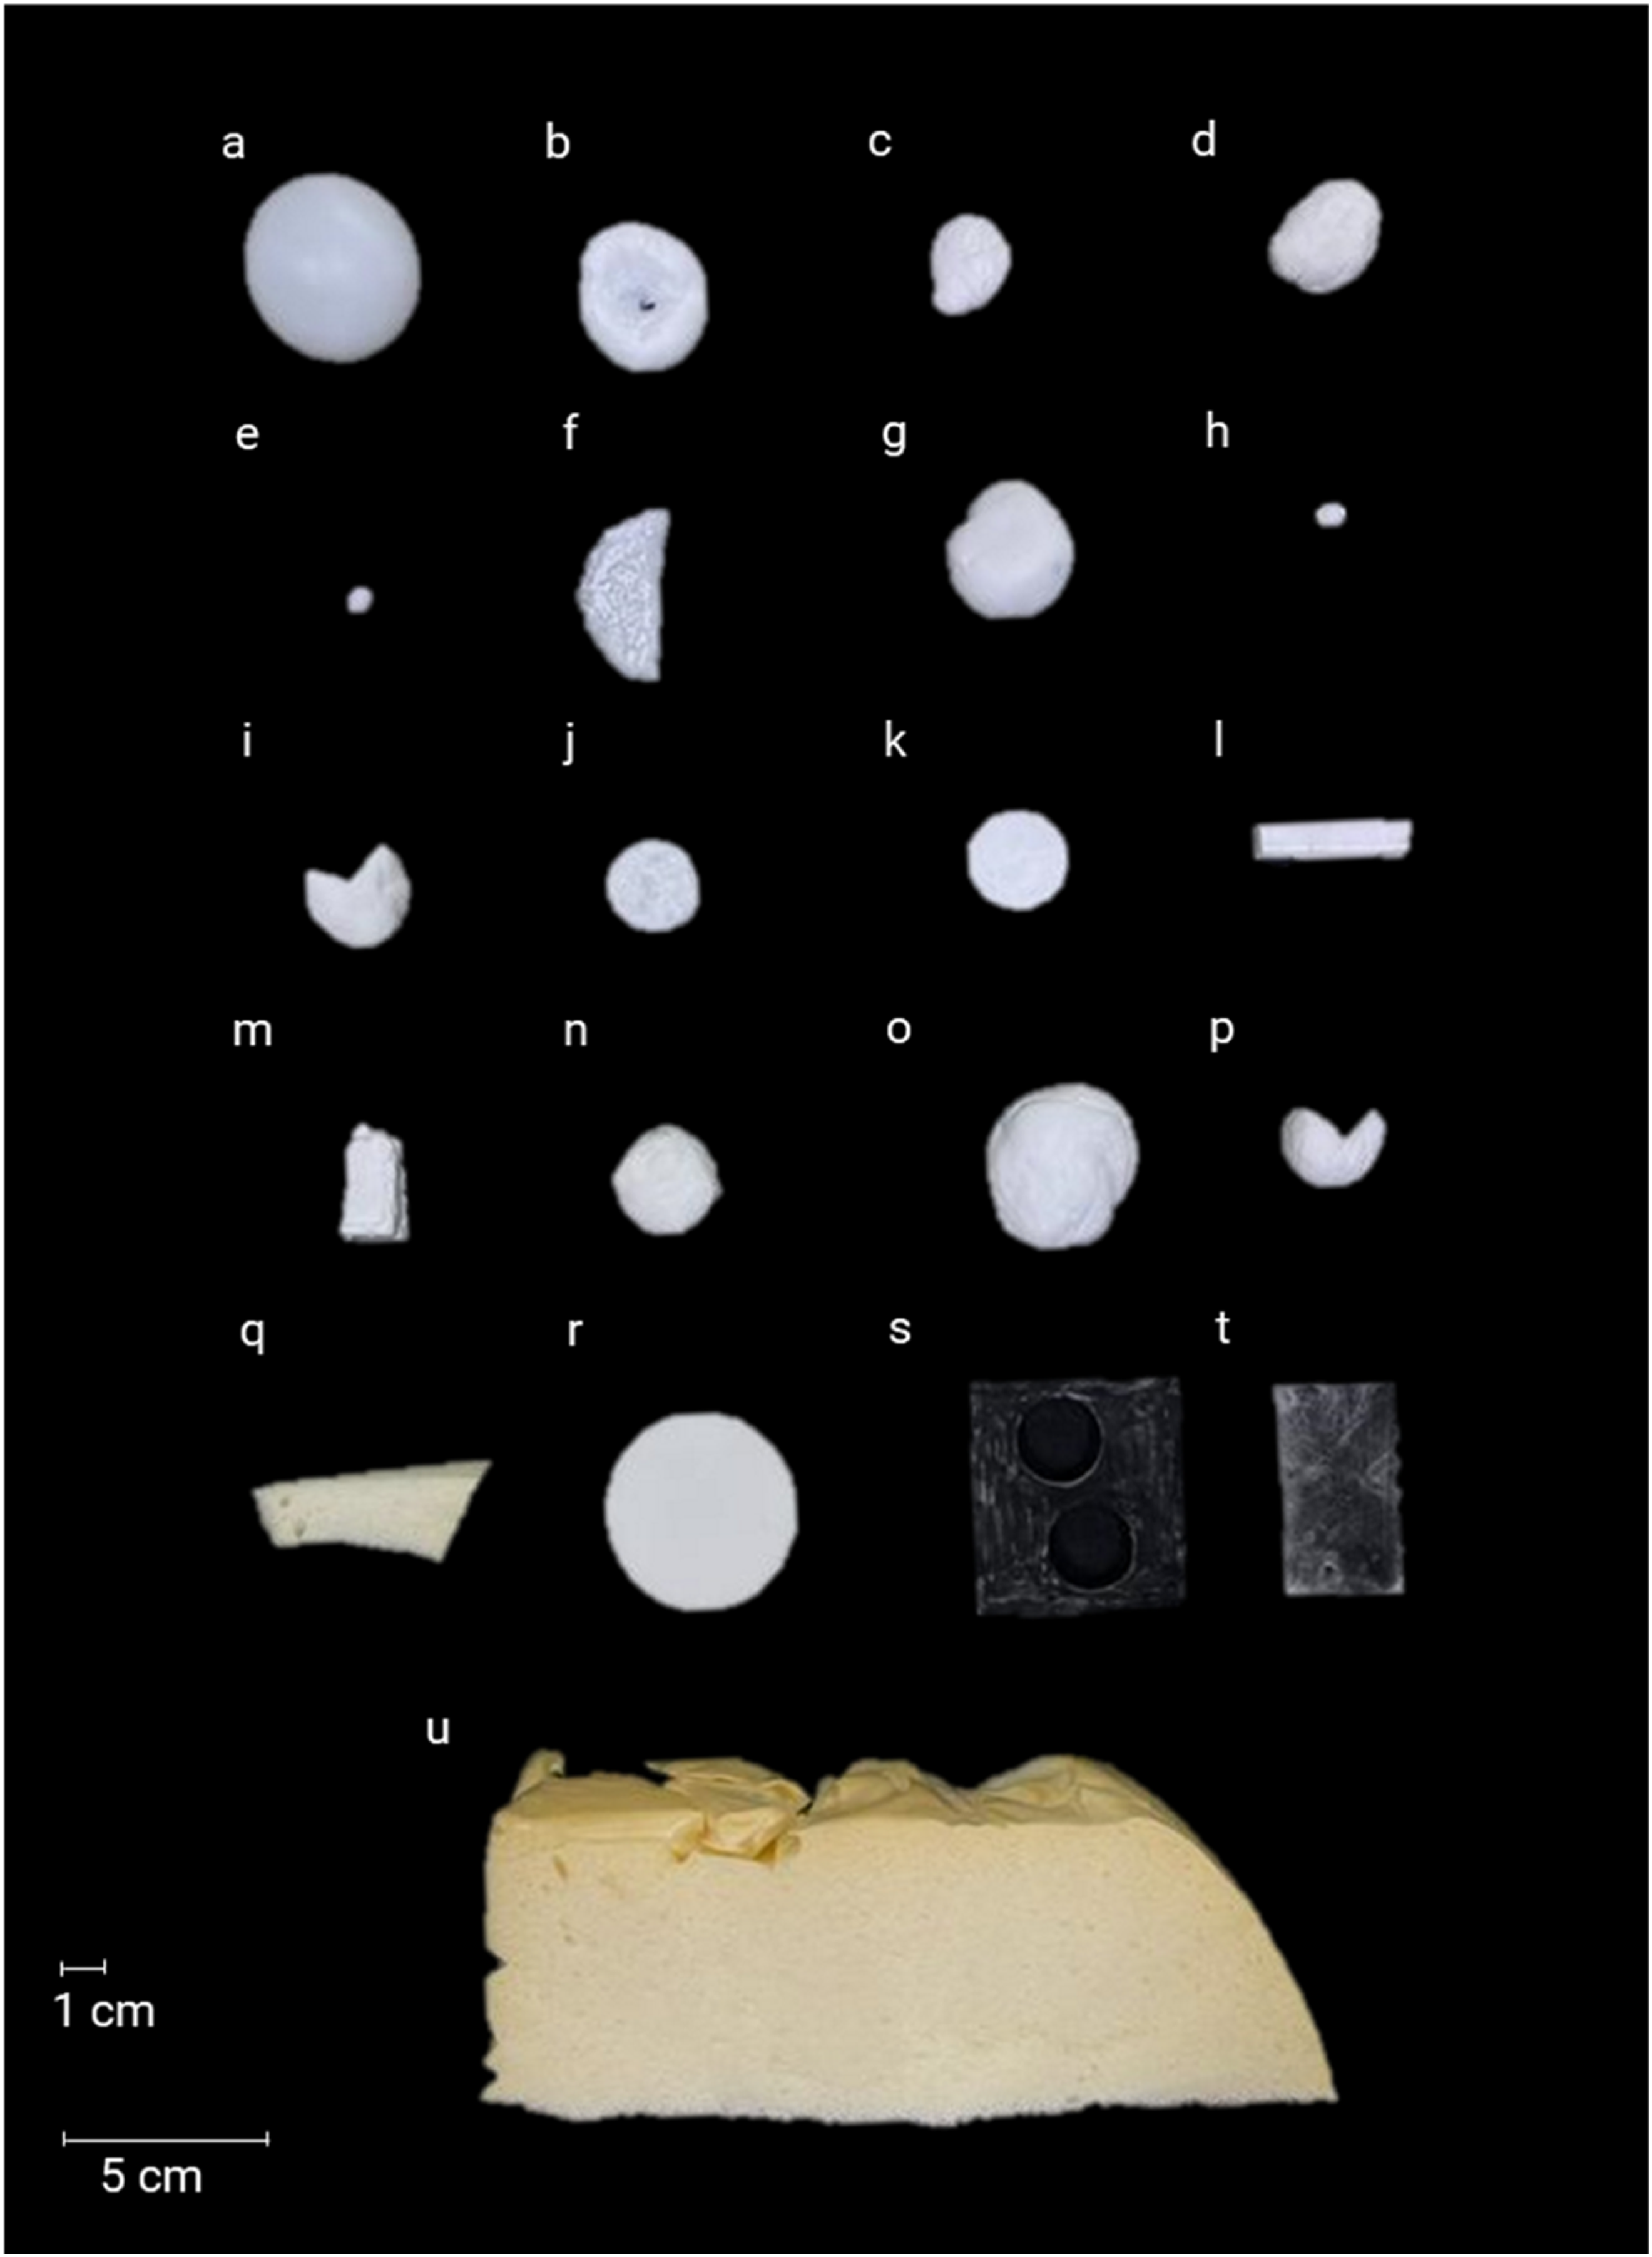
A conical holder for the foams was 3D printed with a standard fused deposition method and with a black PLA filament. The holder terminates with a steel needle that is used to keep it in place the foam sample during scanning. The whole scanner was covered with opaque black paper to avoid light reflections and to improve the color contrast with typically white foam samples. In some cases, green LED light sources were also optionally utilized to set the light conditions during data acquisition.
The scans were repeated several times by varying the position and orientation of the foam and changing the lighting conditions. In the case of not symmetrical foam samples having an irregular shape (complex, characterized by concavity and convexity), the best 3D scanning acquisition is obtained when the sample is placed in the most favorable orientation for the camera, that is, an orientation allowing one to get most of the surface of the object. The software also allows the joining of two or more scans of the same object acquired in different orientations. To improve the camera scans, the exposure can be adjusted, considering that low exposure is better for a white or a light-colored object. Many of the analyzed foams were white and opaque, whereas the support was black: the dichotomy of colors facilitated the cleaning of the point cloud.
Comparison of volume measurements of a table tennis ball performed by geometrical and DensScan.
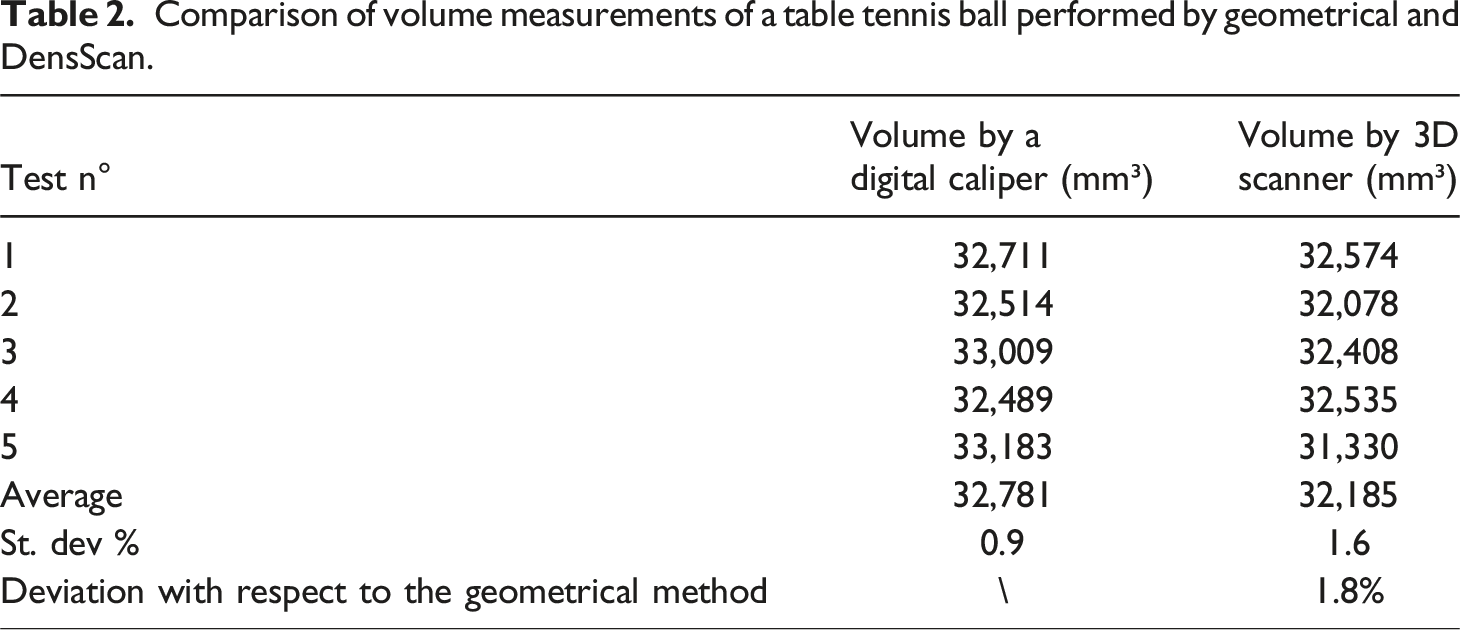
The measurements show good reproducibility of the 3D scanning method and consistency with respect to the digital caliper, with a difference comparable to the standard deviation of the latter. As said, volume measurement by a digital caliper is possible only if the sample has a regular shape, quite difficult in laboratory practice.
In particular, the difference between the two measures is less than 2%, in fact, the standard deviation of the measurements with the scanner is 1.6%, while it is 0.9% for the measurement with the caliper.
The volume measurement of the table tennis ball with a 3D scanner was used during the test campaign to verify, at each bootstrap, the correct functioning of the instrument. In addition, the volume measured through the 3D scanner of the table tennis ball,
The calibration ratio, calculated according to equation (3), is equal to 1.018.where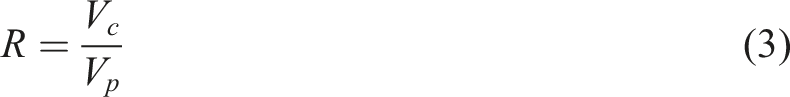
R = calibration ratio
Once R was known, the measurements of the volume of the foam samples were carried out. The volume measured by the scanner, Vs0, was correct applying the calibration ratio R according to eq. 4.
To compare the measurements by the 3D scanner with the buoyancy method, a percentage normalized difference was calculated as equation (5).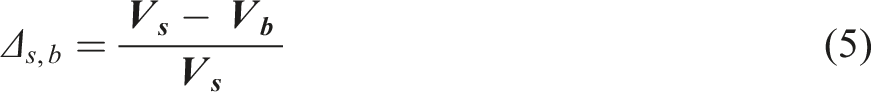
Results
Comparison of the methods investigated to measure the average volumes of the selected foamed samples: (a) geometrical (ASTM D1622), (b) buoyancy (ASTM D792) and (c) 3D scanner (DensScan). The standard deviations are reported for the geometrical and buoyancy method, the normalized difference between the buoyancy and 3D scanner methods
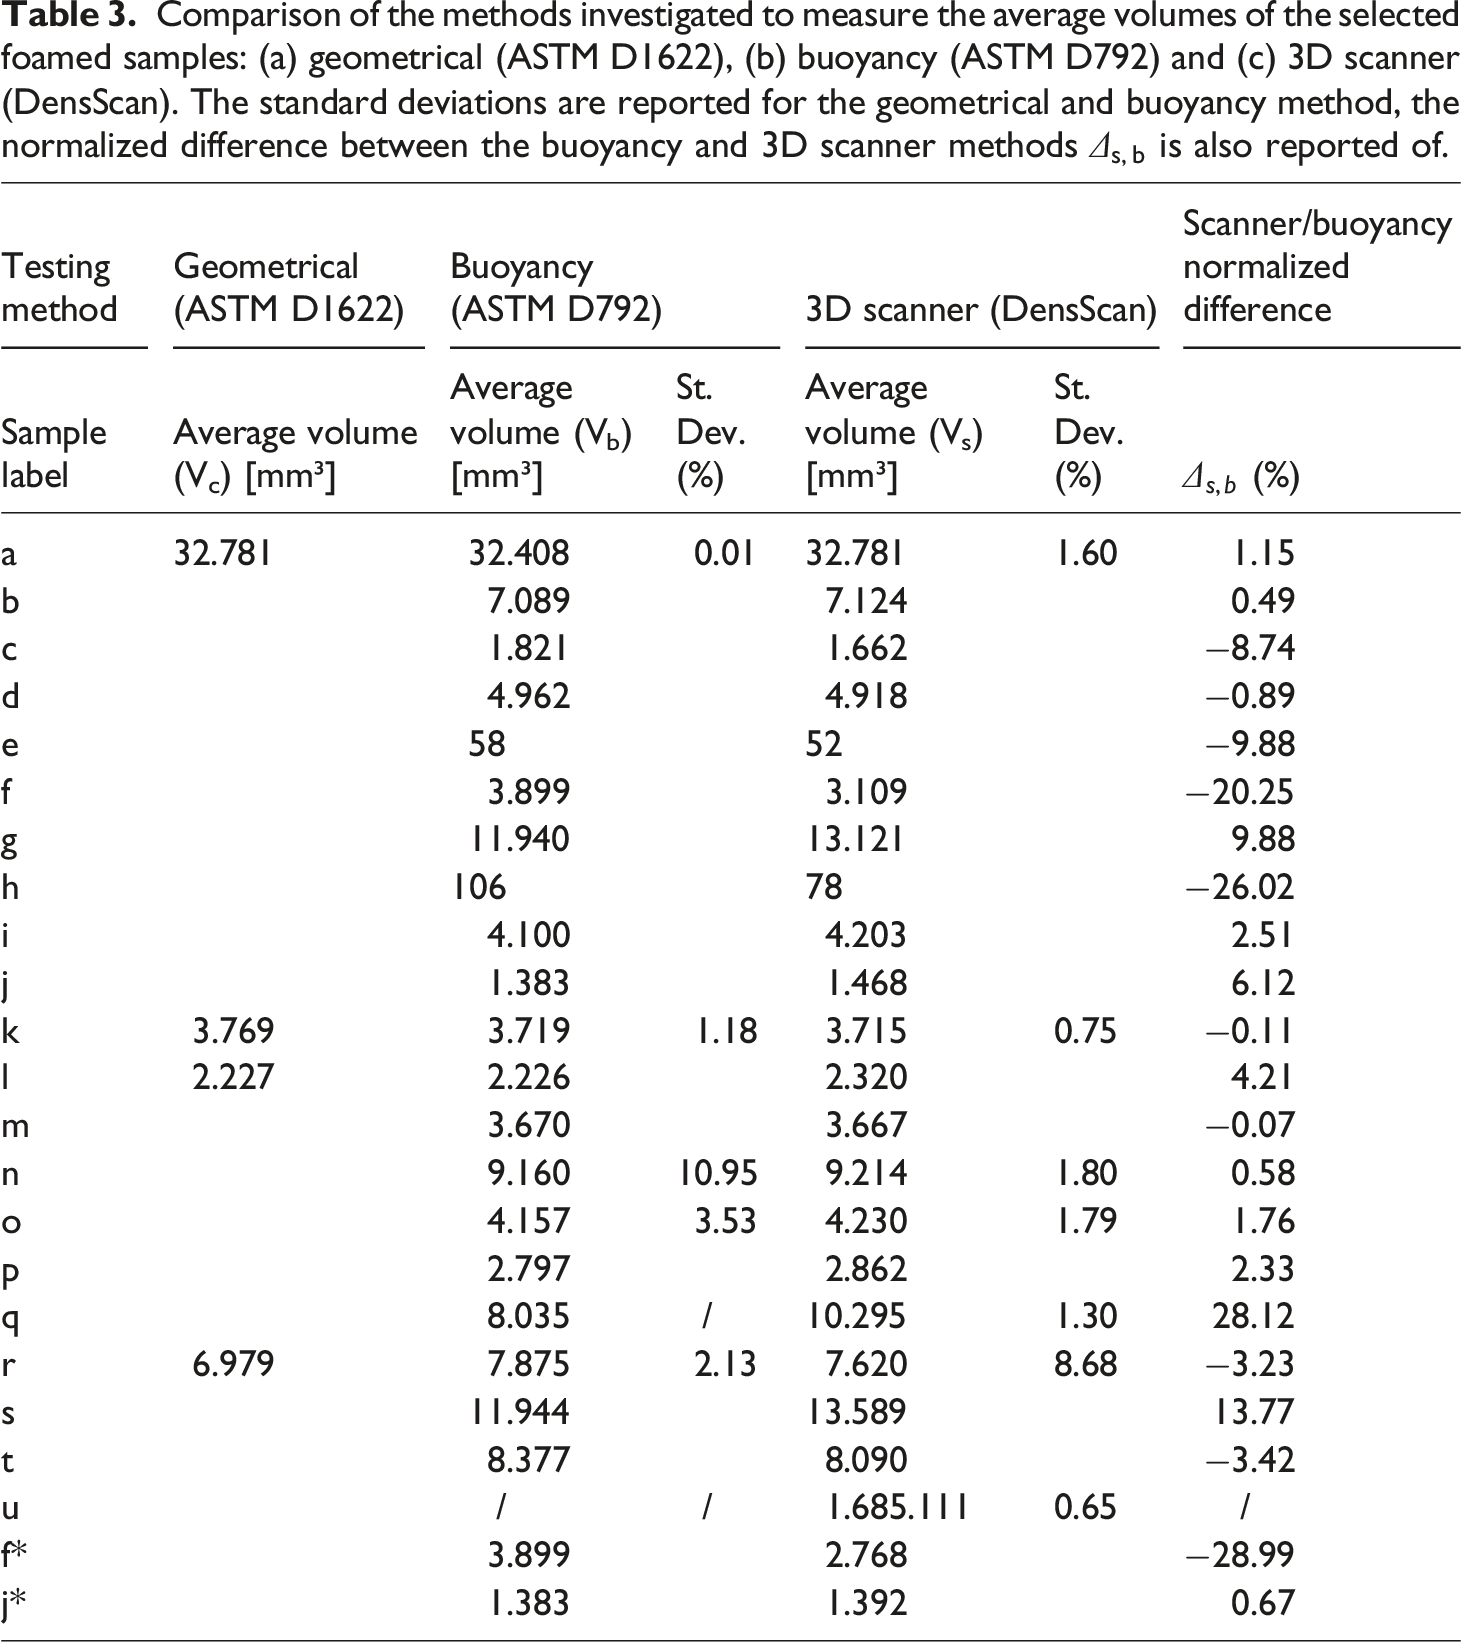
Among all, sample ‘f' was the most difficult to analyze, the rough surface affected the scanning and the volume obtained was underestimated compared to the standard measure, the same occurred for sample ‘j'. To improve the measurement, the surfaces of sample ‘f' and ‘j' were highlighted by coloring them with a white marker. Applying a solid color resulted in a more reflective surface, thus promoting the laser scanning and cloud point population.
In this way, the volume measurement by the scanner of the sample ‘j' was aligned to the one measured by the buoyancy method and the variation decreased from 6.12% to 0.67%. Meanwhile, the accuracy of the sample ‘f' volume measurement improved by 43%.
Therefore, the use of the marker has produced a more precise measurement. On the other hand, the analysis of samples ‘s' and ‘t' also required the use of a marker since, initially, the scanner did not detect some areas on the front surface and the volume obtained was overestimated.
In this case, to improve the measurement, a black marker was used to color the surface of the two foams. The following scans proved that the cloud of points generated after scanning was more populated and the mesh was more accurate.
It is interesting to note that some foams, particularly open cell foams, are not suited to measurements by the buoyancy method. The reason for the unenforceability of the ASTM D-792 standard has to be ascribed to the absorption of water during immersion of the sample. Samples ‘q' and ‘s', for example, showed this kind of problem.
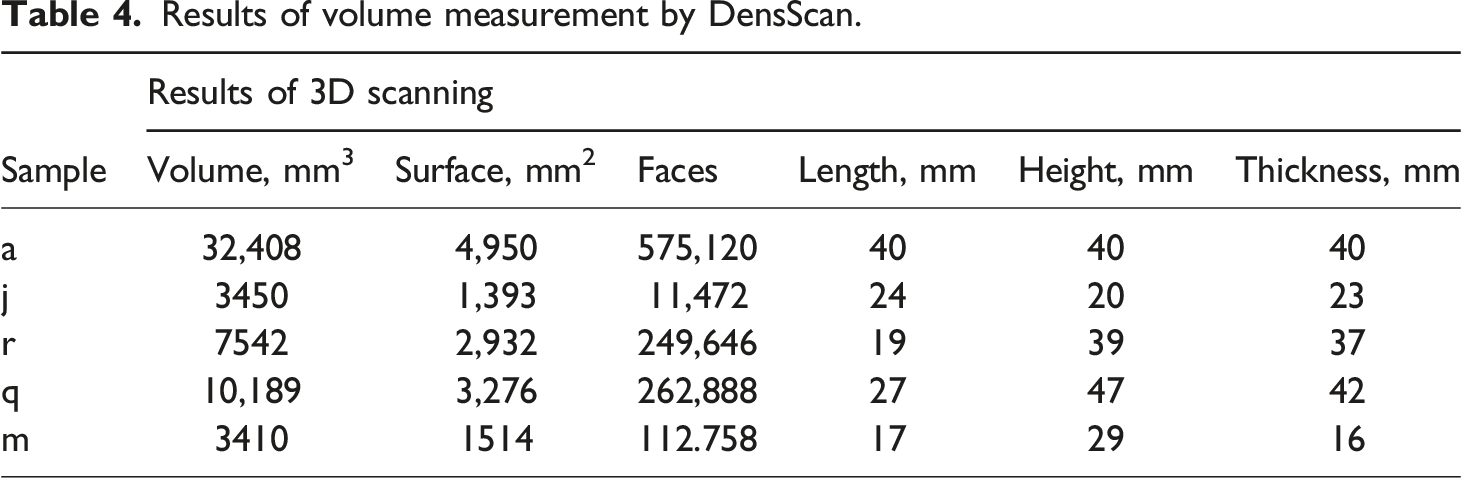
In Figure 4 the result of the 3D scanning software is reported for some of the foamed samples analyzed, namely ‘a', ‘j', ‘r', ‘q' and ‘m'. Table 4 reports, for each sample, the volume and surface calculated by the software, the parameter of the mesh computed from the acquired point cloud, that is, the number of faces of the mesh and the macroscopic dimensions of the sample. The 3D models obtained by 3D scanning (below) are compared with the pictures of the actual foamed samples. Results of volume measurement by DensScan.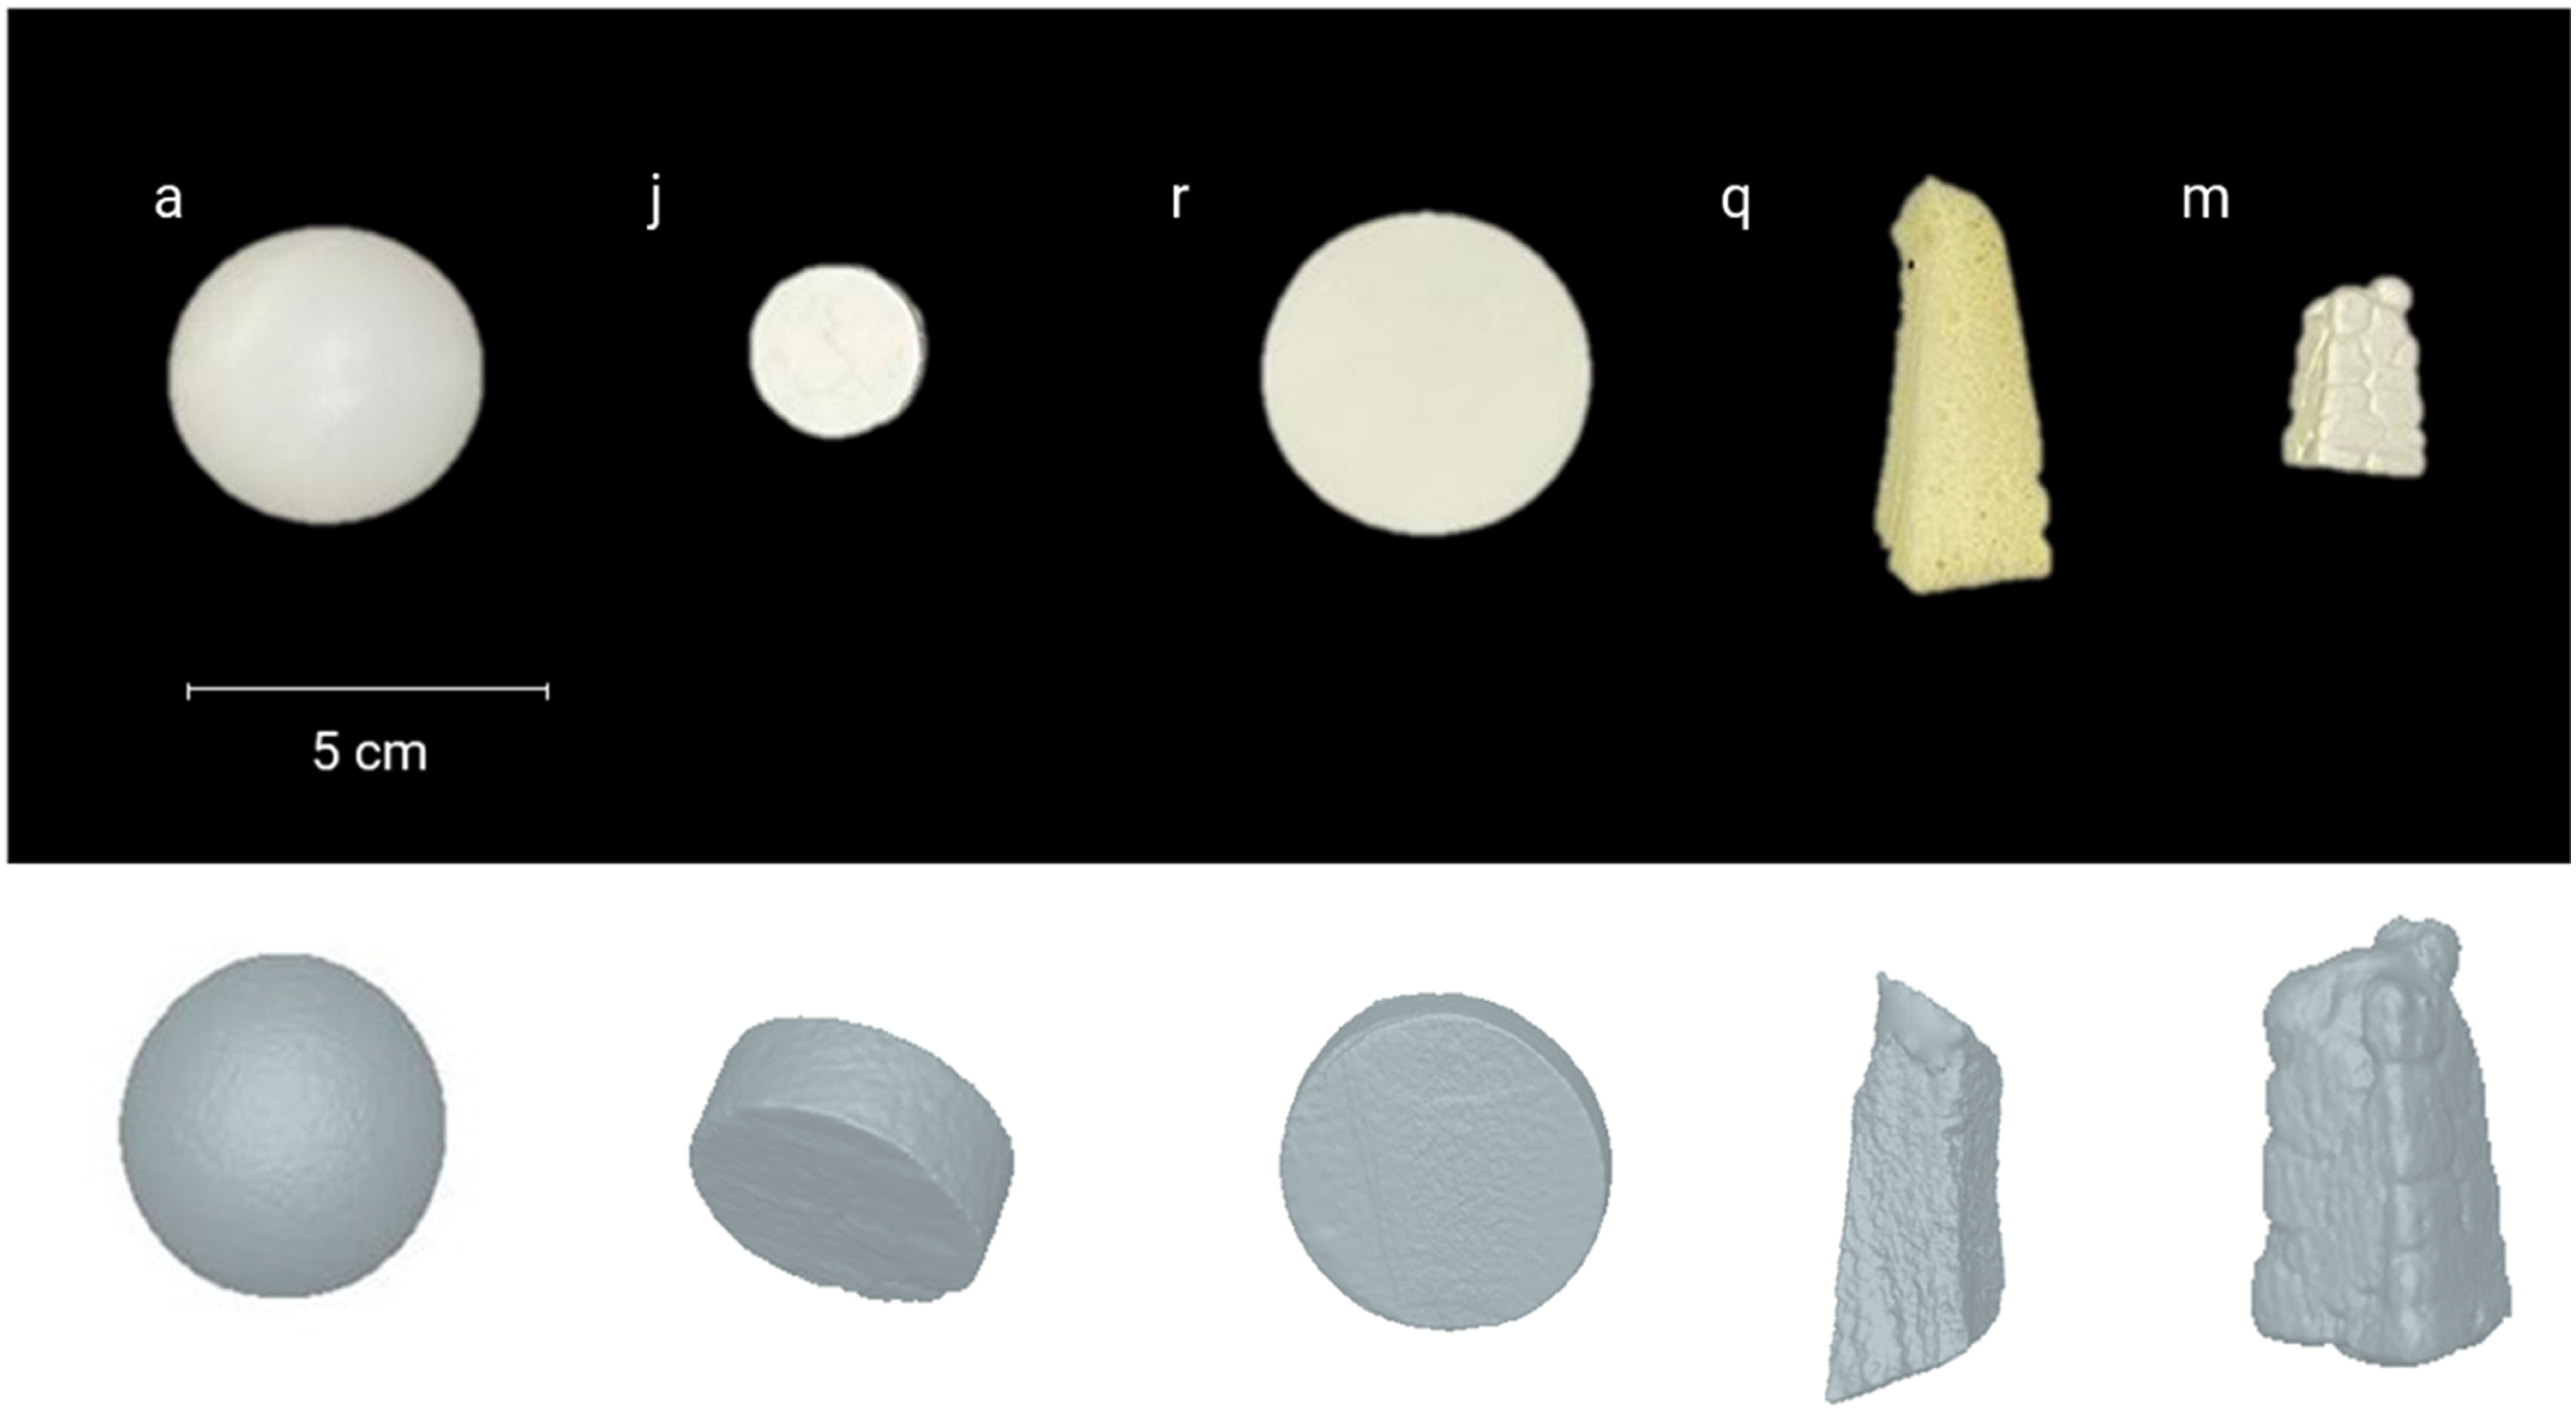
Conclusions
The DensScan technique is innovative and shows excellent results in accordance with the technique prescribed by ASTM D-792. The percentage difference between the values determined with the scanner and the buoyancy method is negligible as, in most cases, it stays less than 5%. It is worth underlying that the DensScan technique is largely automated, and the possible errors that an operator can make are reduced to a minimum. The measurements are repeatable (provided the same lighting conditions are kept) and there is no risk that the previous measure will affect the next one. On the contrary, the ASTM D-792 standard relies on the use of an analytical balance, which implies the occurrence of different errors when measuring the density of a foamed object. The repeatability of the measurement is affected, as discussed above, by several aspects associated with the use of a liquid. The 3D scanner does not require the use of liquids, therefore, foamed objects can be measured regardless of their shape and features.
Future developments of the DensScan technique include: (i) Complete automation of the procedure, so as to minimize the need for an operator; (ii) Improve accuracy to enrich the points cloud and derive neater meshes; (iii) To add an embedded analytical balance to directly determine the density of the object.
Footnotes
Declaration of conflicting interests
The author(s) declared no potential conflicts of interest with respect to the research, authorship, and/or publication of this article.
Funding
The author(s) received no financial support for the research, authorship, and/or publication of this article.