
Abstract
Expanded Polypropylene foams are used in energy-absorbing applications, yet their mechanical response exhibits complex rate-dependency, damage, and permanent set, making accurate constitutive modeling challenging. This work proposes and validates a two-network viscoplastic model to describe the large-deformation compressive behavior of Expanded Polypropylene foams. The framework combines a hyperelastic network to capture the instantaneous nonlinear elastic response with a parallel viscoplastic network governed by an overstress flow rule to account for rate-sensitive effects. Model parameters were calibrated using experimental data from uniaxial compression tests at low (4.5 mm/min) and high (450 mm/min) rates. The model’s predictive capability was then assessed against an independent dataset at an intermediate rate (45 mm/min), achieving a coefficient of determination exceeding 0.98. Furthermore, an analysis was performed to quantify uncertainty, showing that the 95% confidence intervals and 95% prediction intervals for the stress response successfully encompassed the experimental validation data. The framework also provided an accurate approximation of key energy absorption parameters, confirming its empirical adequacy.
Keywords
Introduction
Polypropylene is a widely used thermoplastic polymer due to its low cost, favorable physical-mechanical properties, and fast manufacturing process. 1
In its foam form, it is known as Expanded Polypropylene (EPP), and it is produced through two main methods 2 : (i) physical foaming, where inert agents such as CO2, butane, or N2 serve as blowing agents mixed with the molten polymer, with expansion driven by changes in pressure or temperature; and (ii) chemical foaming, 3 which involves the use of chemical blowing agents that decompose upon heating, releasing gases (such as CO2 or N2) into the polymer matrix to create the foam’s cellular structure.
EPP is a relevant material in industrial and consumer sectors, especially in the fields of sports and safety. Unlike other foams, EPP can repeatedly absorb energy with less damage than other polymeric foams4,5; it also offers higher strength compared to EPS, and greater shape-memory capacity than other foams such as expanded polyurethane or polyethylene. 6 This makes it particularly important for protective components in the automotive sector, 7 sports gear and equipment, 8 and packaging for high-value devices. 9 In summary, EPP exhibits clear advantages over other foams, making its characterization and constitutive modeling essential for the design of advanced products.
In general, the most used models to explain, describe, and simulate polymeric foams have their foundation in continuum mechanics. Constitutive models based on strain energy formulations have dominated for much of the last century and have been combined with powerful numerical methods, such as Finite Element Modeling. 10 Examples of continuum constitutive models applied to polymeric foams include: (i) Blatz-Ko and Ogden Foam, 11 (ii) pseudoelastic models based on Mullins and Storakers formulations12,13 (iii) viscoelastic models, 14 and, more recently, (iv) viscoplastic models.
A wide range of hyperelastic formulations to model polymer foams can be found in the literature, 11 and they have proven practical and useful over the last decades. However, since most polymer foam applications involve finite deformation under compressive loads, hyperelastic descriptions can typically model the loading curve but fail to capture the material’s unloading behavior. To address this limitation, pseudoelastic formulations have been developed. For instance, Zhang et al. 15 proposed a pseudoelastic model based on the Ogden foam framework combined with Dorfmann-type approximations to accurately reproduce both loading and unloading curves in EPP materials.
On the other hand, viscoelastic models have successfully accounted for time-dependent responses under varying strain rates, enabling the simulation of rate-sensitive behavior observed in polymer foams during both loading and relaxation stages. These formulations often combine hyperelastic energy potentials with internal dissipation mechanisms, allowing for a more realistic description of polymer foam mechanics under dynamic conditions. 14
Along this line, viscoplastic models—such as Bergstrom–Boyce model 16 and the Three-Network Model 17 —have been proposed to capture the permanent deformation and rate-dependent hysteresis that hyperelastic and viscoelastic models alone cannot reproduce in polymers. These approaches typically incorporate an elastic equilibrium network alongside one or more viscoplastic networks governed by flow rules or overstress functions, enabling the accurate modeling of irreversible strains, stress softening, and loading–unloading asymmetry in foams subjected to large deformations. However, while related viscoplastic models have been applied to describe the response of polymer foams at various temperatures, 18 no work has specifically reported a viscoplastic framework for EPP that is both calibrated using multi-rate loading data and validated with an uncertainty quantification based on traditional statistics.
In this work, a constitutive modeling strategy was developed to describe the time-dependent mechanical response of EPP foams under compressive loading. The approach combines a dual-network viscoplastic formulation with a compressible hyperfoam-based strain energy function. Experimental data at low and high strain rates were used to calibrate the model parameters through optimization routines applied to multiple pairs of independent replicates. To assess uncertainty and predictive robustness, a statistical framework based on classical inference was employed. This combination of experimental calibration and statistical quantification offers a robust predictive tool for modeling the viscoplastic behavior of compressible polymeric foams under large deformations.
Materials and methods
Experimental methodology
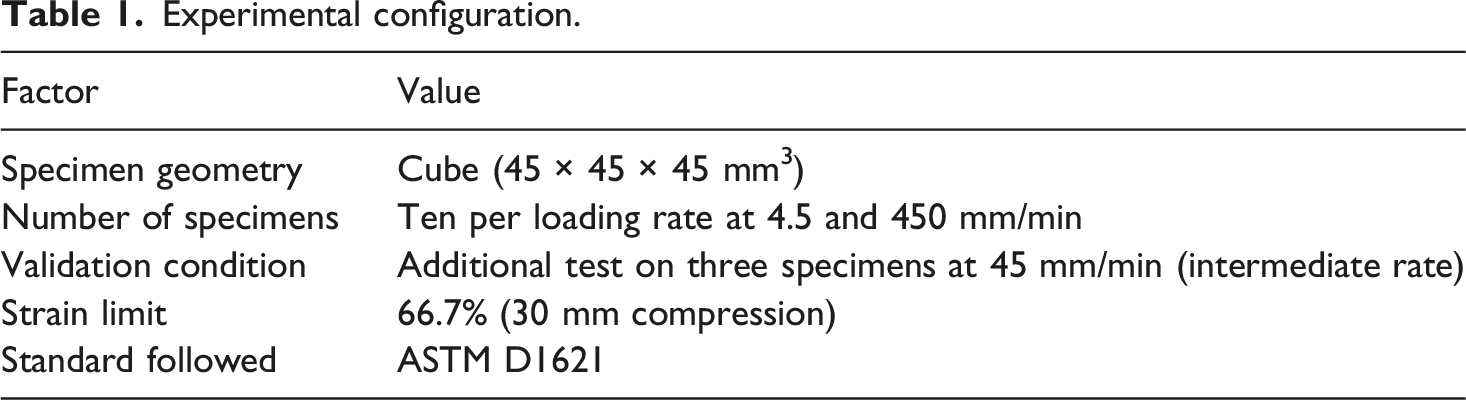
Uniaxial compression tests were conducted on EPP foam specimens in accordance with the ASTM D1621 standard. The material used in this study was commercial-grade Expanded Polypropylene (ARPRO®). The specimens were extracted from pre-molded boards manufactured via standard steam-chest molding. A total of 23 cubic samples of 29 kg/m3 with nominal side length L0 = 45 mm were tested. Two groups of ten specimens each, corresponding to loading rates of 4.5 mm/min and 450 mm/min, were used for model calibration and parameter identification. Additionally, a third group of three specimens was tested at an intermediate rate of 45 mm/min to independently assess the predictive capability of the constitutive formulation.
The tests were performed using a Mark-10 universal testing machine shown in Figure 1, and equipped with an FS05-300 load cell (1.5 kN capacity). Specimens were compressed up to a maximum displacement of 30 mm, equivalent to 66.7% nominal strain. All tests were carried out under ambient laboratory conditions as per ASTM D1621. Experimental setup. (a) Testing apparatus, and (b) representative EPP specimen.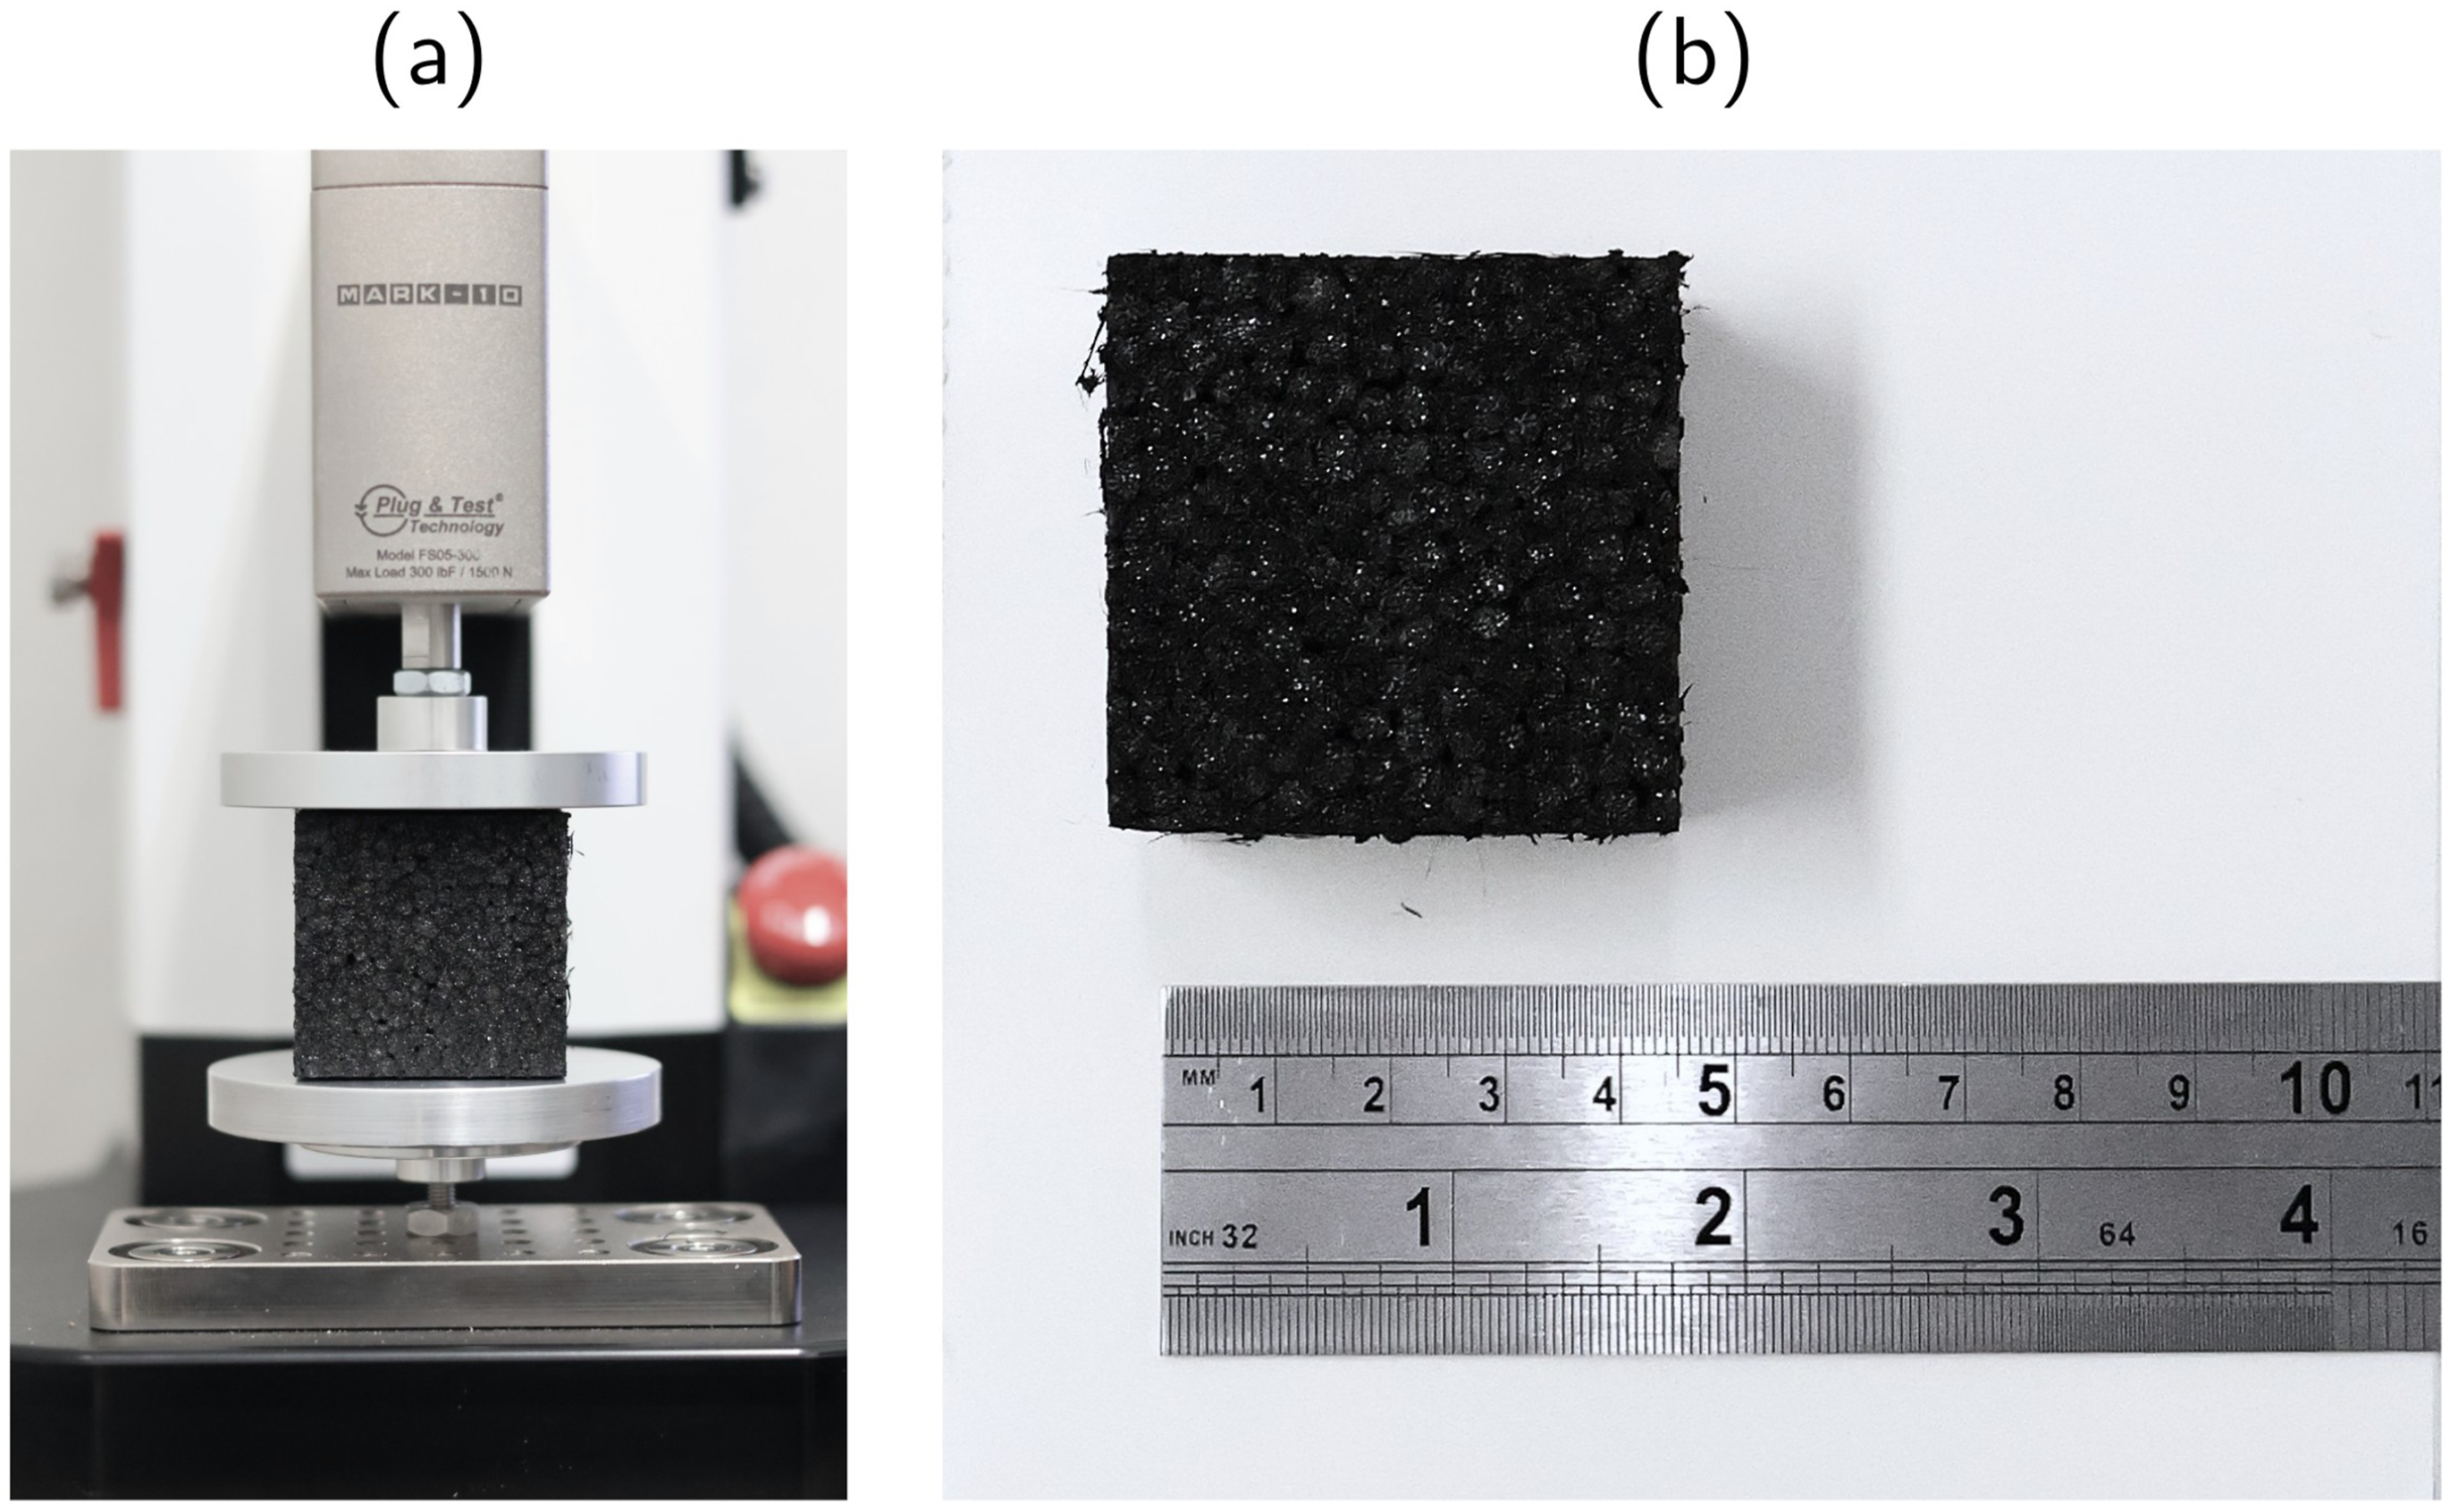
Experimental configuration.
The raw data acquired from each test consisted of time, displacement, and force signals. After filtering out the initial low-load regime and shifting the time vector to the onset of loading, derived quantities were computed as follows.
The engineering strain, ɛ(t), was calculated from the crosshead displacement u(t) and the initial height L0: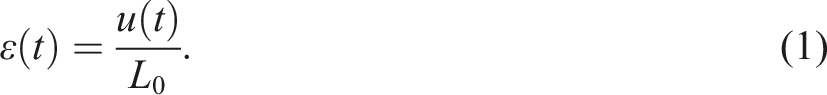
The experimental uniaxial compressive stretch, λ1(t), was obtained as:
The First Piola–Kirchhoff stress in the loading direction, P11(t), was computed using the nominal cross-sectional area A0 = 45 × 45 mm2 and the measured force F(t):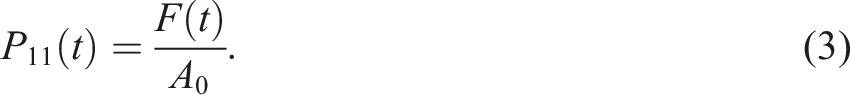
Compression stresses and engineering strains were maintained as strictly negative values (P11 < 0 and ɛ < 0), yielding stretch ratios strictly below unity (0 < λ1 < 1) during the parameter optimization process, following standard continuum mechanics conventions. Retaining these exact negative values is critical; artificially mapping them to positive absolute values alters the hyperelastic energy formulation’s behavior under compression, yielding fundamentally incorrect parameter calibrations. However, for visualization purposes and following standard engineering conventions, the compressive stresses are plotted as their absolute (positive) magnitudes (|P11|) in all figures.
Each of the ten resulting curves for 4.5 and 450 mm/min was used for model calibration. The curve at 45 mm/min was reserved for model validation, as further discussed in following sections.
Kinematics
Foam materials are modeled here as continuous media, neglecting their underlying cellular morphology to enable a macroscopic treatment of their mechanical response. This continuum approximation permits the application of large-deformation kinematics within the standard finite-strain framework. A material point in the reference configuration Ω0 is identified by its position vector 
From this deformation gradient, standard kinematic measures can be derived. These include the right and left Cauchy–Green deformation tensors, respectively defined as:
The Jacobian determinant J = det 
It is important to highlight the kinematic assumption of uniaxial deformation. While rigid foams can exhibit general anisotropic behavior depending on their manufacturing process, assuming a macroscopic isotropic behavior is a standard simplification widely implemented in 3D finite element packages when modeling their primary loading direction. 19 Analysis of the test videos confirmed that specimens exhibited negligible lateral expansion, even at high compression levels; that is, a macroscopic Poisson’s ratio close to zero. 15 This evidence supports the assumption of unit transverse stretches (λ2 = λ3 ≈ 1), which simplifies the volumetric change to be governed almost exclusively by the axial stretch: J = λ1λ2λ3 ≈ λ1. Note that although transverse expansion is constrained, the volumetric compressibility coefficient is not assumed to be zero and remains crucial in the formulation, as the foam undergoes significant volume reduction. The principal stretch λ1 is aligned with the compression axis and is directly related to the engineering strain.
Constitutive modeling overview
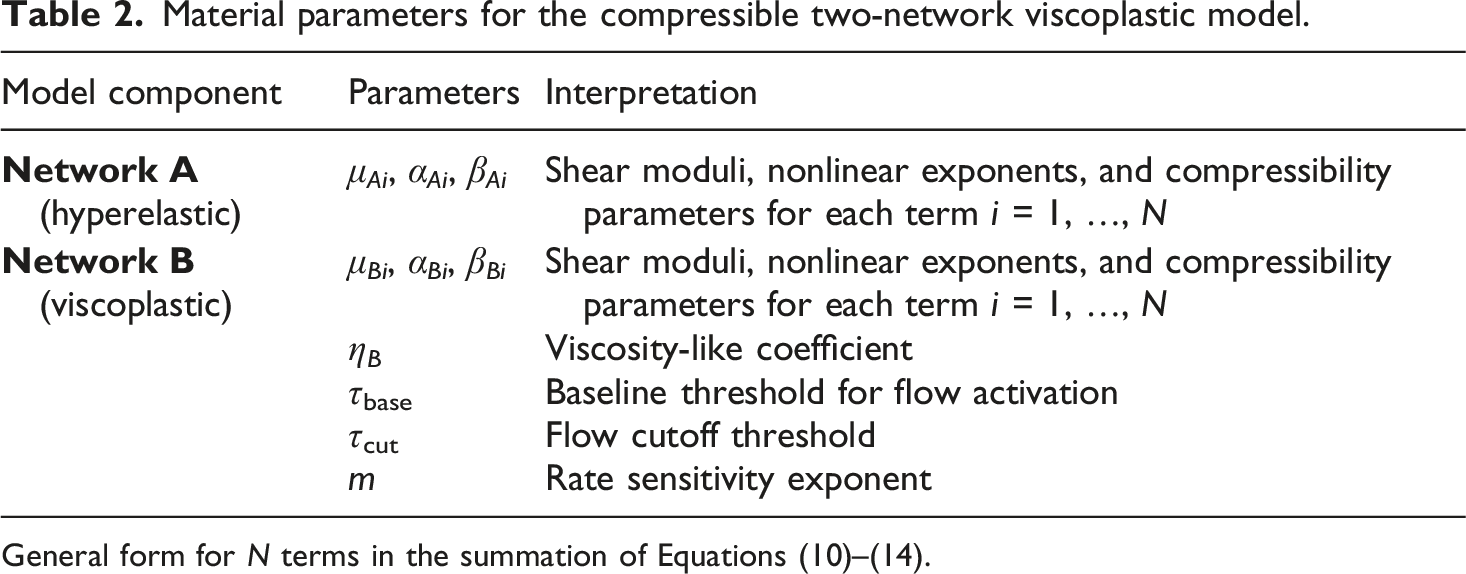
To describe the time-dependent mechanical response of EPP foams under uniaxial compression, a constitutive framework based on a dual-network formulation is proposed. The model considers the material as a compressible hyperelastic-viscoplastic continuum composed of two parallel networks: one purely elastic (Network A) and one viscoplastic (Network B). This superposed-network approach captures both the instantaneous nonlinear elastic behavior and the progressive deformation induced by time-dependent effects considering Ogden-like energy potentials. 19
Network A represents the instantaneous, recoverable response of the material. It is modeled through a macroscopic isotropic compressible hyperfoam potential. The general 3D strain energy function W
A
depends on the principal stretches λ1, λ2, λ3 and the Jacobian J. Applying the kinematic simplification for uniaxial compression (λ2 = λ3 = 1 and J = λ1), the three-dimensional energy potential reduces to a 1D expression W
A
(λ1), defined as a sum of contributions from N
A
exponential-type terms:
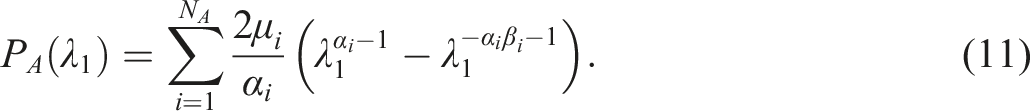
As such equation (11) represents the elastic stress during compressive deformation of EPP specimens.
Network B captures the time-dependent, irreversible deformation mechanisms associated with viscous flow. Its formulation is structurally identical to equation (10), but evaluated over the effective elastic stretch 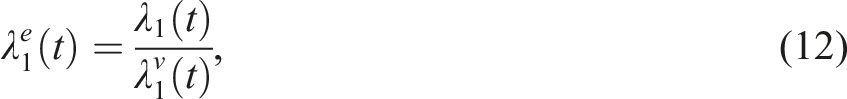
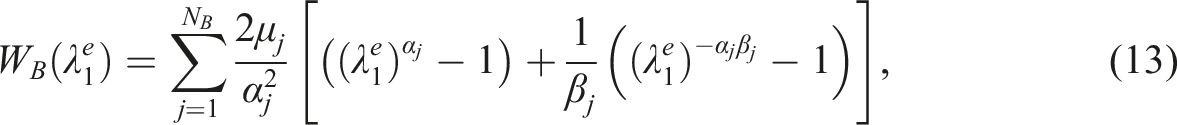
And applying the same chain-rule derivation with respect to the right Cauchy-Green tensor for the effective deformation, the associated first Piola–Kirchhoff stress contribution from Network B becomes: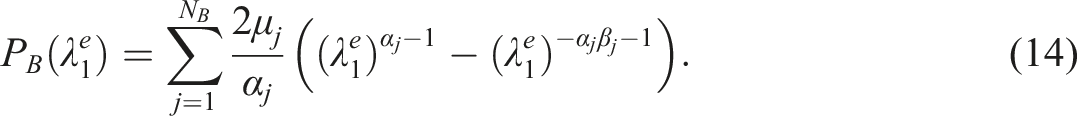
The evolution of the internal variable 
This evolution law is formulated to be thermodynamically consistent. The mechanical dissipation rate,
Both networks act in parallel and experience the same total deformation λ(t), therefore, the total first Piola-Kirchhoff stress in the material is given by:
Material parameters for the compressible two-network viscoplastic model.
Method
To assess the suitability and robustness of the proposed two-network viscoplastic model for simulating the mechanical response of expanded polypropylene (EPP) foams, the following methodological approach was employed: (1) Model formulation and data. The viscoplastic model presented in previous sections was implemented in Python. It consists of two compressible hyperelastic networks: an equilibrium network A and a time-dependent network B governed by an internal viscous variable. Experimental stress–stretch–time data were obtained from uniaxial compression tests conducted at loading rates of 4.5 and 450 mm/min, with ten replicates performed at each rate. The intermediate rate of 45 mm/min was reserved for independent model validation. (2) Optimization and numerical integration. Model parameters were identified by minimizing a weighted normalized sum of squared errors between the predicted and experimental stress responses. To overcome plateau bias—where optimization algorithms inherently sacrifice the short initial linear-elastic region to better fit the extensive stress plateau—a penalty weight factor of 10 was applied to the initial 15% of deformation (λ1 > 0.85). This ensured an accurate capture of the macroscopic yield point. The highly nonlinear differential equation governing the viscoplastic flow was solved using the Backward Differentiation Formula (BDF) method, chosen for its robustness in handling stiff ordinary differential equations. The optimization was conducted using the L-BFGS-B algorithm as implemented in SciPy.
20
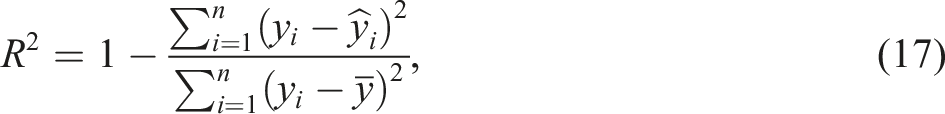
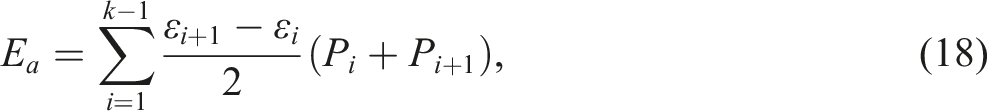
(3) Performance metrics. For each fitted curve, the coefficient of determination R2 was computed to evaluate the goodness of fit: (4) Uncertainty quantification. From the ten fitted models, the variability of the predicted stress was evaluated at each time point. Confidence intervals (95%) and prediction bands (95%) were computed using the sample mean and standard deviation of the predictions across the ten parameter sets, assuming a Student’s t-distribution with nine degrees of freedom for the model predictions across all simulated rates. (5) Validation. The experimental curves at 45 mm/min were used exclusively for model validation. The predicted stress values and corresponding confidence intervals obtained from the training on the extreme rates were compared against the independent intermediate-speed data to evaluate the generalization capability of the model. (6) Energy-based metrics. Two functional indicators were computed from the stress–strain response: the absorbed energy E
a
and the hysteresis loss E
d
. The absorbed energy during loading was calculated using the trapezoidal rule:
The hysteresis loss was computed as the difference between the loading and unloading areas: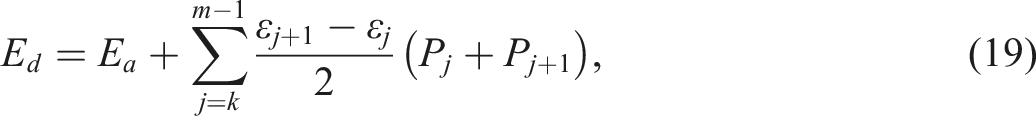
This methodological framework enables a rigorous evaluation of the constitutive model’s ability to reproduce the time-dependent compressive behavior of EPP foams. By combining multi-rate experimental calibration with statistical uncertainty quantification and energy-based metrics, the approach not only ensures robust parameter identification but also allows for the functional assessment of foam performance under large deformations. The inclusion of confidence and prediction intervals further reinforces the predictive reliability of the model when applied to unseen strain-rate conditions.
Results
The mechanical response of the EPP foam under uniaxial compression at loading rates of 4.5, 45, and 450 mm/min is presented in Figure 2. The stress P11 versus λ curves, shown in the top row, exhibit the characteristic three-stage behavior of polymeric foams: an initial quasi-linear elastic region, an extended stress plateau corresponding to cell collapse, and a final densification phase where stiffness increases sharply for λ < 0.5. The material shows a clear rate-dependent response, where an increase in loading rate results in a higher stress level for any given stretch. The loading-unloading paths create a pronounced hysteresis loop, indicating hysteresis and permanent set after the load is removed. Uniaxial compression response at various rates. Nominal stress P11 versus compressive stretch λ (top row) and time (bottom row) at loading rates of 4.5, 45, and 450 mm/min. Note: Compressive stress values are shown as absolute positive magnitudes for visual clarity.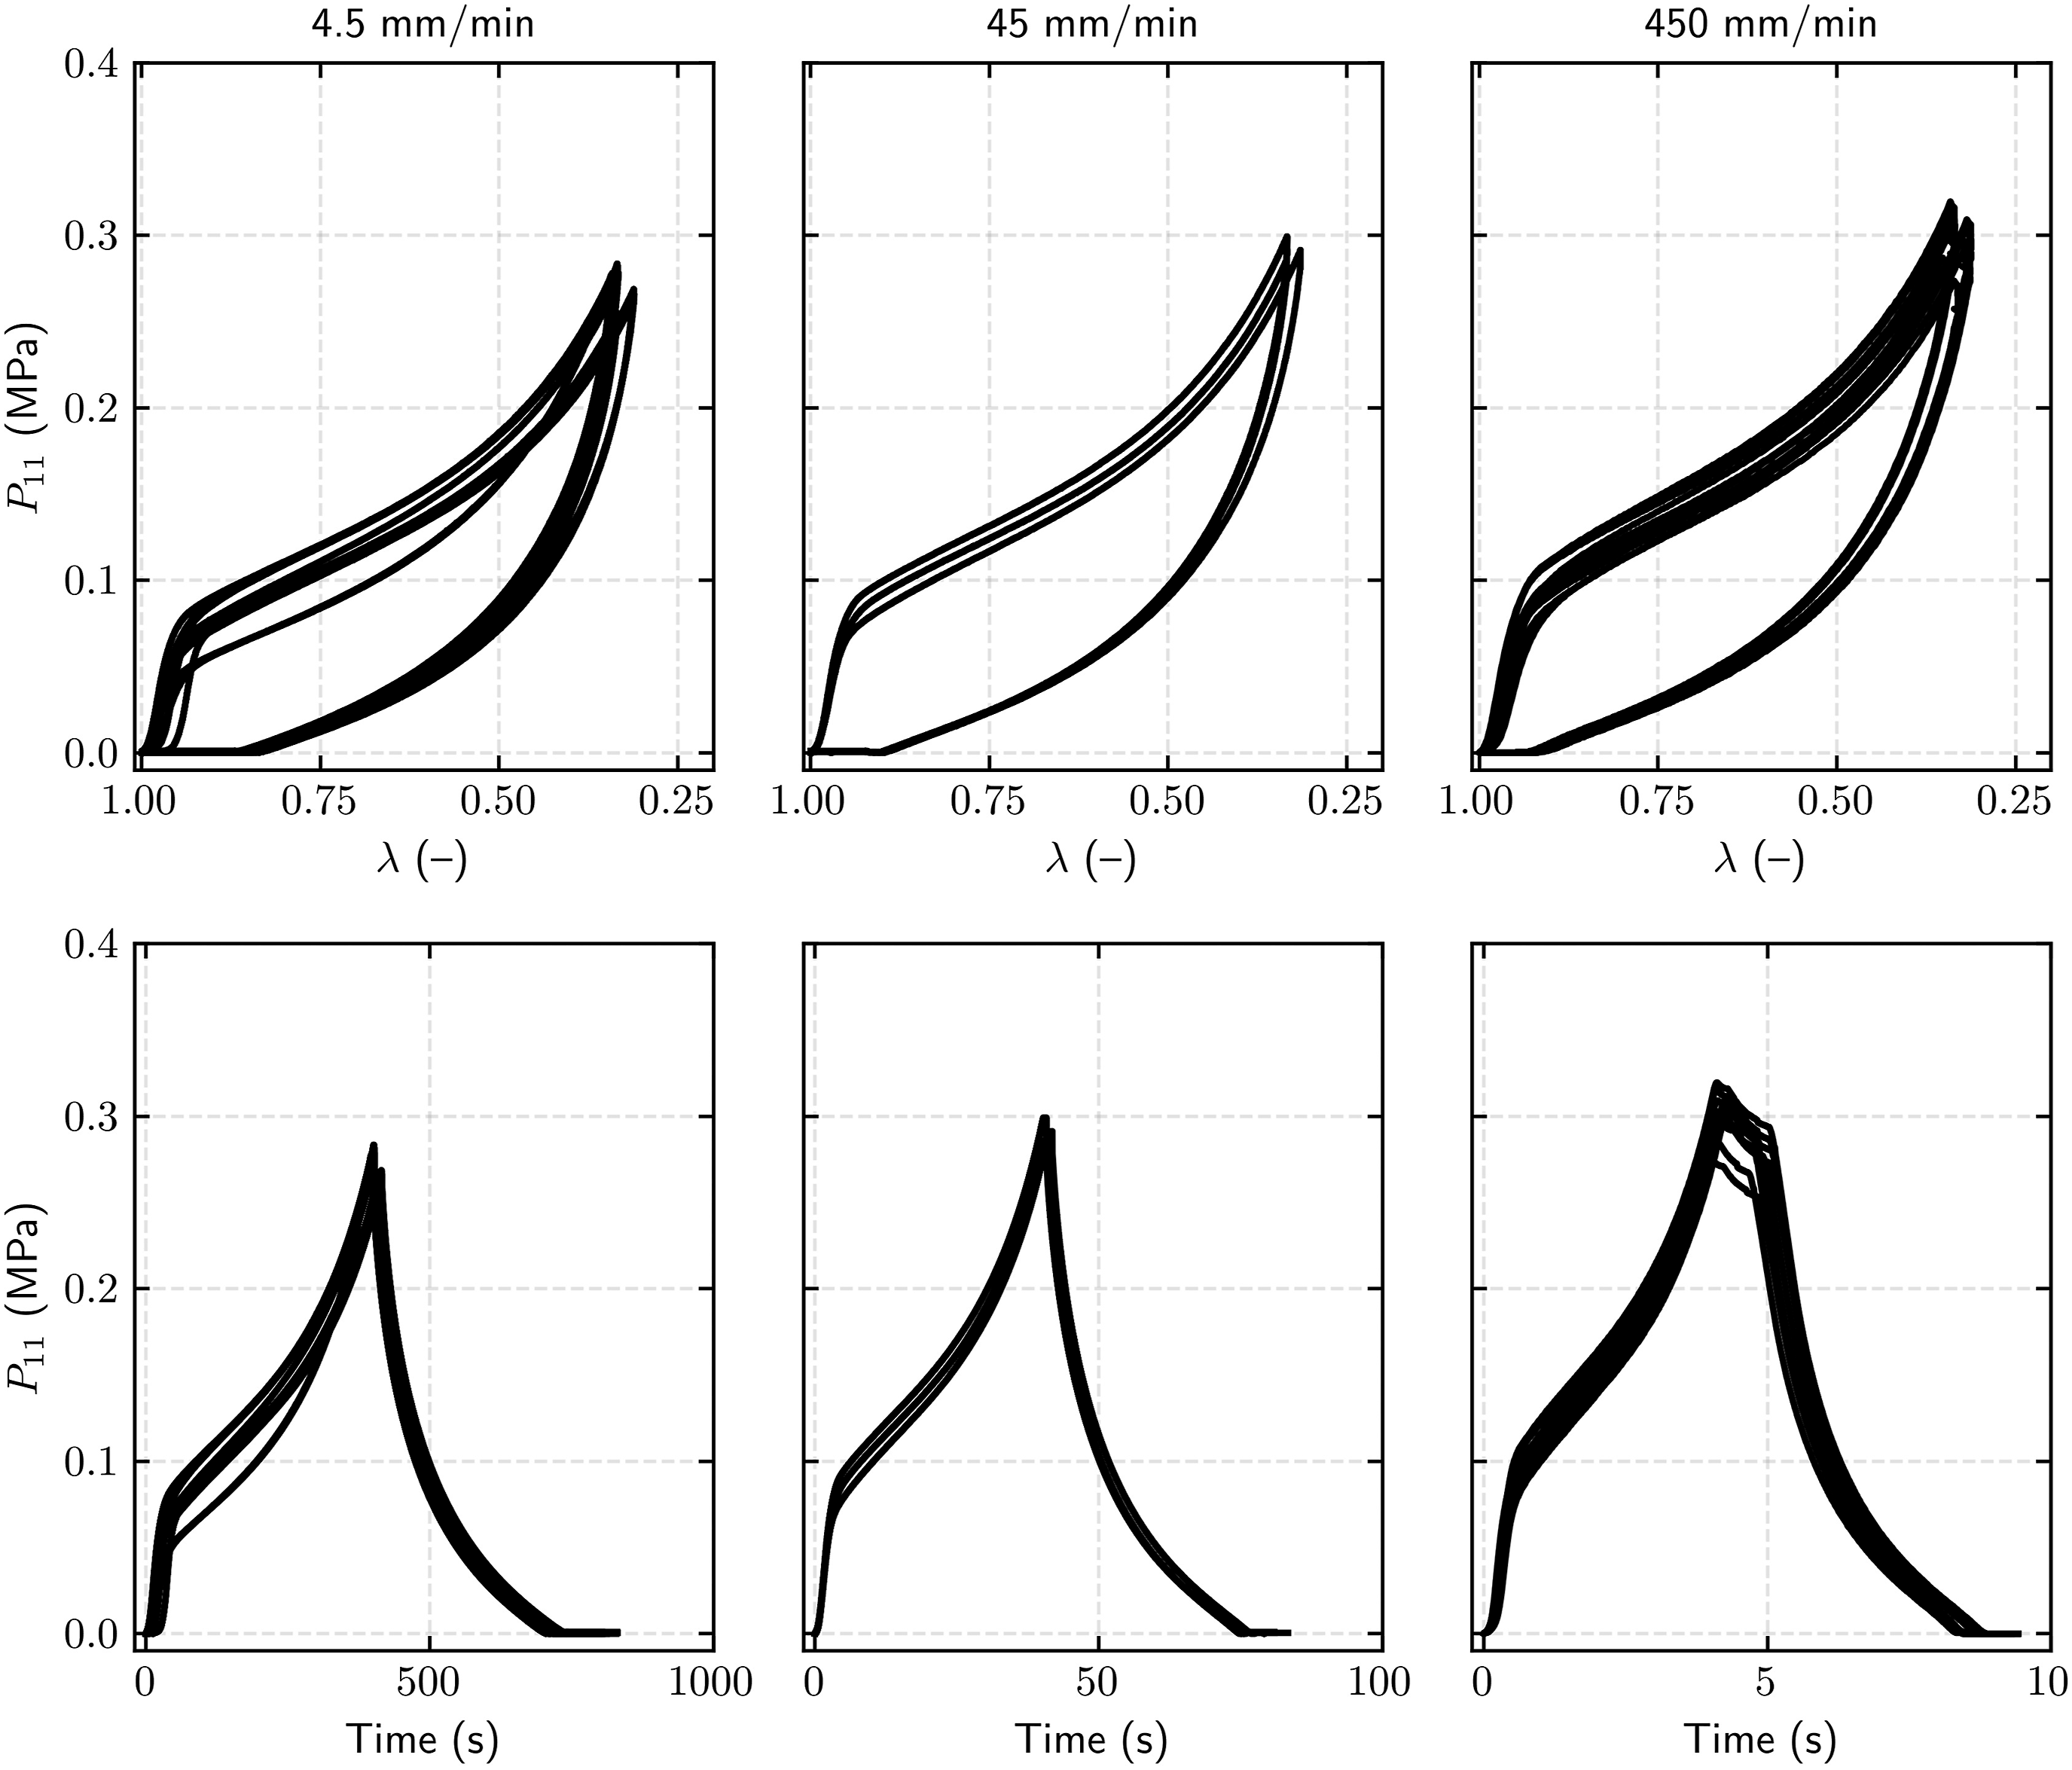
The bottom row of Figure 2 displays the stress response as a function of time. These plots directly visualize the time-dependent nature of the tests, highlighting the vast difference in experimental duration: the cycle at 4.5 mm/min takes approximately 800 s to complete, whereas the cycle at 450 mm/min is completed in under 8 s. This representation confirms the rate-dependent behavior observed in the stress-stretch curves, as the peak stress achieved during the loading phase is visibly higher at faster compression rates.
Figure 3 presents the performance of the calibrated two-network viscoplastic model by comparing its predictions against the experimental stress-time data for the three tested loading rates. The plots for 4.5 mm/min and 450 mm/min demonstrate the model’s fit to the calibration data. An agreement is evident between the mean model prediction (solid red line) and the experimental measurements (dashed black line). This is quantitatively supported by the high coefficients of determination (R2 = 0.979 and R2 = 0.985, respectively), indicating that the model successfully captures the loading and unloading dynamics, including the peak stress and subsequent relaxation behavior. Model validation and uncertainty quantification. Comparison of the model-predicted stress-time response against experimental data for loading rates of 4.5, 45, and 450 mm/min. The plots show the mean model prediction (solid line), experimental data (dashed line), 95% confidence intervals (CI), and 95% prediction intervals (PI). The intermediate rate (45 mm/min) was used as an independent validation set. The coefficient of determination is shown for each case. Note: Compressive stress values are shown as absolute positive magnitudes for visual clarity.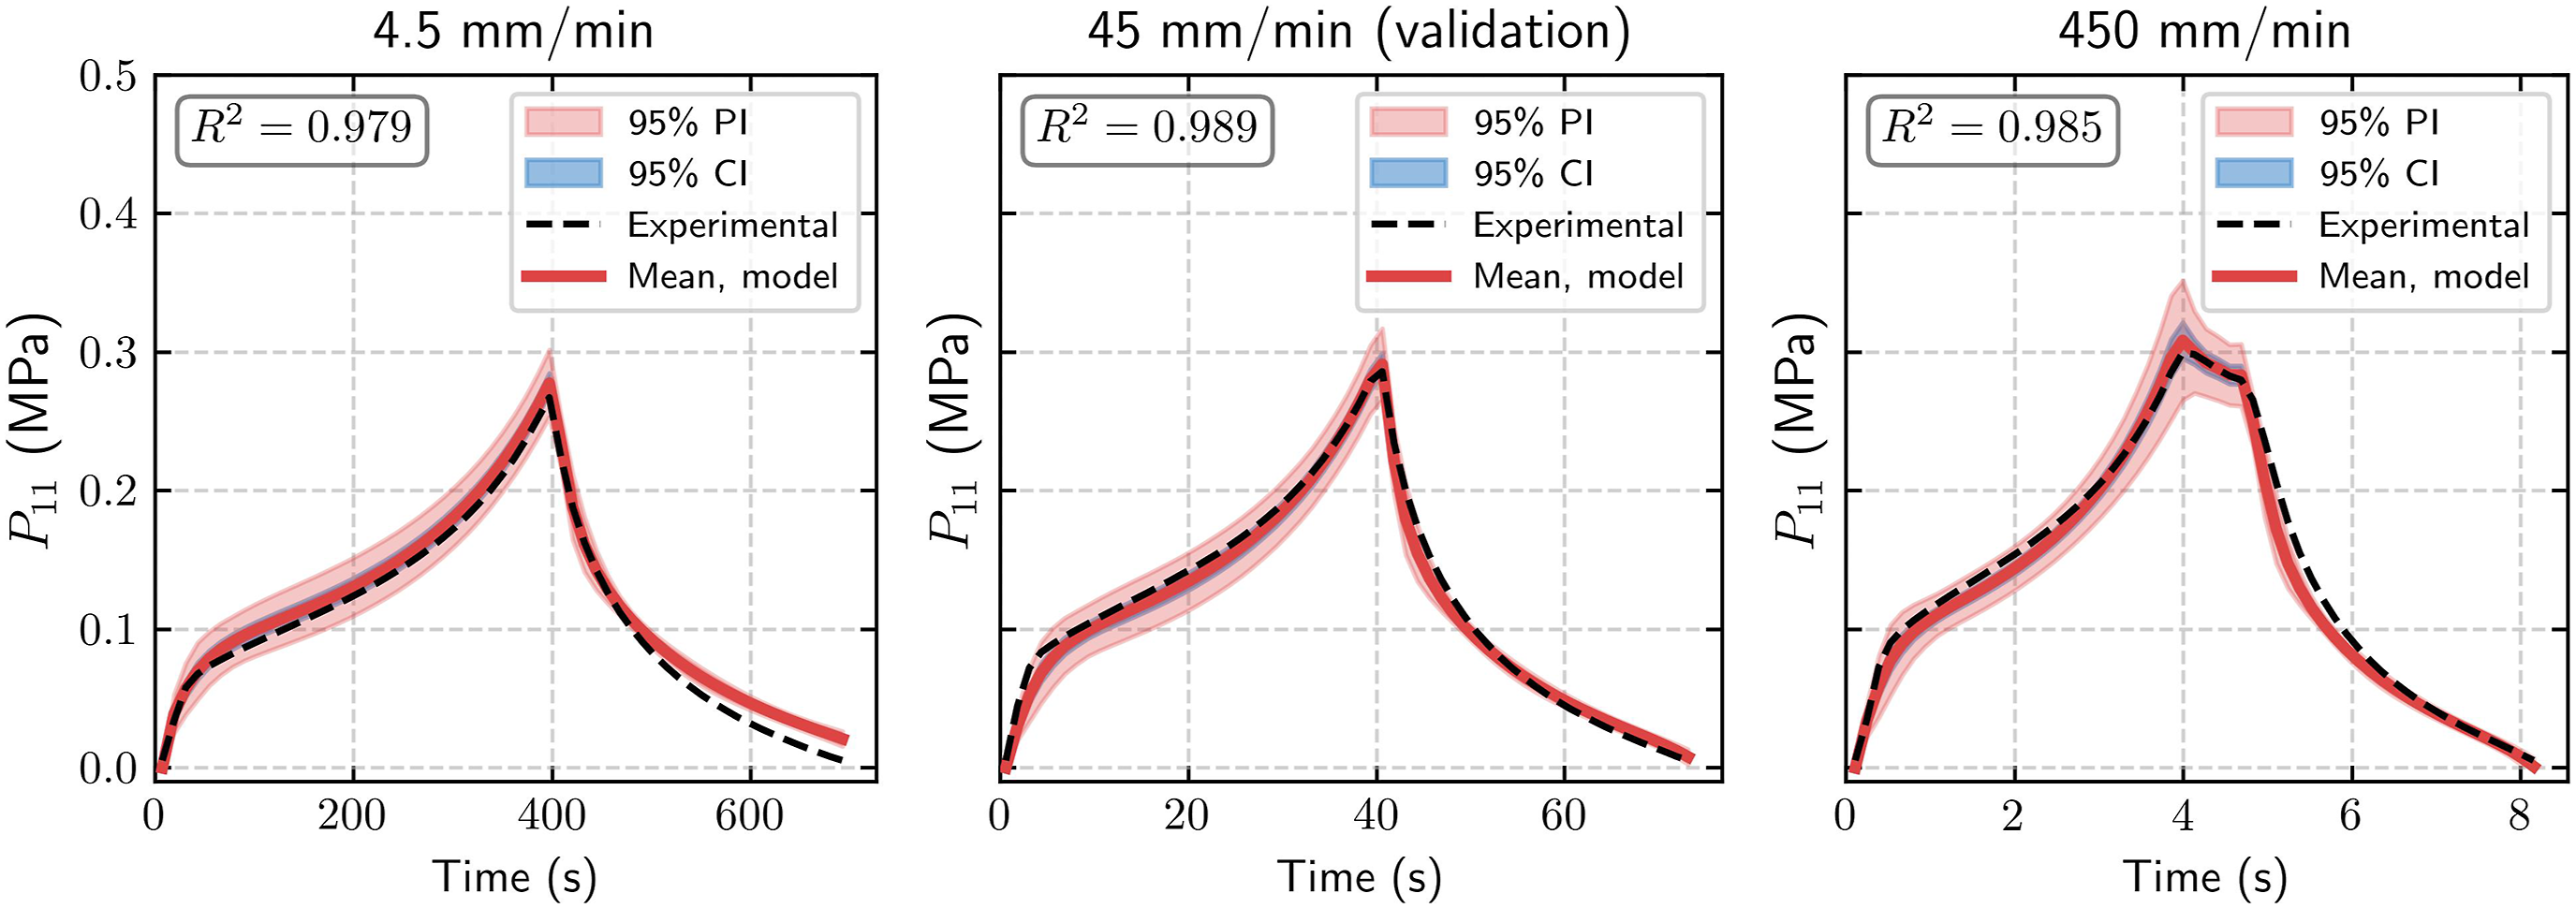
The central panel of Figure 3, corresponding to the 45 mm/min rate, represents a critical validation of the model’s predictive capability using an independent dataset not included in the parameter identification process. The model’s ability to accurately reproduce the experimental curve for this intermediate rate (R2 = 0.989) confirms its robustness and generalization capacity. Moreover, the 95% confidence (CI) and prediction (PI) intervals effectively encompass the experimental data in all three cases.
Mean and standard deviation of the fitted model parameters.
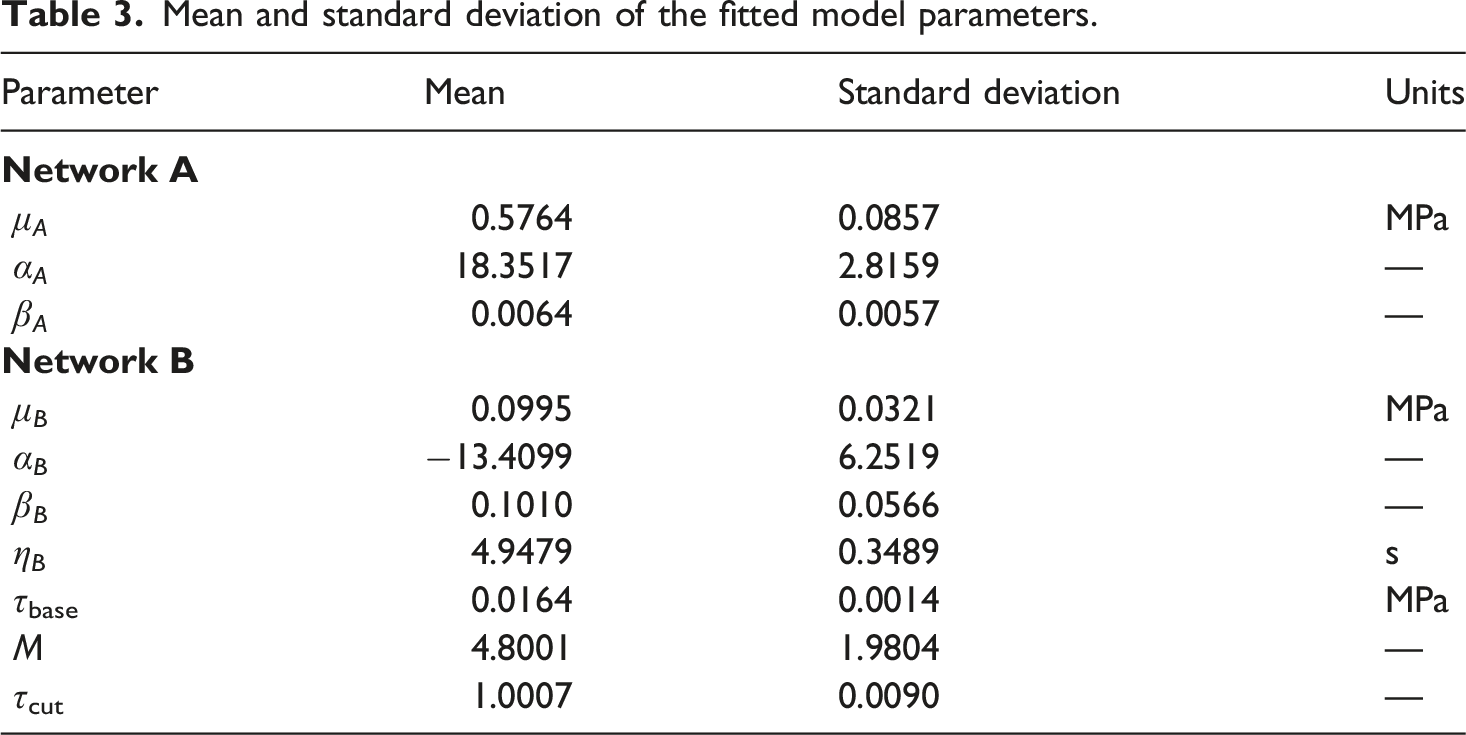
An examination of the mean values reveals the relative contributions of each network. The stiffness modulus of the equilibrium network, μ
A
≈ 0.58 MPa, is nearly six times that of the viscoplastic network, μ
B
≈ 0.10 MPa, indicating that Network A provides the dominant contribution to the material’s overall stiffness. The large positive value of the nonlinear exponent α
A
The obtained parameter values are physically consistent, with positive mean values for the stiffness moduli (μ A , μ B ) and the viscosity term (η B ). The standard deviations offer insight into the sensitivity of each parameter during the calibration process. For instance, the baseline stress threshold τbase shows a relatively small standard deviation compared to its mean, suggesting it is a well-identified parameter. In contrast, parameters such as the nonlinear exponent α B and the rate sensitivity exponent m exhibit larger standard deviations relative to their mean values, indicating greater variability in their fitted values across the experimental dataset.
To further assess the model’s predictive capability for functional metrics, the absorbed energy E
a
was calculated as a function of engineering strain. Figure 4 shows a comparison between the absorbed energy derived from the experimental data and the values predicted by the model. The model’s response was generated using the set of mean parameters reported in Table 3. As observed, the model’s predictions closely track the experimental mean curve for the validation rate of 45 mm/min. Minor deviations appear at the boundaries of the tested loading rate range: a slight overestimation of the absorbed energy throughout the deformation at the lowest rate (4.5 mm/min), and a slight underestimation during the densification phase at the highest rate (450 mm/min). This confirms that the calibrated model is capable of reproducing key engineering performance indicators such as energy absorption across different loading rates. Model’s prediction comparison of absorbed energy. Model-predicted absorbed energy (dots) versus the experimentally measured mean (solid line) and standard deviation as a function of engineering strain. Results are shown for loading rates of 4.5, 45, and 450 mm/min. The model’s prediction was generated using the mean parameter set from Table 3.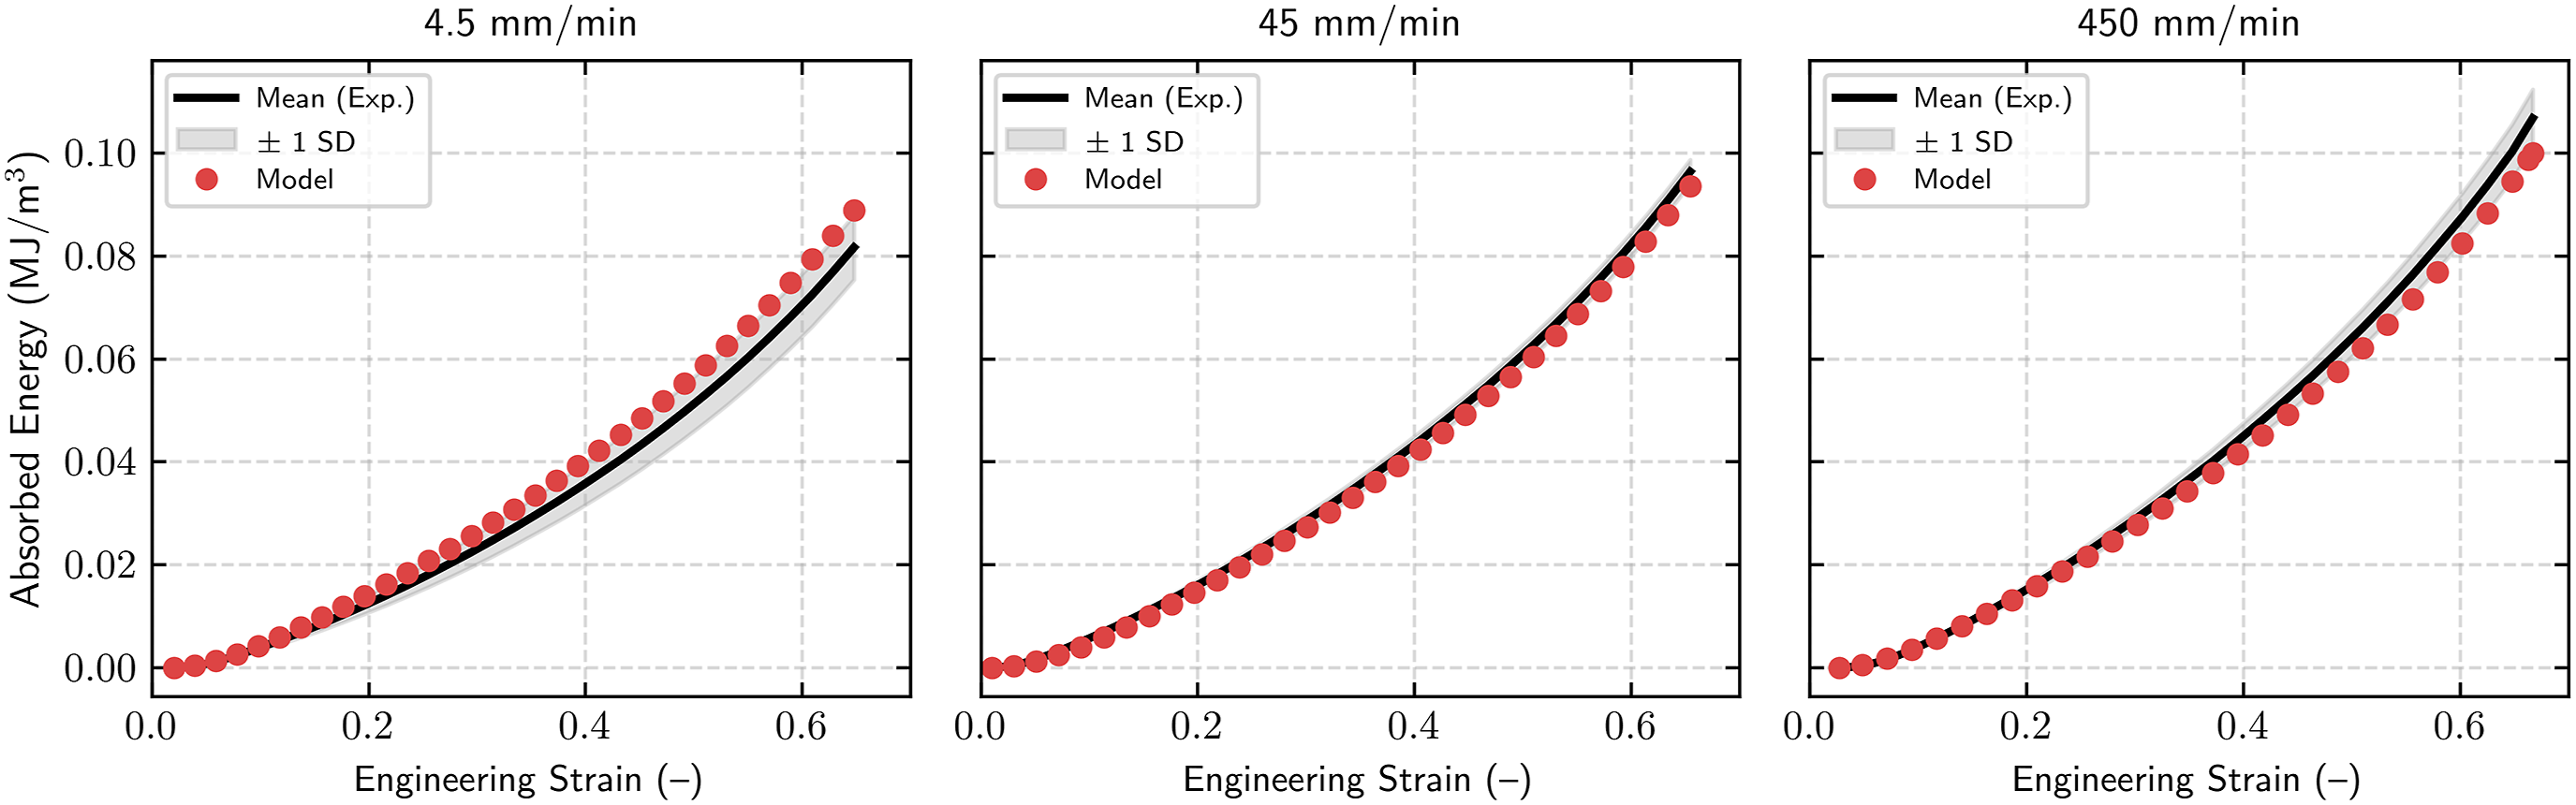
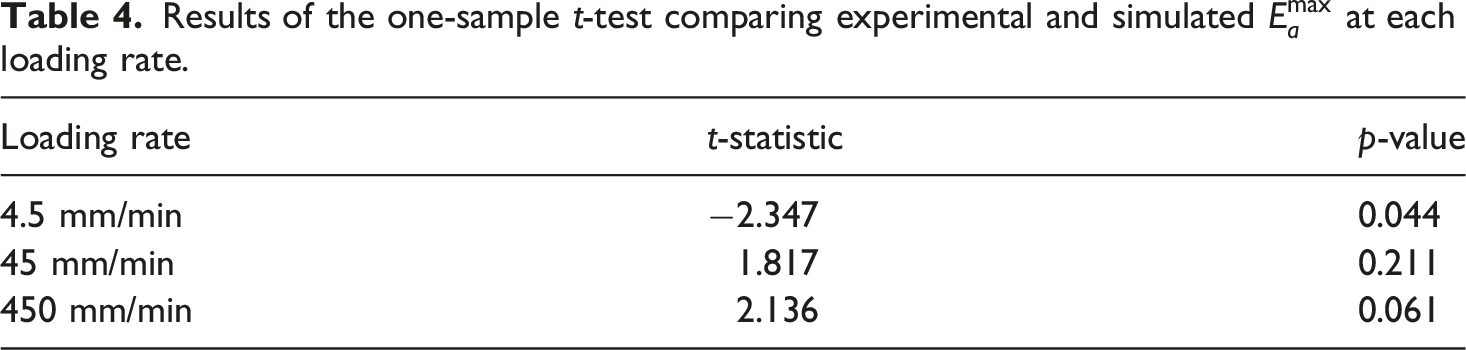
Results of the one-sample t-test comparing experimental and simulated
The model’s capability to predict summary engineering metrics was evaluated. Figure 5 presents a comparison between the model’s predictions and the experimental measurements for two key parameters: the maximum absorbed energy Model prediction for integrated energy metrics. Comparison of the model’s predictions (dots) against experimental results (bars representing mean ± one standard deviation) for: (left) maximum absorbed energy, 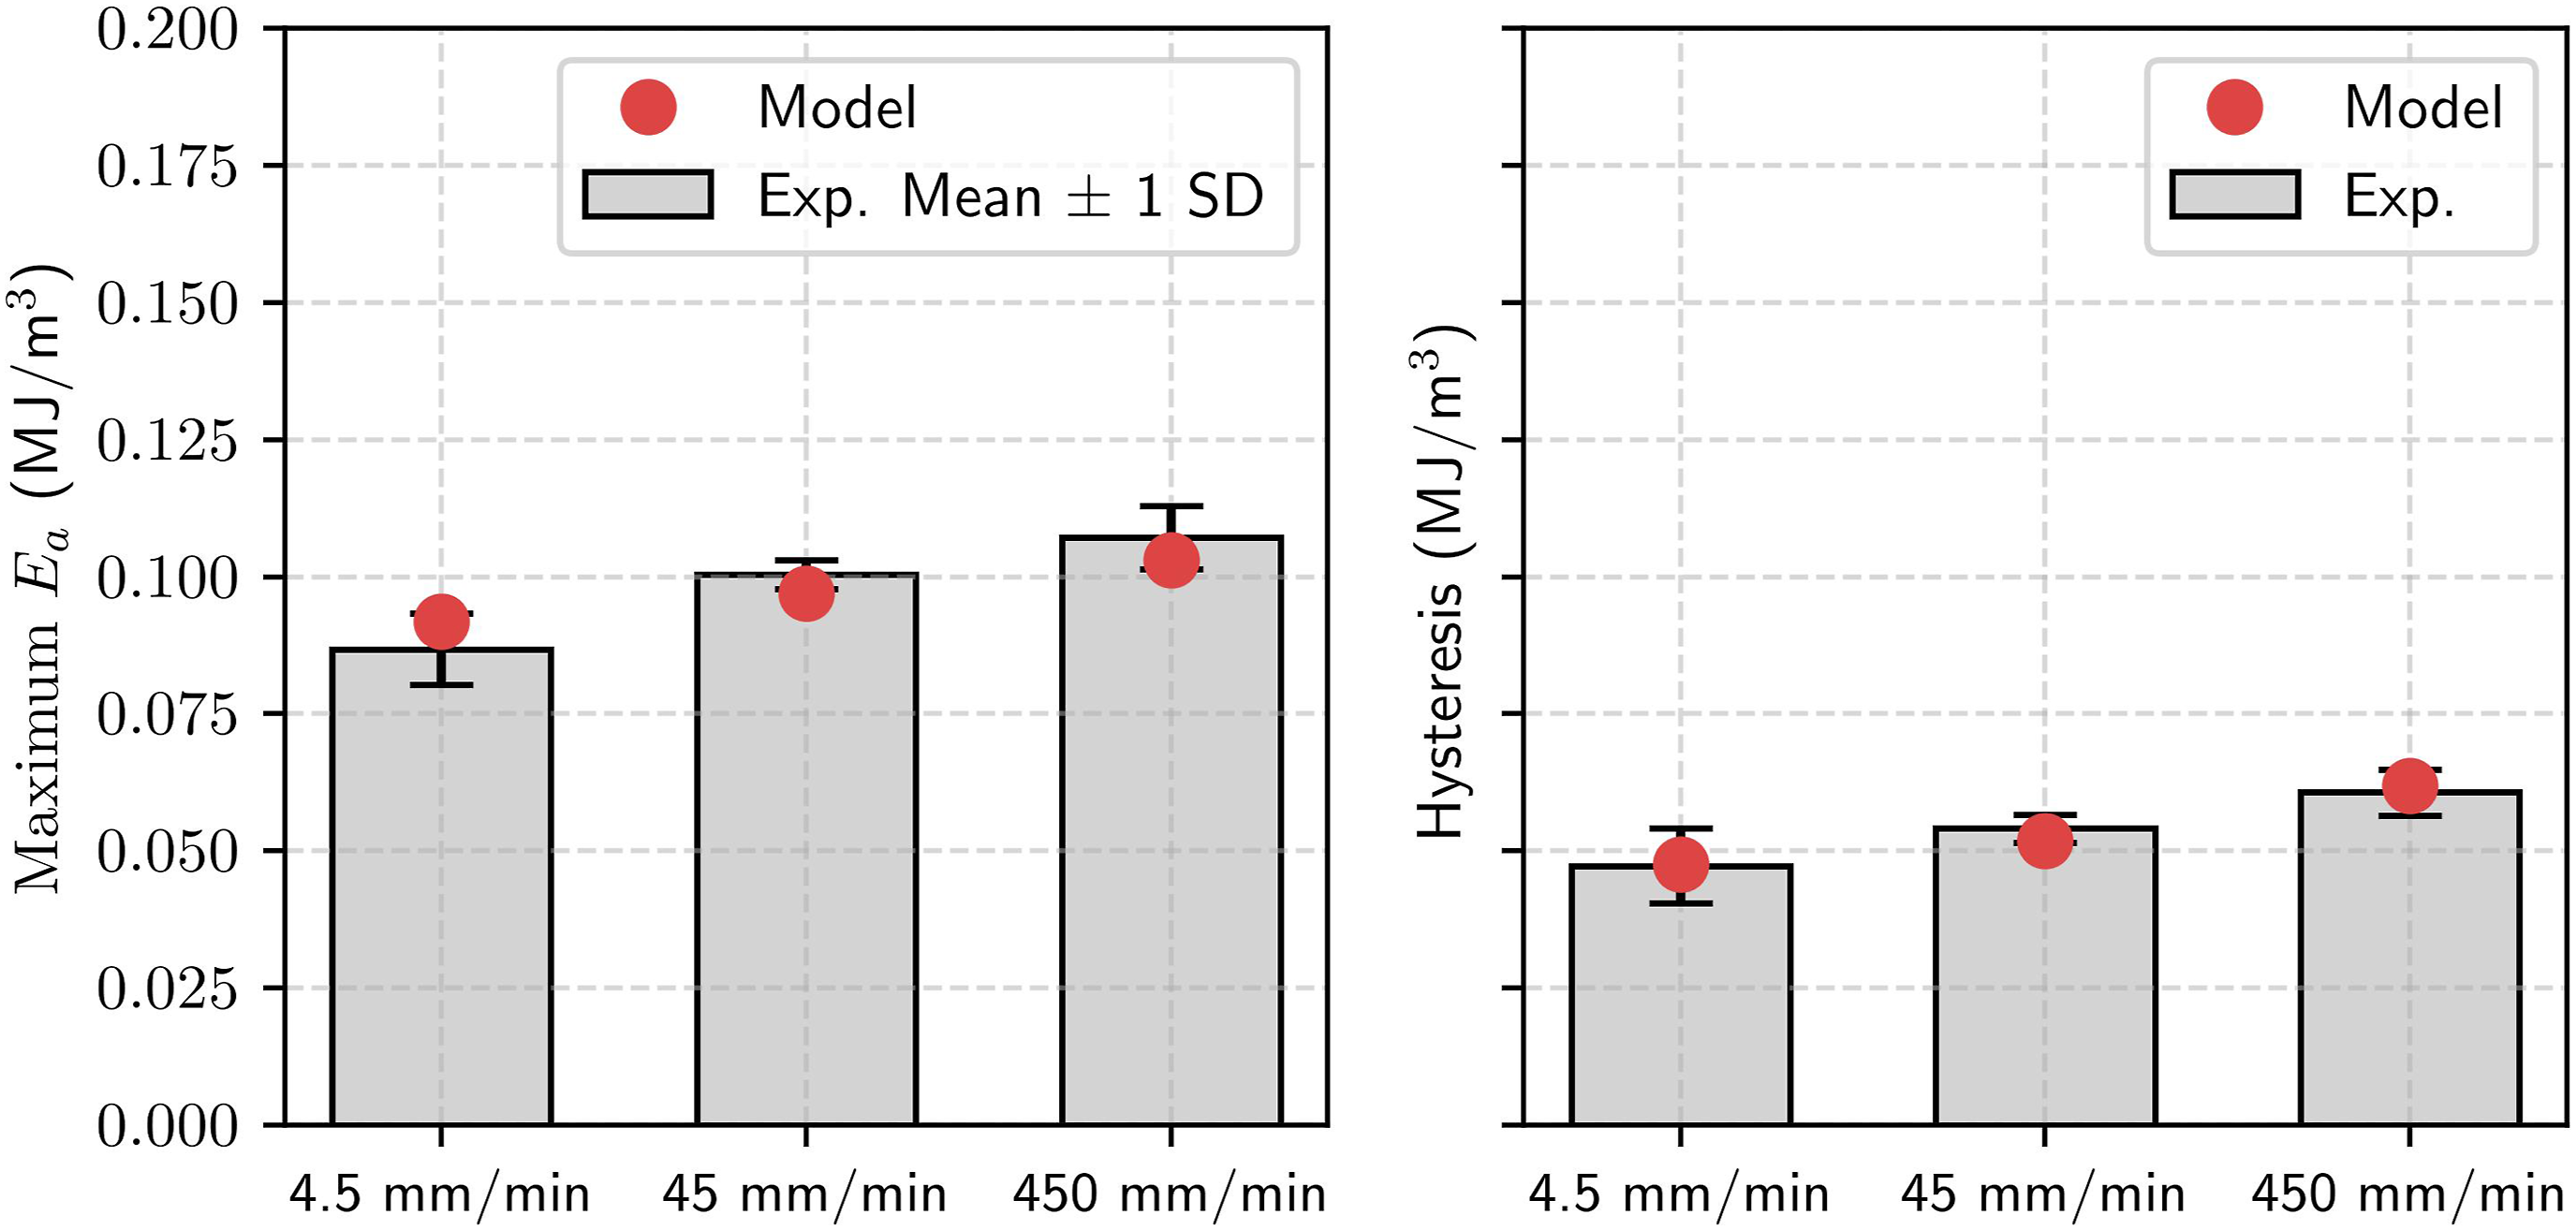
In the case of hysteresis, the model exhibits predictive capability, accurately capturing the energy loss across all evaluated strain rates. As observed in Figure 5 (right panel), the model predictions fall remarkably well within the experimental standard deviation bounds for the loading rate conditions. This demonstrates that the thermodynamically consistent viscoplastic formulation correctly captures the rate sensitivity of the material’s internal dissipation mechanisms, overcoming the limitations typically found in equivalent phenomenological models.
Discussions
In this work, a two-network viscoplastic constitutive model was developed and validated to describe the rate-dependent compressive behavior of expanded polypropylene foams. The proposed model can capture the compressive mechanical response of EPP, and it aligns with findings in the literature highlighting the necessity of combining equilibrium hyperelasticity with rate-dependent viscous networks.14,17 While single-network hyperelastic models adequately describe initial quasi-static loading, 11 they inherently fail to capture the severe hysteresis, permanent set, and strain-rate sensitivity typical of polymeric foams. The proposed framework bridges this gap for EPP by incorporating a viscoplastic overstress network based on foundational concepts introduced by Bergström and Boyce 16 The model was calibrated using experimental data from uniaxial compression tests at 4.5 mm/min and 450 mm/min loading rates obtained following the ASTM D1621 standard.
The model’s predictive capability was then assessed by validating it against an independent experimental dataset at an intermediate rate of 45 mm/min, and its capability to simulate key functional metrics such as absorbed energy and hysteresis was evaluated. An uncertainty quantification framework was employed to establish confidence and prediction intervals for the model’s response, providing a statistical measure of its robustness.
The experimental campaign included ten replicates for each of the calibration speeds (4.5 and 450 mm/min) to capture the material’s inherent variability. While scatter in the stress response was observed at both rates, it was significantly more preponderant at the lower speed of 4.5 mm/min. This observation is visually confirmed in the stress-time plots (Figure 2, bottom row), where the spread in peak stress values is most evident for the 4.5 mm/min test. This increased variability is likely attributable to two main factors. First, slower loading allows the influence of intrinsic material inhomogeneities (e.g., local density and cell size variations) to be more pronounced in the macroscopic response. Second, minor geometric deviations from the nominal 45 mm specimen dimensions, can introduce experimental artifacts that are more apparent in quasi-static tests. It is crucial to note, however, that despite this scatter, all individual test curves consistently exhibited the three characteristic stages of foam compression: the linear-elastic region, the stress plateau, and final densification.
The quantitative validation of the model confirms its high predictive accuracy. As shown in Figure 3, the coefficient of determination exceeded 0.97 for both the calibration datasets and, more importantly, for the independent validation case. This level of performance is comparable to that achieved in studies using different advanced modeling techniques for similar materials, such as the neural network approach applied by Rodríguez-Sánchez and Plascencia-Mora to model expanded polystyrene foams. 21 The successful modeling of these two distinct polymer foams opens a valuable avenue for future work, namely, applying the present viscoplastic framework to EPS to directly compare the efficacy of physics-based versus data-driven models. A key advantage of the proposed constitutive model is its inherent physical interpretability; unlike a neural network that often acts as a ”black box” requiring complex explainability techniques, the parameters in this viscoplastic formulation are directly tied to physical concepts like stiffness, viscosity, and flow thresholds, offering direct insight into the material’s mechanical behavior. 22
The model’s performance was further evaluated through a quantification of its predictive uncertainty. The variability in the calibrated parameters, resulting from the experimental scatter, was used to establish 95% CI and PI intervals the model’s stress response. The CI represents the uncertainty in the mean prediction, while the PI additionally incorporates the inherent stochasticity of the material’s behavior. The results in Figure 3 show that the experimental validation data are contained within these bounds. This outcome suggests that the modeling approach generates a statistically consistent range for the material’s expected response, which is a prerequisite for its application in reliability-based design analysis.
The physical significance of the model is supported by the fitted parameter values shown in Table 3. The stiffness of the equilibrium network (μ A ≈ 0.58 MPa) is nearly six times that of the viscoplastic network (μ B ≈ 0.10 MPa), which is physically consistent. This indicates that the instantaneous, recoverable elastic response provides the dominant resistance to deformation, while the time-dependent mechanisms represent a softer, parallel pathway. Furthermore, the identified flow activation threshold (τbase ≈ 0.016 MPa) aligns perfectly with the early departure from the initial linear-elastic regime, marking the exact onset where microscopic yielding initiates preceding widespread cell buckling. The value of the rate sensitivity exponent (m ≈ 4.8) explains the strong dependence on loading rate, suggesting that the viscous flow is highly sensitive to the magnitude of the overstress. Finally, it is the highly negative exponent of the viscoplastic network (α B ≈ − 13.4) that mathematically drives the sharp upturn in compressive stress during the foam’s densification phase.
A key observation from the parameter calibration (Table 3) is the significant improvement in parameter identifiability compared to highly-parameterized formulations. In viscoplastic flow rules (Eqation (15)), mathematical parameters can often couple, creating an infinite set of combinations that yield the same macroscopic behavior. To actively mitigate over-parameterization and mathematical redundancy, the cutoff threshold τcut was constrained to a narrow band around unity
The model’s validity was further examined by assessing its ability to predict integrated, functional metrics like energy absorption and hysteresis, with the results shown in Figures 4 and 5. For the maximum absorbed energy
On the other hand, the proposed model can predict hysteresis loss, because it tracks the internal energy loss as shown in Figure 5 (right panel). As such, the model’s predictions fall within the experimental standard deviation bounds for all evaluated loading rates. This confirms that the thermodynamically consistent overstress flow rule correctly captures the rate sensitivity of the material’s internal dissipation mechanisms, representing a significant improvement over purely elastic or pseudo-elastic formulations.
It is important to acknowledge the limitations of the present study, which define the scope of the model’s validated application. The constitutive framework was developed and calibrated exclusively using uniaxial compression data; its performance under other loading states, such as tension or shear, remains unverified. Furthermore, the investigation was conducted under isothermal laboratory conditions, and the model in its current form does not account for the potential influence of temperature on the material’s response. Regarding the rate-dependent response, the only identified deviation was the slight overestimation of the absorbed energy at the lowest rate, suggesting slow relaxation mechanisms might require further refinement. Finally, the formulation does not yet include a mechanism to describe cyclic stress softening (the Mullins effect), which would be relevant for repeated impact scenarios. 15
Based on these considerations, several opportunities for future research can be delineated. A primary next step would be to extend the experimental campaign to include multiaxial or shear loading to validate the isotropic assumption and generalize the model for three-dimensional applications. 12 Incorporating temperature effects into the viscoplastic parameters would also be a valuable enhancement for predicting performance in real-world thermal environments. 18 Future work should also focus on refining the viscoplastic flow rule to perfect the quasi-static energy absorption prediction, and on introducing a damage variable to account for cyclic loading effects. 1 Finally, applying this physics-based framework to other polymer foams, such as expanded polystyrene, would allow for a direct comparison with data-driven models21,22 and further elucidate the trade-offs between physical interpretability and predictive accuracy.
Conclusions
A two-network viscoplastic constitutive model was successfully developed and validated to describe the rate-dependent compressive behavior of expanded polypropylene foam. The proposed framework demonstrated high predictive accuracy, achieving coefficients of determination exceeding 0.97 for the calibration datasets and, critically, exceeding 0.98 for the independent validation dataset at an intermediate strain rate. This result confirms the model’s robustness and its ability to generalize across a range of loading conditions. The model’s utility as an engineering tool was further established by its accurate prediction of hysteresis loss and overall energy absorption capacity. The physical interpretability of the network parameters, combined with a rigorous uncertainty quantification, provides a transparent and reliable foundation for predictive simulations of EPP components.
While the model shows strong overall performance, its identified limitations define clear research paths. Although energy dissipation was consistently captured across the evaluated dynamic range, a statistically significant overestimation of the maximum absorbed energy was observed at the lowest quasi-static speed (4.5 mm/min). This suggests that the representation of ultra-slow relaxation mechanisms could be further refined. The model’s validation is also currently restricted to uniaxial compression under isothermal conditions; therefore, future work should prioritize experimental campaigns and model extensions that account for multiaxial loading states and thermal dependencies. Furthermore, introducing a damage variable to describe cyclic stress softening would significantly broaden the model’s applicability to repeated impact scenarios, representing a crucial next step toward a more comprehensive predictive tool.
Footnotes
Acknowledgements
The author would like to thank Dr. Héctor Plascencia-Mora for the support provided in facilitating the EPP material supporting this article.
Funding
The author received no financial support for the research, authorship, and/or publication of this article.
Declaration of conflicting interests
The author declared no potential conflicts of interest with respect to the research, authorship, and/or publication of this article.
Data Availability Statement
All data necessary to validate the findings are included in this article. Additional data is available from the corresponding author upon reasonable request.