
Abstract
To optimize the cellular structure and enhance the performance of thermoplastic polyurethane (TPU) foams, this work addresses the limitations of conventional microcellular injection molding (MIM) by employing a self-designed mold-opening mold and a mold-opening microcellular injection molding (MOMIM) process, which uses a self-designed expandable-cavity mold to produce finer and more uniform cells with higher cell density and lower foam density. It also simplifies the mold structure without complex linkage mechanisms, improves product surface quality, enhances process versatility, and reduces production costs. The effects of key MOMIM parameters—including mold-opening distance, holding pressure, holding time, mold-opening speed, and mold-opening delay time—on cell size and density, cell wall thickness, foam density (expansion ratio), as well as mechanical and thermal properties are comprehensively investigated. The results demonstrate that the optimal process is: mold-opening distance 3 mm, holding pressure 35 MPa, holding time 6 s, mold-opening speed 20 mm/s, and mold-opening delay time 8 s. Under these conditions, TPU foam exhibits an average cell diameter of 43.40 μm, which is reduced by 34.63% compared with MIM foams; a cell density of 1.6 × 10⁷ cells/cm3, 22.18 times higher than MIM foams; an average cell wall thickness of 4.03 μm, reduced by 72.36%; and a skin layer thickness of 0.400 mm, reduced by 22.77%. The compressive strength is 4.58 MPa and the compressive modulus is 6.95 MPa, corresponding to reductions of 22.23% and 22.88%, respectively. The thermal conductivity at room temperature is 0.071 W/(m·K), representing a 55.91% improvemen. By precisely tuning the MOMIM parameters, this study successfully achieves simultaneous optimization of cell structure and macroscopic performance, balancing mechanical robustness and thermal insulation. It expands the application scope of TPU foams toward lightweight packaging, thermal insulation in new-energy vehicles, and building energy-saving materials, and provide a solid theoretical basis for the fabrication of high-performance, multifunctional foams.
Keywords
Introduction
With the rapid development of modern industry, plastic products have become deeply integrated into key sectors such as automotive, aerospace, electronics, medical devices, and packaging, owing to their light weight, ease of processing, and high cost-effectiveness. With the continuous breakthroughs in high-performance plastics and composite materials technologies, the functionality and structural complexity of plastic products have been progressively enhanced, thereby expanding their applications in precision devices, structural components, and high-end equipment manufacturing. Against this backdrop, the lightweighting of plastic products has become an inevitable trend in industry development.1–3 Developing structural materials that combine outstanding mechanical properties with lightweight characteristics has become a critical demand for driving the upgrading of modern industry. Supercritical fluid (SCF) microcellular foaming technology offers significant advantages, including material savings, weight reduction, and good mechanical performance,4–7 and is widely used in fields such as automotive, rail transportation, medical devices, and food packaging. 8
The physical foaming methods currently used to prepare polymer microcellular foam materials primarily include SCF extrusion foaming,9–11 batch (autoclave and mold) foaming, 12 and microcellular injection molding (MIM).13–17 Extrusion foaming is a continuous production process, in which the foaming agent is uniformly dispersed into the molten polymer under high temperature and pressure. A sudden pressure drop at the extruder die induces nucleation and growth of the supercritical gas, resulting in lightweight foamed materials that are suitable for large-scale continuous production. Batch foaming is a batch process in which supercritical gas is dissolved into the polymer under high temperature and pressure until saturation. Rapid depressurization/temperature reduction induces bubble nucleation and the formation of a cellular structure. This process offers good controllability and bubble stability, with reduced material usage, making it suitable for fundamental theoretical research. MIM involves injecting SCF uniformly into the polymer melt, forming a gas/polymer mixture in the feed tube. The homogeneous gas-polymer mixture is then forced through the nozzle under pressure drop by the screw, inducing nucleation and growth of bubbles. MIM differs from the other two foaming methods in terms of molding method, bubble size, and control precision. Specifically, compared to extrusion foaming, MIM offers higher molding flexibility, allowing for the production of complex geometries. Additionally, MIM provides higher dimensional accuracy, effectively reducing warpage and shrinkage, thus improving mechanical properties. However, extrusion foaming, with larger cell sizes, tends to result in rough surfaces and reduced mechanical properties. Compared to batch foaming, MIM features higher material utilization, dimensional stability, and efficiency. However, batch foaming is typically used for producing highly foamed products with larger cells, which can reduce mechanical performance, the uniform small-cell structure in MIM improves impact resistance and fatigue performance. Therefore, MIM has significant advantages in efficient precision manufacturing and high-performance applications.18,19
Despite the immense potential of MIM, conventional MIM have several significant drawbacks, such as poor surface appearance, large variations in skin-core cell size, non-uniform overall foam structure, and limited weight reduction ratio, which greatly restricts their widespread application. To address these issues, researchers have continually optimized process parameters and introduced new MIM technologies to improve foam structure and overcome performance bottlenecks, 20 including gas back-pressure MIM, pressure-assisted foaming, and core-back foaming have been developed. For instance, Hou et al. 21 proposed a novel gas back-pressure MIM, which applies pressure after the melt has filled the mold. This increases the melt pressure within the cavity, enlarging the critical nucleation radius, redistributing the foam cell sizes, and leading to a more uniform foam structure. Yilmaz et al. 22 employed injection compression molding (pressure-assisted foaming) with varying cavity thicknesses to process ultra-high molecular weight polyethylene (UHMWPE), promoting an increase in crystallinity. The early formation of crystals elevates the gas concentration around them, thus facilitating bubble nucleation and improving the foam structure. Chiu et al. 23 used core-back foaming to produce foamed components, increasing the internal cavity space and reducing the pressure, which induces the decomposition or escape of the foaming agent, triggering the foaming process. Among these technologies, mold-opening microcellular injection molding (MOMIM)24,25 can be regarded as an improved process derived from conventional MIM. Its core lies in regulating mold-opening parameters to open the mold by a certain distance (without complete open) after the injection and holding pressure stages. This provides additional foaming space, induces secondary cell expansion, thereby significantly improving cell uniformity and the surface quality of foamed products. Meanwhile, it remarkably enhances the expansion ratio (reduces foam density) of foamed products, ultimately achieving an overall improvement in their comprehensive properties. 26 Moreover, the mold-opening tooling features a simpler overall structure without complex linkage core-pulling mechanisms, which reduces machining and assembly difficulty, allows compact mold design, and offers broad applicability without the need for specialized injection equipment. Therefore, compared with conventional MIM, MOMIM not only facilitates density reduction and weight savings but also delivers superior cushioning, thermal insulation, and energy absorption properties.27,28 Thermoplastic polyurethane (TPU) is a relatively special category of elastomers with a wide range of hardness and performance. It consists of linear chains of rigid isocyanate segments and soft polyol segments. Owing to its excellent properties, TPU has been widely applied in industries such as footwear, pipes, films, rollers, and wires and cables. Compared with other elastomeric foamed materials, TPU foamed materials exhibit superior mechanical properties.29,30 However, their processing cost is relatively high. Therefore, to effectively expand market demand, targeted research on TPU foamed materials is indispensable.
Herein, this study systematically elucidates the advantages and mechanisms of MOMIM. By synergistically tuning key MOMIM parameters (mold-opening distance, holding pressure, holding time, mold-opening speed, and mold-opening delay time), we optimize TPU cell diameter and density, improve the surface quality and cell uniformity, and enhance macroscopic properties such as expansion ratio, compressive properties, and thermal insulation. TPU microcellular foams with excellent overall performance are thereby fabricated. The influence of different mold-opening parameter combinations on the evolution of cell structures (size, distribution, and morphology) and macroscopic properties is investigated, and the underlying control mechanisms of critical parameters are identified. The results provide useful theoretical guidance for process optimization of polymer foams and promote their practical application in lightweight structural parts and high-end packaging materials.
Experimental section
Materials
The experiment used BASF TPU (Elastollan®1180A) from Germany as the research material, with physical parameters shown in Table S1. BASF Elastollan®1180A was selected as the research material because it is a widely used commercial TPU with a balanced combination of elasticity, mechanical strength, and processability, which is representative for foam applications in packaging, automotive, and building materials. Its Shore A hardness of 80A is a typical value for elastomeric foams, making the research results more applicable to industrial production. During the experiment, the injection machine screw barrel temperature was controlled between 170°C and 210°C. Nitrogen gas (N2, 99.8%) from Fuzhou Huaxinda Industrial Gas Co., Ltd was used.
Sample preparation
The TPU pellets were dried in an oven at 60°C for 12 h to remove moisture. The dried TPU pellets were then poured into the injection molding machine hopper, and nitrogen gas was injected into the screw system using a MuCell Trexel T-200 foaming device, allowing it to mix thoroughly with the TPU melt. Under high pressure, nitrogen dissolved into the molten TPU, forming a stable homogeneous mixture. The TPU melt containing a small amount of gas was then injected into the mold cavity via the screw. In traditional MIM, no holding pressure was required, as the growth of the foam cells replaces the holding pressure. The bubbles expanded to fill the cavity, effectively adjusting the density and mechanical properties of the TPU material. In the MOMIM process, however, holding pressure was necessary. After filling, the process entered the holding pressure phase, during which the mold cavity remains at a small volume, allowing the bubbles to initially grow and form uniform nuclei within the constrained space. Subsequently, the moving mold moved outward, precisely increasing the cavity volume, providing more ample space for foaming. As the cavity volume increased, the bubbles within the molten TPU further expanded under the pressure gradient, enabling higher expansion ratios and lower densities, while ensuring cell uniformity. The restricted space during the pre-foaming stage promoted homogeneous distribution of cell nuclei and mitigated initial cell size variations. After cooling and solidification, the parts were demolded, yielding foams with optimized microcellular structures. The process flows of conventional MIM and MOMIM were illustrated in Figure 1(a). (a) Schematic process flows of conventional microcellular injection molding and mold-opening microcellular injection molding; (b) schematic of sampling locations for SEM observation; (c) left view of the mold structure; (d) main view of the mold structure; (e) cavity one-time mold-opening drawing; (f) cavity secondary demolding drawing; (g) top view of the cavity structure.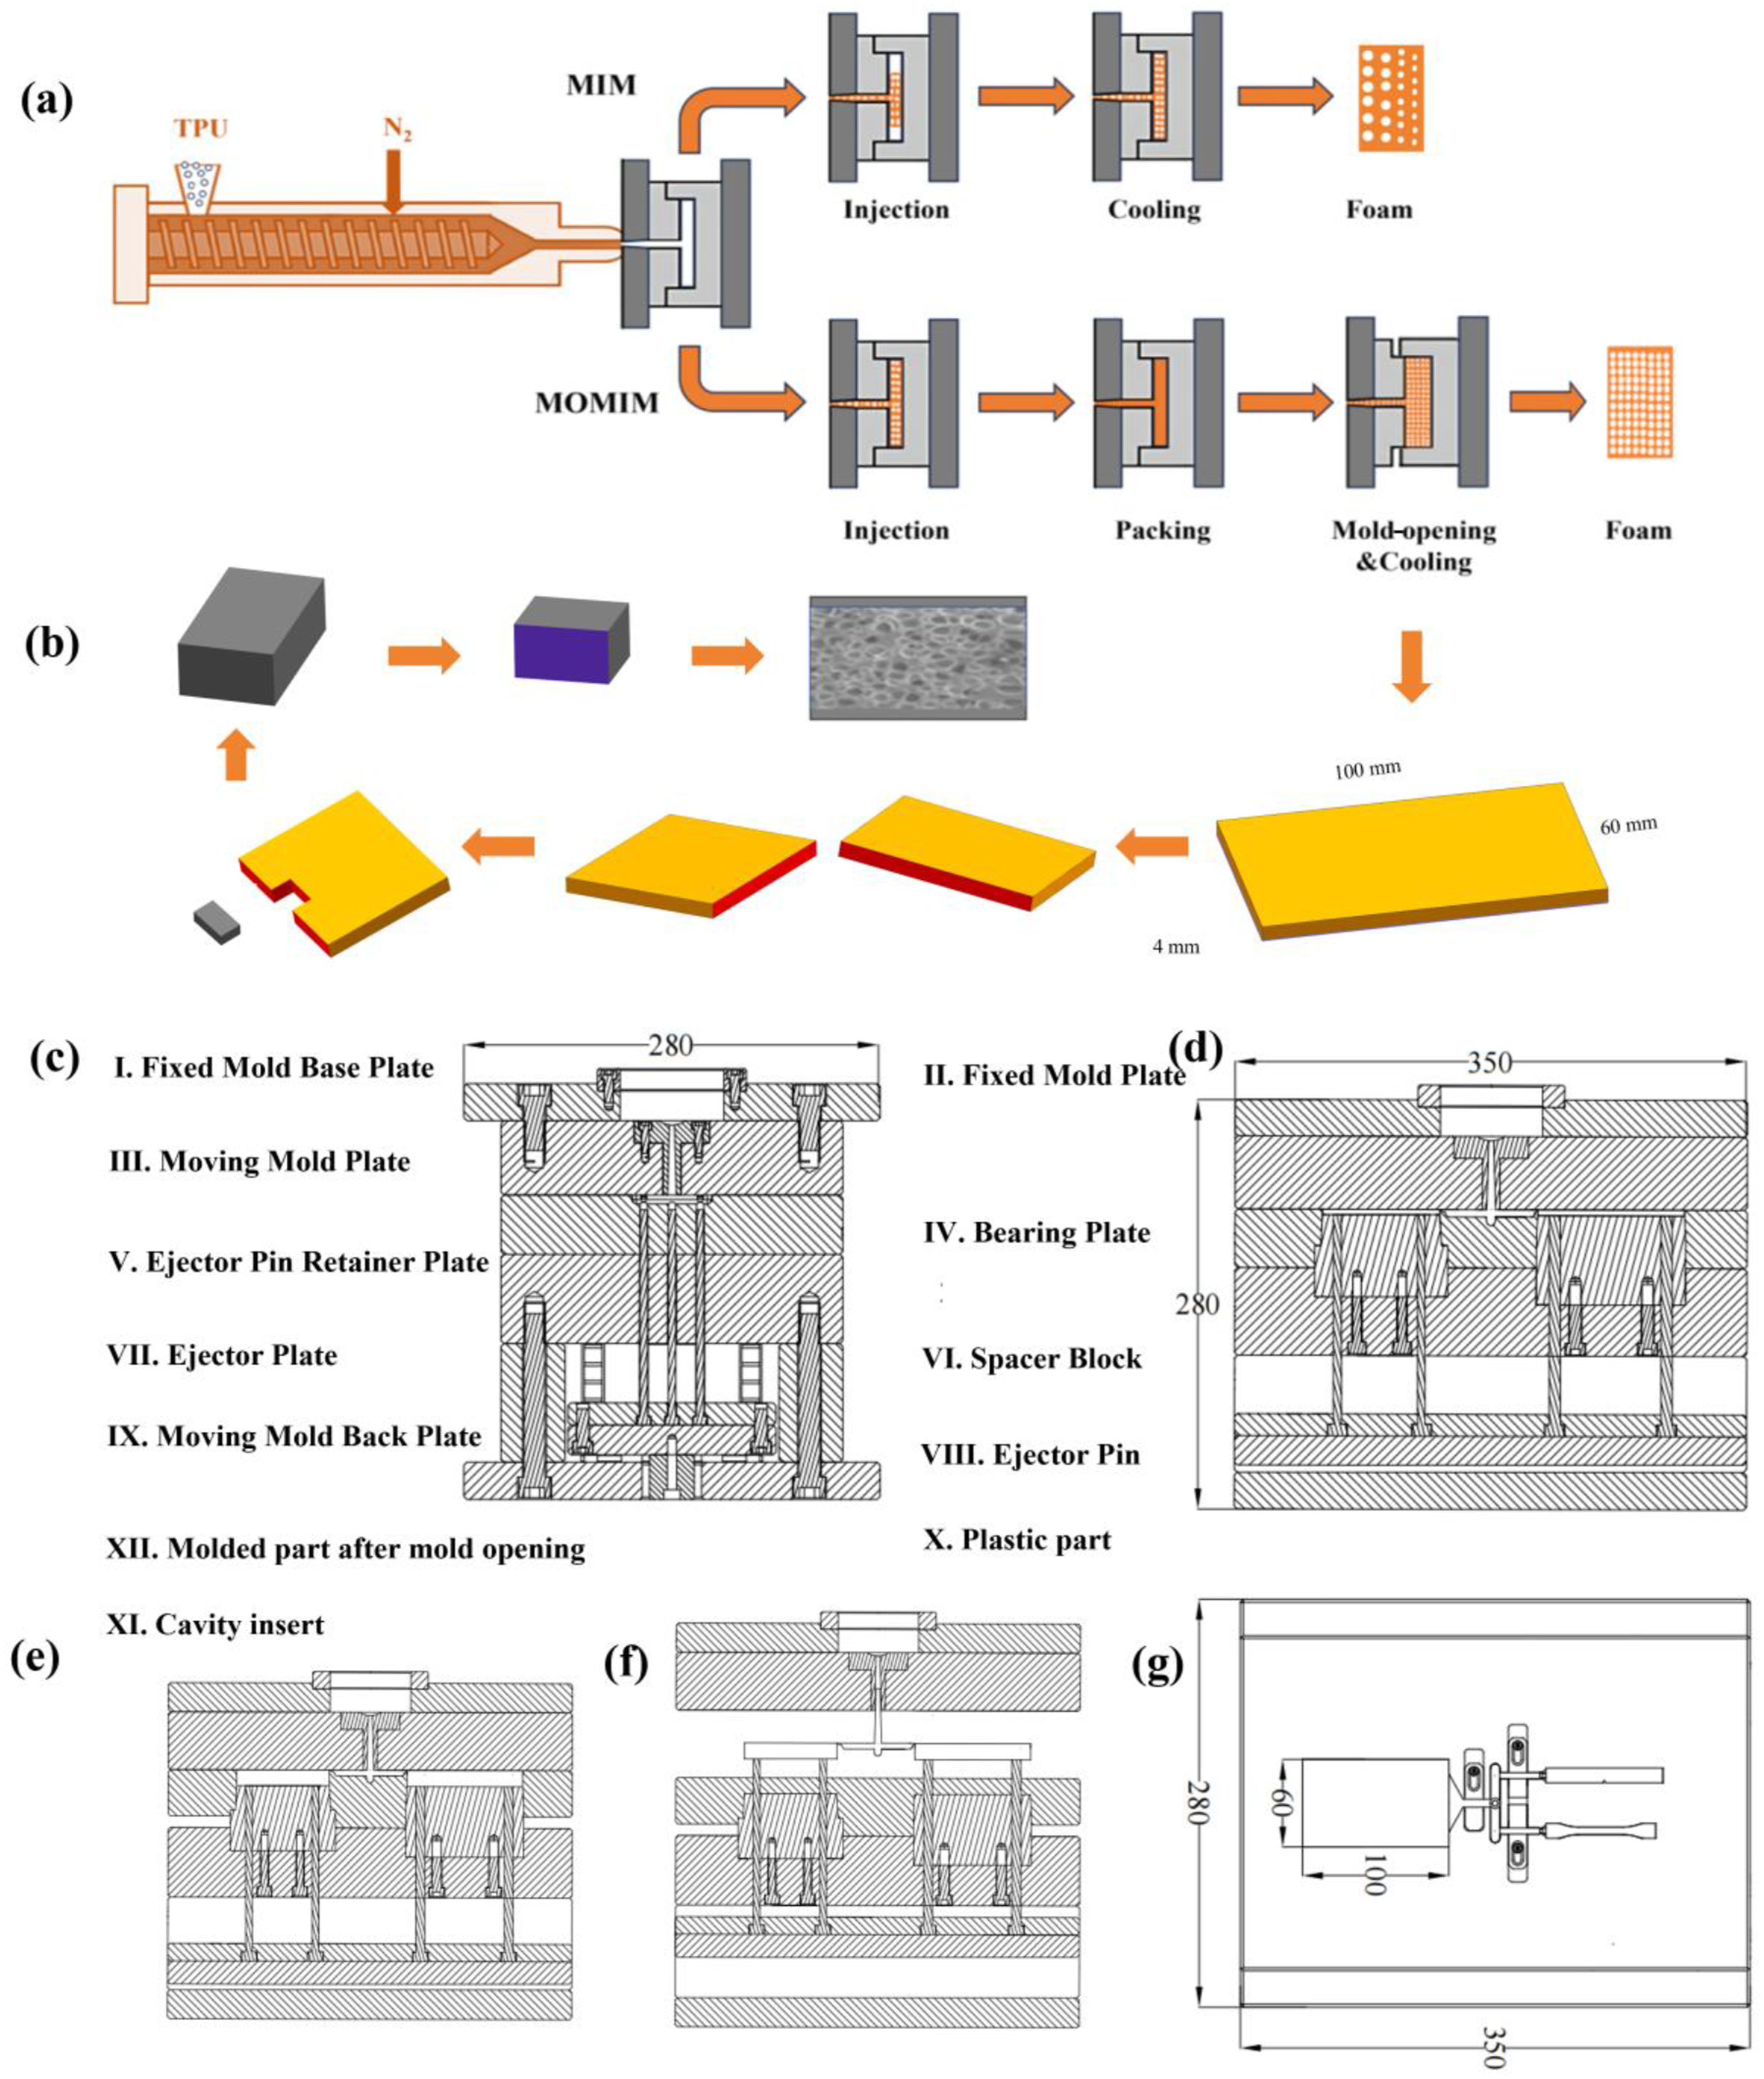
Figure 1(c) presented a self-designed MOMIM mold, whose core feature lay in its cavity expansion capability. This mold was mainly composed of a fixed mold plate, a moving mold plate, and a bearing plate disposed between the moving mold and the base plate. Equipped with a cavity insert, the bearing plate could move linearly relative to the moving mold along the mold-opening direction, laying a foundation for adjusting the cavity volume. The key components of the self-designed MOMIM mold (such as the cavity inserts and bearing plate) have a size tolerance of ±0.005 mm to ensure precise control of the cavity volume. By using sealing rings that can withstand a maximum tightening pressure of 50 MPa, melt leakage during mold-opening is effectively prevented. The mold temperature control system is precisely controlled using an external mold temperature machine to avoid temperature fluctuations that may affect the foaming effect. Additionally, the movable support plates enable linear motion, with a positioning accuracy of ±0.01 mm, ensuring consistent cavity expansion during each molding cycle. Unlike conventional two-stage mold-opening molds that focused on mold parting and demolding while neglecting dynamic cavity adaptation during foaming, this structure coupled mold-opening with cavity expansion, enabling active regulation of foaming conditions. Structurally, the “movable bearing plate” design allowed adjustable cavity volume without replacing the cavity insert, accurately adapting to different foaming ratio requirements. Meanwhile, it improved the versatility and modularity of the mold, simplifying daily maintenance and product changeover processes, and thus expanding the application scope. In contrast, conventional two-stage mold-opening molds required replacement of cavity inserts to adapt to different products or foaming parameters, which not only incurred high modification costs and long lead times but also suffered from poor versatility—drawbacks that were effectively overcome by the proposed mold structure. Compared with conventional molds, the proposed design eliminates the complex linkage core-pulling mechanism, reducing mold weight and machining cost. Additionally, added the bear plate and the cavity volume adjustment range of the proposed mold (1–10 mm) is wider than that of conventional molds (2–6 mm), significantly improving process versatility and production efficiency.
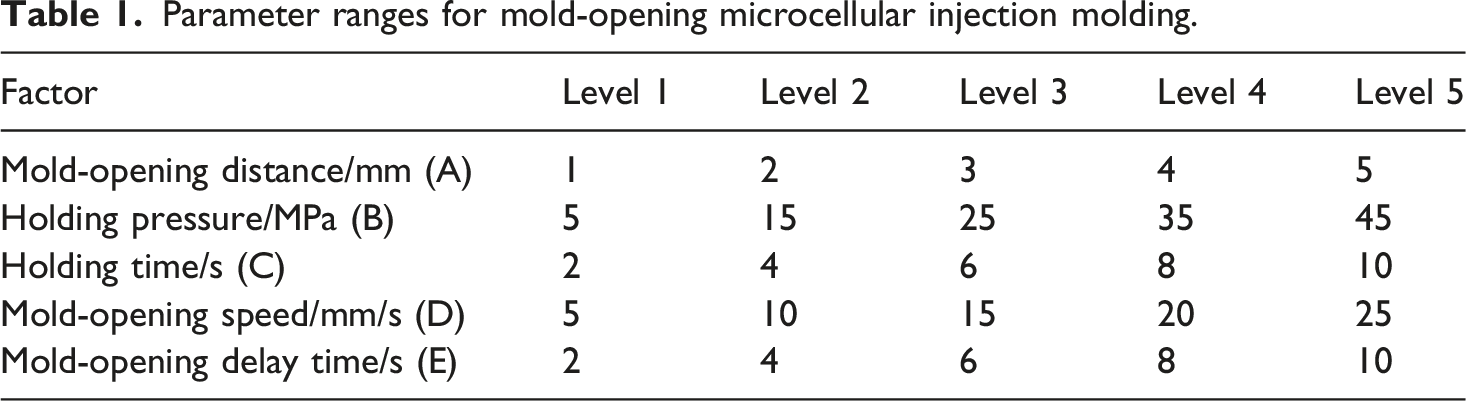
Parameter ranges for mold-opening microcellular injection molding.
Characterizations
Scanning Electron Microscopy (SEM) provides detailed analysis of the microstructure and was essential for observing the surface morphology, foam structure, and microscopic characteristics of the foamed samples. The section from the middle part of the sample was selected for testing (Figure 1(b)). First, the sample was treated with liquid nitrogen to make it brittle at low temperatures, followed by platinum sputter coating. The microstructure of the sample was then observed under the SEM at a specific magnification. ImageJ software was used to analyze the images, calculating the foam cell diameter and density. Cell density N was calculated using the equation (1):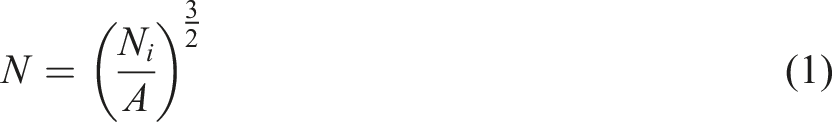
According to the ASTM D792 standard, the density of the samples was measured using the water displacement method. The density of MIM and MOMIM samples were measured separately. The expansion ratio Ø of the samples was calculated using the equation (2):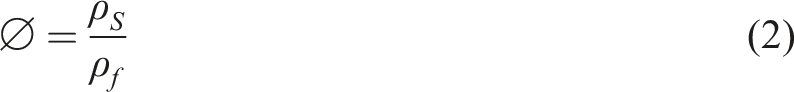
The compressive properties of the MIM and MOMIM products were characterized using a universal testing machine. For each sample, at least five separate tests were conducted, and the average value was taken as the final result. The samples were subjected to compression testing at a rate of 50 mm/min. The samples were cut to 2.0 × 2.0 cm2, and the maximum strain was set to 50%. Each sample underwent 50 compression cycles to evaluate the stability of its compressive performance. The compressive strength of the samples was measured by the compressive stress at 50% compressive strain (σ = 50%).
The thermal insulation performance of the products was characterized by thermal conductivity. A laser flash apparatus was used to measure the thermal conductivity. The samples were cut to 10 × 10 mm, ensuring the upper and lower surfaces were flat. The surface of the samples was sprayed with graphite to enhance heat absorption and infrared emission. The instrument emitted a short laser pulse to the lower surface of the sample, rapidly heating the sample’s surface layer. An infrared detector on the upper surface recorded the temperature change over time. The thermal conductivity values were obtained from through-plane measurements, which refers to heat transfer across the sample thickness. The thermal conductivity λ of the sample was calculated using the equation (3):
The porosity coefficient of variation (CV) is a key indicator for quantifying the uniformity of pore size distribution. It is defined as the ratio of the standard deviation of pore size to the average size, and is dimensionless. It can directly reflect the degree of dispersion of pore sizes. The CV of the sample was calculated using the equation (4):
Results and discussion
Cell structure and properties of conventional MIM foams
Figure 2(a)–(c) show the foam structure of conventional MIM. It can be seen that it is dominated by large foam cells, with a low cell density. The skin layer of the foam is relatively thick, while the core layer is comparatively thin. The average foam cell diameter is 66.4 μm, with a foam cell density of 6.9 × 10⁵ cells/cm3 (Figure 2(d)). The average wall thickness of the foam cells is 25.44 μm (Figure 2(e)), and the skin layer thickness is 0.518 mm. The compressive strength is 5.889 MPa, and the compressive modulus is 9.012 MPa (Figure 2(f)). As shown in Figure 2(g) and (h), the mechanical curve of the conventional MIM samples remains generally stable, but a noticeable hysteresis effect appears in the first five cycles. The thermal conductivity at room temperature is 0.161 W/(m·K) and increases to 0.184 W/(m·K) as the temperature rises to 75°C (Figure 2(i)). From this, it can be observed that conventional MIM tends to result in uneven cell size, non-uniform distribution, the formation of voids, and imbalanced thermal insulation and mechanical properties. Additionally, the foam expansion ratio is limited. (a) Digital photo of the cross section of foamed sample; (b) SEM micrograph of the cross-section of the foamed sample; (c) magnified micrograph of the core layer; (d) corresponding statistical graphs of cell size and cell density; (e) statistical graph of cell wall thickness; (f) statistical graphs of skin layer thickness, compressive strength, and compressive modulus; (g) compressive stress-strain curve; (h) hysteresis curve; (i) statistical graph of thermal conductivity.
Effect of mold-opening process parameters on TPU foaming behavior in MOMIM
Compared to traditional MIM processes, the main advantage of the MOMIM process is its ability to precisely control the foam expansion ratio of the product by adjusting the mold-opening distance (increasing cavity size and foaming space).
33
This allows the production of foams with better surface quality, higher expansion ratios, lighter weight, and more uniform cell structure. In this study, the MOMIM process is applied, and the first part of the study examines the impact of mold-opening distance on the foam structure by varying the mold-opening distance while keeping other MOMIM process parameters constant (holding pressure of 25 MPa, holding time of 6 s, mold-opening speed of 15 mm/s, and mold-opening delay time of 6 s) (Table 1). Figure 3 shows the foam morphology and cell size distribution of TPU foams at different mold-opening distances, which has a significant impact on the foam morphology, with regular changes in foam cell size, density, wall thickness, and skin layer thickness. Specifically, when the mold-opening distance is 1 mm and 2 mm, the foam structure is compact and the cell size is small. When the mold-opening distance is increased from 1 to 2 mm, the average foam cell diameter decreases from 48.7 to 44.2 μm, the foam cell density increases from 6.9 × 10⁶ to 9.0 × 10⁶ cells/cm3, and the foam wall thickness decreases from 13.09 to 9.15 μm. This indicates that an appropriate mold-opening distance helps to achieve uniform nucleation of the foam cells, resulting in a denser foam structure. When the mold-opening distance is further increased to 3 mm, the foam cell density reaches its peak at 1.0 × 10⁷ cells/cm3, the foam wall thickness decreases to 7.09 μm, but the foam cell diameter slightly increases to 51.9 μm. At this stage, foam nucleation and growth reach a relatively balanced state, and the overall structure remains relatively uniform. As the mold-opening distance continues to increase (from 3 to 5 mm), the foam cell diameter significantly increases, and the foam density rapidly decreases. The foam cell diameter reaches its maximum value of 82.9 μm, and the foam density drops to a minimum of 2.4 × 10⁶ cells/cm3. Additionally, the foam shape became noticeably stretched along the mold-opening direction, with foam cells taking on elongated or irregular oval shapes. This is primarily due to the rapid increase in mold cavity volume, which causes stress release to occur too quickly, leading to the rapid expansion of the gas and resulting in the fast growth of the foam cells. As a result, larger and less uniform foam cells are formed. (a-e) Correspond to Mold-opening distances of 1 mm, 2 mm, 3 mm, 4 mm, and 5 mm, respectively; (1-5) represent Digital photo of the cross section of foamed sample, SEM micrographs, magnified micrographs of the core layer, statistical graphs of cell size and cell density, and statistical graphs of cell wall thickness, respectively.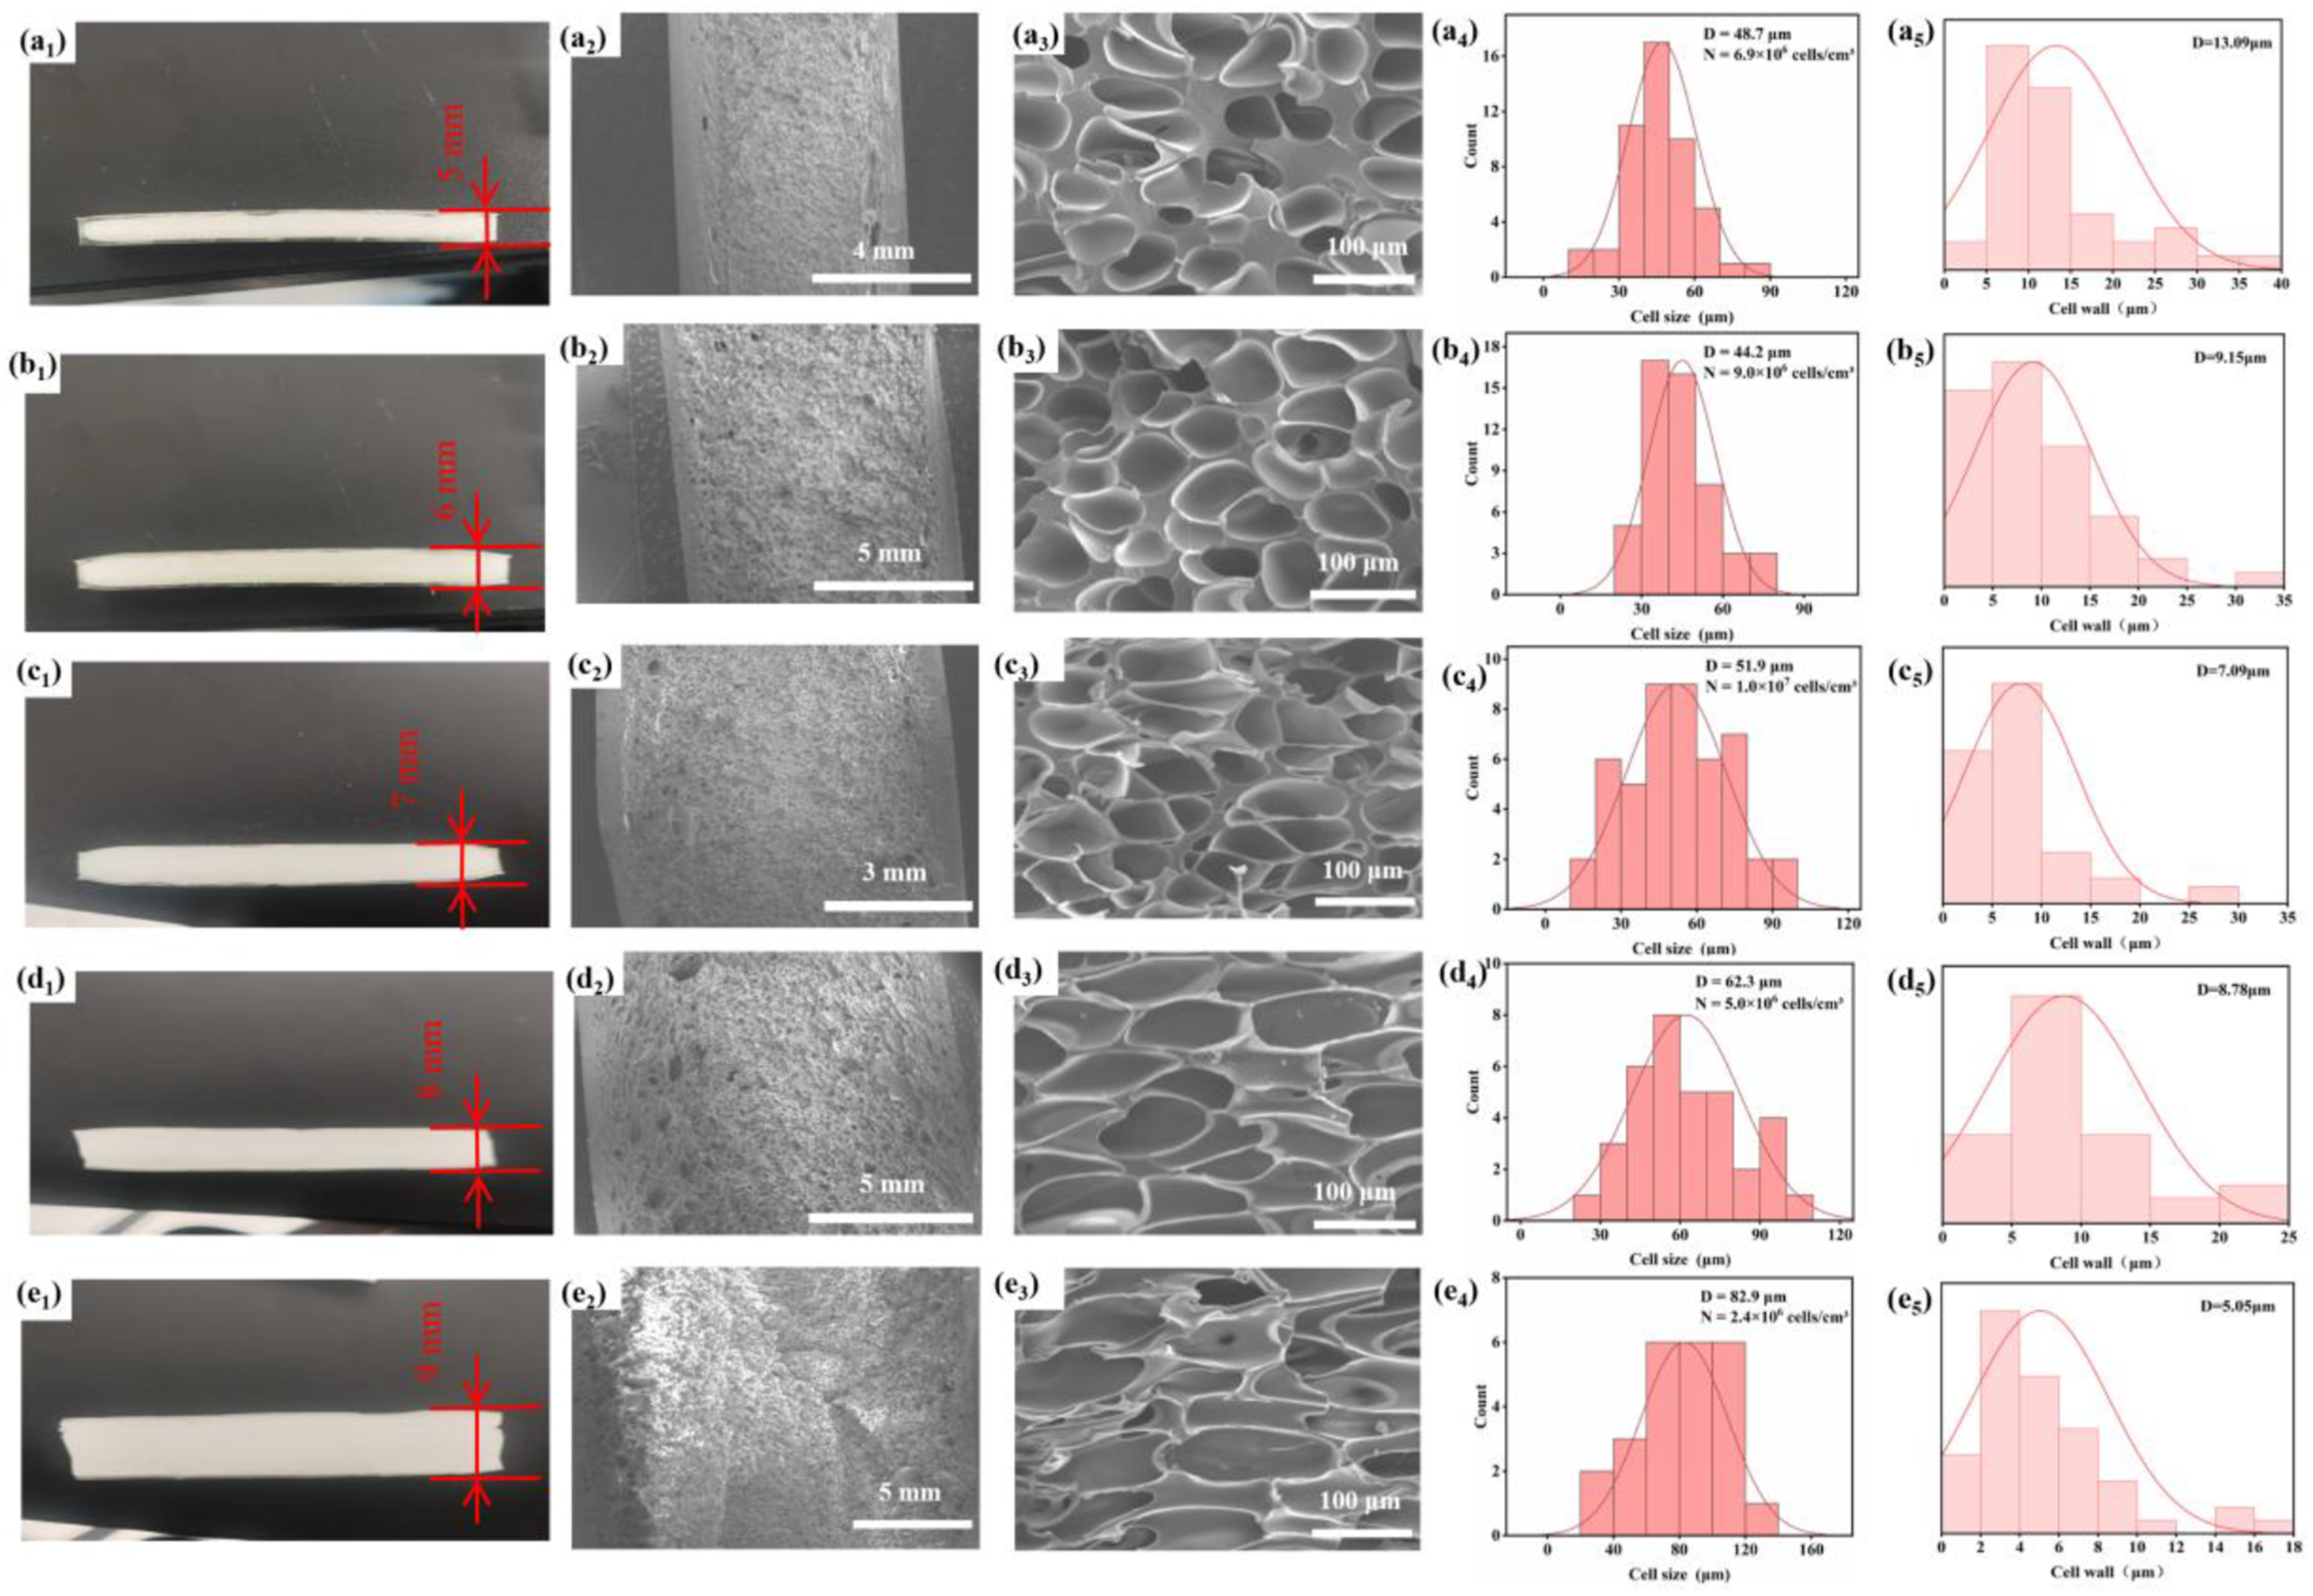
Figure S1 shows the foam morphology and distribution statistics at different mold-opening speed. The optimal cell structure is achieved at 20 mm/s. However, increasing speed to 25 mm/s reverses the trends: cell diameter and wall thickness increase, and cell density decreases. Excessively fast speed causes abrupt pressure decay, leading to gas expansion exceeding melt resistance, cell merging/rupture, and reduced uniformity. In conclusion, proper elevated mold-opening speed enhances nucleation, but excessive speed impairs foam quality.
Figure S3 shows the foam morphology and distribution statistics at different mold-opening delay time. It affects melt temperature, solidification degree and viscosity, thereby regulating foam behavior and product properties. When delay time increases from 2 to 10 s, pore diameter, wall thickness and density all show a trend of first increasing then decreasing. A short delay time (2 s) leads to larger pores with poor stability, while a moderate delay time (6–8 s) is beneficial for pore nucleation and stable expansion, forming a uniform and ordered pore structure due to unsolidified melt with low viscosity promoting gas diffusion.
Figure 4(a)–(f) depict the skin layer thickness, foam wall thickness, cell density, expansion ratio, and thermal conductivity of TPU foams prepared via the MOMIM process as a function of mold-opening distance. An increase in mold-opening distance from 1 to 5 mm induces a concomitant rise in skin layer thickness from 0.330 to 0.521 mm and expansion ratio from 1.681 to 2.655, alongside pronounced reductions in foam wall thickness from 13.09 to 5.05 μm and sample density from 0.660 to 0.418 g/cm3. An optimized mold-opening distance facilitates efficient cavity pressure release, which not only promotes foam cell nucleation and growth but also preserves cell structural stability while boosting expansion. At 25°C, thermal conductivity decreases sharply from 0.144 to 0.055 W/(m·K) with increasing mold-opening distance, indicative of enhanced thermal insulation performance. This behavior stems from the formation of more and larger air-filled cells in the expanded mold cavity; the low thermal conductivity of entrapped air effectively disrupts heat transfer pathways, thus improving insulation efficacy. To investigate the effect of mold-opening distance on the compressive performance of TPU foams, Figure 4(g)–(k) present the cyclic compression curves of MOMIM-processed TPU foams at the 1st, 5th, 10th, 20th, and 50th loading cycles. All foams exhibit robust recovery capability under cyclic compression. Statistical analysis of compressive modulus and strength (Figure 4(l)) reveals that compressive performance diminishes progressively with increasing mold-opening distance. Foams prepared at short mold-opening distances (1-3 mm) display superior compressive mechanical properties; the sample with a 3 mm mold-opening distance achieves a compressive strength of 3.09 MPa and a compressive modulus of 5.46 MPa, slightly lower than those of conventional foamed counterparts. In contrast, a further increase in mold-opening distance to 4-5 mm triggers a drastic decline in compressive performance, as excessive mold expansion compromises foam cell integrity, inducing cell overstretching, deformation, and even rupture. Statistical graph of (a) Mean cell density; (b) mean cell size; (c) cell wall thickness; (d) foamed skin layer thickness; (e) foaming ratio and density; (f) thermal conductivity at 25°C-75°C; Compressed stress-strain curves of 50 cyclic compression tests of foams with different mold-opening distances: (g) 1 mm (h) 2 mm (i) 3 mm (j) 4 mm (k) 5 mm; (l) statistical graphs of compressive strength and compressive modulus.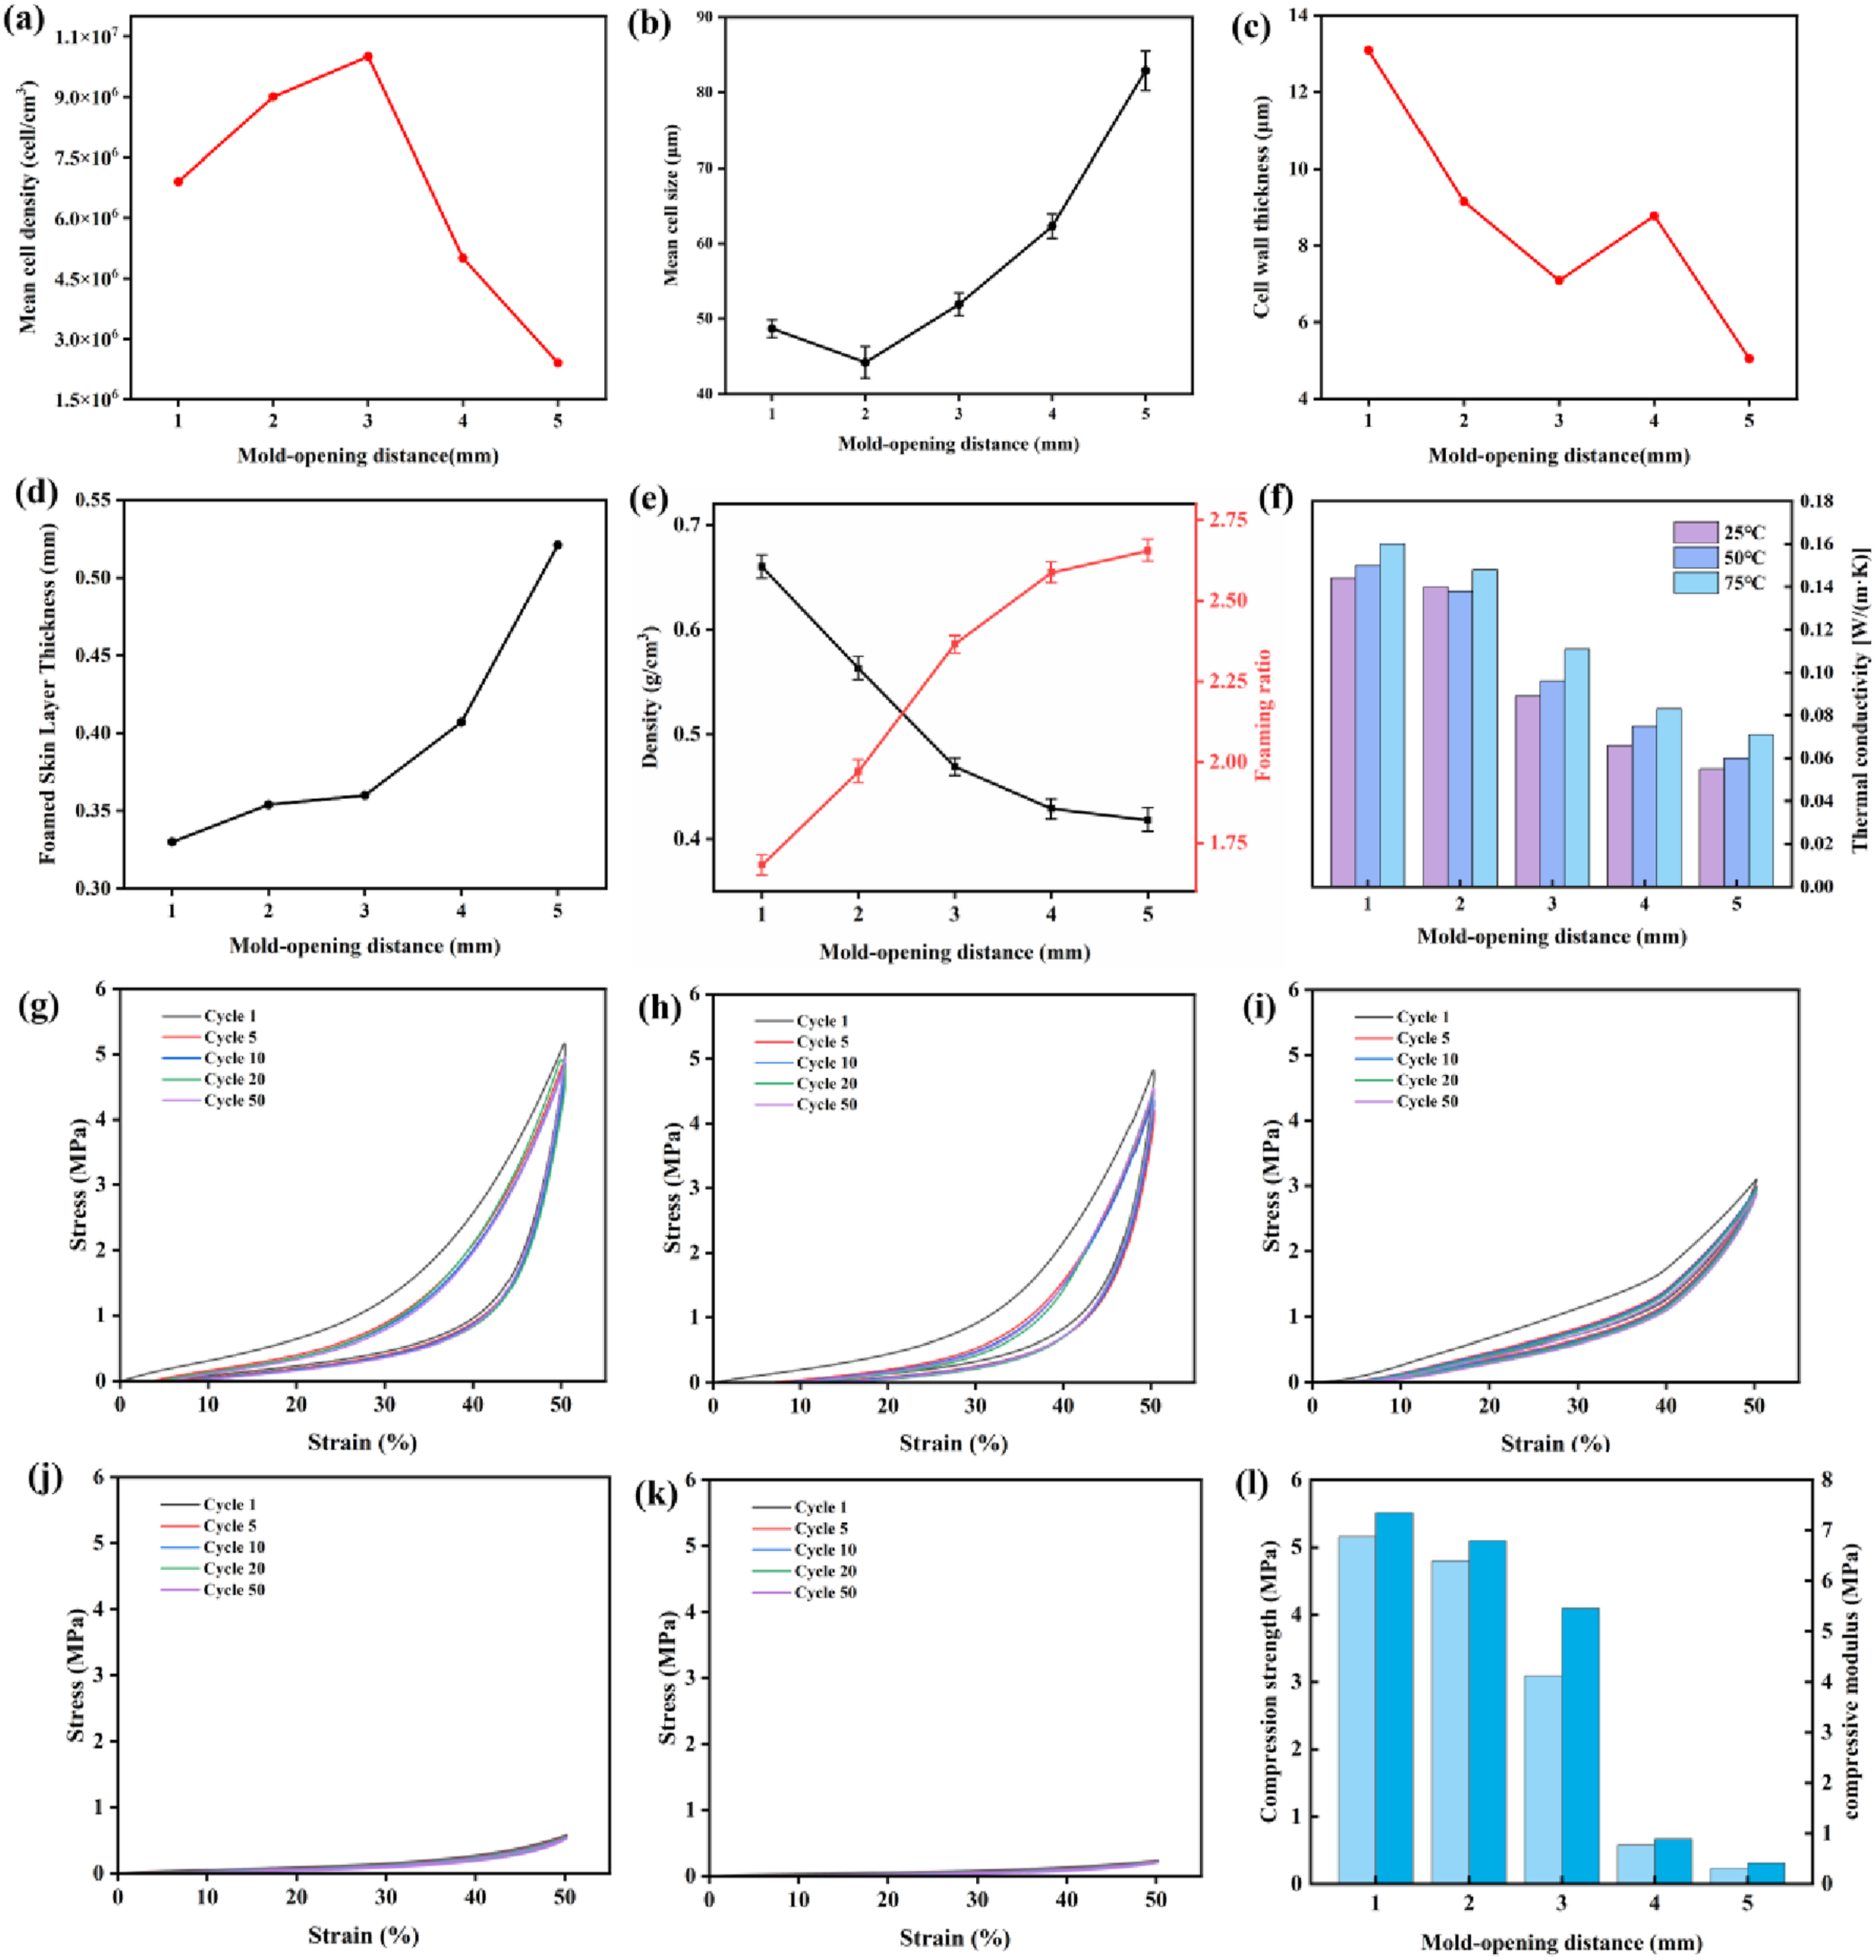
Figure S2 illustrates the effect of mold-opening speed on foam cell structure. When the mold-opening speed increases from 5 to 20 mm/s, the foam cell structure is gradually optimized, with 20 mm/s achieving the optimal performance—characterized by the highest cell density, best uniformity, and smallest cell size. However, when the speed is increased to 25 mm/s, the trends reverse: foam cell diameter and wall thickness increase, while cell density decreases. This phenomenon is primarily attributed to excessively fast mold-opening speed, which causes the cavity pressure to drop abruptly, leading to gas expansion that exceeds the viscous resistance of the melt and subsequent cell merging or rupture. Thus, a proper mold-opening speed enhances foam cell nucleation, while excessive speed degrades foam quality.
Figure S4 shows TPU foams’ properties varying with mold-opening delay time (2–10 s). Foam density first increases then decreases; expansion ratio and thermal conductivity show opposite trends, with minimum thermal conductivity (0.071 W/(m·K)) and maximum expansion ratio (2.517) at 8 s. At 6 s, foaming performance is optimized, with skin thickness 0.50 mm, pore wall thickness 6.06 μm, and density 0.517 g/cm3. Excessively long delay (10 s) worsens foaming. Figure S4(g–k) shows compressive performance peaks at 6 s (4.58 MPa strength, 6.95 MPa modulus), declining beyond that due to pore damage. Thus, the optimal mold-opening delay time is 6–8 s.
Therefore, an appropriate mold-opening distance is conducive to optimizing the foam structure and enhancing the uniformity of foam cells. However, an excessively large mold-opening distance may compromise the stability and size uniformity of foam cells, leading to the formation of unstable large cells, which in turn impairs the comprehensive performance of the final product. The optimal mold-opening distance is determined to be 3 mm; under this condition, the average foam cell diameter is 51.9 μm, representing a 21.8% reduction compared to that of conventional foaming. The foam cell density is 1.0 × 10⁷ cells/cm3, which is 13.49 times higher than that of conventional MIM. The average foam wall thickness is 7.09 μm, showing a 72.13% decrease compared to conventional MIM. The skin layer thickness is 0.360 mm, a reduction of 30.50% relative to conventional MIM. Additionally, the compressive strength and compressive modulus are 3.09 MPa and 5.46 MPa, respectively, corresponding to decreases of 47.52% and 39.41%. The thermal conductivity at room temperature is 0.089 W/(m·K), indicating a 44.72% improvement in thermal insulation performance. Consequently, a mold-opening distance of 3 mm is selected as a fixed parameter in subsequent experiments to further investigate the effects of other MOMIM process parameters on foam structure and performance. 34
Effect of holding pressure and time on TPU foaming behavior in MOMIM
Holding pressure plays a key role in controlling the melt density, adjusting foam cell size, and regulating cell distribution during the MOMIM process. Holding pressure can suppress the early nucleation of bubbles, reduce the risk of bubble coalescence and collapse, and promote a more uniform distribution of foam cells. In this study, the holding pressure is varied while keeping the other MOMIM process parameters constant (mold-opening distance of 3 mm, holding time of 6 s, mold-opening speed of 15 mm/s, and mold-opening delay time of 6 s) (Table 1). Figure 5 shows the foam morphology and distribution statistics at different holding pressures. As the holding pressure increases, significant changes in the foam structure, size, and density are observed. At low holding pressures, insufficient cavity pressure leads to rapid expansion of the gas, causing excessive foam cell growth and resulting in a foam structure with a cell diameter of 91.6 μm, wall thickness of 12.88 μm, and a foam cell density of 1.0 × 10⁶ cells/cm3. This results in fewer, less uniform foam cells. As the holding pressure increases to 35 MPa, the average foam cell diameter continuously decreases from 56.1 μm to a minimum value of 39.8 μm, the foam wall thickness decreases from 10.37 to 8.01 μm, and the foam cell density increases from 5.1 × 10⁶ cells/cm3 to a peak of 1.4 × 10⁷ cells/cm3. This indicates that an appropriate holding pressure helps suppress the rapid expansion of gas and prevent bubble coalescence, promoting the refinement of foam cells and increasing nucleation density, leading to a more uniform and dense microcellular structure. Further increasing the holding pressure to 45 MPa results in a slight increase in foam cell diameter to 62.3 μm, a reduction in wall thickness to 4.93 μm, and a decrease in foam cell density to 5.0 × 10⁶ cells/cm3. High pressure suppresses the release and nucleation of gas, leading to a reduction in the number of foam cells and incomplete growth. Some of the gas is forced back into the matrix during the holding pressure phase, creating sparse large pores that affect the uniformity of the foam structure and product quality. Therefore, an appropriate holding pressure not only helps eliminate the initial foam cells formed during the first filling of the mold but also encourages the polymer and supercritical fluid to reform a homogeneous system, resulting in high foam cell density and a uniform foam structure. (a–e) Correspond to packing pressures of 5 MPa, 15 MPa, 25 MPa, 35 MPa, and 45 MPa, respectively; (1–5) represent Digital photo of the cross section of foamed sample, SEM micrographs, magnified micrographs of the core layer, statistical graphs of cell size and cell density, and statistical graphs of cell wall thickness, respectively.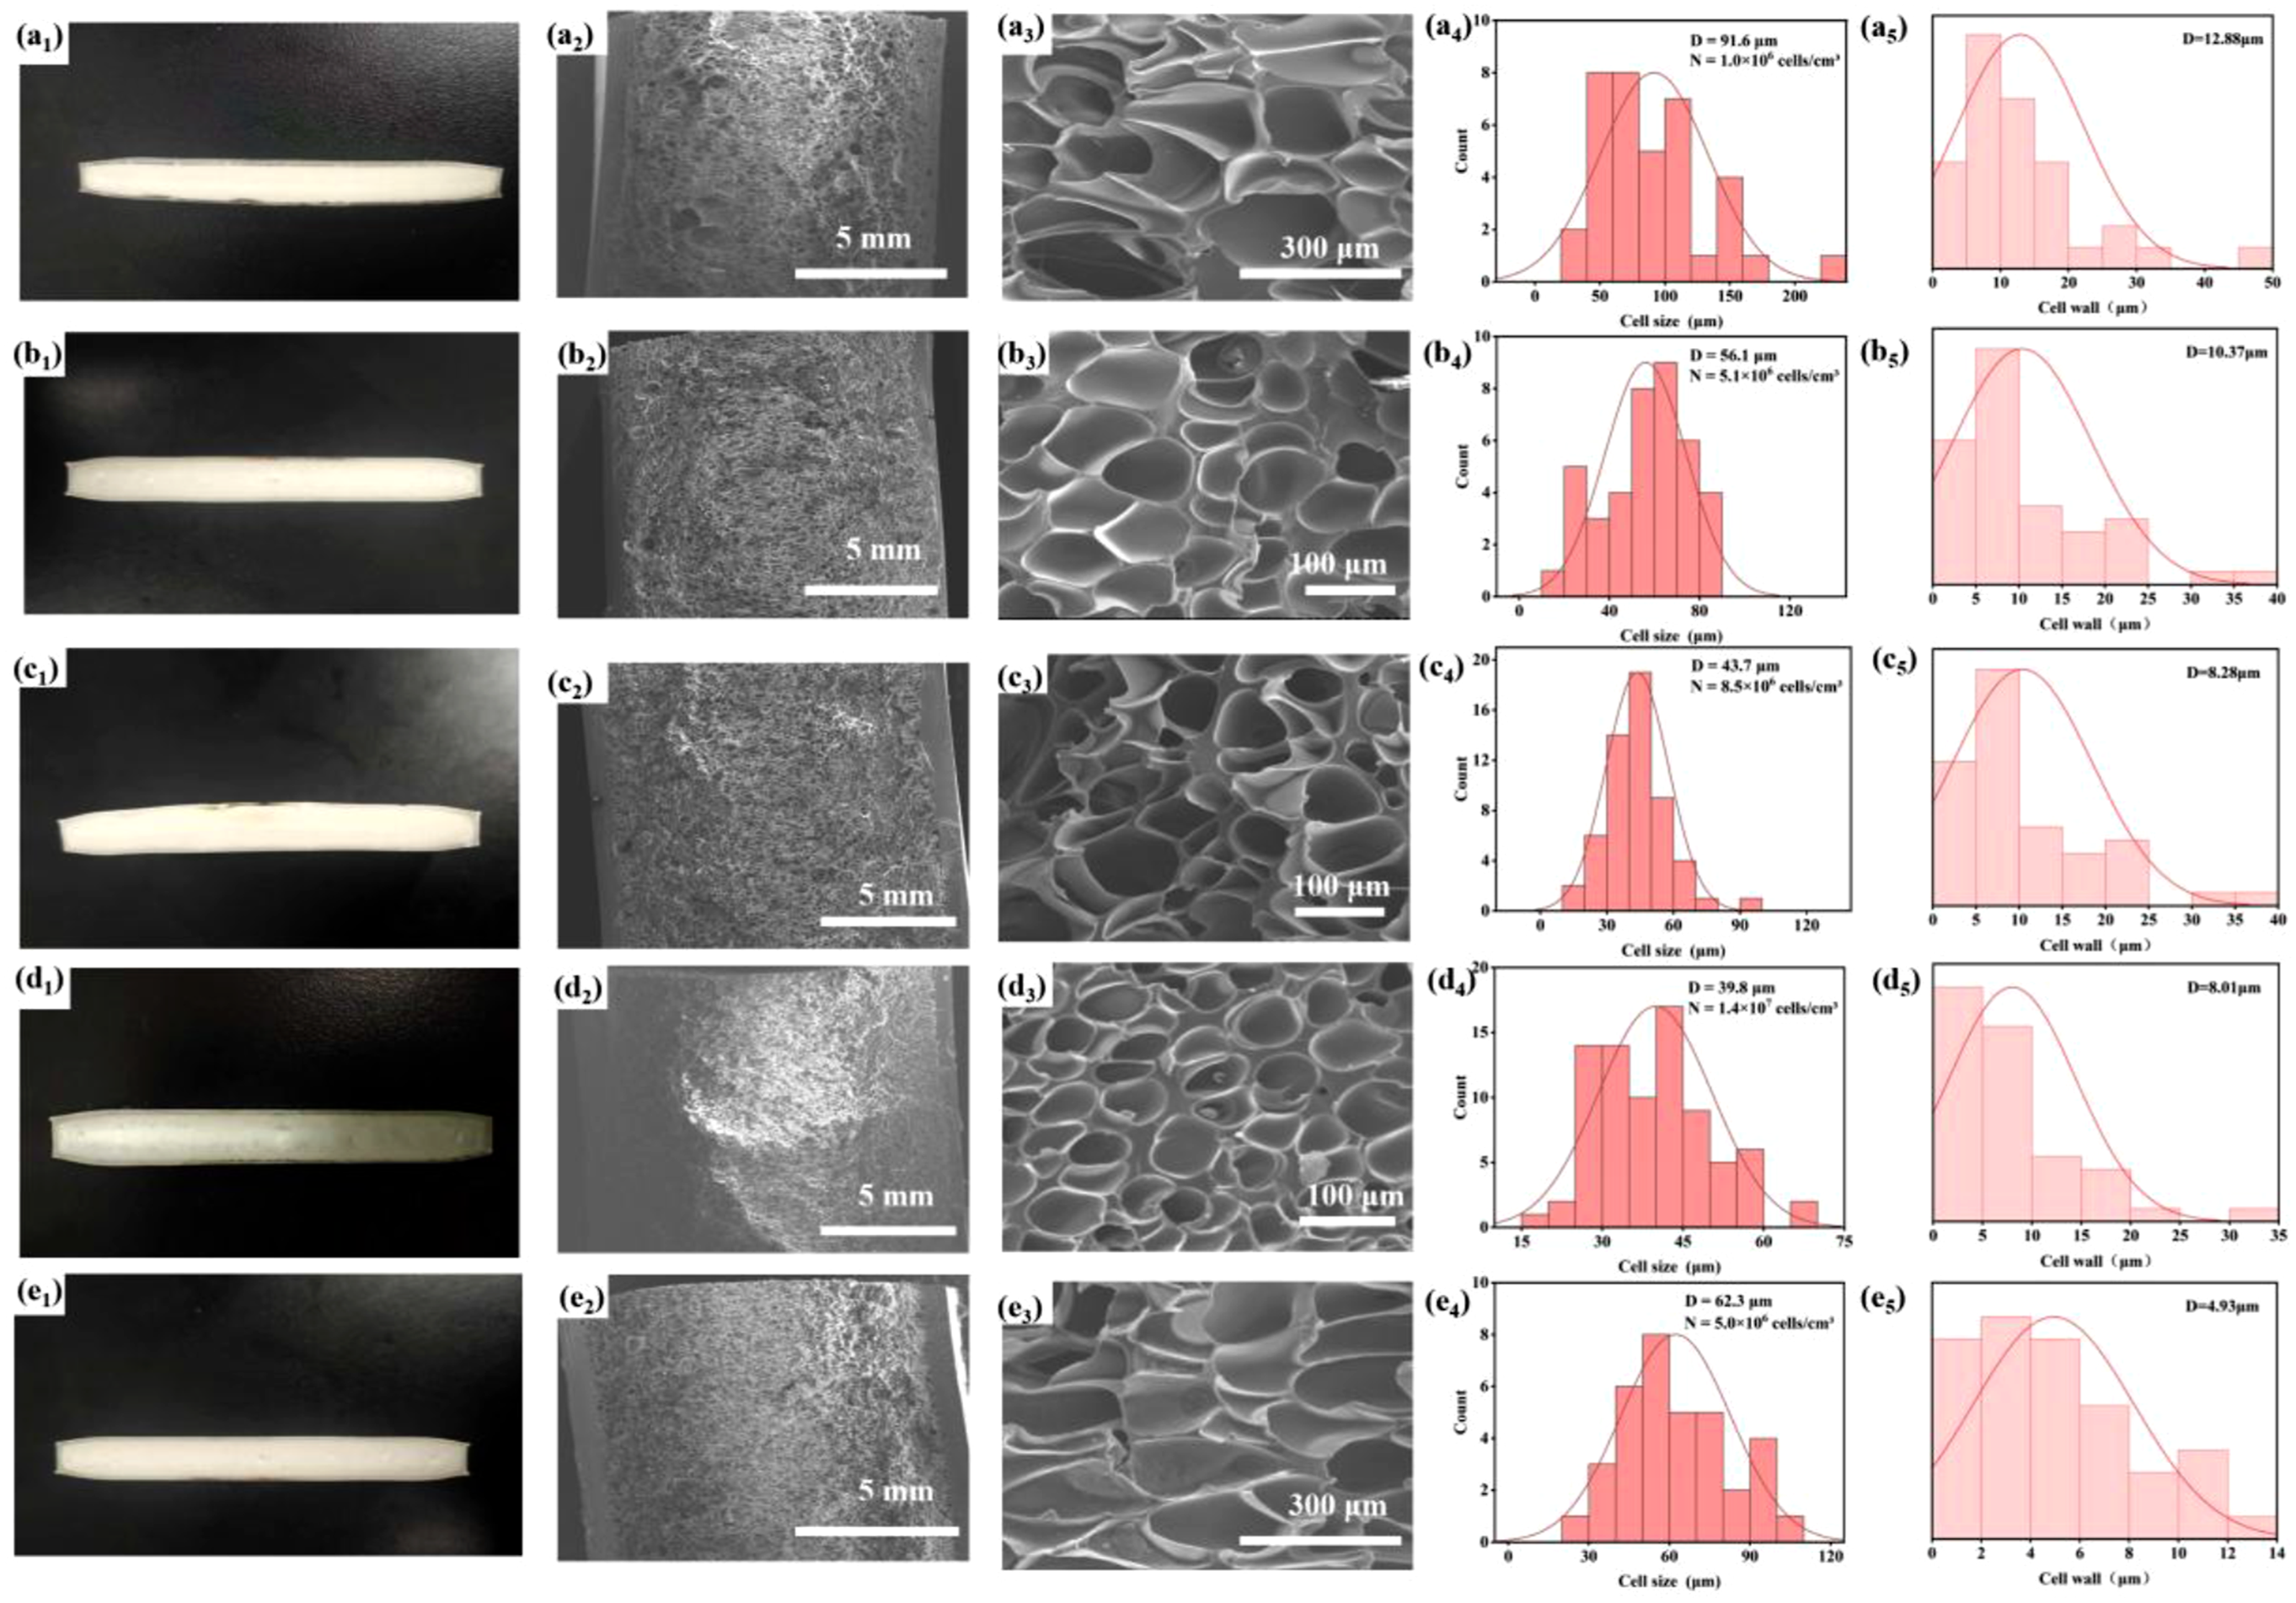
Figure S5 shows the foam morphology and distribution statistics at different holding time, extended holding time can lead to a significant drop in melt temperature, decreasing molecular chain mobility and increasing the energy barrier required for nucleation, which is not favorable for the formation of new foam cells. Therefore, holding times between 6 and 8 s are optimal.
The trends in the changes of skin layer thickness, foam wall thickness, foam cell density, expansion ratio, and thermal conductivity at different holding pressures are shown in Figure 6(a)-(f). As the holding pressure increases from 5 to 35 MPa, the skin layer thickness increases from 0.321 to 0.400 mm, the foam wall thickness decreases from 12.88 to 8.01 μm, and the density gradually decreases from 0.470 to 0.422 g/cm3. The corresponding expansion ratio increases from 2.361 to 2.630, significantly enhancing the foaming effect. This indicates that within the medium-low pressure range, a moderate increase in holding pressure benefits the more uniform distribution and nucleation of gas in the melt, effectively suppressing the formation of large foam cells during injection, and improving the foaming effect. However, when the holding pressure is further increased to 45 MPa, excessive holding pressure inhibits the expansion and growth of foam cells, causing them to collapse or close, which reduces the foaming ability. The skin layer thickness reaches 0.410 mm, the foam wall thickness is 4.93 μm, the density slightly increases to 0.432 g/cm3, and the expansion ratio decreases to 2.569. At room temperature (25°C), as the holding pressure increases from 5 to 35 MPa, the thermal conductivity decreases from 0.121 to 0.068 W/(m·K), and the insulation performance improves with increasing holding pressure. However, when the holding pressure increases from 35 to 45 MPa, the thermal conductivity increases from 0.068 to 0.072 W/(m·K), and the insulation effect worsens. Figure 6(g)–(k) show the mechanical response curves of the TPU foamed samples during 50 cycles of compression at different holding pressures. As the holding pressure increases, the compression performance of the samples first increases and then decreases. At a holding pressure of 25 MPa, the compressive strength and compressive modulus reach 4.59 MPa and 8.09 MPa, respectively, which represent the best compression performance. When the holding pressure exceeds 25 MPa, the compression performance begins to decline. The optimal holding pressure range is between 15 MPa and 35 MPa, as in the lower pressure range, the holding pressure suppresses excessive expansion of the foam cells, forming fine, dense foam cells with high closed-cell content and uniform size. This structure allows the pressure to be evenly distributed across each foam cell wall, avoiding local stress concentration and enhancing resistance to compressive deformation.
35
Statistical graph of (a) Mean cell density; (b) mean cell size; (c) cell wall thickness; (d) foamed skin layer thickness; (e) foaming ratio and density; (f) thermal conductivity at 25°C–75°C; Compressed stress-strain curves of 50 cyclic compression tests of foams with different packing pressures: (g) 5 MPa (h) 15 MPa (i) 25 MPa (j) 35 MPa (k) 45 MPa; (l) statistical graphs of compressive strength and compressive modulus.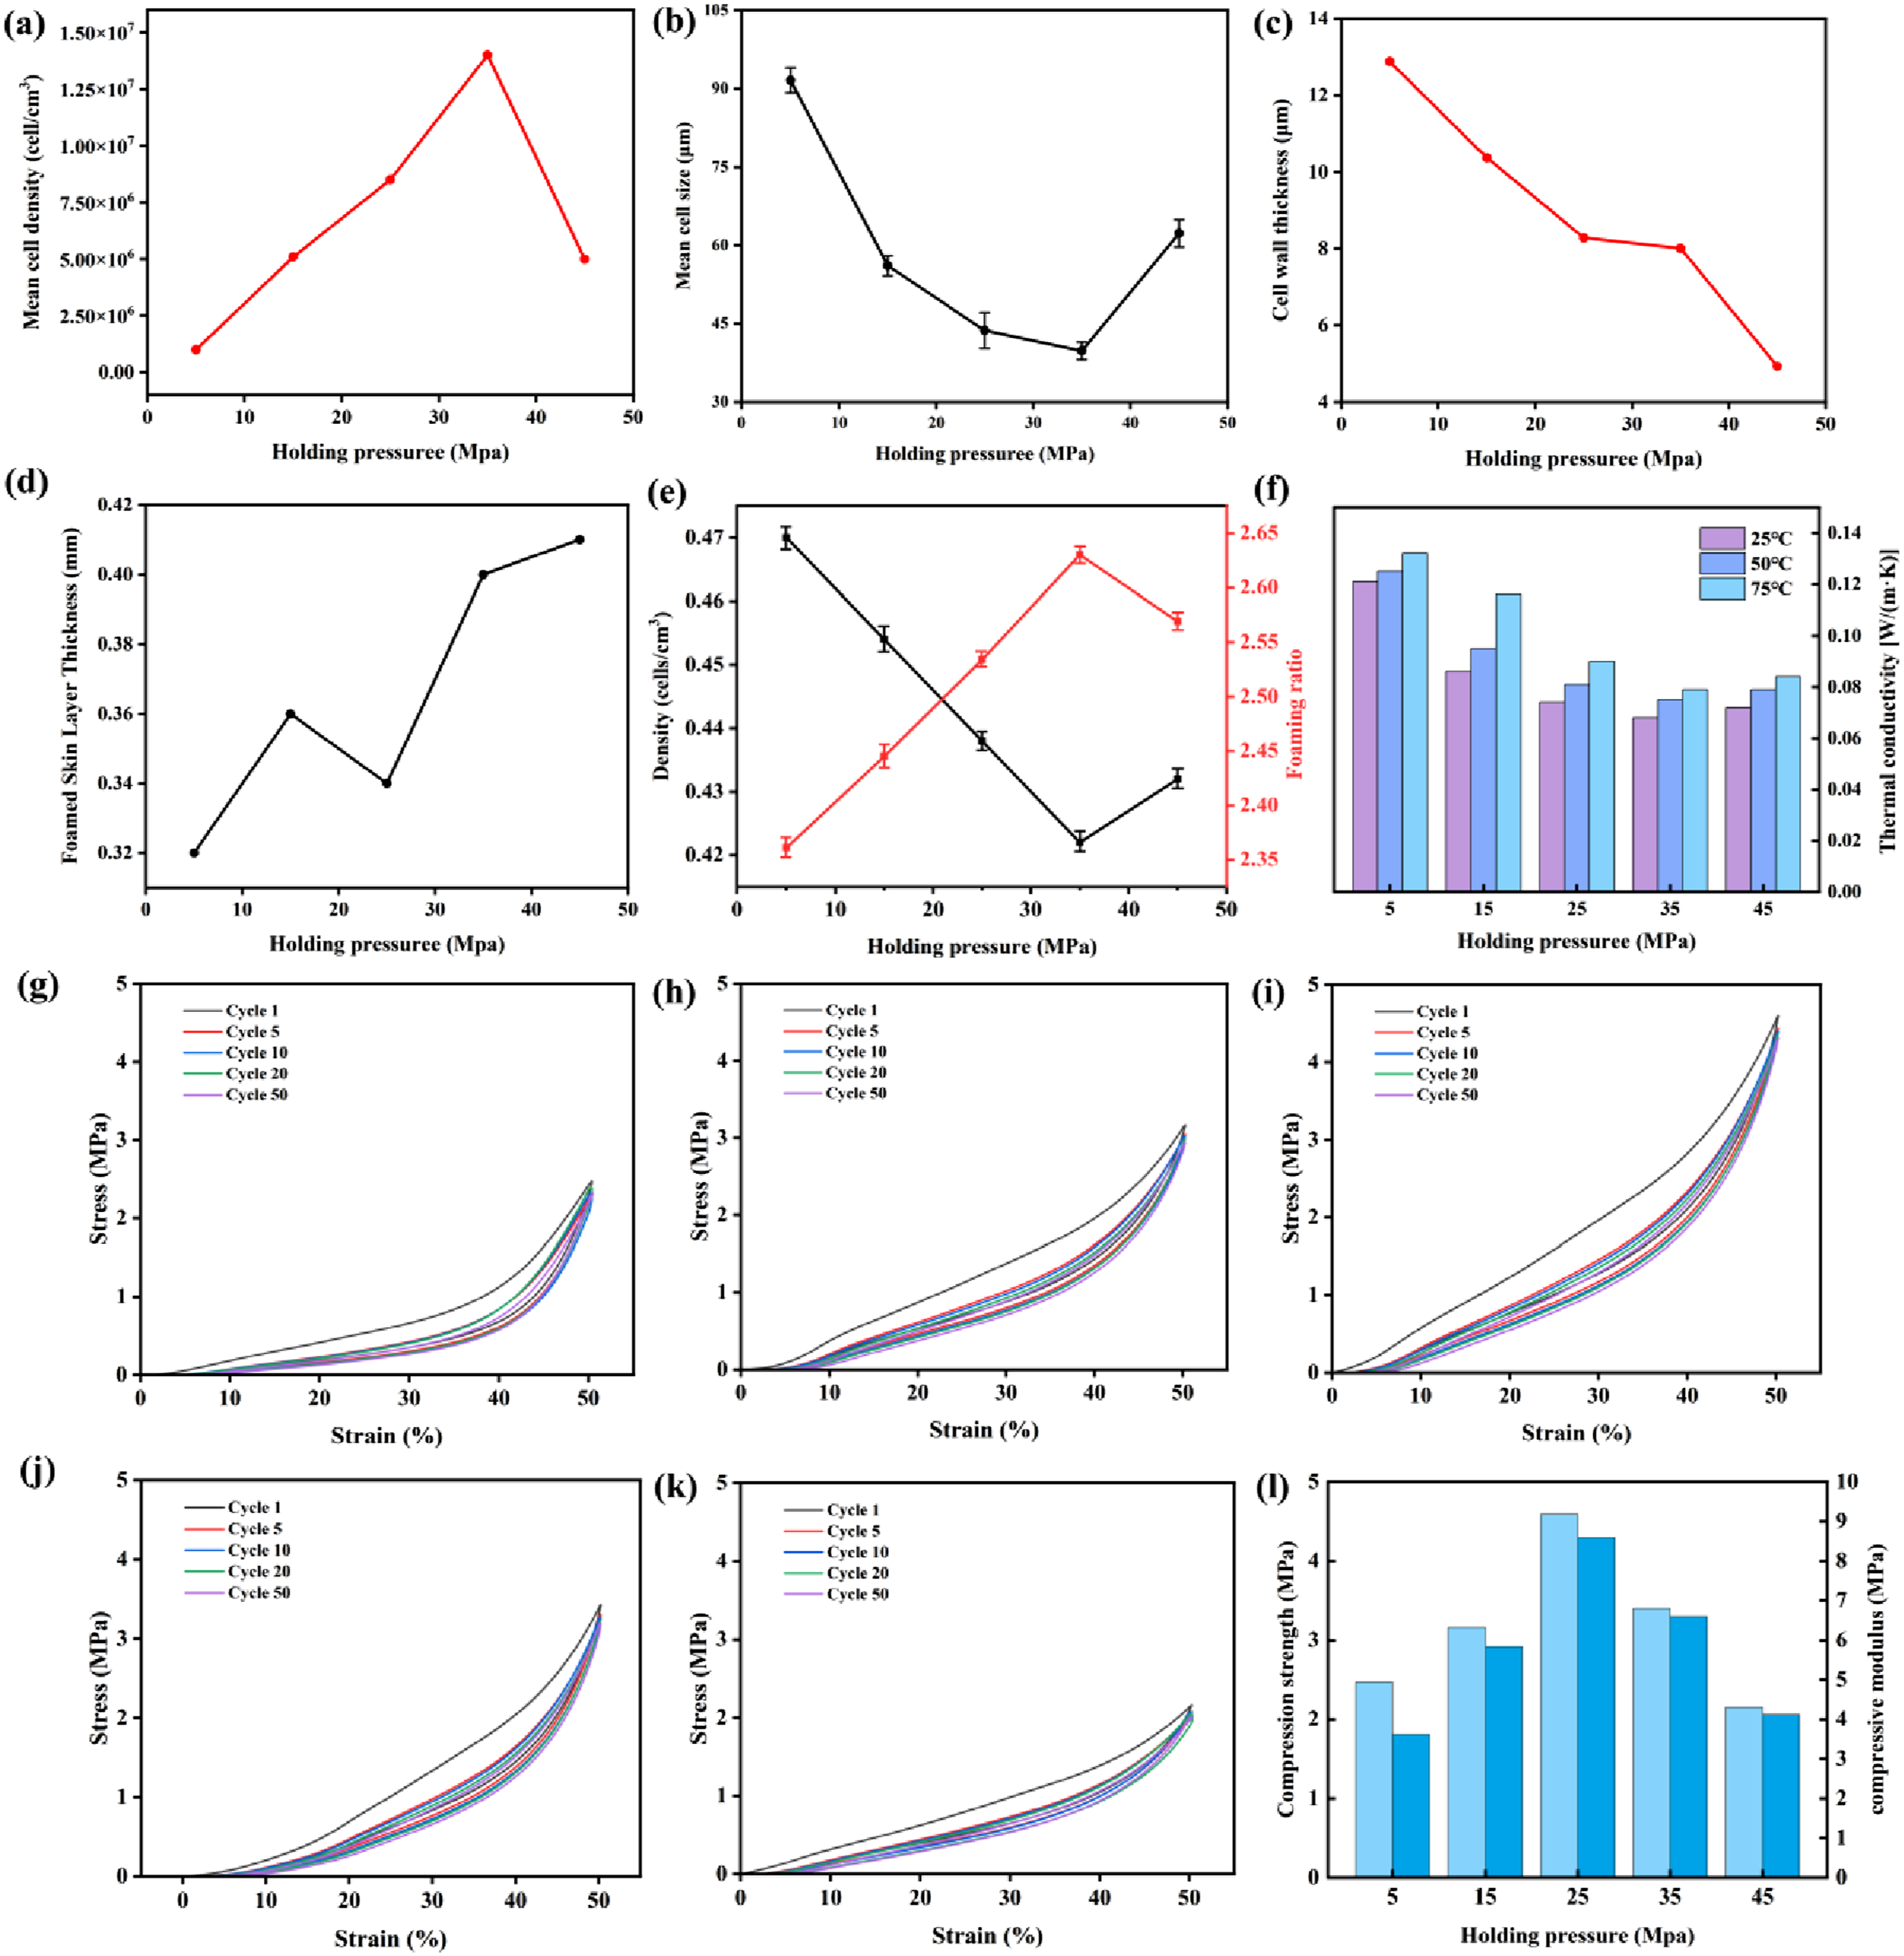
Figure S6 shows sufficient holding time enables slow, uniform cooling and solidification of cell walls into a fine, stable structure. Insufficient holding time, by contrast, triggers bubble over-expansion and coalescence during pressure relief, thereby compromising compressive performance. The optimal holding time is 6–8 s, as sufficient holding ensures stable cell structure, while insufficient time causes bubble coalescence.
In summary, an appropriate holding pressure is conducive to ensuring full melt filling of foam cell walls, reducing surface defects and voids, and increasing the density of the base material. However, when the pressure exceeds the critical value, excessive compression may cause partial foam cell collapse or rupture, and even lead to the formation of interconnected pores. Therefore, the optimal holding pressure is determined to be 35 MPa; under this condition, the average foam cell diameter is 39.8 μm, representing a 40.06% reduction compared to that of conventional foaming. The foam cell density is 1.4 × 10⁷ cells/cm3, which is 19.28 times higher than that of conventional foaming. The average foam wall thickness is 8.01 μm, showing a 68.55% decrease compared to conventional foaming. The skin layer thickness is 0.400 mm, a reduction of 22.77% relative to conventional foaming. The compressive strength and compressive modulus are 4.59 MPa and 8.59 MPa, respectively, corresponding to decreases of 22.05% and 4.68%. The thermal conductivity at room temperature is 0.074 W/(m·K), indicating a 54.03% improvement in thermal insulation performance. Consequently, a holding pressure of 35 MPa is selected as a fixed parameter in subsequent experiments to further investigate the effects of other MOMIM process parameters on foam structure and performance.
Comparison of TPU cell structure and properties under optimal parameters in MOMIM
Figure 7 compares the foam skin thickness, cell density, cell diameter, cell wall thickness, compressive strength, compressive modulus, foam density, foam expansion ratio, and thermal conductivity of TPU foams prepared under the respective optimal levels of each factor. The results clearly indicate that the cell structure and properties of TPU foams are jointly regulated by the five MOMIM process parameters, with each factor exerting distinct contributions. Specifically, holding time exhibits the most significant influence on foam skin thickness (Figure 7(a)); mold-opening delay time has the strongest effect on cell density (Figure 7(b)) and cell wall thickness (Figure 7(d)); holding time exerts the greatest impact on the average cell diameter (Figure 7(c)); mold-opening speed shows the largest influence on compressive modulus (Figure 7(e)); and mold-opening distance exerts the most pronounced effect on compressive strength (Figure 7(f)), foam density (Figure 7(g)), and expansion ratio (Figure 7(h)). Additionally, mold-opening delay time has the most notable impact on thermal conductivity (Figure 7(i)). By comparing the nine performance indicators of TPU foams, the dominant factors corresponding to each process parameter can be identified. Overall, mold-opening distance directly controls the extent of pore expansion and distribution by altering the foam molding space, which in turn affects core performance indicators such as density and mechanical properties. Compared with the dispersed effects of other parameters, mold-opening distance plays a dominant role, making it the key process parameter for regulating TPU foam performance.
36
To obtain TPU foams with minimum foam skin thickness, maximum cell density, minimum cell diameter, minimum cell wall thickness, maximum compressive strength, maximum compressive modulus, minimum foam density, maximum foam expansion ratio, and minimum thermal conductivity, the optimal combination of MOMIM process parameters is mold-opening distance 3 mm, holding pressure 35 MPa, holding time 6 s, mold-opening speed 20 mm/s, and mold-opening delay time 8 s. Comparison of optimal process parameters and MIM parameters under five different factors: (a) Foamed skin layer thickness; (b) mean cell density; (c) mean cell size; (d) cell wall thickness; (e) compressive strength; (f) compressive modulus; (g) sample foam density; (h) foaming ratio; (i) thermal conductivity. (Note: The X-axis labels is expressed as “MIM” group representing the conventional micro-foaming process parameter combination, while other parameters represent the secondary mold-opening process parameter combination. A = mold-opening distance, B = holding pressure, C = holding time, D = mold-opening speed, E = mold-opening delay time. The numbers represent Level, as shown in Table 1. For example, A3B4C2D3E3 represents a mold-opening distance of 3 mm, a holding pressure of 35 MPa, a holding time of 6 s, a mold-opening speed of 15 mm/s, and a mold-opening delay time of 6 s).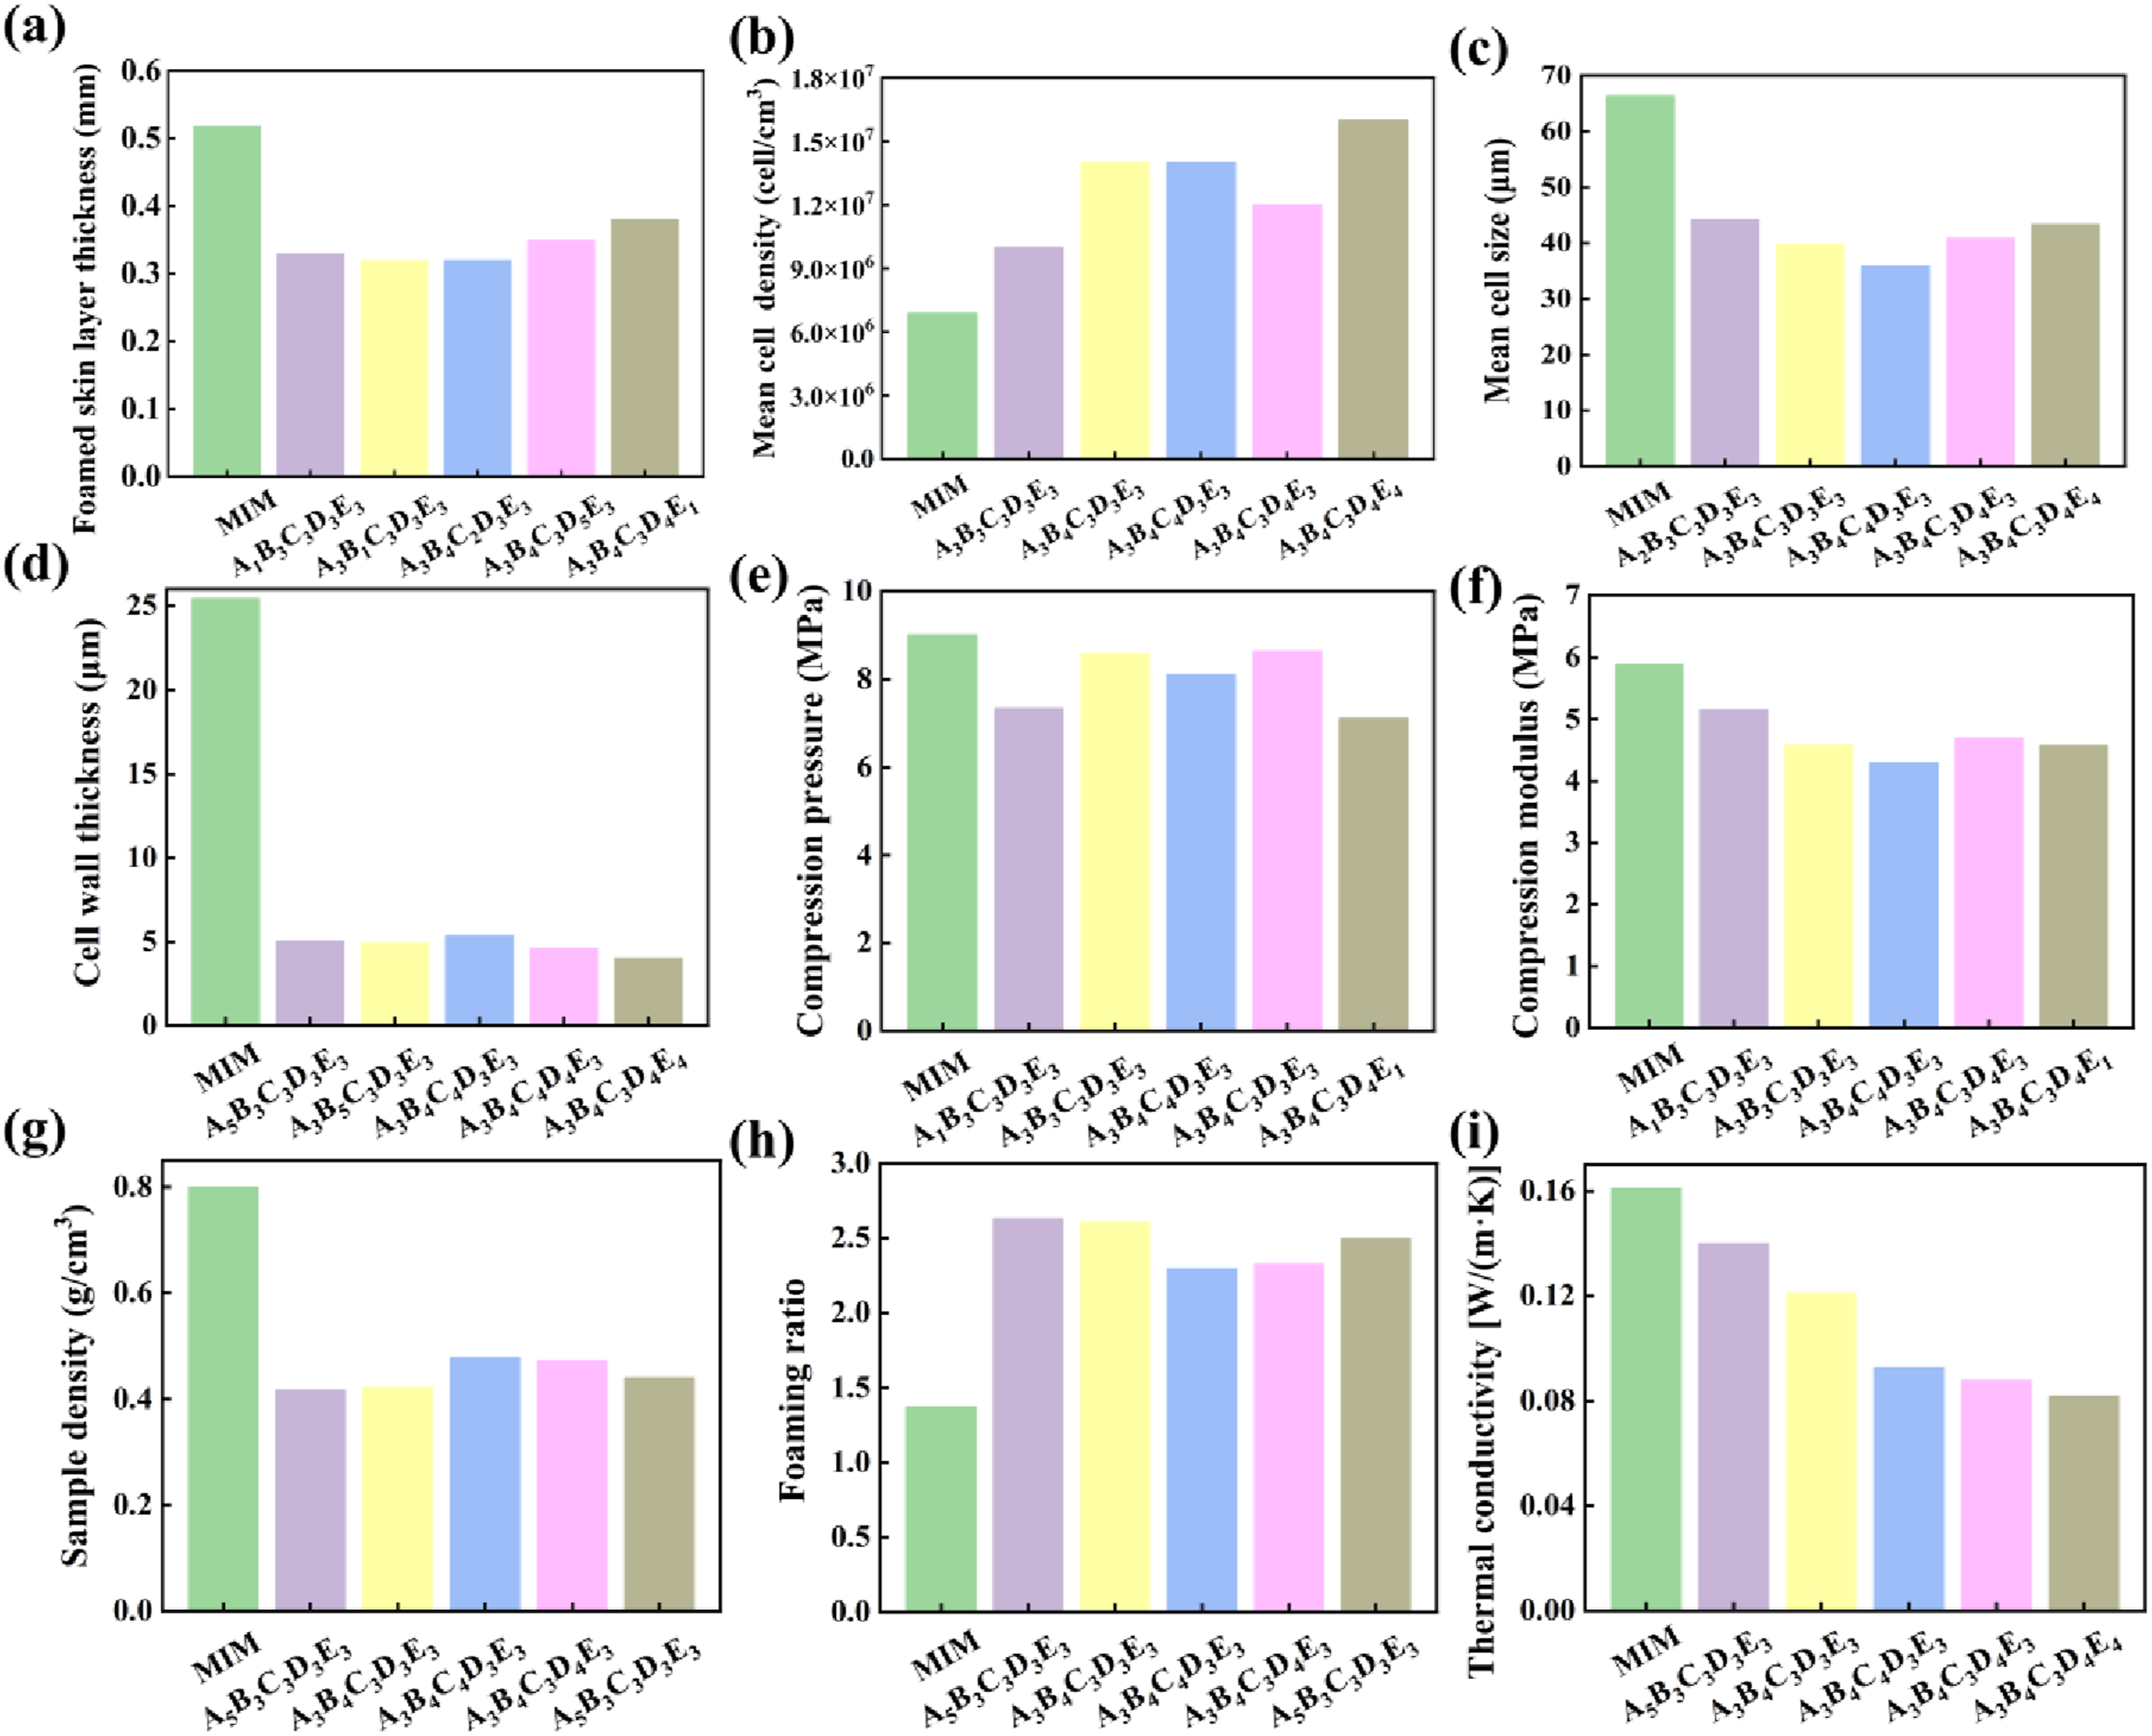
The influence of different parameters in MOMIM on the foam quantitative recovery rates
As shown in Figure 8, all MOMIM-processed foams exhibit robust recovery capability, with resilience values ranging from 58.6 to 82.1%. Specifically, the optimal MOMIM-processed TPU1180 A foam has a resilience of 82.1%. The high resilience is attributed to the fine and uniform closed-cell structure, which can effectively absorb and release energy during cyclic compression without permanent deformation. Histogram of (a) quantitative recovery rates versus mold-opening distance; (b) quantitative recovery rates versus holding pressure; (c) quantitative recovery rates versus holding time; (d) quantitative recovery rates versus mold-opening speed; (e) quantitative recovery rates versus mold-opening delay.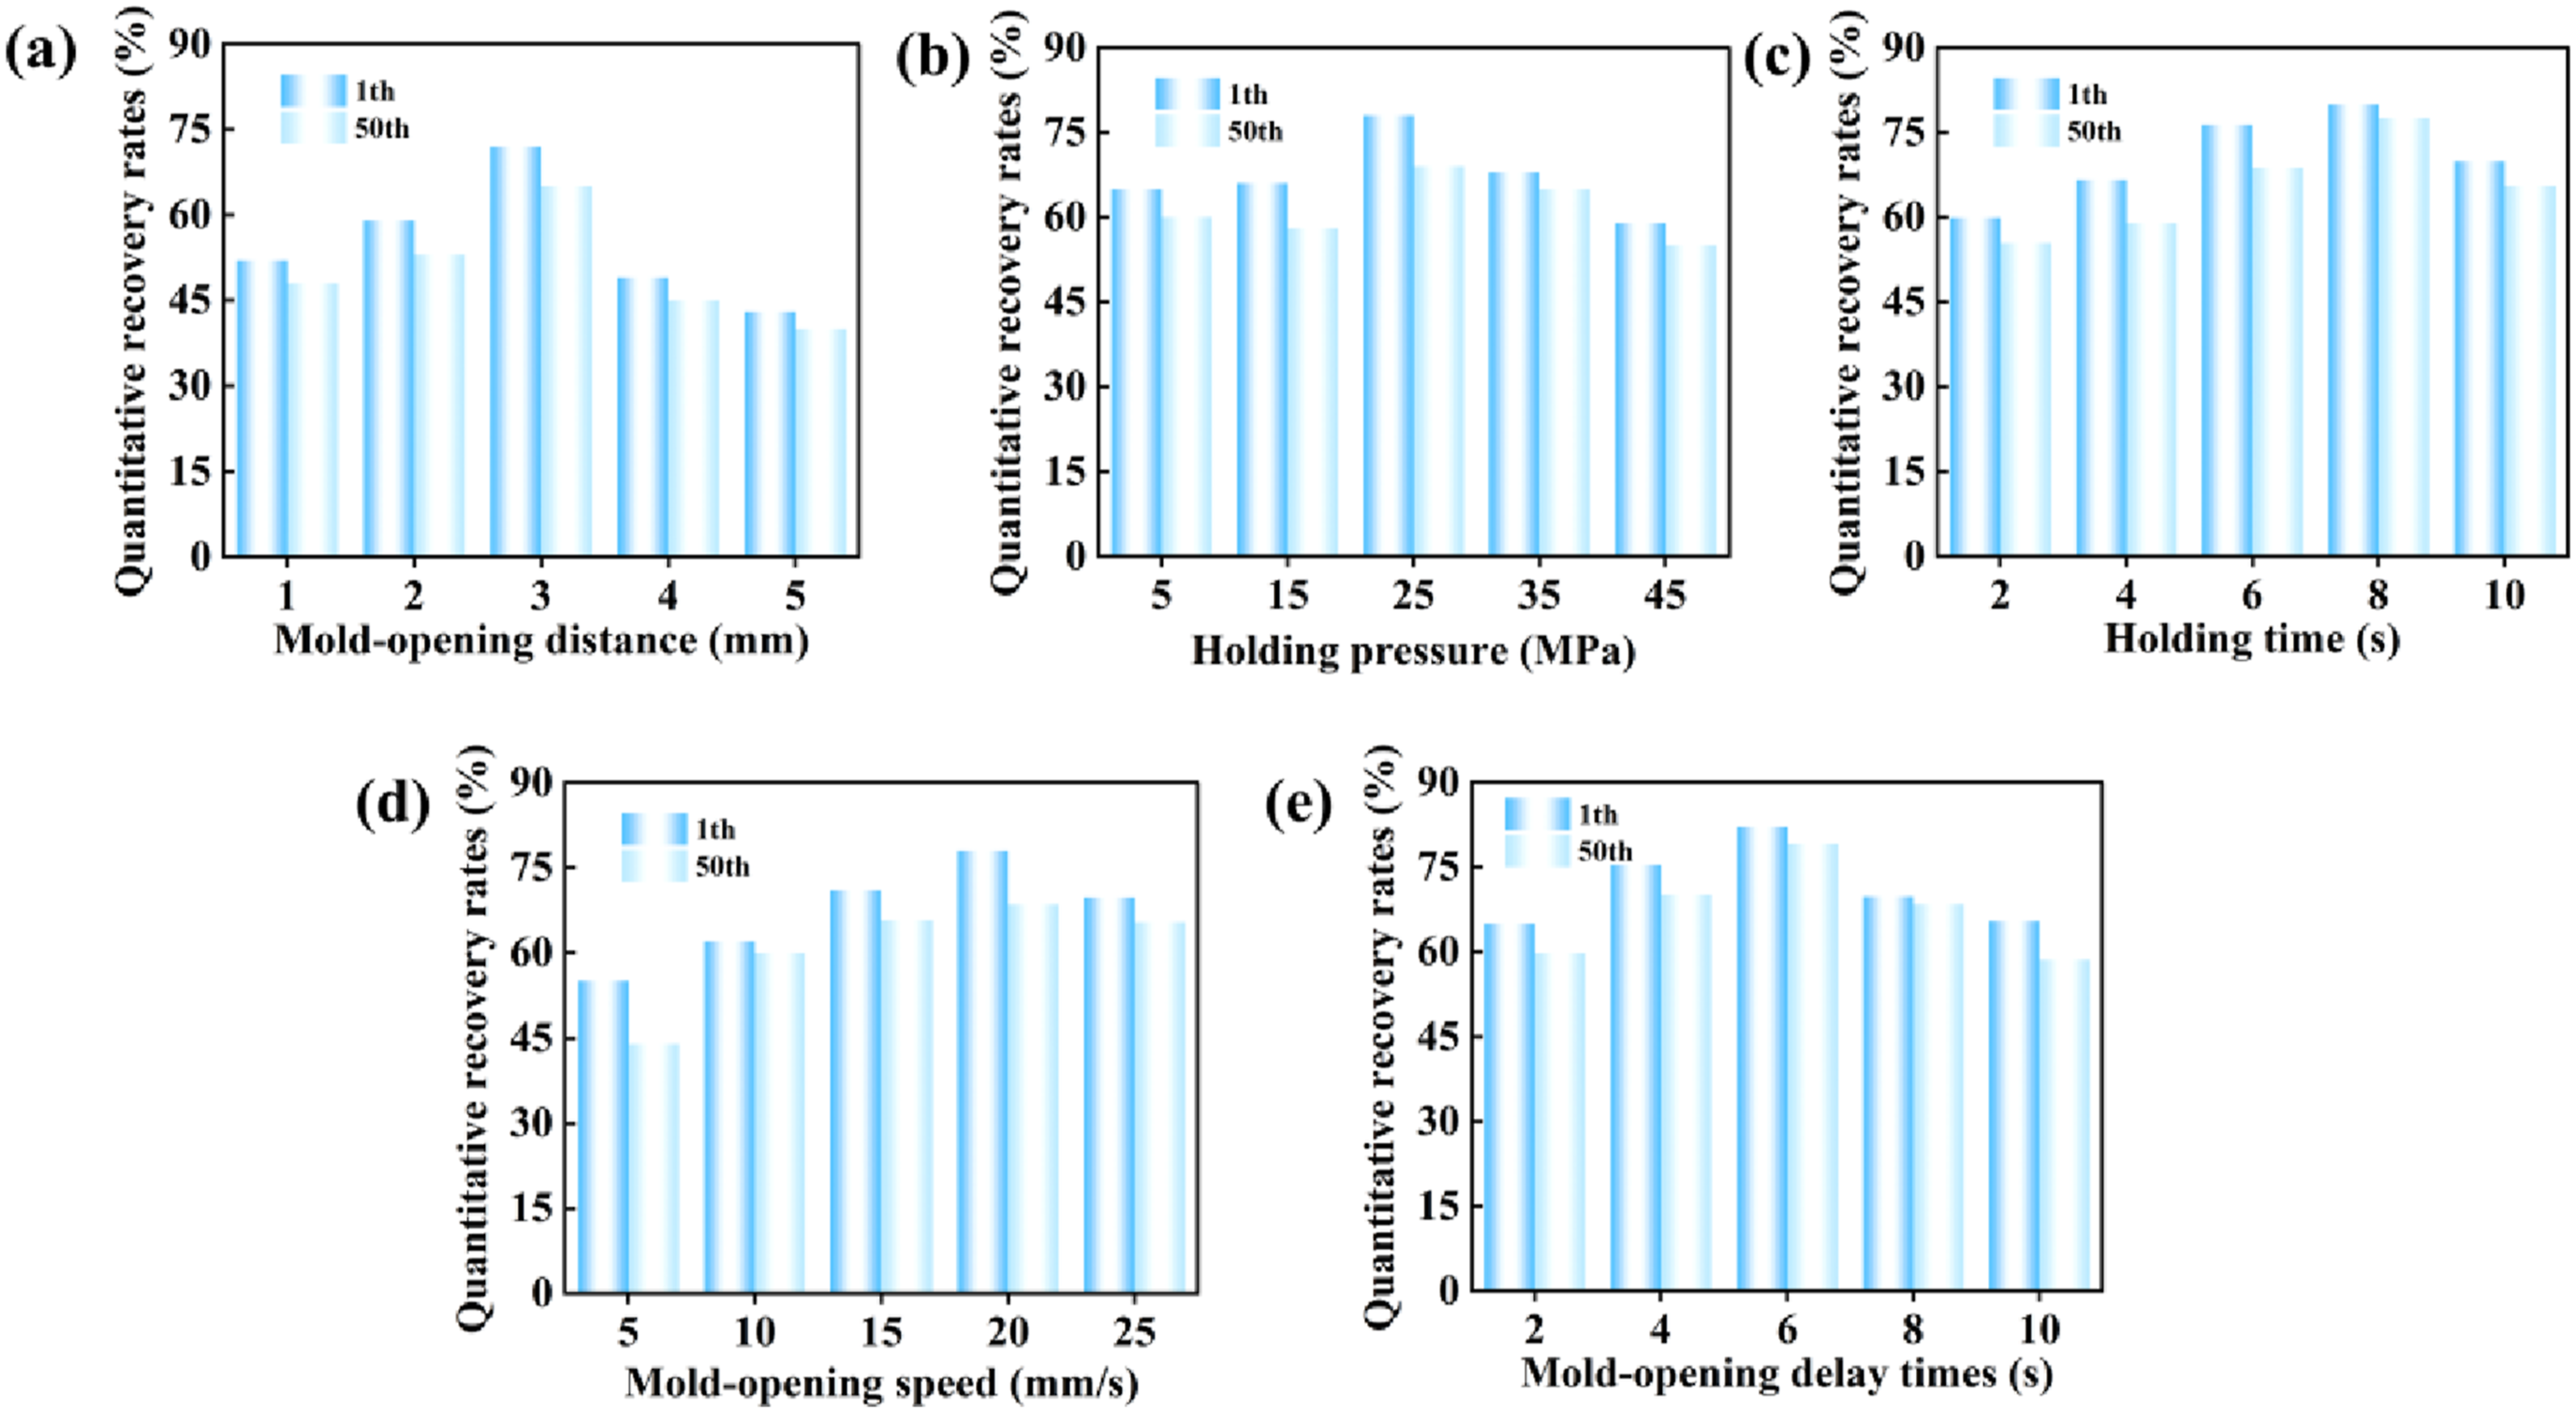
The influence of different parameters in MOMIM on the CV of cell size
To further quantify the uniformity of cell size distribution, we calculated the coefficient of variation (CV) of cell size for TPU foams prepared under different MOMIM process parameters, and the results are shown in Figure 9. The CV value of cell size exhibits a distinct trend with changes in process parameters: it gradually decreases from 10.2% at a mold-opening distance of 1 mm to a minimum of 8.4% at 3 mm, and then increases significantly to 9.6% at 5 mm. This trend is closely associated with the evolution of the cell structure. Moderate expansion of the mold cavity provides sufficient and controllable space for bubble nucleation and growth, suppressing cell coalescence and uneven expansion, thus leading to a continuous decrease in the CV value. Conversely, when the mold-opening distance exceeds 3 mm, the rapid increase in cavity volume causes an abrupt pressure drop, resulting in excessive bubble growth, stretching, and coalescence, which impairs the uniformity of cell size and is reflected by a sharp rise in the CV value. The same logic applies to other combinations of process parameters. CV value analysis further confirms that appropriate mold-opening process parameters can optimize the balance of cell growth. Histogram of (a) CV versus mold-opening distance; (b) CV versus holding pressure; (c) CV versus holding time; (d) CV versus mold-opening speed; (e) CV versus mold-opening delay.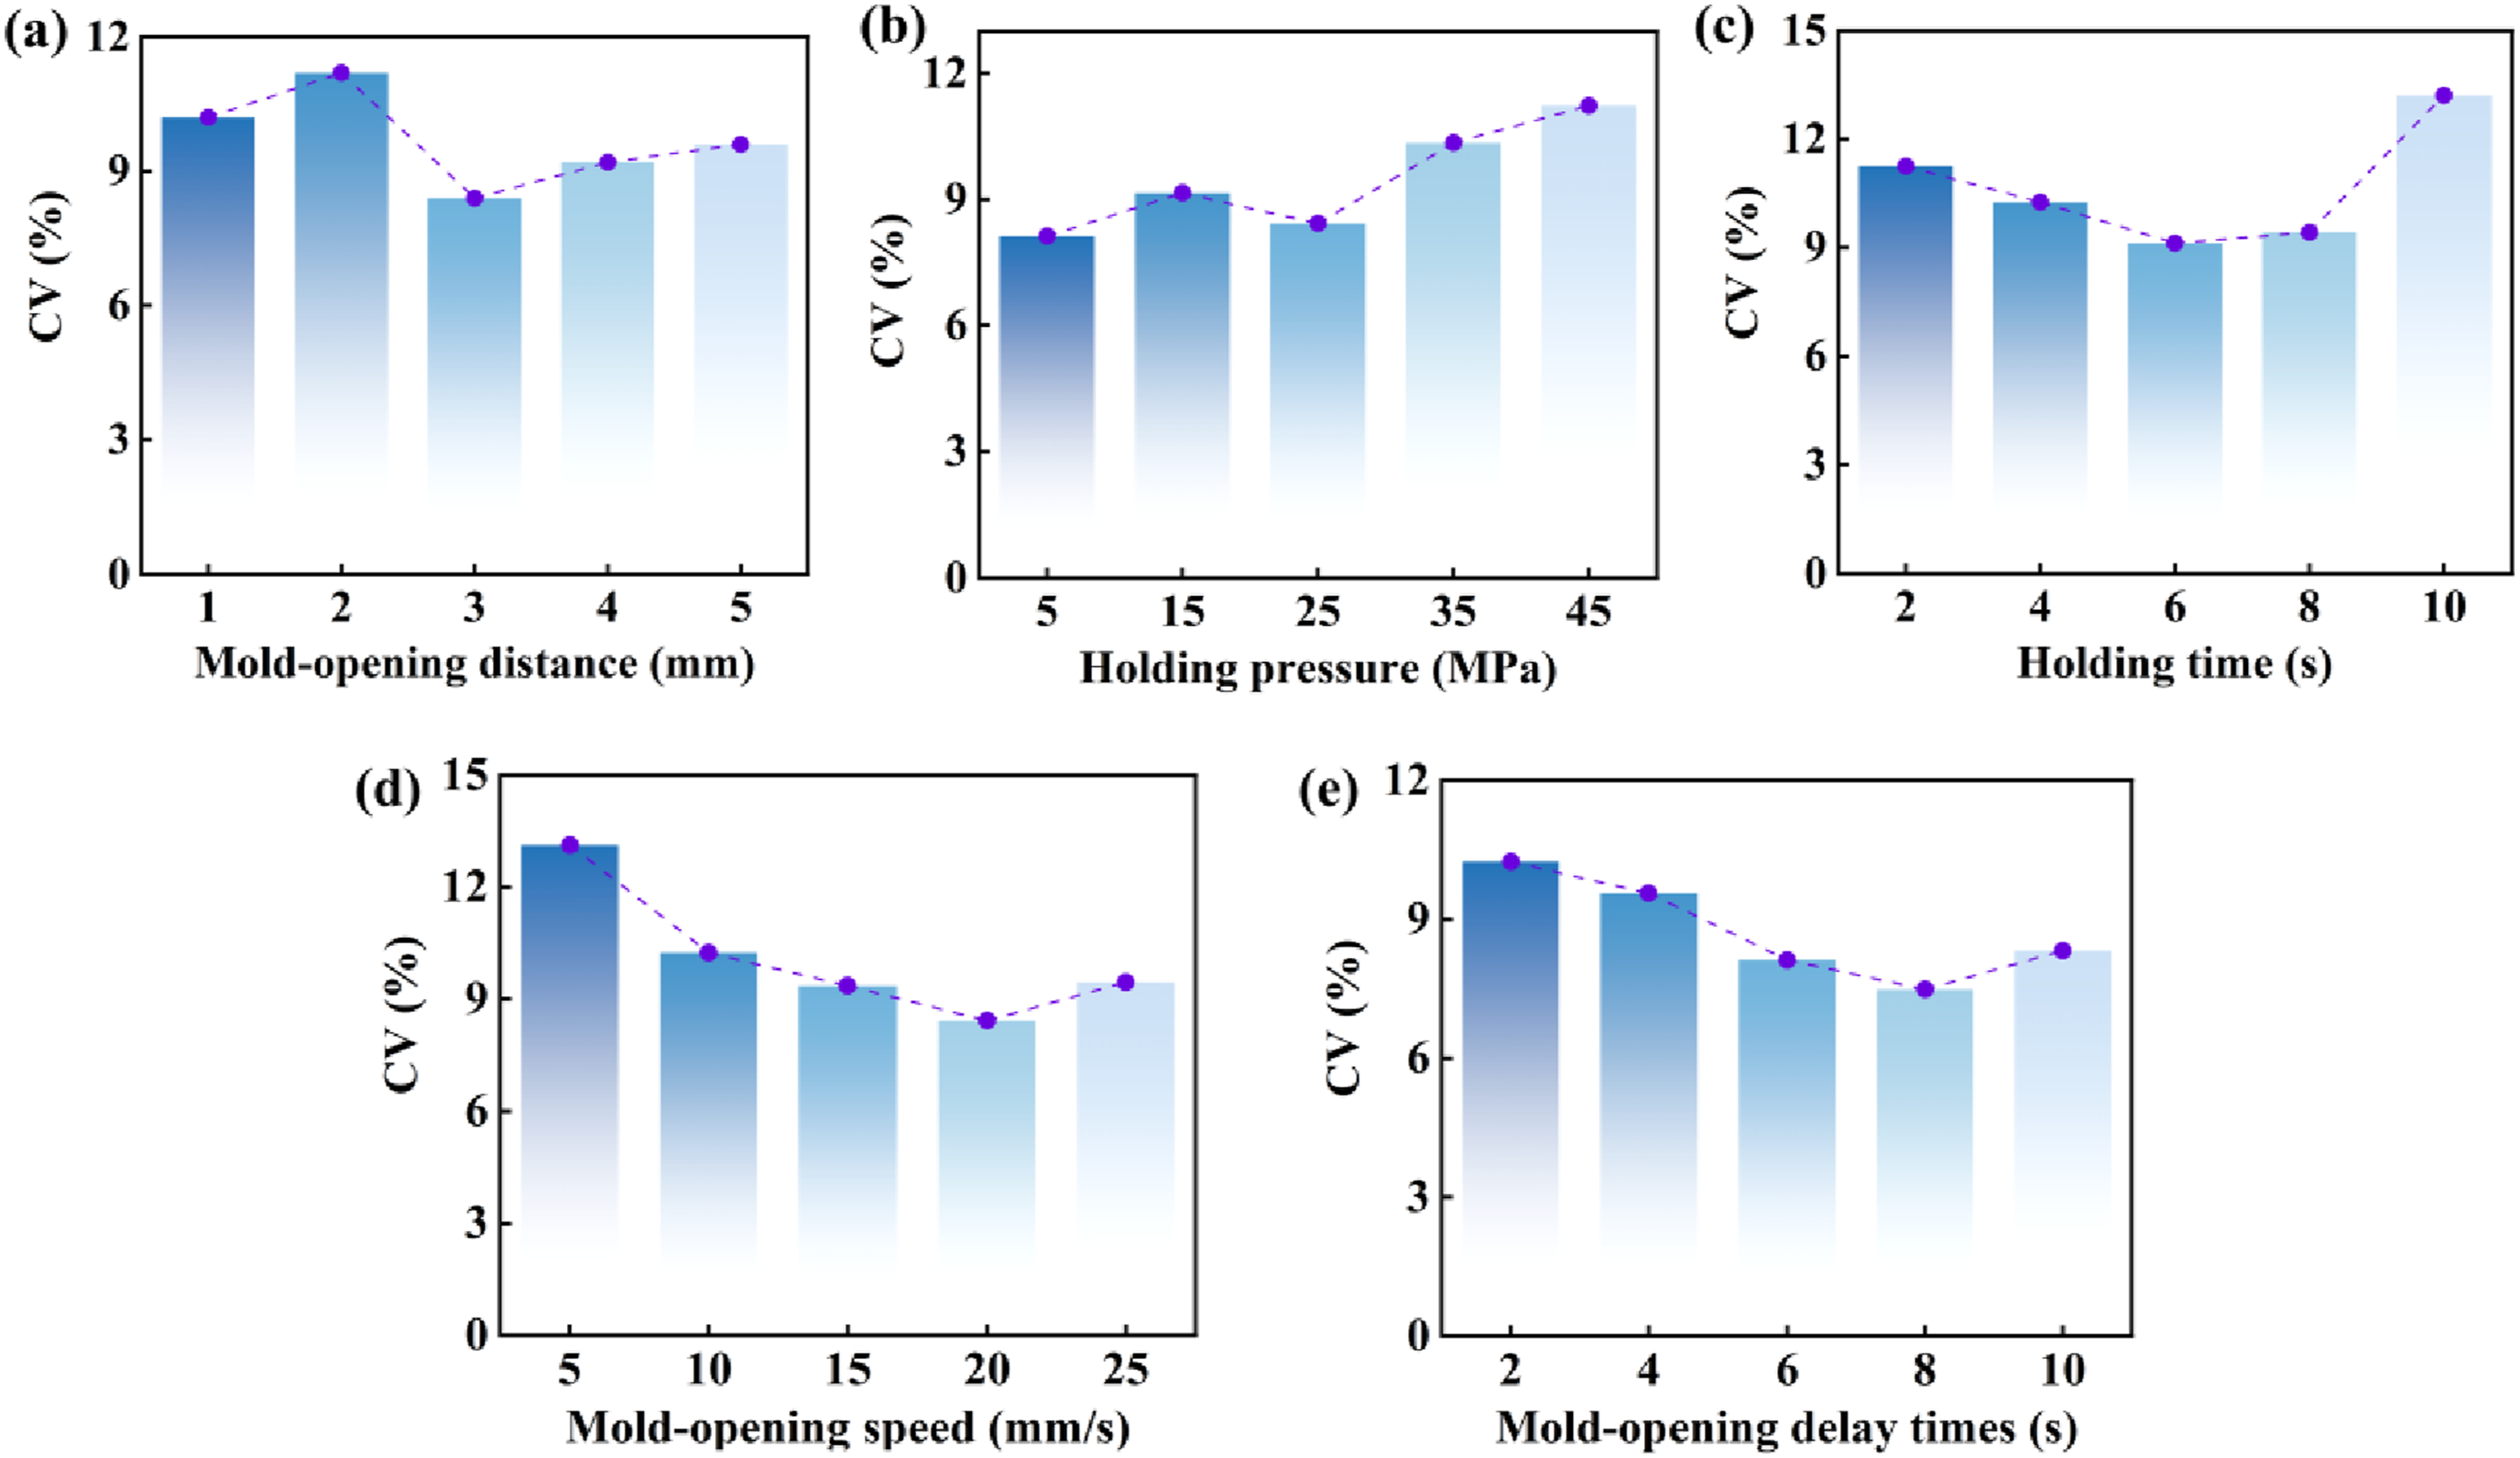
Comparison of cell morphology data of different hardness TPU materials under the optimal processing volume
To verify the universality of the optimized MOMIM process for TPU materials with varying hardness, supplementary experiments were conducted using two additional TPU (BASF Elastollan®1170A, Elastollan®1190A) under the optimal process parameters. The cell morphology characteristics of the foams were systematically characterized via SEM, with corresponding SEM micrographs presented in Figure 10. The SEM images of TPUs with different hardness levels: (a1)1170A; (b1)1180A; (c1)1190A. The statistical graphs of cell size and cell density of TPUs with different hardness levels: (a2)1170A; (b2)1180A; (c2)1190A. The cell wall thickness of TPUs with different hardness levels: (a3)1170A; (b3)1180A; (c3)1190A.
As shown in Figure 10, the MOMIM process exhibits excellent adaptability to TPU materials within the Shore A hardness range of 70A-90 A, and the cell morphology shows a clear correlation with material hardness. Specifically, with the increase in TPU hardness from 70A to 90A, the average cell diameter decreases gradually from 53.7 to 39.5 μm, while the cell density increases significantly from 8.6 × 10⁶ to 1.8 × 10⁷ cells/cm3, and the cell wall thickness reduces from 7.12 to 5.33 μm. This can be attributed to the intrinsic properties of TPU materials, higher hardness TPU has a higher crystallinity and melt viscosity, which not only provides more nucleation sites for bubble formation but also inhibits the excessive growth and coalescence of bubbles during the mold-opening foaming stage. In contrast, the lower hardness TPU has a lower melt viscosity and better chain mobility, leading to relatively larger bubble growth and lower cell density. From this, it can be seen that the three TPU levels processed with the optimized MOMIM parameters all achieved fine and uniform cell structures. This indicates that the proposed process parameters have good universality for TPU materials with medium to high hardness, further expanding the application scope of the MOMIM process.
Conclusions
To optimize the pore structure of TPU foamed materials and improve the performance of their products, TPU foam samples were prepared using the MOMIM process. By adjusting key parameters such as mold-opening distance, holding pressure, holding time, mold-opening speed, and mold-opening delay time, the effects on pore nucleation, growth, and structural performance were analyzed. Ultimately, foam samples with fine, uniform pores, significant weight reduction, excellent thermal insulation, and superior mechanical properties were successfully prepared. The experimental results indicated that under the optimal secondary mold-opening injection micro-foaming process conditions, the foam exhibited a minimum average cell diameter of 43.40 μm, a maximum cell density of 1.6 × 10⁷ cells/cm3, a minimum foam density of 0.441 g/cm3, a minimum average cell wall thickness of 4.03 μm, a minimum skin layer thickness of 0.400 mm, a maximum compressive strength of 4.58 MPa, a maximum compressive modulus of 6.95 MPa, and a minimum thermal conductivity of 0.071 W/(m·K) at room temperature. Therefore, the introduced MOMIM process and systematically controlled foaming parameters achieved a balance between the mechanical properties and thermal insulation performance of the TPU foams. The results demonstrated a successful combination of lightweight design and enhanced overall material performance, offering unique technological advantages and application potential in fields such as lightweight packaging, thermal insulation components for new energy vehicles, and energy-saving building materials.
Supplemental material
Suppplemental Material - Effect of mold-opening microcellular injection molding on the cell structure and properties of TPU foams
Suppplemental Material for Effect of mold-opening microcellular injection molding on the cell structure and properties of TPU foams by Wen Xiao, Feifan Yi, Zhengnan Chen, Shulei Wu, Shengguo Gu, Yuhuan Lin, Xiangfang Peng, and An Huang in Journal of Cellular Plastics
Footnotes
Funding
The authors disclosed receipt of the following financial support for the research, authorship, and/or publication of this article: This work was supported by the National Natural Science Foundation of China (No. 52203034 and 52273032), Natural Science Foundation of Fujian Province (2024J01155 and 2023J01345), and the Scientific Research Foundation of Fujian University of Technology (GY-Z19048).
Declaration of conflicting interests
The authors declared no potential conflicts of interest with respect to the research, authorship, and/or publication of this article.
Disclaimer
The opinions presented in the paper are those of the authors, not the funding agencies.
Supplemental material
Supplemental material for this article is available online.
References
Supplementary Material
Please find the following supplemental material available below.
For Open Access articles published under a Creative Commons License, all supplemental material carries the same license as the article it is associated with.
For non-Open Access articles published, all supplemental material carries a non-exclusive license, and permission requests for re-use of supplemental material or any part of supplemental material shall be sent directly to the copyright owner as specified in the copyright notice associated with the article.