






Abstract
This study presents fractal dimension (Df) as a predictive metric to optimize polyurethane foams (PUFs) for the adsorption of methylene blue (MB) as a toxic dye. PUFs were prepared by varying the amount of amine catalyst mixture (trimethylamine and triethylenediamine) (0.2–1.2 g), while chemical formulation was kept constant, including polyol (saturated aliphatic polyester), isocyanate (methylene diphenyl diisocyanate), catalyst (ethylenediamine, dibutyltin dilaurate), chemical blowing agent (water), isocyanate-index: 100%, and water content: 1%. This approach resulted in different cellular morphologies but constant chemistry. The Df, calculated via box-counting analysis of binarized optical microscopy images, ranged from 1.5415 to 1.8554. PUF properties including density (0.016–0.031 g/cm3), average cell size (49–133 μm), open-cell content (30–35%), and specific surface area (2.33–0.67 m2/g) were characterized. Adsorption evaluations were conducted at both high (100–900 mg/L) and low (10–90 mg/L) MB concentrations. Results demonstrated a strong correlation between Df and dye removal efficiency. Increasing Df from 1.5415 to 1.8554, at a consistent open-cell content (∼30%), significantly boosted removal efficiency by approximately 108%, regarding to a greater structural complexity and accessible surface area. Adsorption kinetics followed a pseudo-second-order model (R2 > 0.99), and equilibrium isotherms best fit the Freundlich model, indicating multilayer adsorption. The optimal formulation (density: 0.03 g/cm3, open-cell content: 30 ± 2%, cell size: 49 ± 5 µm, Df: 1.8554) achieved a removal efficiency of 44.5% at 900 mg/L MB concentration. The findings demonstrate that Df can serve as a useful integrated morphological descriptor for assessing PUF adsorption performance. This approach offers a practical strategy for tailoring the PUF structures in wastewater treatment applications.
Introduction
It is claimed that over 700,000 tons of organic dyes are produced each year globally, of which around 20% are released into industrial wastewater.1,2 Methylene blue (MB), as a representative cationic organic dye, is frequently utilized in textiles, printing, packaging, cultivation, and medical applications.3,4 MB not only creates visual clutter but also obstructs sunlight transmission and diminishes the photosynthesis of aquatic life. Furthermore, MB dye harms the human body, causing carcinogenic and mutagenic impacts.3–5 Consequently, investigation into effective methods for treating wastewater containing different dyes has emerged as a significant subject. Treatment methodologies, including filtration by membrane,3,6 coagulations/flocculation, 7 adsorption by activated carbon, 8 advanced oxidation process (AOP),6,9 biodegradation, 10 and selective bio-adsorption,11,12 have been employed to remove MB. Adsorption and using adsorbents have been regarded as a potentially beneficial approach due to their low price and simple operation.13,14 Adsorbents have to provide outstanding adsorption capacity, proper physical and mechanical properties, stability, as well as adjustable pore size and pore size distribution.15,16
Polyurethane foams (PUF) not only have adsorption ability, but also can immobilize active adsorbents and particles with photocatalytic activity, such as metal-organic frameworks (MOFs) or nanoparticles.6,17,18 Furthermore, PUFs, as a promising porous solid substrate, meet all the requirements, including reasonable cost, adjustable porosity, formability, high specific surface area, low density, and proper physical, mechanical, thermal, and chemical stability under different circumstances for dye removal from wastewater.17,19,20 PUFs as solid-gas materials can be classified into open and closed types, or rigid and flexible foams based on their cellular stiffness and structure, respectively.21,22 PUFs are usually generated by combining reagents A, including polyols, gelling catalysts, blowing and chemical agents, surfactants, chain extenders, etc., with a B component containing different types of isocyanates.23,24 The dye removal and other adsorption performance of PUFs depend strongly on both solid phase (chemical nature) and cellular morphology, i.e., macroscopic density, thickness of cell struts and walls, tortuosity, average cell size, porosity, airflow resistivity, and cell size distribution. Generally, PUFs with a high amount of open cells and interconnecting cavities have higher dye removal efficiency.21,25,26
While it is widely accepted that the interconnecting pathways and morphology of PUFs have a direct influence on their adsorption behaviors, the measurement of these physical parameters by using conventional methodologies is complicated and challenging. Furthermore, the inherent complexity and irregularities of PUFs make assessing their physical morphology, such as porosity, cell size distribution, airflow resistivity, tortuosity, etc., problematic and lead to considerable experimental errors.24,27 Consequently, a fundamental gap in research persists: there is currently no single-parameter, quantitative metric that can summarize all the physical parameters as representative, exhibit the mentioned complexity, and can be used to forecast the adsorption performance of a PUF.27,28 In more detail, traditional characterization methods necessitate the measurement of multiple physical parameters, e.g., density, open-cell content, cell size distribution, average cell size, and flow pathway of drainage, making it challenging to establish a predictive link between adsorption efficiency and morphology of PUFs. Accordingly, the dominant hypothesis of this study is that the fractal dimension can serve as this missing metric. The fractal dimension integrates the effects of several morphological characteristics into a single, meaningful metric by quantifying the degree of space-filling and irregularity of PUFs. The fractal examination of the PUFs is quite beneficial because the fractal dimension values of PUFs are directly affected by variations in porosity (pores’ ratio and size). Additionally, the fractal dimension is capable of illustrating the complexity or heterogeneity of the PUFs’ structure.24,29,30
Fractal dimension in porous PUFs is governed predominantly by structural and morphological parameters that define the space-filling nature and complexity of the cellular plastics. Therefore, Fractal dimension is influenced by cell size and cell size distribution, cell wall and strut thickness, tortuosity of internal pathways, open-cell content (grade of cell interconnectivity), density and space-filling capacity, pore irregularity and heterogeneity. An increase in irregularity, tortuous pathways, and hierarchical pore distribution results in higher fractal dimension values, illustrating more geometrical complexity.24,27–30
It is worth mentioning that Df is not supposed to be an independent parameter in a similar class as density or cell size. Moderately, it is a meta-parameter that statistically combines the effects of multiple interconnected morphological properties, as mentioned previously, into a single predictive value.24,27,28
In other words, irregular objects like foams can be characterized by using fractal geometries owing to their self-similar nature. These fractals can be described via a non-integer dimension known as the fractal dimension. Mandelbrot introduced Fractals, serving as a non-Euclidean geometric theory to describe nature’s irregularities.24,27,28 Nearly all of the natural fractal bodies are not entirely self-similar and reveal their similarities just within a restricted scale range, unlike Koch curves, which represent a true fractal across an infinite range of scales. Fractals aim to represent a complex structure by a simpler component beneath.27,28 Different fractal dimensions are determined by various formulas, such as the Hausdorff dimension, spectral dimension, information dimension, similar dimension, correlation dimension, Lyapunov dimension, or capacity dimension. Among these techniques, the counting box dimension is frequently utilized due to its straightforward mathematical calculation and recognizable physical principles.28,29 If scale Փ is considered to be the dimension of the meshes used to divide the fractal object (characteristic dimension), L (Փ) representing the volume, area, or length, will fit the subsequent scaling correlation as follows (1):

Notably, the calculated Df values may rely on processing parameters and image acquisition, including image resolution, thresholding conditions, and selected regions of interest. Thus, quantitative comparisons have to be performed using a reliable imaging and image-analysis protocol to guarantee reproducibility and reliability of the attained Df.
The correlation between the fractal dimension and the acoustic damping performance of PUFs generated by several polyester resins as polyols (water content of 5% and isocyanate index of 110), in a one-shot bulk polymerization method, was studied previously. The findings revealed that the total sound absorption effectiveness of PUFs was enhanced by 43% upon a 20% increment in fractal dimension. 24
In this research, the fractal dimension of PUFs describing the physical morphology properties is calculated by a box-counting technique, and its correlation with the adsorption of MB from both low- and high-concentration aqueous solutions will be systematically investigated. To this, a series of PUFs with dissimilar cellular morphologies but invariant chemistry will be prepared. Subsequently, the relationship between Df and dye adsorption efficiency of PUFs is examined for the first time. This establishment can reduce the need for time-consuming and multiple characterizations by introducing Df as a powerful design parameter, a single averaged metric, and a straightforward means for adjusting PUF morphology for improved adsorption capacity and advanced wastewater treatment applications.
Experimental
Materials
1, 4 butanediol (BD), neopentyl glycol (NPG), adipic acid (AA), as well as ethylenediamine (EDA), triethylamine (TEA), triethylenediamine (TEDA), methylene diphenyl diisocyanate (MDI), dibutyltin dilaurate (DBTDL), monobutyltin oxide (MBTO), and de-ionized (DI) water were provided by Merck Co. Methylene blue (MB) was acquired from Tianjin Tianli Chemical Reagent Co., Ltd
Synthesis and characterization of polyester polyol
In this study, a polyol, saturated aliphatic polyester resin, was synthesized for the preparation of PUF samples. This polyester polyol resin was produced through a polycondensation reaction by using monomers, namely AA as a diacid and NPG-BD with a molar ratio of 1:1 as diol monomers, in the presence of MBTO as esterification catalyst. The stoichiometry monomer ratios of hydroxyl groups to carboxyl groups were adjusted to 1.5 (OH: COOH = 1.5) to attain a hydroxylated resin. A five-neck flask equipped with a thermometer, a reflux condenser, a mechanical stirrer, and an N2 feeding inlet was pre-charged with polyfunctional alcohols. After melting the polyfunctional alcohols, AA was added to the flask, setting the temperature to 220°C, and the esterification reaction was conducted at 500 rpm to reach the acid value of 12 mg KOH/g.31,32
Hydroxyl and acid values of the achieved resin were monitored according to DIN 53240-2 (Reflux Phthalation method) and ASTM D1639–90, respectively. Finally, unreacted reagents and trapped water were purified under vacuum conditions. The number average molecular weight (Mn), weight average molecular weight (Mw), and molecular weight polydispersity index (PDI) (
Preparation of polyurethane foams
Formulation of different PUF samples.
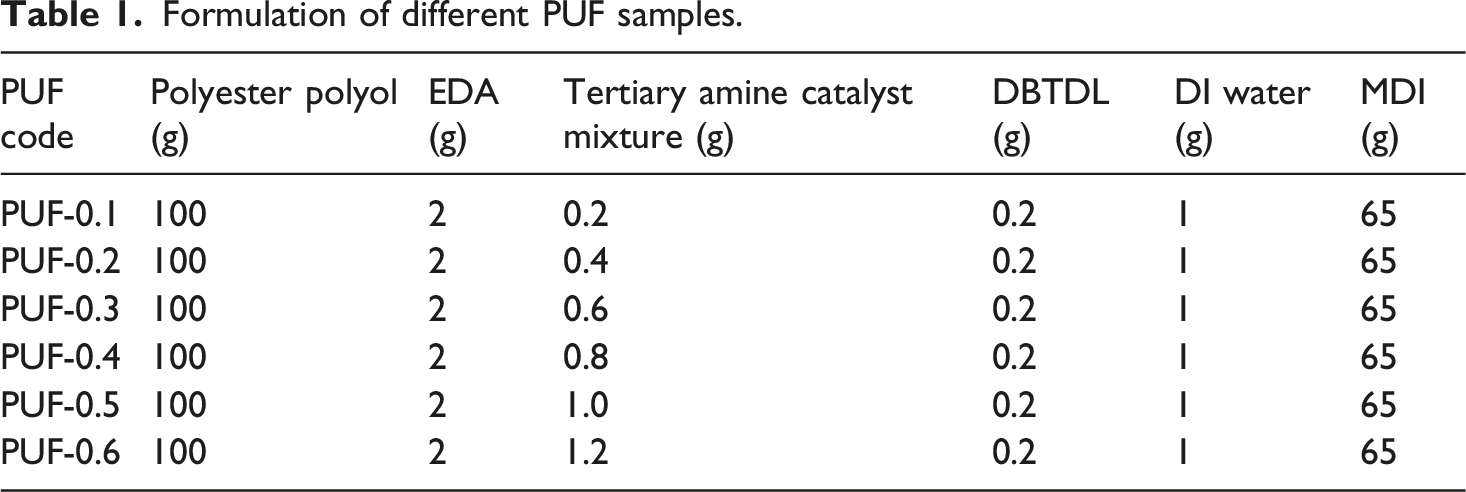
Finally, PUF samples, including PUF-0.1, PUF-0.2, PUF-0.3, PUF-0.4, PUF-0.5, and PUF-0.6, were obtained. As exhibited in Table 1, the only variable among PUF-0.1 to PUF-0.6 was the total amount of the TEDA/TEA tertiary amine catalyst mixture, ranging from 0.2 to 1.2 g, while all other formulation parameters, including polyol, MDI, chain extender, water content, and isocyanate index, were kept constant. Because TEDA and TEA are neutral tertiary amines that do not participate in the isocyanate-polyol or isocyanate-water reactions, their variation affects only the foaming kinetics (gas generation rate, bubble nucleation, and cell expansion) and not the chemical structure of the polymer network. Therefore, all PUF samples possess identical chemical composition, and the observed differences arise solely from morphological variations induced by the controlled change in amine catalyst content.
Characterizations of polyurethane foams
Physical properties of polyurethane foams
Cream time (CT), rise time (RT), gel time (GT), and tack-free time (TFT) as chemical reaction rates for different PUF specimens were measured following ASTM D7487–13.
ASTM D 6226-15 and ASTM D 1622-14 were used to evaluate the open-cell content and density of the PUFs, respectively. The open-cell content relies on assessing the porosity by measuring the reachable cellular bulk of a cellular solid through Boyle’s Law, which asserts that the volume reduction of a confined gas leads to a corresponding rise in pressure.
The specific surface area (SSA) of the PUFs was measured by nitrogen adsorption-desorption measurements using the Brunauer-Emmett-Teller (BET) method in accordance with ASTM D1993-18. The analysis was conducted with an NS Model BET Analyzer (Iranian-made). First, 0.5 g of PUF samples was degassed under vacuum at 110°C for 2 h to remove any adsorbed contaminants and moisture from the pores and surface. The degassing temperature was carefully adjusted to avoid any collapse of the foam structure or thermal degradation. Nitrogen adsorption isotherms were measured at cryogenic temperature (77 K) over a relative pressure range (P/P0) of approximately 0.05 to 0.30. The SSA was calculated using the multipoint BET equation and reported in units of square meters per gram (m2/g). The degassing temperature (110°C) was chosen according to the established protocols for PUFs. This temperature is below the thermal degradation. No discoloration, structural collapse, or degradation was detected after degassing, and all samples were treated identically, confirming the comparative validity of the BET results. Notably, BET mainly characterize the surface area available to nitrogen molecules (micro- and mesopores) and may not entirely characterize all structural properties governing liquid-phase dye adsorption in macroporous PUFs. However, the BET data are considered here as a comparative parameter among the different PUF formulations.
Morphological characteristics of polyurethane foams
The average and distribution of cell size values for PUF samples were determined following the ASTM D 3576-98 standard. In this manner, an optical microscope was employed to survey the cell structure, specifically non-interconnecting and interconnecting pores, along with cavities. Four specimens of each PUF formulation, extracted from their core, were frozen in liquid nitrogen and sliced into five thin layers (1 cm × 1 cm × 2 mm), using a cutter for microscopic observation. To guarantee statistical representativeness and evaluate structural isotropy, specimens were extracted from three distinct regions of each PUF block: the bottom, middle, and top sections relative to the direction of foam rise. Layers were sliced in both horizontal and vertical orientations from each region. Then, these layers were stuck to the glass lamella. Next, an optical microscope was utilized to take 20 images for every PUF formulation, encompassing all orientations and regions, to provide comprehensive data for morphological analysis. Certain areas of the attained images exhibited an unclear look, particularly in the boundary regions of foam; thus, image processing was required before a precise analysis for the fractal dimension calculation. A conversion process to gray-scale was performed to enhance the clarity of the images attributed to the PUF structure. Subsequently, binarization processing was conducted to simplify the images and separate the solid-phase and gas-phase by selecting an appropriate threshold. This procedure provides more distinct edges in the PUFs’ images and can be described by the subsequent relation (2):
The threshold value T for image binarization was revealed using Otsu’s method, a histogram-based algorithm which maximizes the between-class variance between the gas phase and solid phase. This method is suitable for PUF optical micrographs. The same algorithm was used uniformly to all 20 images per PUF formulation to ensure consistent across samples. The quality of binarization was visually confirmed for all images.
Ultimately, the images were surveyed using a DN-2 microscopy image processing system (DN-2 MIPS), and cell size values, average cell size, and the cell size distribution of PUFs were determined using the Feret method. 30
MATLAB software was employed to define the fractal dimension (Df) of PUFs. The Box-counting dimension technique was applied to all 20 binarized images of each PUF specimen. Notably, the quantity of r-sized boxes required to cover the fractal object’s body (Nr) follows a power-law.29,30 The subsequent relation (3) was considered to compute the Df for every image and every PUF.

For the box-counting analysis, six box sizes, including 4, 8, 16, 32, 64, and 128 pixels were used. The logarithm of the number of occupied boxes, N(r), was plotted against the logarithm of the box size (r), and Df was achieved from the slope of the resulting linear regression. All microscopic images were attained at a magnification of 100× with a resolution of 1280 × 1024 pixels. The selected box-size range was chosen to sufficiently reach the hierarchical cellular structure of the PUFs, including pore boundaries and cell-wall features over multiple length scales. Standard deviation of Df across the 20 images for each formulation were calculated and reported. To reduce methodological variability, all images were acquired under the same imaging conditions and processed using identical thresholding and box-counting procedures.
Adsorption of MB molecules by polyurethane foams
To measure the capability of PUFs to adsorb the MB molecules from MB solutions with low and high concentrations, a UV-Vis spectrophotometer (PerkinElmer, LAMBDA 365, USA) was utilized to quantify the MB concentrations at a wavelength of 664 nm before and after the adsorption.
MB adsorption at high and low concentrations
PUF samples with a weight of 0.2 g were put into 50 mL of solution containing varying MB concentrations, including 100, 300, 500, 700, and 900 mg/L, and allowed to adsorb MB for 24 h, mixing at 150 rpm to reach adsorption equilibrium. During the procedure, temperature and pH were adjusted to 25°C and 7, respectively. The experiments were replicated for 3 times.
The equilibrium adsorption capacity (ACe) (mg/g) and dye removal efficiency (E%) were determined using equations (5) and (6):

V (L) symbolizes the dye solution volume, and m (g) denotes the mass of the dried PUF specimen used in the dye removal process. Ce (mg/L) and C0 (mg/L) state to the equilibrium (after 24 h) and primary concentrations of the MB dye solution, respectively.
Taking into account that lower amounts of MB dye concentration released into the environment should also be efficiently adsorbed, the adsorption tests for PUFs in MB solutions with low concentrations were also conducted to confirm their effectiveness in different situations. The abovementioned tests were repeated in five MB solutions with low concentrations, including 10, 30, 50, 70, and 90 mg/L. So, 0.2 g of PUFs were incorporated into 50 mL of the low-concentrated solutions to assess the effectiveness of PUFs in adsorbing MB under low-concentration conditions.
Adsorption kinetics
The adsorption rate (AR) of each PUF over 4 h was calculated according to equation (7).
Moreover, the adsorption kinetics of PUFs were measured by putting a specific quantity of PUFs into the MB solutions with varying initial concentrations. The adsorption capacity (ACt) (mg/g) at various adsorption durations was determined using equation (8). The kinetic models for the pseudo-first-order and pseudo-second-order were developed based on equations (9) and (10).


Isotherm model of adsorption
The relationship between MB and its adsorption by PUFs was modeled by the Langmuir and the Freundlich adsorption isotherms using equations (11)–(14), respectively.



Results and discussion
Characterization of polyester polyol
Characteristics of synthesized polyester polyol resin.

According to Table 2, polyester polyol resin has a proper hydroxyl value (35 mg KOH/g), acid value (12 mg KOH/g), and molecular weight (3000 g/mol), as well as a low color index of 1 for the PUF preparation.
Characterizations of polyurethane foams
The synthesis of PUFs was evaluated by Fourier transform-infrared spectroscopy (FTIR) analysis, as reported in the SI. FTIR spectra figured out in Figure S2 confirmed the formation of urethane/urea linkages in all PUF samples. Moreover, the spectra of different PUFs were nearly similar, verifying that there were no significant chemical structural differences in the urethane/urea network structure of PUFs produced by varying the amine catalyst content. As described in Table 1, the difference between PUF samples, including PUF-0.1, PUF-0.2, PUF-0.3, PUF-0.4, PUF-0.5, and PUF-0.6, refers to the amount of amine catalyst mixture, namely TEDA and TEA. Besides, the results of DSC measurements performed in the temperature range of 25-150°C are shown in Figure S3. All PUF samples exhibit the glass transition temperature values (Tg) in the range of 54.4-55.9°C, with no significant shift among formulations. The soft-segment Tg is expected to lie below room temperature and therefore falls outside the measurement window. Therefore, the narrow Tg range and the absence of additional thermal transitions confirm that the polymer network and microphase structure are nearly identical for all samples.
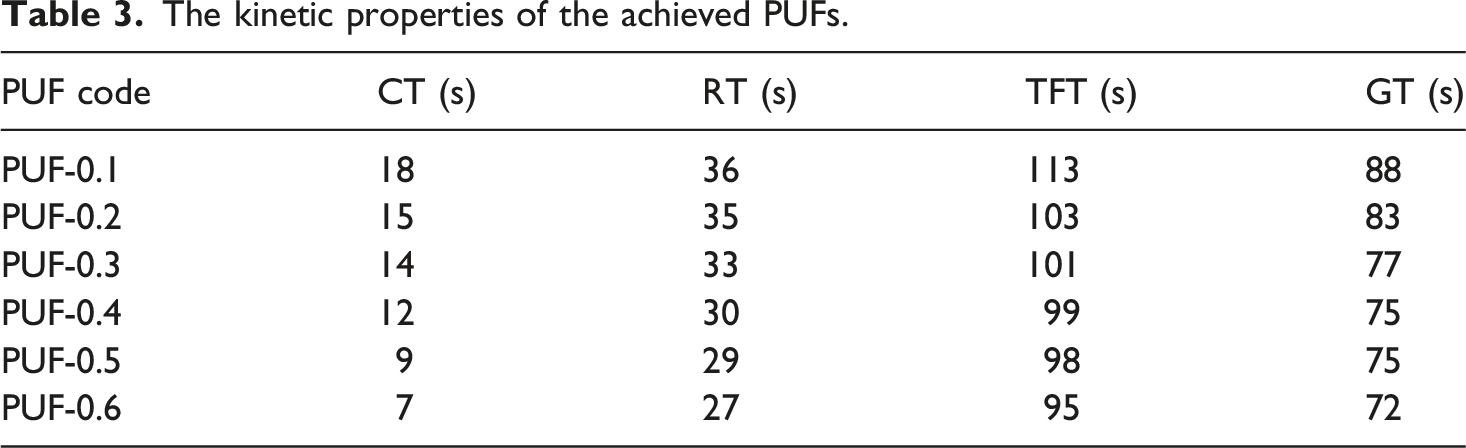
The kinetic properties of the achieved PUFs.
During the PUF formation, two leading chemical reactions happen at the same time: (1) the gelling reaction between hydroxyl/amine and isocyanate groups to urethane/urea linkage formation, and (2) the blowing reaction consisting of bubble formation resulting from the isocyanate-water reaction. In the isocyanates-water reaction, isocyanate compounds and water molecules interact to form an unstable carbamic acid that rapidly decomposes into primary amines and carbon dioxide. The generated carbon dioxide gas leads to the creation of the gas phase and bubbles. Consequently, the pore and cavity formations occur through the blowing and gelling processes. Under these conditions, isocyanate groups can interact with both the hydroxyl functional groups of polyester polyol resin and the produced primary amines to form urethane and urea linkages.20,22,32
The time concerning the beginning of mixing and the appearance of bubbles in the liquid polyurethane foam mixtures is associated with CT. RT introduces the moment when the foam ceases to expand as seen visually. TFT reveals the moment when the foam’s surface can be touched without sticking. GT refers to the moment when lengthy “strings” of forming foam can be detached from the foam’s surface when it is contacted by a sharp item.17,22
According to Table 3, the CT and RT values of PUFs decrease with increasing the amount of tertiary amine catalyst mixture from 0.2 to 1.2 g. CT and RT represent the volume and rate of bubble formation. Hence, an increase in amine catalyst content leads to more CO2 formation. 33
Per Table 3, TFT and GT values decrease in the range of 113-95 s and 88-72 s, respectively, by increasing the amine catalyst content. Therefore, higher tertiary amine catalyst concentration shortened TFT and GT as foaming times. TFT and GT values depend on the chemical reactions, i.e., the formation of urea-urethane linkages. By increasing the amine catalyst content, the isocyanate-water reaction can be accelerated and more amine may be produced, resulting in more Urea linkages and lower TFT and GT values. Consequently, by increasing the tertiary amine catalyst concentration, TFT and GT decreased.
The gray-scale and binarized morphological images of PUFs achieved by optical microscopy are shown in Figure 1. The gray-scale and binarized morphological images of PUFs achieved by optical microscopy, as well as the attributed cell size distribution.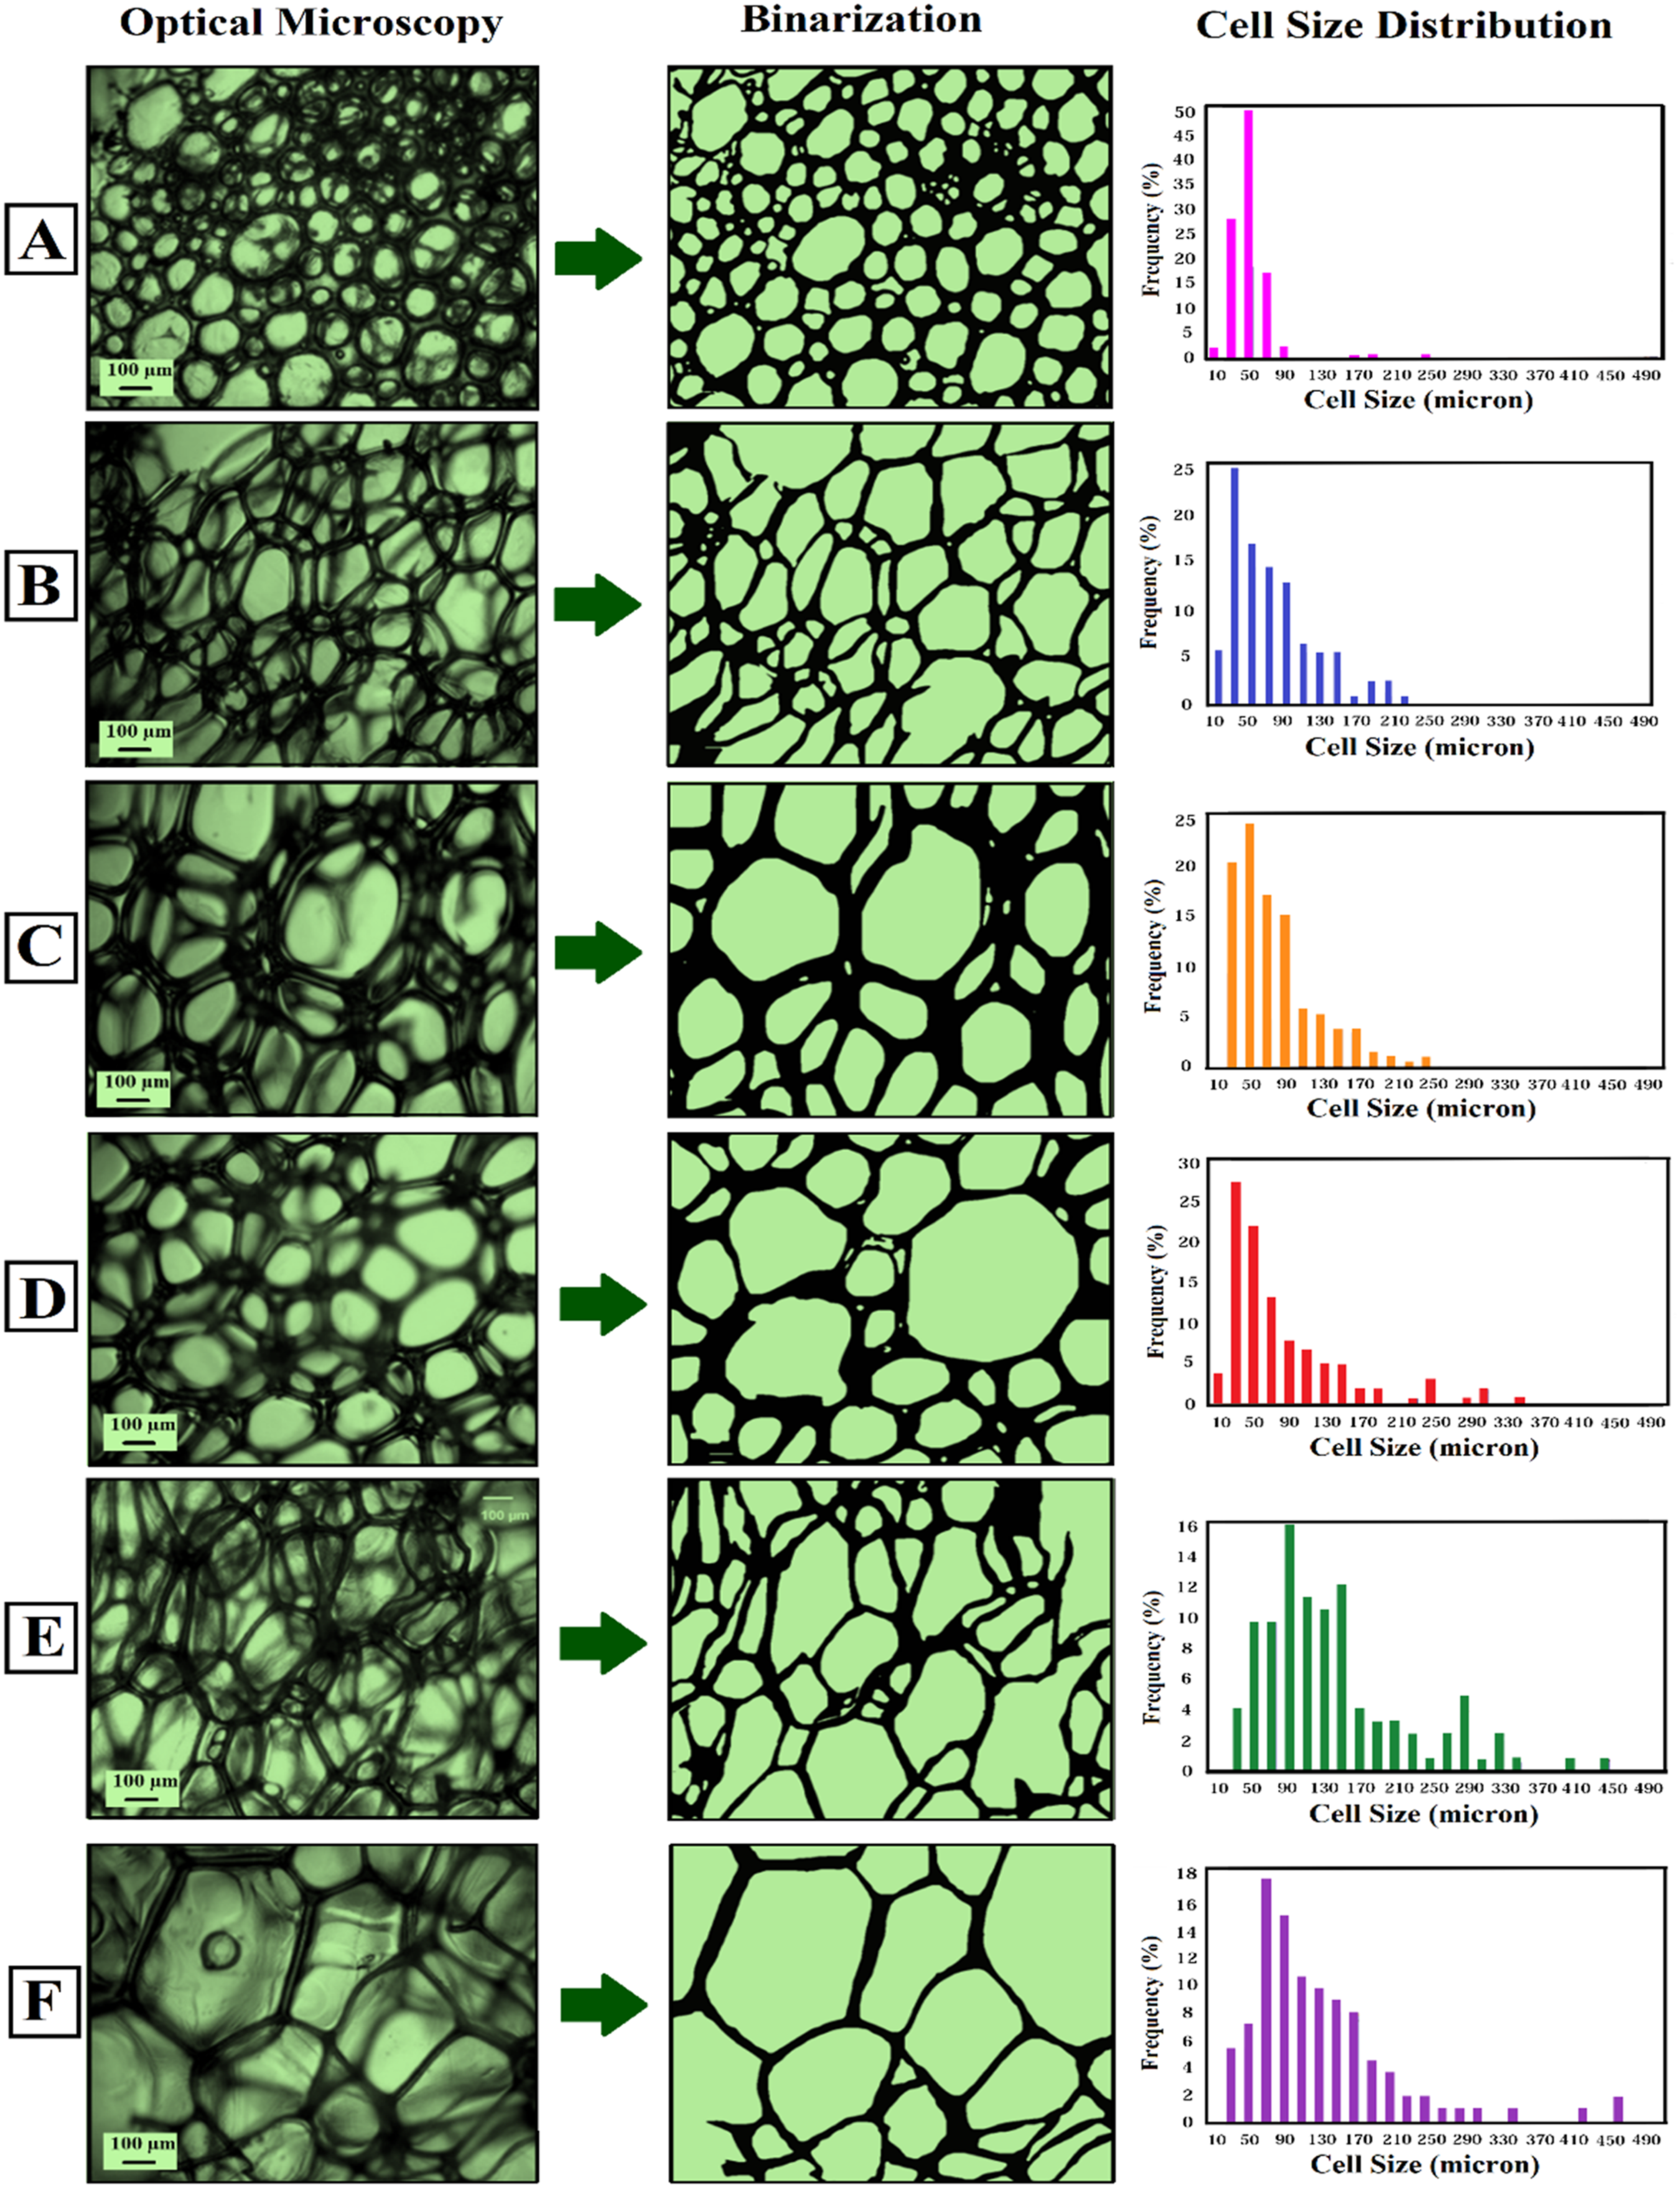
The physical properties of the produced PUFs.
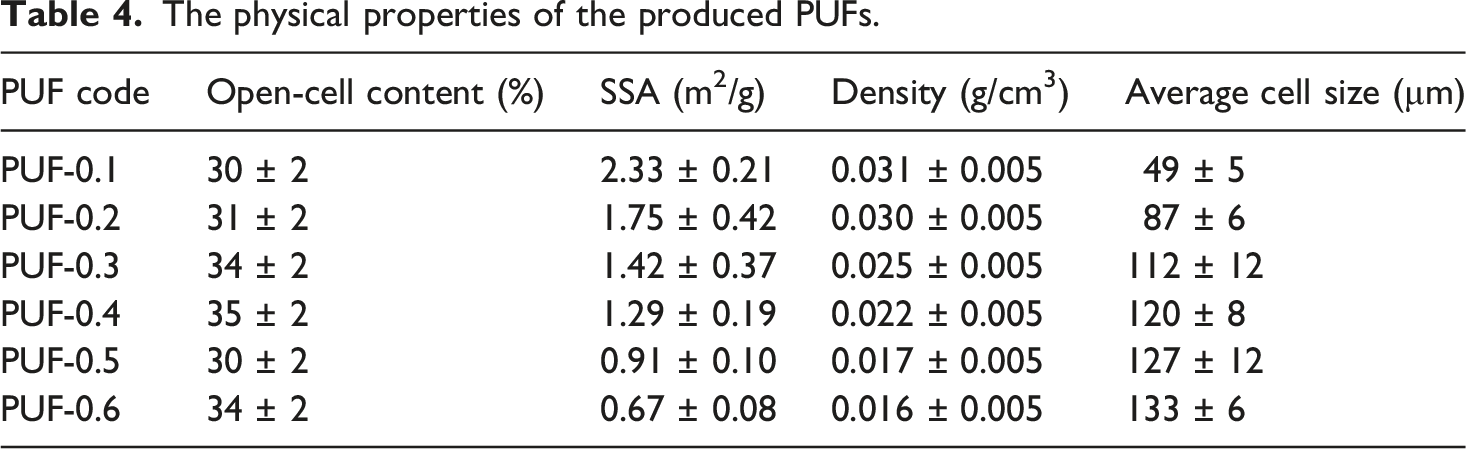
The results indicate that a higher amount of tertiary amine catalyst mixture leads to larger cell sizes and lower foam densities, as shown in Table 4. This trend suggests that the amine catalyst mixture exerts a stronger influence on the isocyanate-water reaction rather than on the isocyanate-polyol or isocyanate-amine reactions, thereby increasing gas evolution during foaming and promoting bubble growth. As a result, higher amine catalyst concentrations were associated with larger cells and greater cell irregularity.
Log (Nr)-Log(r) diagram for each PUF was graphed and plotted in Figure 2 to calculate the Df, based on relations (3) and (4). The fitted linear trendline, associated equations, and R-squared values (R2) are displayed in Figure 2 for all PUFs. Log (Nr)-Log(r) plot and calculated Df for the prepared PUFs.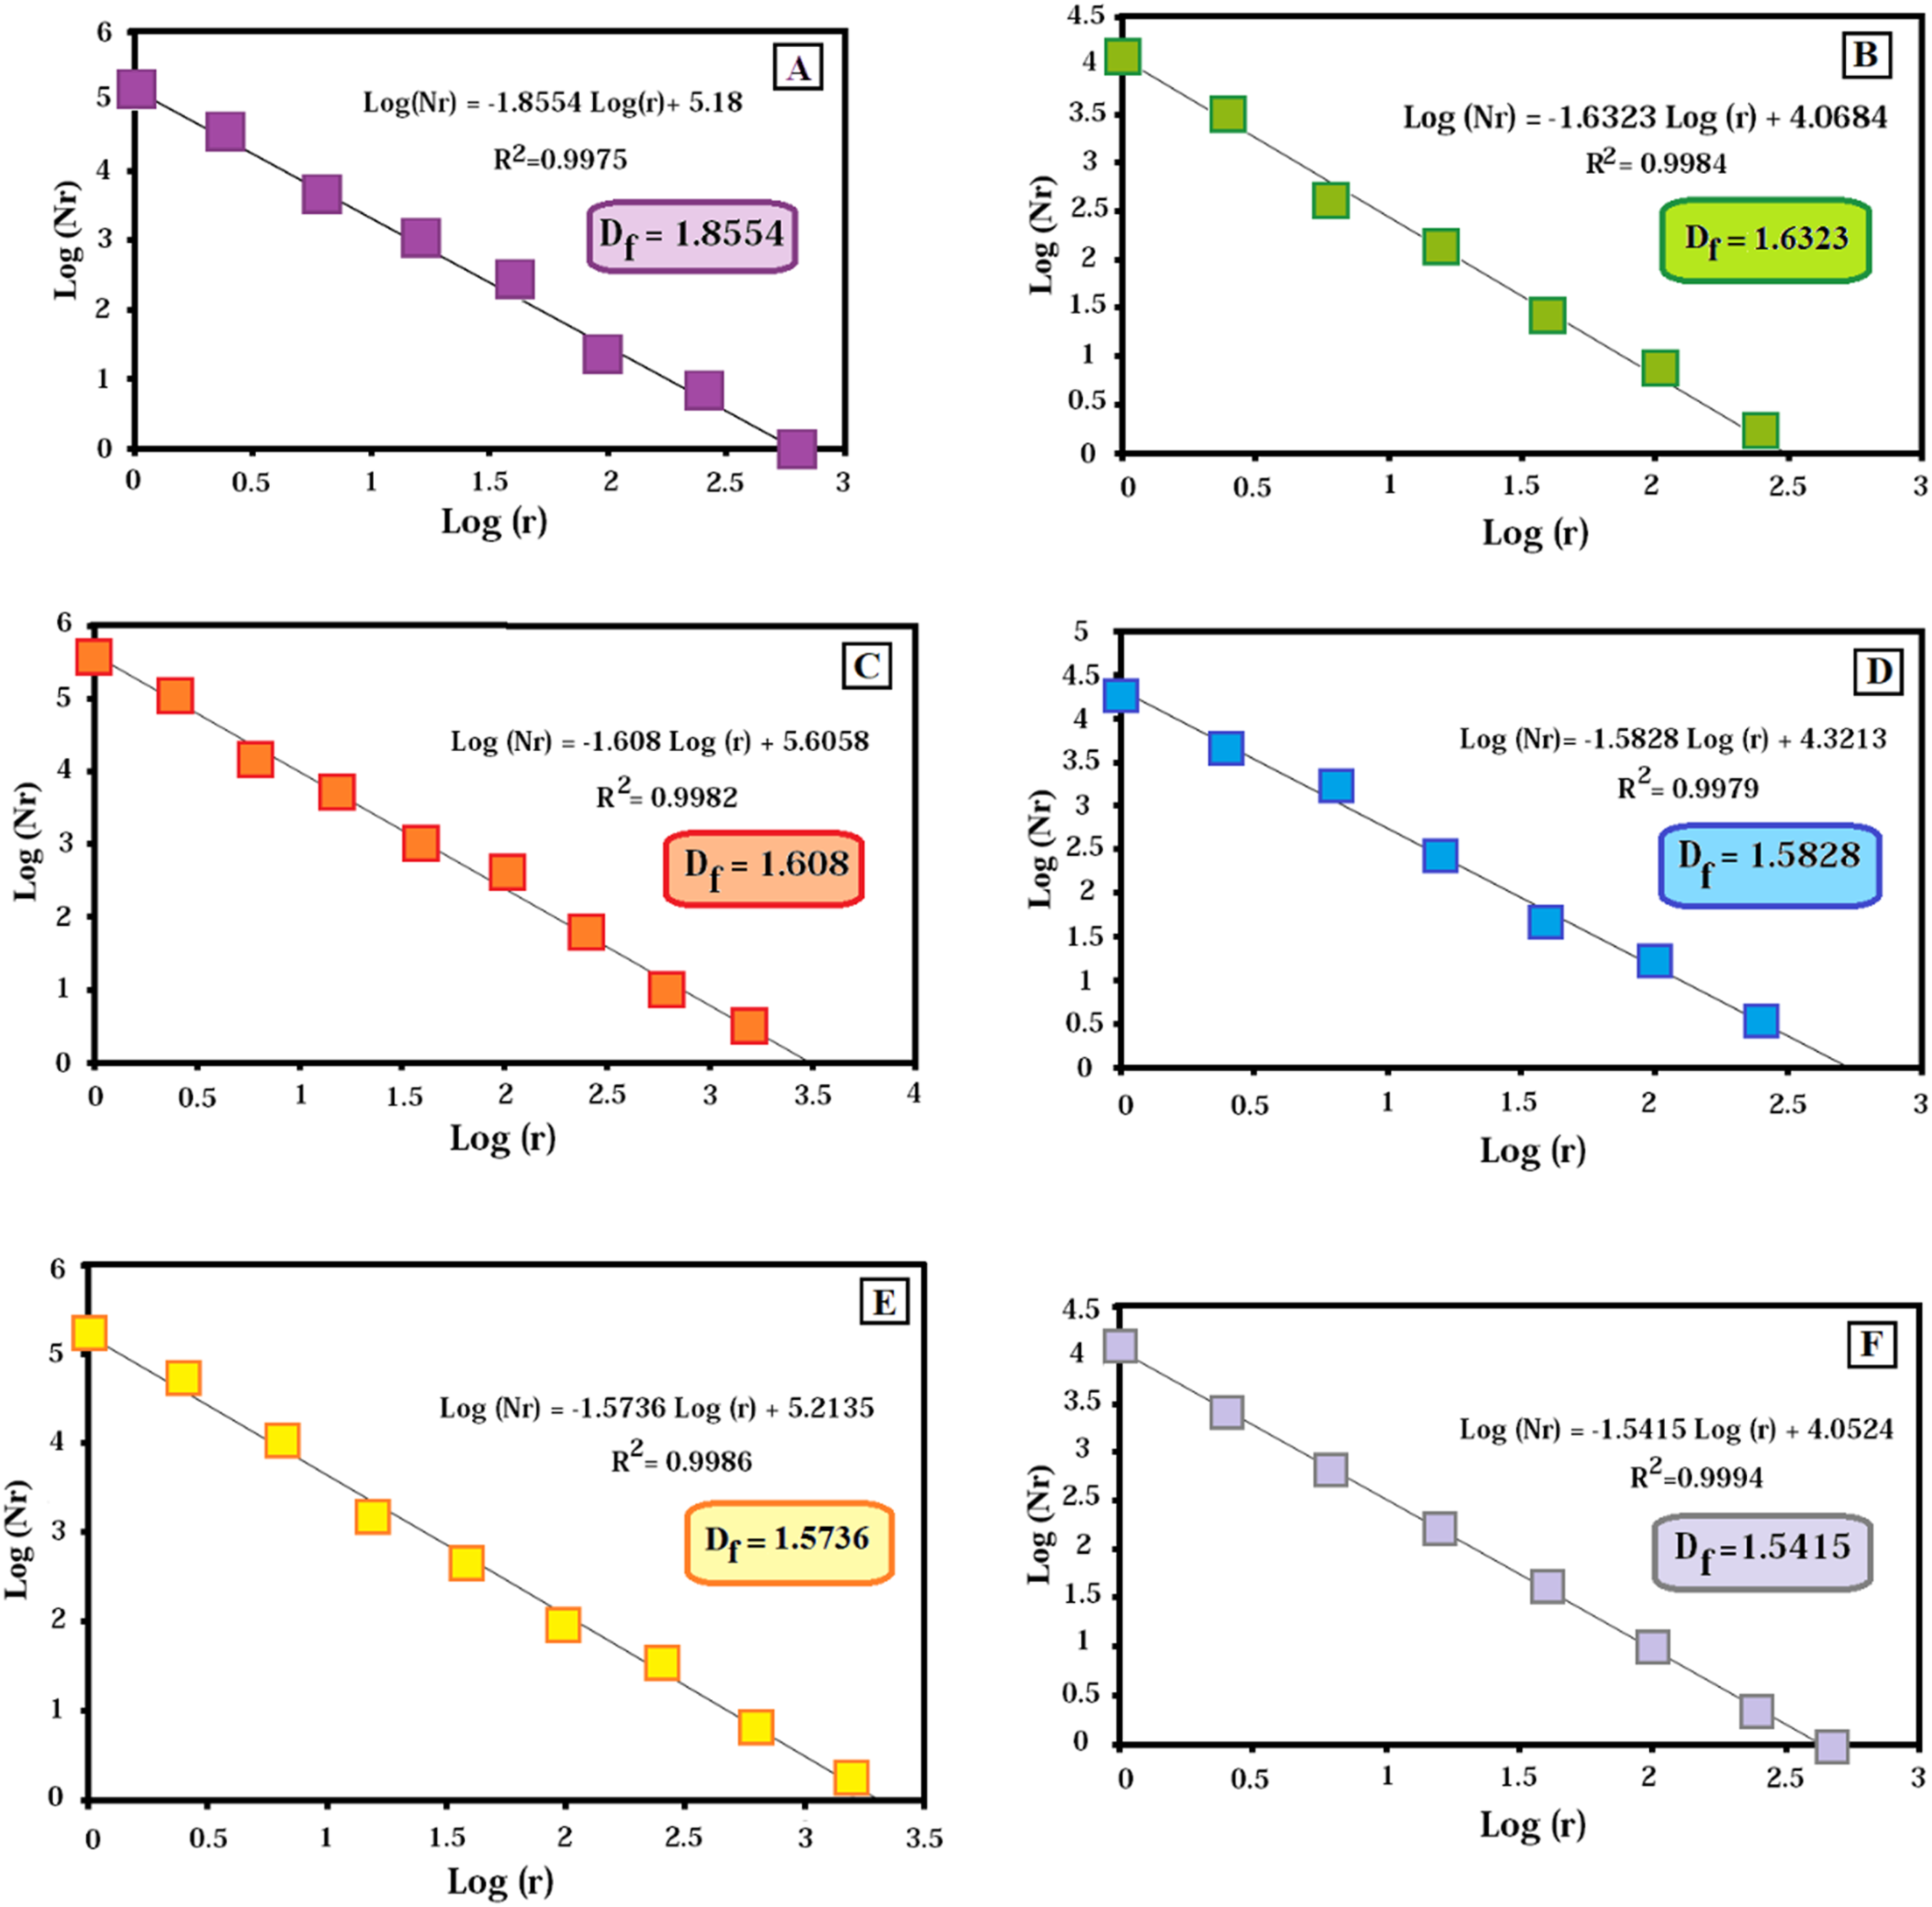
As presented in Figure 2, the resultant Df for PUF-0.1, PUF-0.2, PUF-0.3, PUF-0.4, PUF-0.5, and PUF-0.6 are 1.8554 ± 0.0120, 1.6323 ± 0.0226, 1.6080 ± 0.0119, 1.582 ± 0.0107, 1.5736 ± 0.0361, 1.5415 ± 0.0096, respectively. Also, the resultant R2 for PUF-0.1, PUF-0.2, PUF-0.3, PUF-0.4, PUF-0.5, and PUF-0.6 are 0.9975, 0.9984, 0.9982, 0.9979, 0.9986, and 0.9994, respectively. All R2 are greater than 0.99; hence, the calculated Df values attributed to each PUF are reliable and practical.
Although 2D optical microscopy cannot completely consider the 3D tortuosity and connectivity of PUFs, the multi-directional sampling strategy used in this study (20 images per formulation taken from bottom, middle, and top regions in both horizontal and vertical orientations) certified statistical representativeness of the analyzed sections. The very high R2 values (>0.99) obtained from the Log(Nr)-Log(r) plots indicate robust self-similarity and support the reliability of the 2D box-counting method for extracting Df. While micro-computed tomography (micro-CT) can provide full 3D morphological information, the goal of this work was to establish a relative morphological descriptor (Df) using a method that is low-cost, simple, and widely accessible to researchers, students, and industry practitioners. Although 2D fractal analysis does not fully show 3D features such as pore-throat geometry, pore connectivity, and transport tortuosity, it offers a reproducible and practical descriptor for comparative evaluation of cellular complexity under same imaging and processing conditions.
Dye removal performance of polyurethane foams
As reported in Table 4, the average pore and cell size of PUFs is predominantly distributed in the range of 49-133 μm, indicating a bigger size compared to that of MB dye molecules (molecular length: 1.4 nm, hydrodynamic diameter: 1.5–2.0 nm, and aggregated form: 2–3 nm); thus, the diffusion of dyes in pores, cells, cavities, and channels of PUFs, as well as adsorption on the active sites are provided. 21
As stated by previous studies, MB adsorption by PUF is strongly pH sensitive. It was proven that PUFs generally have the highest removal efficiency at pH > 4. This can be interpreted primarily that at pH < 4, high proton concentration (H+) in the dye solution contests with MB as cationic dyes, leading to reduced MB adsorption by the whole surface of PUF. Notably, the surface of PUF is negatively charged, making it simpler to interact with cationic MB dyes when the pH exceeds 4. In other words, when the pH rises, the charge density of the MB solution lowers, resulting in a greater attractive force between MB molecules and the PUF surface, which enhances the adsorption efficiency. These studies discovered that electrostatic forces and pH are crucial in the adsorption process, and significantly, the interaction between dyes and adsorbents.21,34
Moreover, the pH level of MB solutions with varying primary concentrations differs and will alter before and after adsorption under natural circumstances. As the primary concentration of MB rises, the resulting pH of the MB solution likewise rises, revealing that MB, as a phenothiazine salt, exhibits alkalinity when dissolved in water. Furthermore, the pH level of the MB solution drops after adsorption due to the reduced MB concentration. 21 So, the dye removal performance of PUFs was assessed in a wide range of concentrations, including both high (100, 300, 500, 700, and 900 mg/L) and low (10, 30, 50, 70, and 90 mg/L).
Furthermore, it is worth mentioning that the chemical structure of PUF is largely determined by the reaction between isocyanate groups, hydroxyl groups, and reactive amines, forming urethane/urea linkages. In this study, the isocyanate index, water content, and type and amount of polyol, isocyanate, chain extender, were kept fixed for all PUFs. Hence, the main chemical backbone of the PUFs remains unaffected despite differences in amine catalyst content. It should be noted that only foaming processing can slightly affect microphase separation and hard-soft domain formation.23,33,34 Because no extra reactive functional groups were employed in formulation, no changes in stoichiometry happened, confirmed by FITR and DSC analyses. Therefore, the density of urethane/urea linkages and the resulting chemical functionality responsible for dye adsorption remain basically constant in all PUFs. In more details, DSC (Figure S3 in SI) and FTIR (Figure S2 in SI) analyses specify that the PUF samples have highly similar thermal behavior and chemical structures. Though slight differences in microphase organization rising from differences in foaming kinetics cannot be totally excluded, the experimental results suggest that the leading differences among the PUFs originate from changes in cellular morphology. Thus, the achieved variations in adsorption performance are mainly associated with morphological factors rather than main chemical structural differences.
Since MB adsorption in unmodified PUFs mostly occurs through physical interactions (van der Waals forces and electrostatic attraction) rather than chemical interactions, the detected differences in dye removal tests are chiefly ascribed to morphological variations, such as cell size, accessible surface area, tortuosity, and fractal dimension rather than chemical structural changes. Consequently, only morphological parameters of the formed PUFs by amine catalysts in different concentrations affect the dye adsorption effectiveness.
The dye removal efficiency (E%) of PUFs immersing in the MB solutions with high (100, 300, 500, 700, and 900 mg/L) and low (10, 30, 50, 70, and 90 mg/L) concentrations after 24 h is represented in Figure 3(a) and (b), respectively. The dye removal efficiency of different PUFs immersed in MB solutions with (a): high concentrations and (b): low concentrations for 24 h.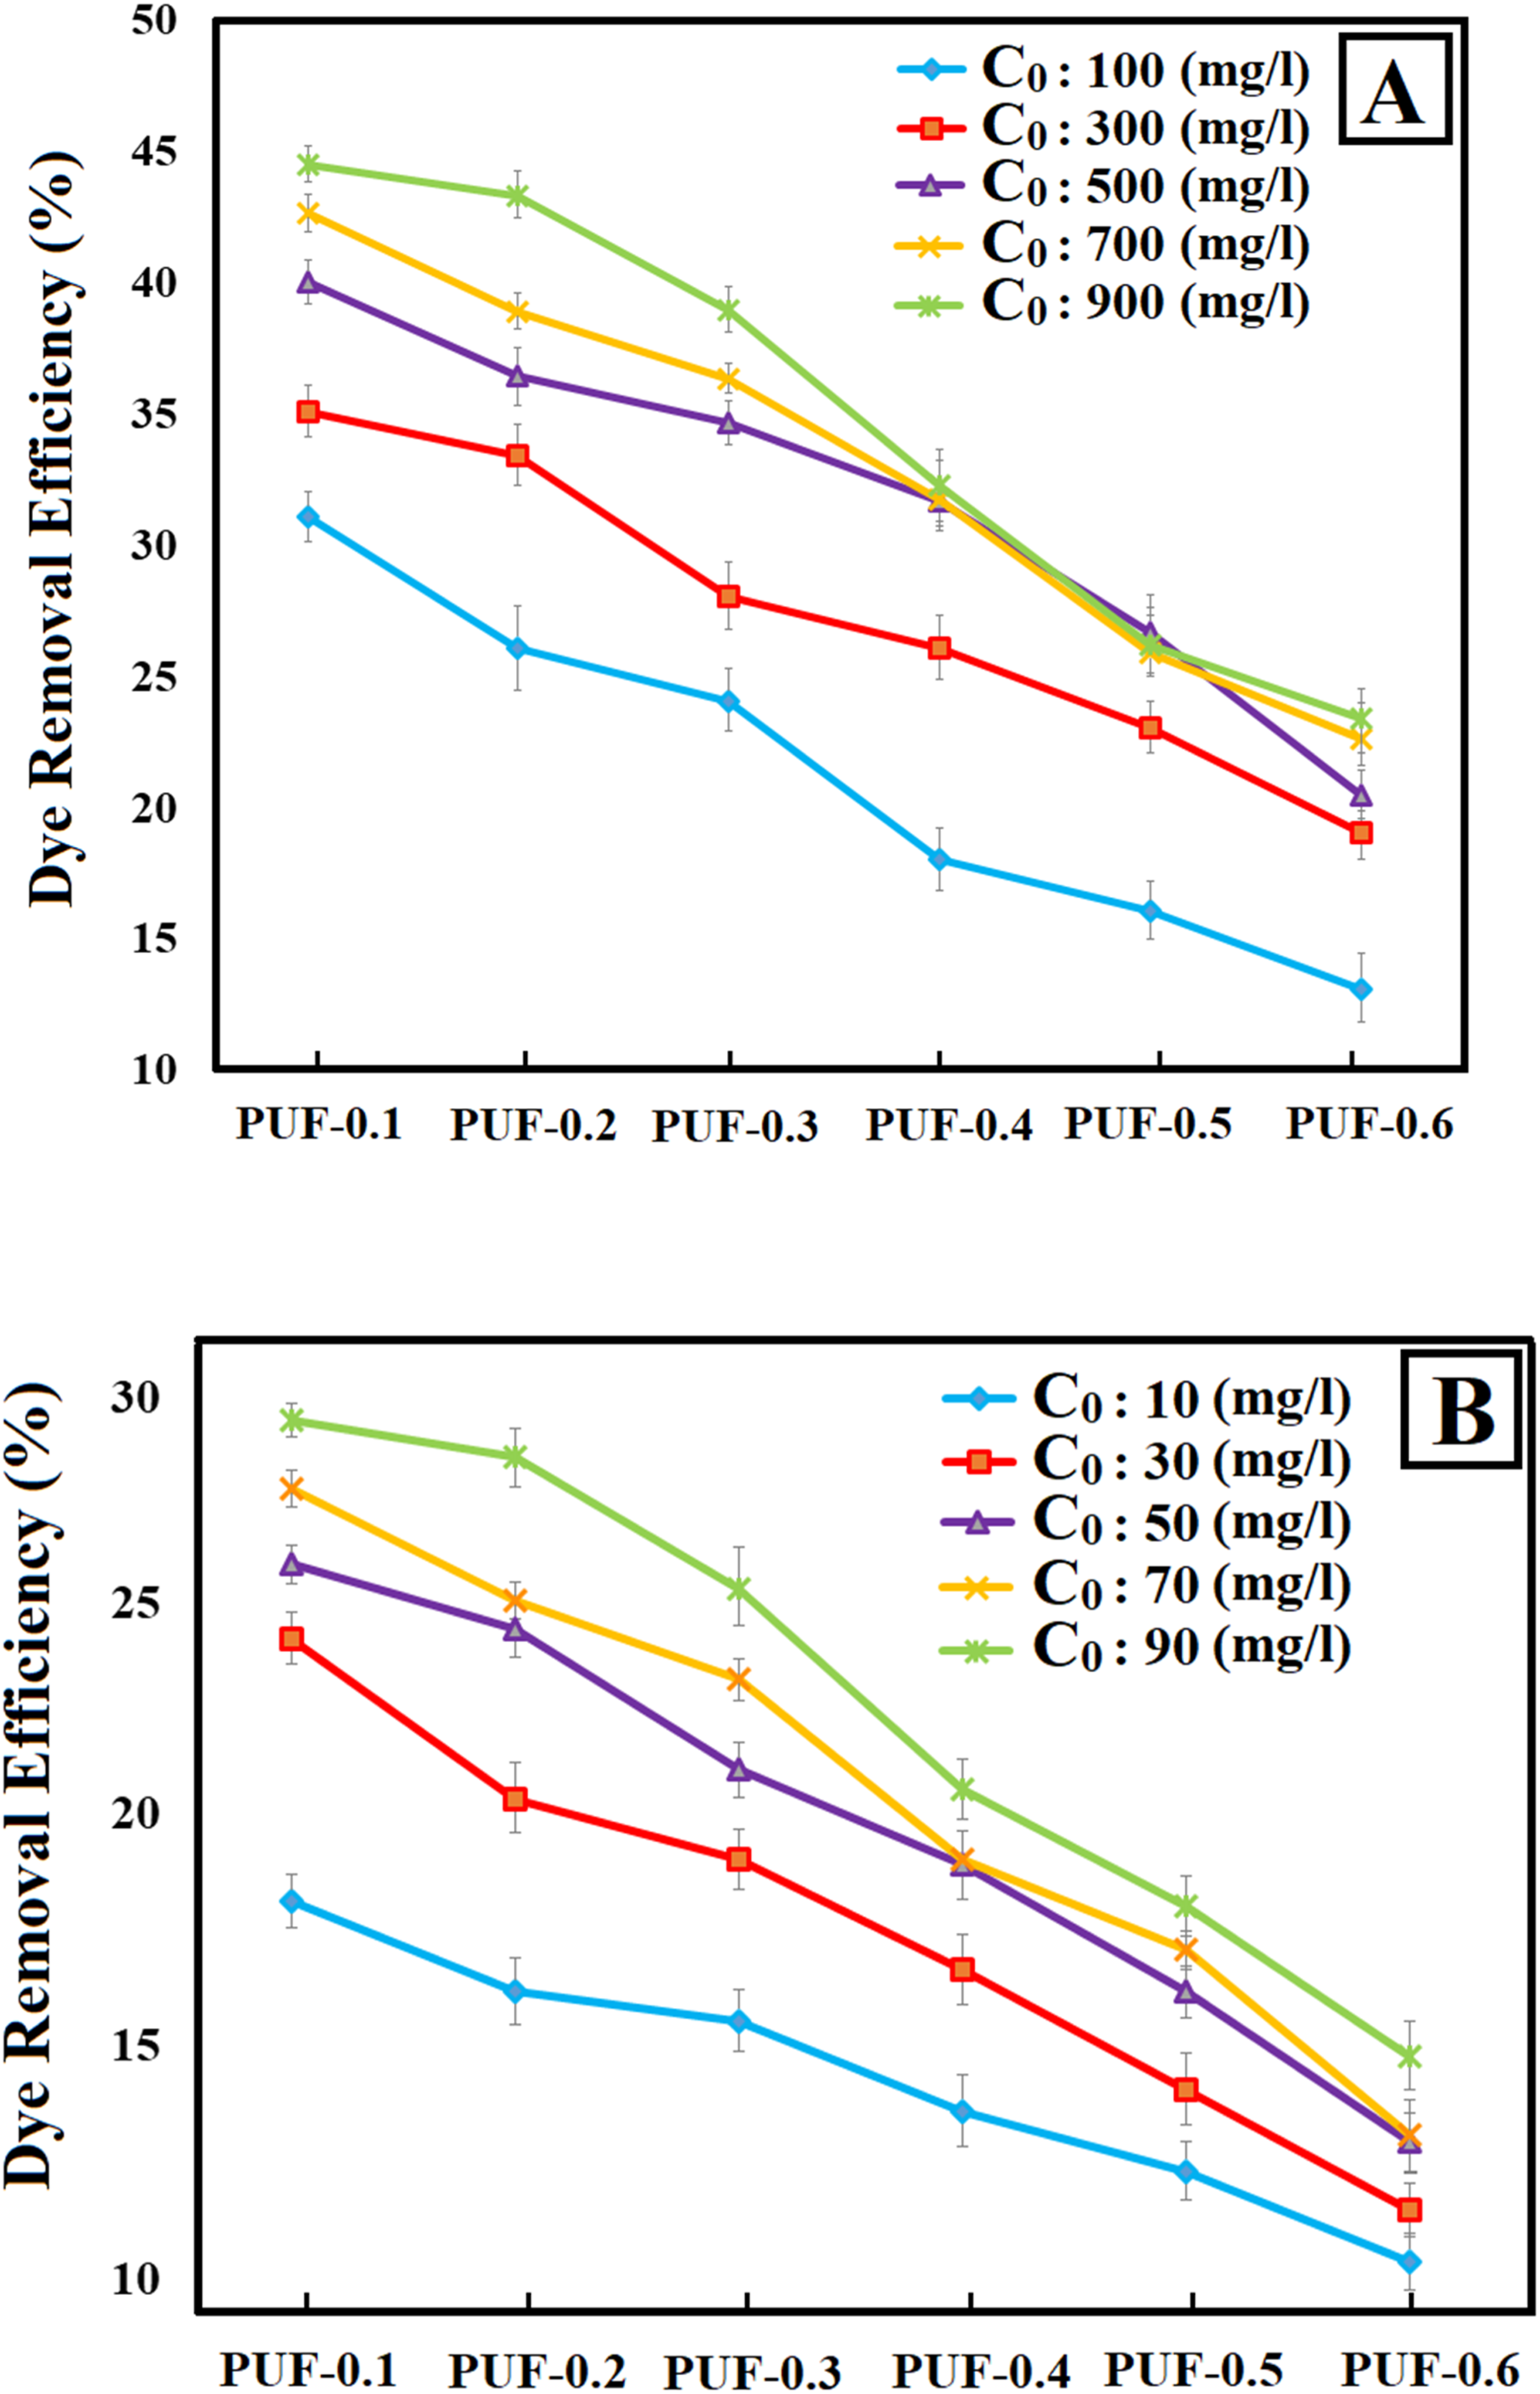
According to Figure 3(a) and (b), the dye removal efficiency of PUFs is boosted by increasing the concentration of MB solutions from 100 to 900 mg/L or even from 10 to 90 mg/L. Therefore, these kinds of PUFs have appropriate performance to adsorb MB molecules immersed in MB solutions with both high and low concentrations. Interestingly, by incrementing the amount of amine catalyst mixture from 0.2 to 1.2 g in formulations of PUF-0.1 to PUF-0.6, the dye removal efficiency of PUFs drops at both low and high MB concentrations. Moreover, the ACe (mg/g) of each PUF as adsorbents after 24 h of immersion in MB solutions was calculated and represented in Figure 4(a) and (b), respectively. The ACe (mg/g) of different PUFs immersed in the MB solutions with (a): high concentrations and (b): low concentrations for 24 h.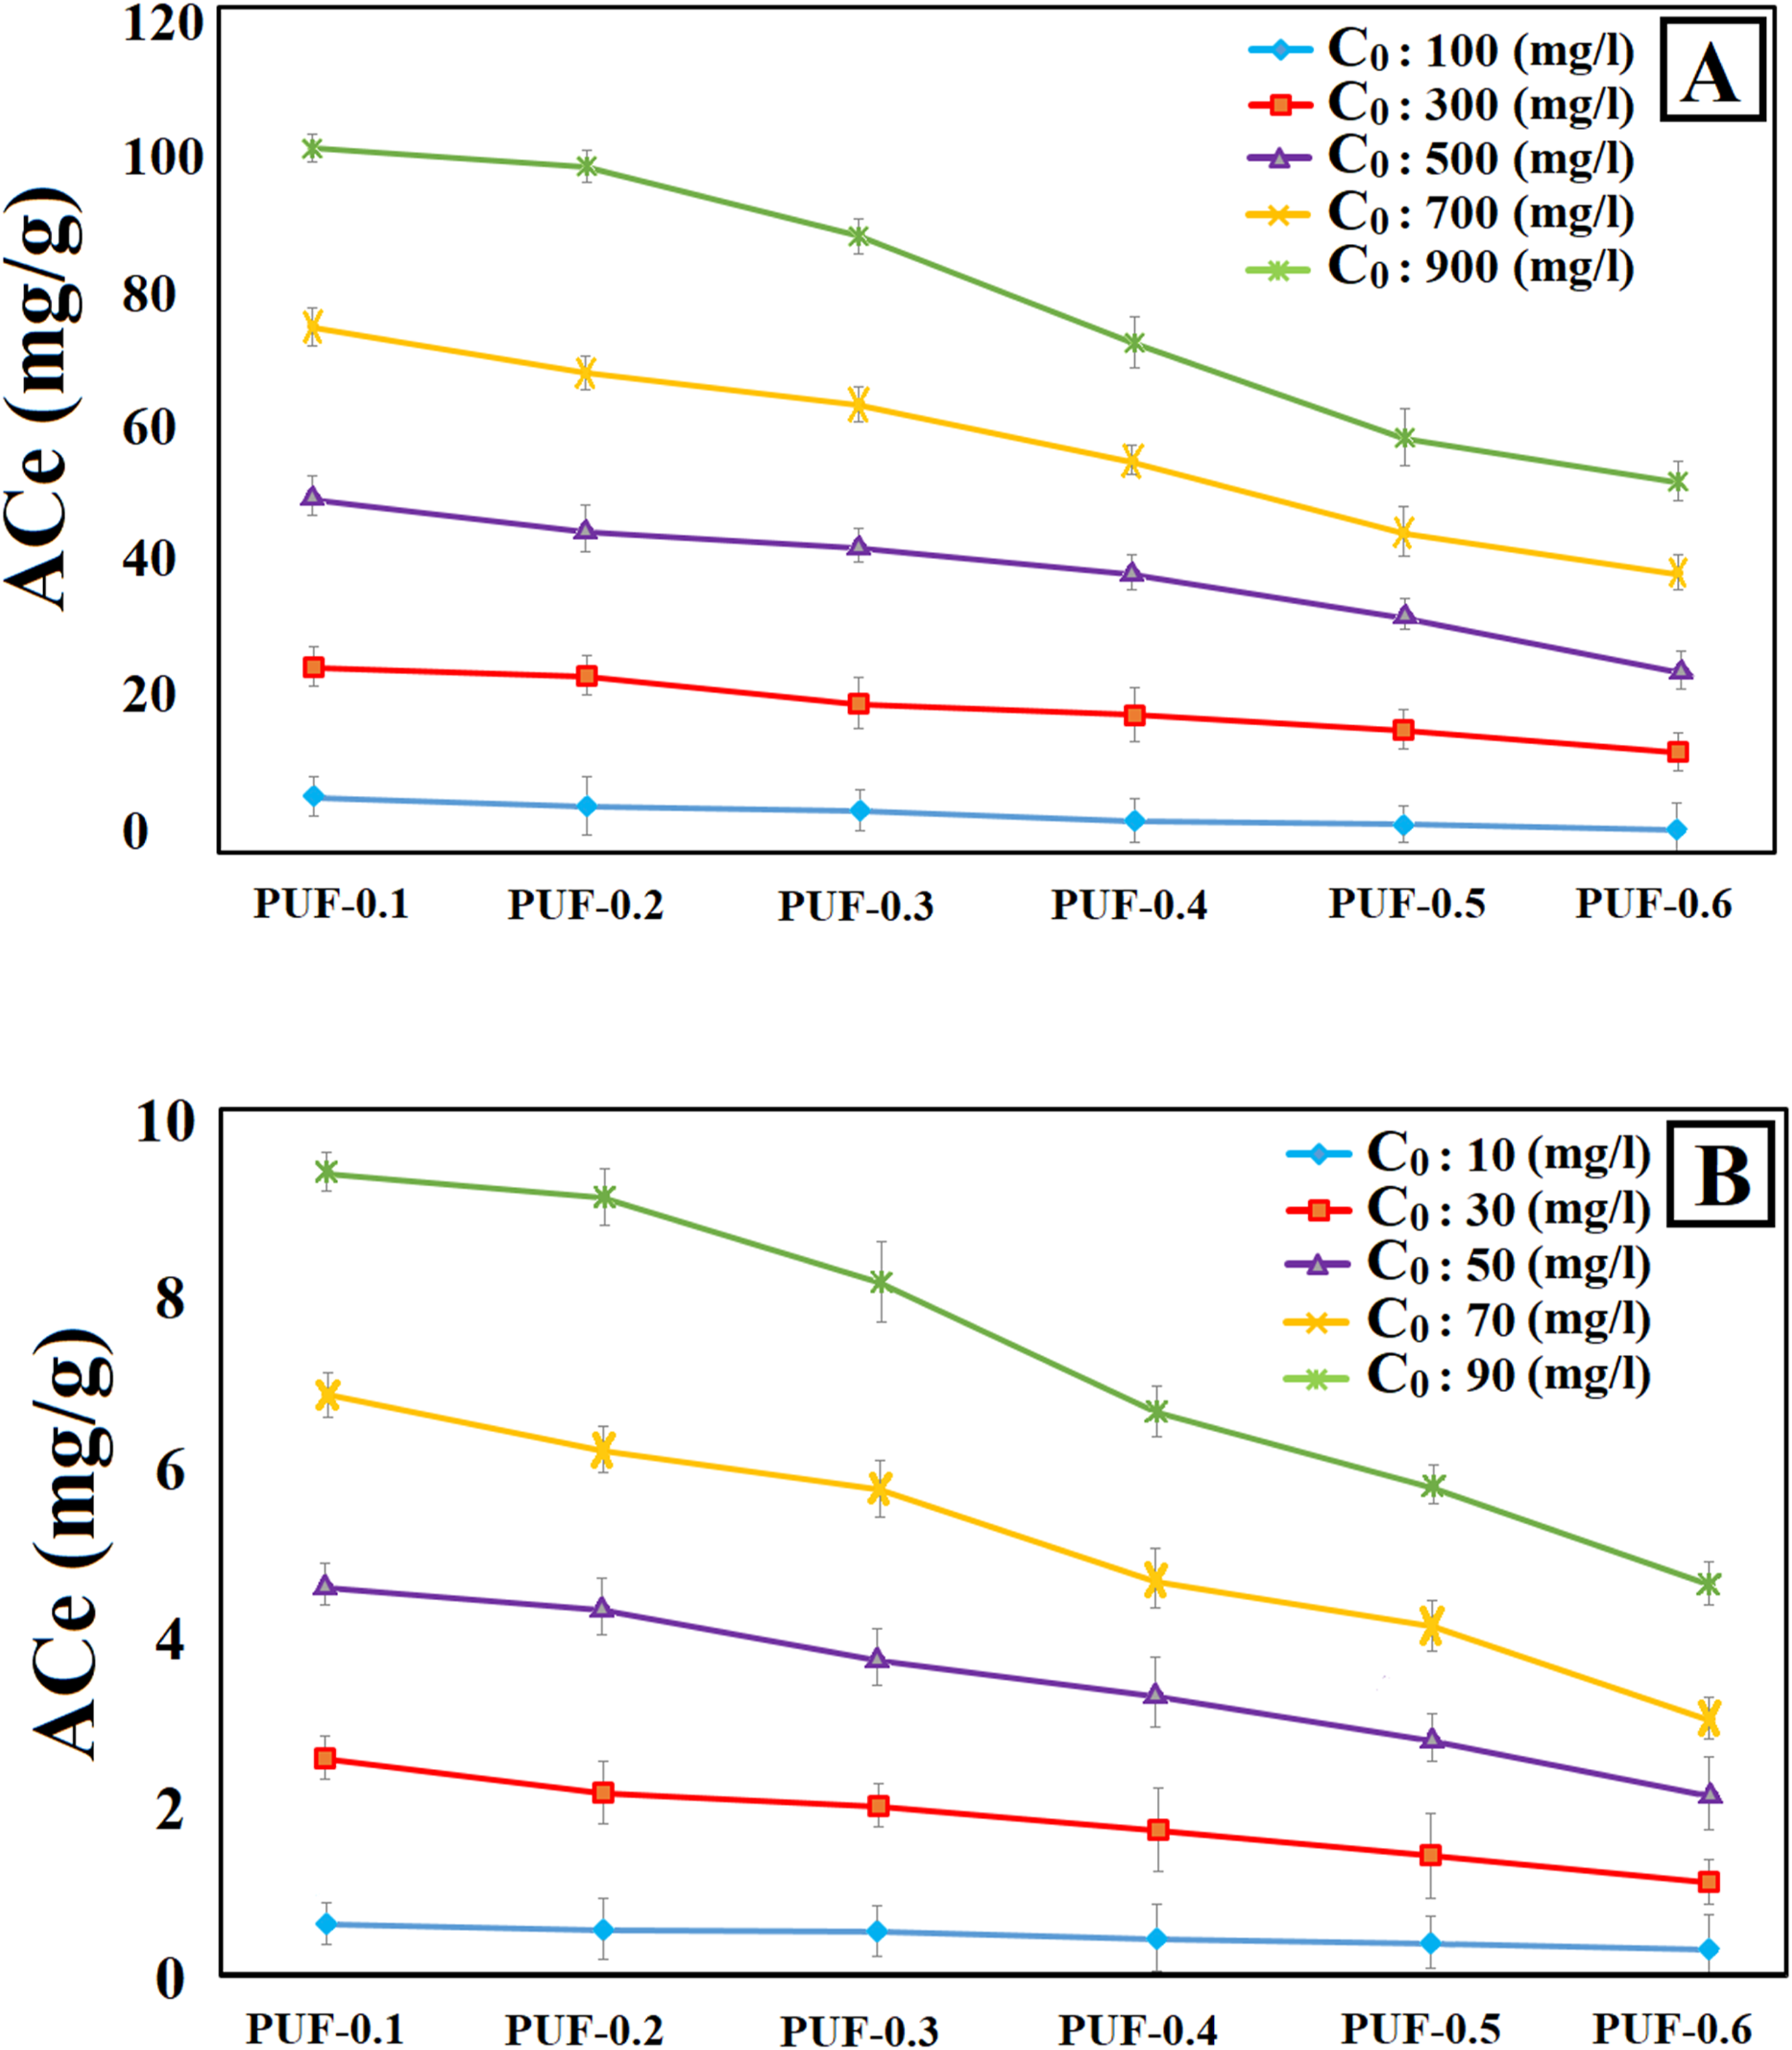
Regarding Figure 4(a), the ACe of each PUF increases by increasing the MB solution concentration from 100 to 900 mg/L. This behavior can also be observed in MB solutions with low concentration in Figure 4(b). Figures 3 and 4 exhibit that PUFs can perform as an adsorbent of MB molecules in both high and low-concentration MB solutions. However, the ACe of PUFs decreases by increasing the amine catalytic content from 0.2 to 1.2 g in the formulation of PUF-0.1 to PUF-0.6. Thus, increasing the amine catalytic agents rather than 0.2 g in the formulation has no positive effect on the performance of PUFs as dye adsorbents.
According to Figures 3 and 4 and Table 4, the dye removal efficiency of all PUFs decreases by a decrement of density from 0.031 to 0.016 g/cm3, an increase of average cell size from 49 to 133 µm, and fluctuation of open-cell content in the range of 30–35%. In more detail, reducing the cell size from 133 to 49 µm leads to an increase in the dye adsorption performance.
In contrast, a rise in the cell size distribution at constant open-cell content reduces the dye removal performance. In more details, a narrower cell size distribution, demonstrating a more uniform cellular structure, results in higher dye removal efficiency, as it offers more evenly distributed solid phase, higher tortuosity, and fewer large voids. Thus, cell size, interconnecting pathway, cell morphology, open-cell content, density, etc., are all detrimental to the adsorption performance of PUFs. It is worth mentioning that during the formation of PUF (formation of cellular structure and chemical urea-urethane linkage), cell rupturing arises due to the process of draining, which partially increases open-cell content. Moreover, it was stated that the high level of micro-phase separation may lead to stress concentration districts and extensional thinning by accumulation of hard microdomains in the PUF, leading to cell opening by cellular rupture.20,23 Owing to the fixed chemical formulation of different PUFs, the amounts of urea-urethane linkages, micro-phase separation, and hard microdomains are constant. Therefore, the amount of open-cell content is approximately the same in all PUF samples. According to Figures 3 and 4, the dye removal performance of PUFs in all ranges of MB solutions at 25 
Hence, PUF-0.1 and PUF-0.6 possess the highest and the lowest adsorption capacity and dye removal efficiency, respectively. Accordingly, the PUFs with a smaller average cell size and lower cell size distribution endow better adsorption efficiency owing to the higher tortuosity and more available struts and walls.
To establish an applicable relationship between morphological properties and dye removal behavior of PUFs, the dye removal efficiency of PUFs is plotted against the average Df value for MB solutions with both high (100, 300, 500, 700, and 900 mg/L) and low (10, 30, 50, 70, and 90 mg/L) concentrations in Figure 5(a) and (b), respectively. The fitted second-order polynomial trendline, corresponding equations, and R2 values are exhibited in Figure 5(a) and (b) for all PUFs. Dye removal efficiency versus Df of PUFs in MB solution with (a): high concentrations and (b): low concentrations.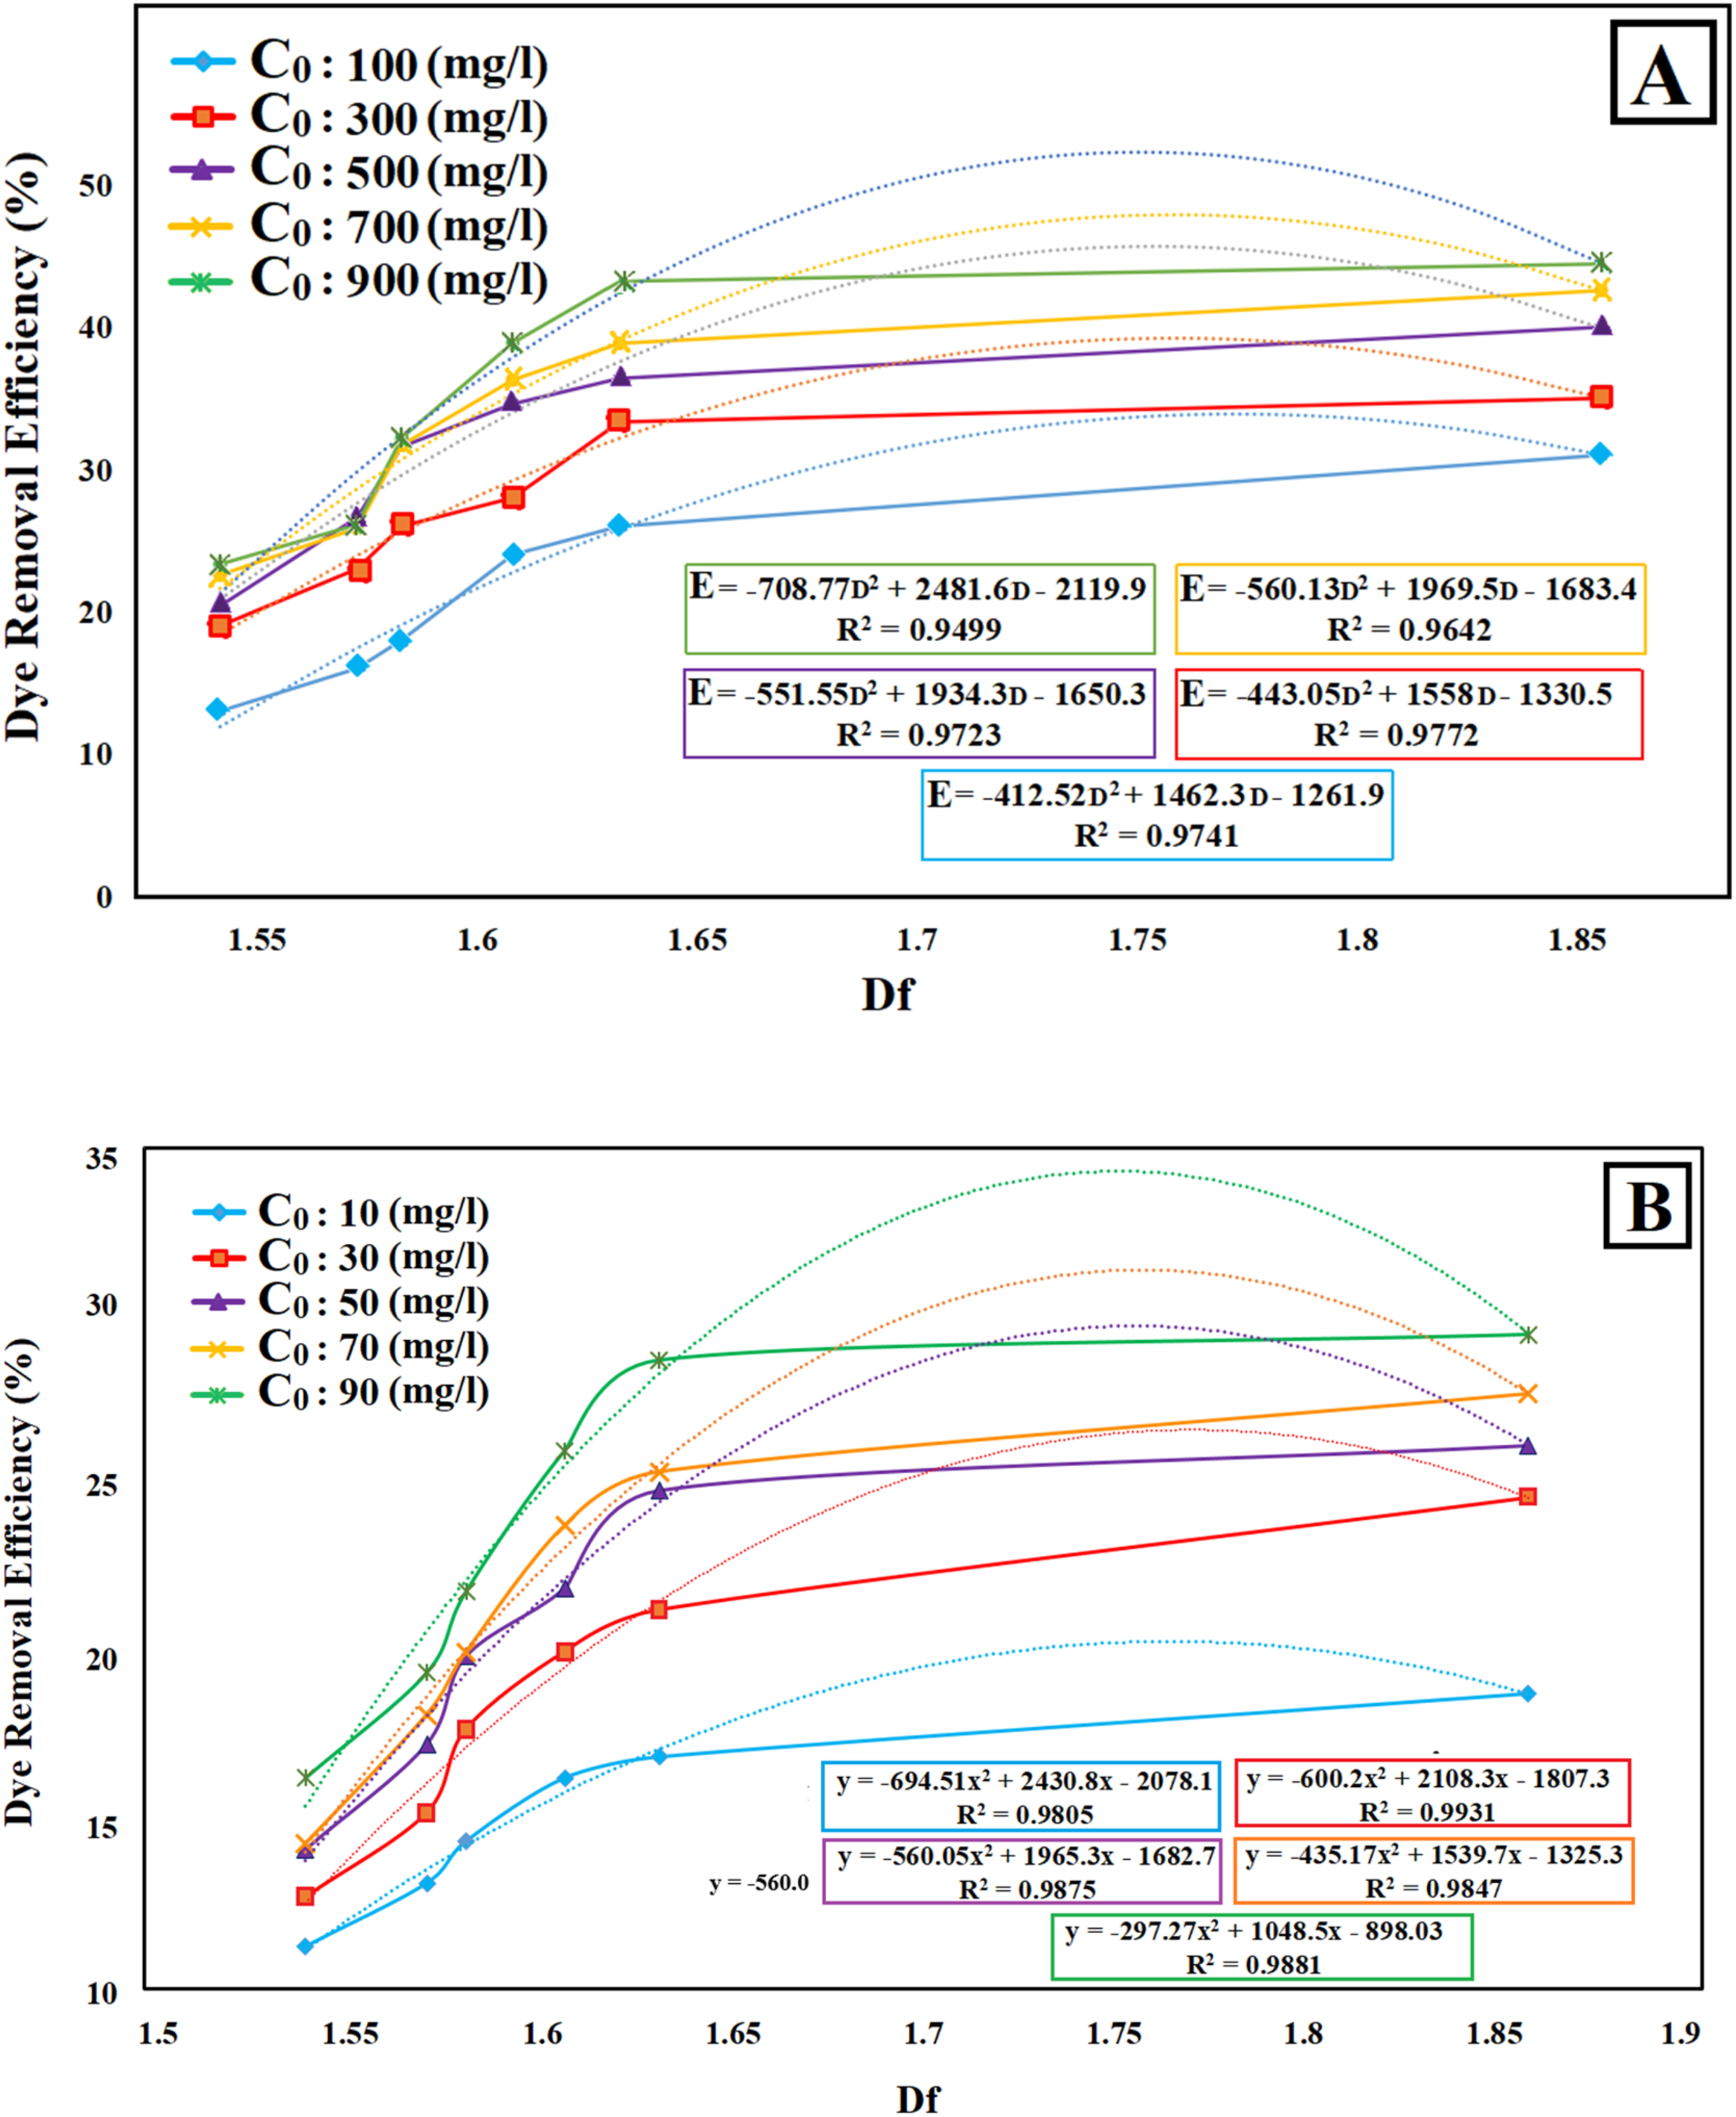
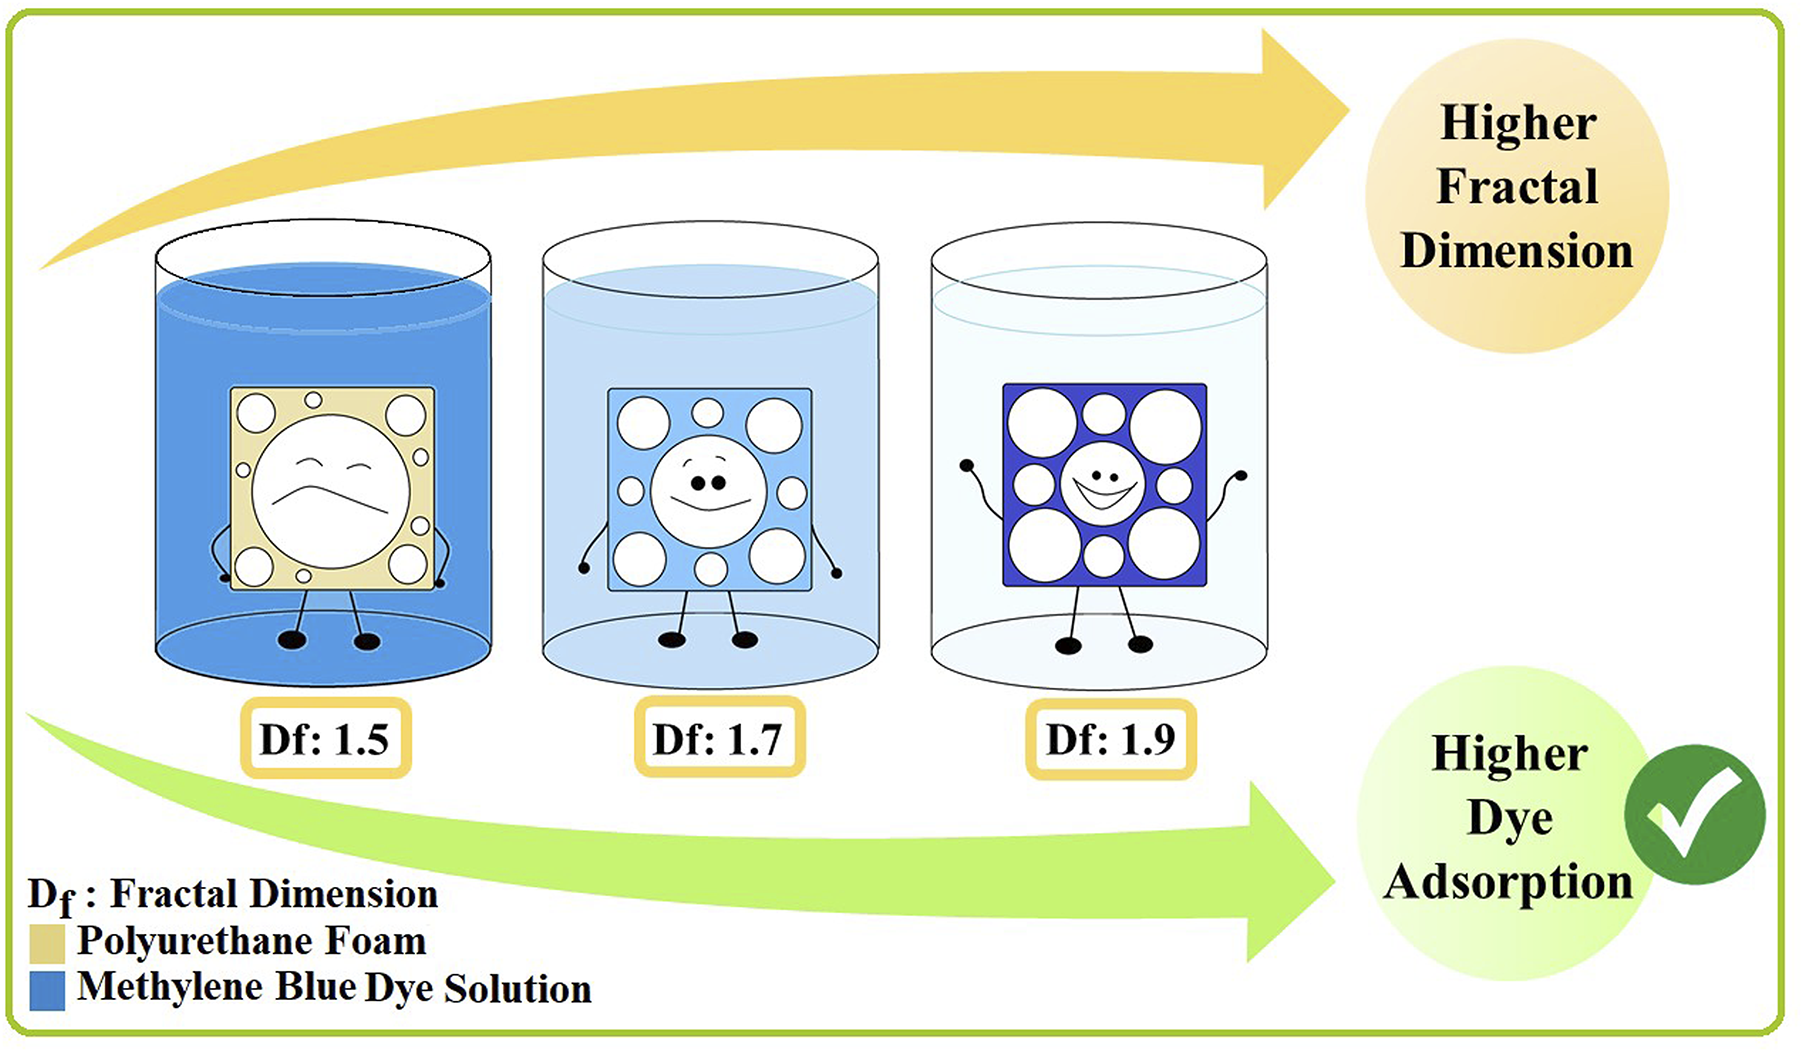
As depicted in Figure 5(a) and (b), incrementing the Df of PUFs for all MB concentrations leads to higher dye removal efficiencies. Thus, PUFs with higher Df represent a higher dye removal performance. As indicated in Figure 5(b), R2 values of the correlation between the dye removal efficiency and Df for all MB solutions with high MB concentrations, including 100, 300, 500, 700, and 900 mg/L, are 0.9741, 0.9772, 0.9723, 0.9642, and 0.9499, respectively. Also, the obtained R2 values for MB solutions with low MB concentrations, including 10, 30, 50, 70, and 90 mg/L, are 0.9805, 0.9931, 0.9875, 0.9847, and 0.9881, respectively. These R2 values indicated that a suitable fit by a second-order polynomial correlation between the dye removal efficiency and Df was achieved for different concentrations. From another point of view, increasing the Df value from 1.5415 to 1.8554 leads to an average rise of the dye removal efficiency by 100% and 116% in high- and low-concentration MB solution conditions, respectively. Accordingly, the dye removal efficiency was enhanced by 108% approximately by turning the Df of PUFs to 1.8554.
To explain more, the total space occupied by the solid phase of an object is recognized as the fractal dimension of the PUFs, which demonstrates the irregularity degree; hence, the solid-phase distribution in a foam can be identified by its fractal dimension. Additionally, a Df greater than 1, especially >1.5, means that the object is highly complex, rough, and space-filling. A higher Df (closer to 2 for surfaces) indicates an incredibly vast surface area relative to its projected size or volume. This highly contactable surface area enhances the available interactions, for example, adsorption, gas exchange, chemical reactions, etc., for specific applications like catalysts, batteries, electrodes, filters, chemical reactors, lungs, roots, etc. In other words, a higher Df permits the structure to interact with more points within a confined space. 24
Therefore, the higher dye removal performance of PUF-0.1 can be interpreted in the way that PUFs with greater Df provide more contactable and accessible surface areas for the adsorption of MB molecules. Subsequently, increasing the interacting area by incrementing the fractal dimension on the molecular scale intensifies the adsorption behavior. In other words, PUFs with greater Df possess higher surface area, space filling, complexity, and robustness, which improves the dye removal adsorption and final efficiency.
The BET findings on Table 4 clearly prove that as the Df increases from 1.5415 to 1.8554, the SSA increases meaningfully from 0.67 to 2.33 m2/g. This 3.5-fold increase in SSA correlates directly to the 108% enhancement in dye removal efficiency.
According to Figure 1 and Table 4, by increasing the amine catalytic agent from 0.2 g for PUF-0.1 to 1.2 g for PUF-0.6, the cell size distribution increases while density and cell size uniformity decrease, which leads to a lower Df. Thus, a greater Df suggests higher density and superior dye adsorption behavior.
Following Table 4, the open-cell content of different PUFs shows no significant changes, with an alteration in the range of 30-35%. However, the trend of the average cell size of PUFs is opposed to the dye removal efficiency at both low and high concentrations of MB solutions. On the other hand, the dye removal efficiency increases from 12 to 45% with an increment of Df of PUF from 1.5415 to 1.8554. These results highlight that dye removal efficiency of PUFs can be anticipated via the fractal dimension measurement, regardless of the physical and morphological properties, including macroscopic density, thickness of cell struts and walls, porosity, cell size (average and distribution), and airflow resistivity. Furthermore, other solid-phase aspects such as stiffness, thermal characteristic lengths, ductility, and viscoelasticity can be predicted by fractal dimension, as demonstrated previously.24,26 In a summing up, PUFs with higher fractal dimension provide more accessible surfaces for adsorption of cationic MB dyes, so that the adsorption performance of PUFs with greater cell integrity, higher density, and lower cell size distribution in a constant open-cell content is superior to that of PUFs with larger cells.
It is worth mentioning that dye removal performance in PUFs is affected by both cellular morphologies of foams and properties of polyurethane solid-phase in cell walls, cell struts, etc. The solid-phase of PUFs determines the chain mobility and free volume, which influences diffusion behavior and permeability.23,26,33 In more detail, the permeability of PUF as porous materials is affected by macroscopic properties (cell size, interconnectivity, tortuosity) and microscopic free volume in the solid-phase. 26 As discussed and confirmed previously, in our study, the chemical formulation (isocyanate index, water content, etc.) were kept constant for all PUF samples, minimalizing variations in the inherent polymer backbone and network structure, as well as related free-volume. In other words, related free-volume in the solid phase remain mainly unchanged. Moreover, the open-cell content varied a little (30-35%), demonstrating similar bulk permeability. So, the achieved differences in dye removal effectiveness are primarily associated with variations in fractal characteristics and cellular morphology rather than negligible changes in the inherent free-volume of the solid-phase. Thus, the Df can be reflected a descriptor mixing interconnectivity, tortuosity, and efficient transport pathways leading to dye diffusion and adsorption.
Adsorption kinetics of polyurethane foams
According to Figures 3(a) and (b) and 5(a) and (b), it is found that the highest dye removal efficiency for the PUF series is attributed to PUF-0.1 (Df: 1.8554), reaching E (%) of 44.5 % in an MB solution with a concentration of 900 mg/L. It should be pointed out that the dye removal efficiency of different PUFs (PUF-0.1, PUF-0.2, PUF-0.3, PUF-0.4, PUF-0.5, and PUF-0.6) immersed in the MB solutions with low and high concentrations varies in the range of 12-44.5 %. These relatively low adsorption efficiencies are caused by the absence of reactive sites on/in the PUF structure consisting of cell walls, cell struts, or cavities, which can react with MB dye molecules. In this situation, the holes and contactable surfaces resulting from open cells in the PUF structure are the main reason for the MB adsorption.
22
According to previous studies, by applying active coatings or employing active agents such as photocatalysts in the PUF structure, the dye removal efficiency of PUFs can be boosted under specific circumstances.35–37 Furthermore, findings in this study specify that the dye removal performance of PUFs can be improved via tuning the fractal dimension, in such a way that PUF with higher fractal dimension provides more accessible surfaces and reach the adsorption equilibrium faster, by Figures 3–5. Consequently, a double synergistic effect can be provided by adding the aforementioned active coatings and active agents into PUFs with an appropriate fractal dimension. The results indicate that PUF-0.1 also has the highest dye adsorption performance in all durations and all MB solutions with varying concentrations. Therefore, it is potentially supposed to be employed for the remediation of industrial wastewater including cationic dyes such a MB. In the following, PUF-0.1 with the highest removal capability is considered to compute the adsorption rate and parameters of adsorption kinetics. The adsorption rate of PUF-0.1 immersed for 4 h in MB solutions having different concentrations varying from 10 to 900 mg/L is depicted in Figure 6. The adsorption rate of PUF-0.1 immersed for 4 h in MB solutions having dissimilar concentrations varying from 10 to 900 mg//L.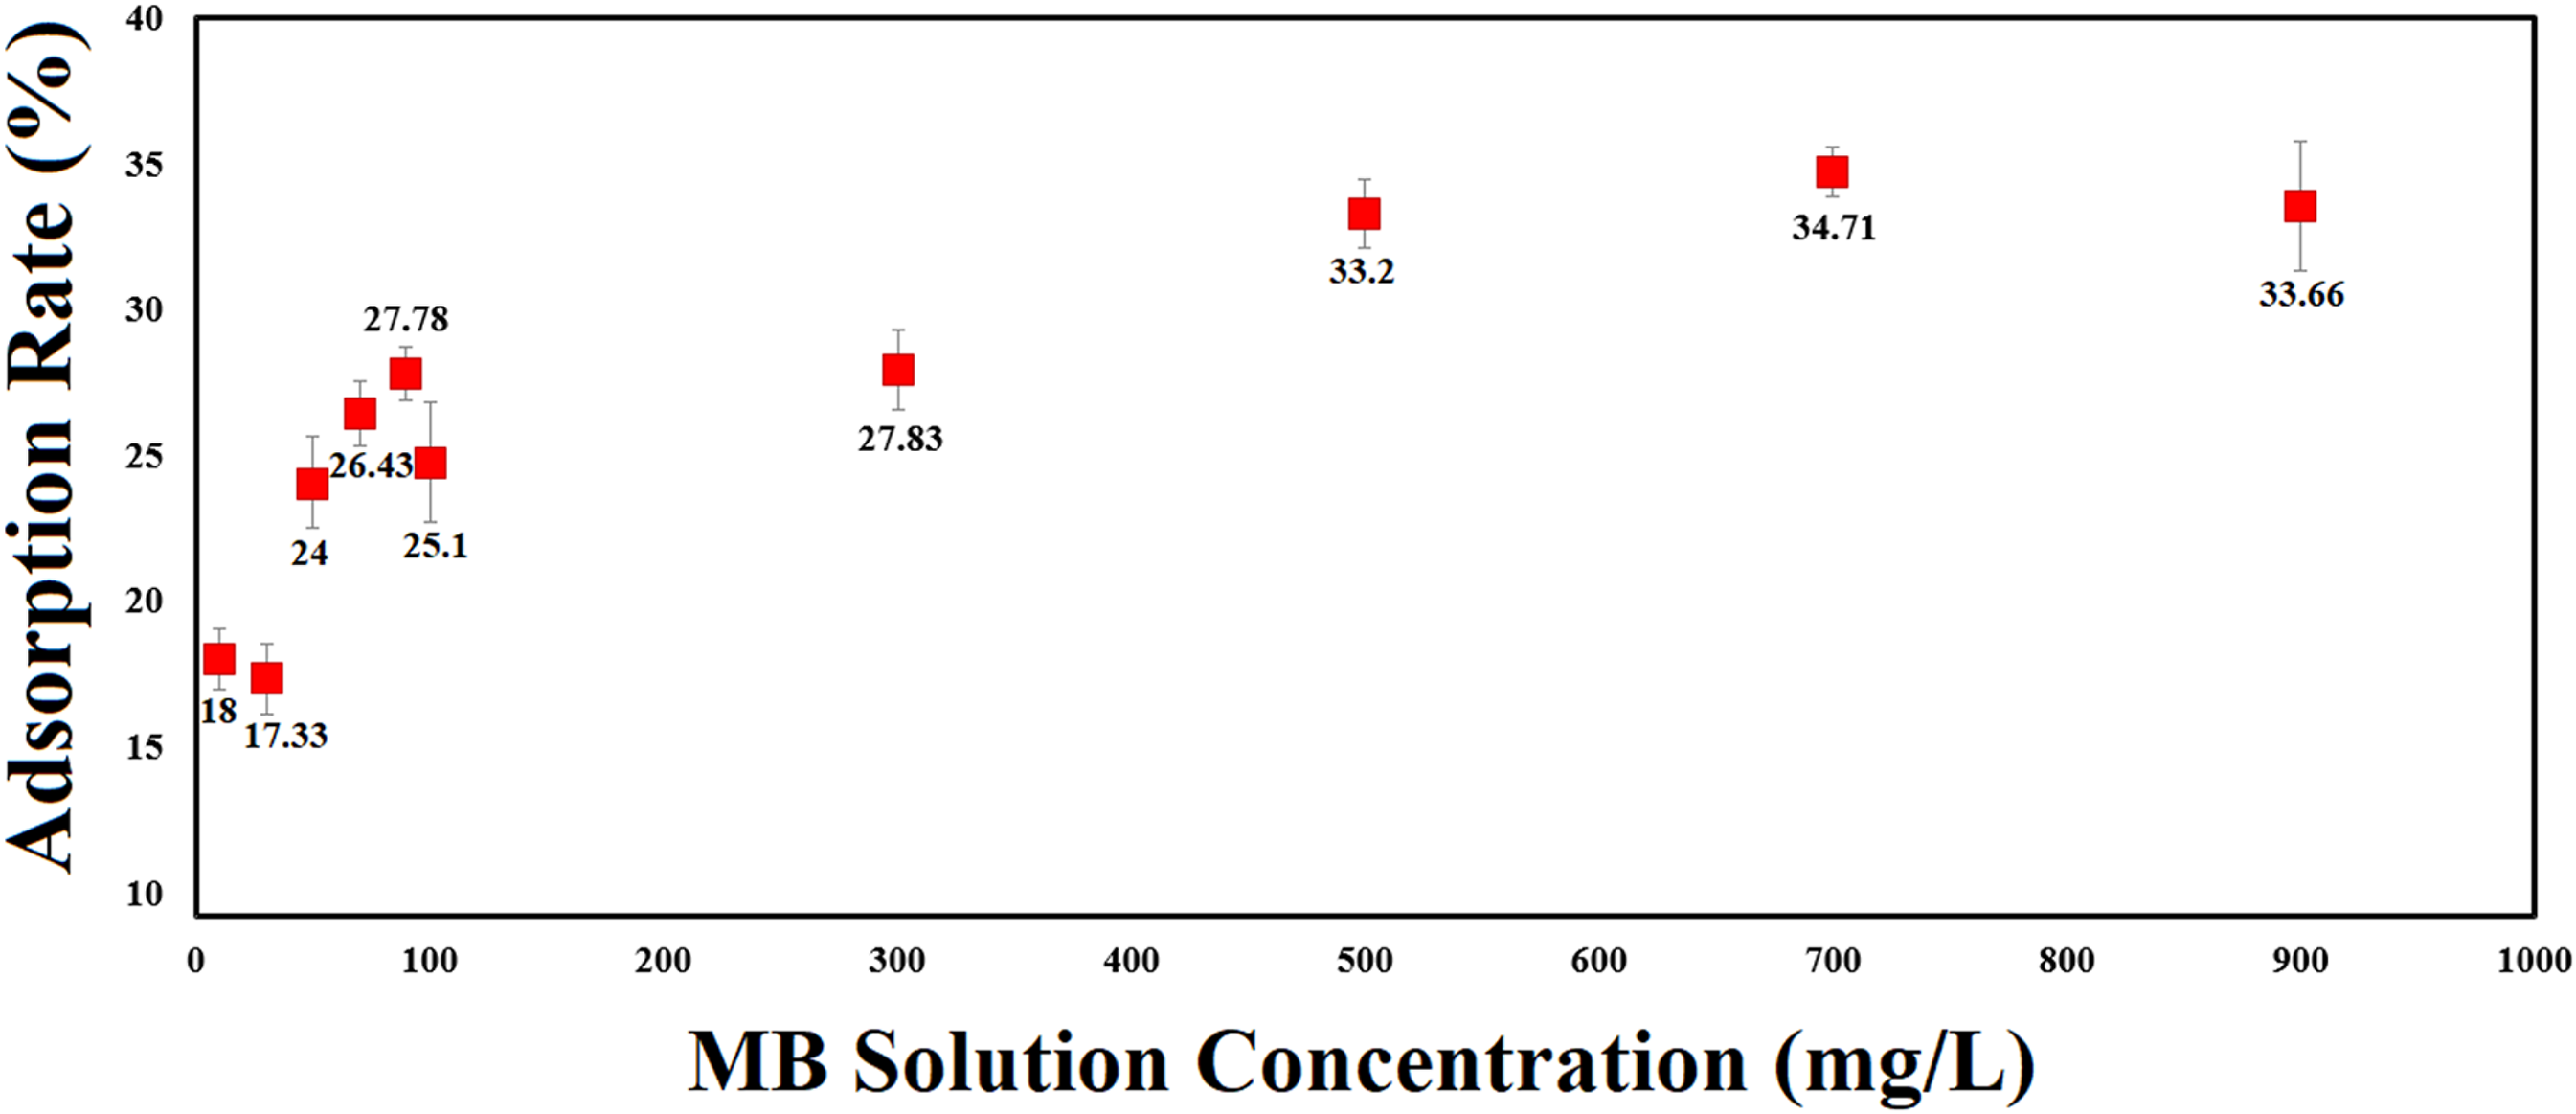
Figure 6 reveals that the PUF adsorption rate relies on the MB solution concentrations, and generally it increases with an increment of the primary MB concentration from 10 to 900 mg/L.
The influence of primary MB concentrations on the kinetics of adsorption and removal capacity under different adsorption times is exhibited in Figures 7 and 8, for high and low MB solution concentrations, respectively. (a) Adsorption capacity of PUF-0.1 at different initial high MB concentrations, (b) The fitting values of kinetics models for the Pseudo-first-order model, and (c) The fitting values of kinetics models for the Pseudo-second-order model in MB solutions with high concentrations at 25°C and pH 7 over 24 h. (a) Adsorption capacity of PUF-0.1 at different initial low MB concentrations, (b) The fitting of kinetics models for the Pseudo-first-order model, and (c) The fitting of kinetics models for the Pseudo-second-order model in MB solutions with low concentrations at 25°C and pH 7 over 24 h.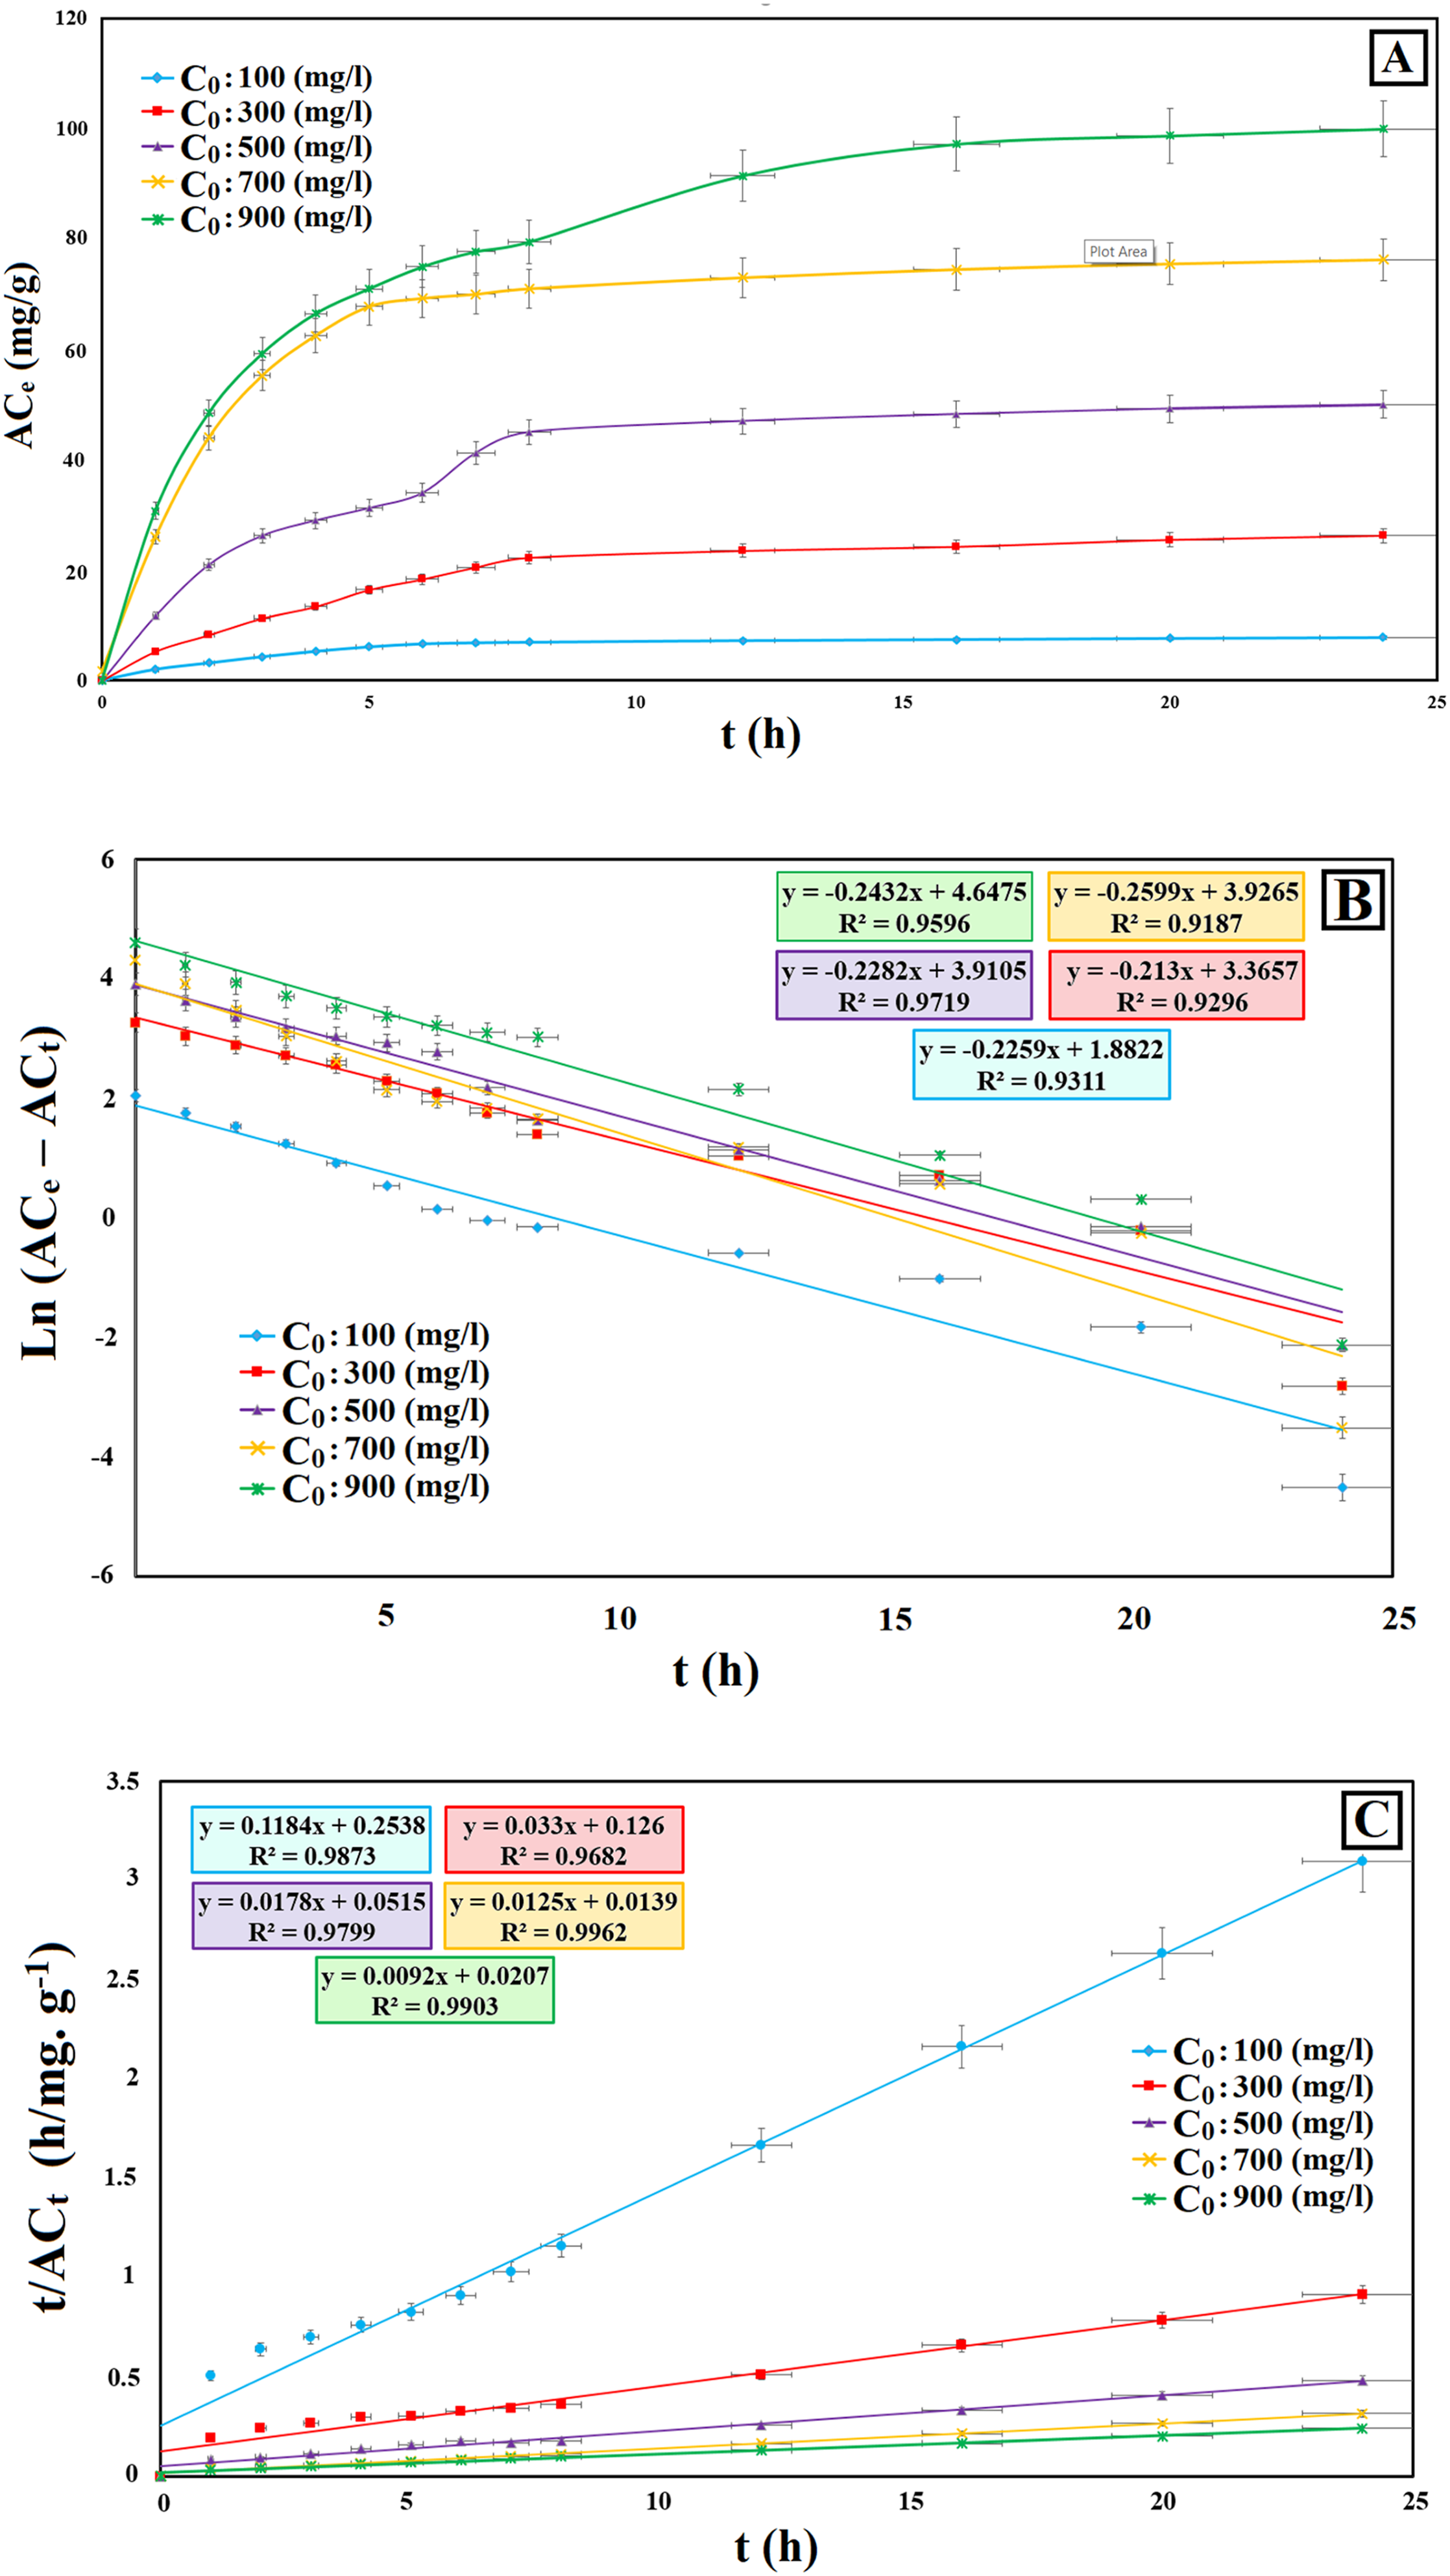
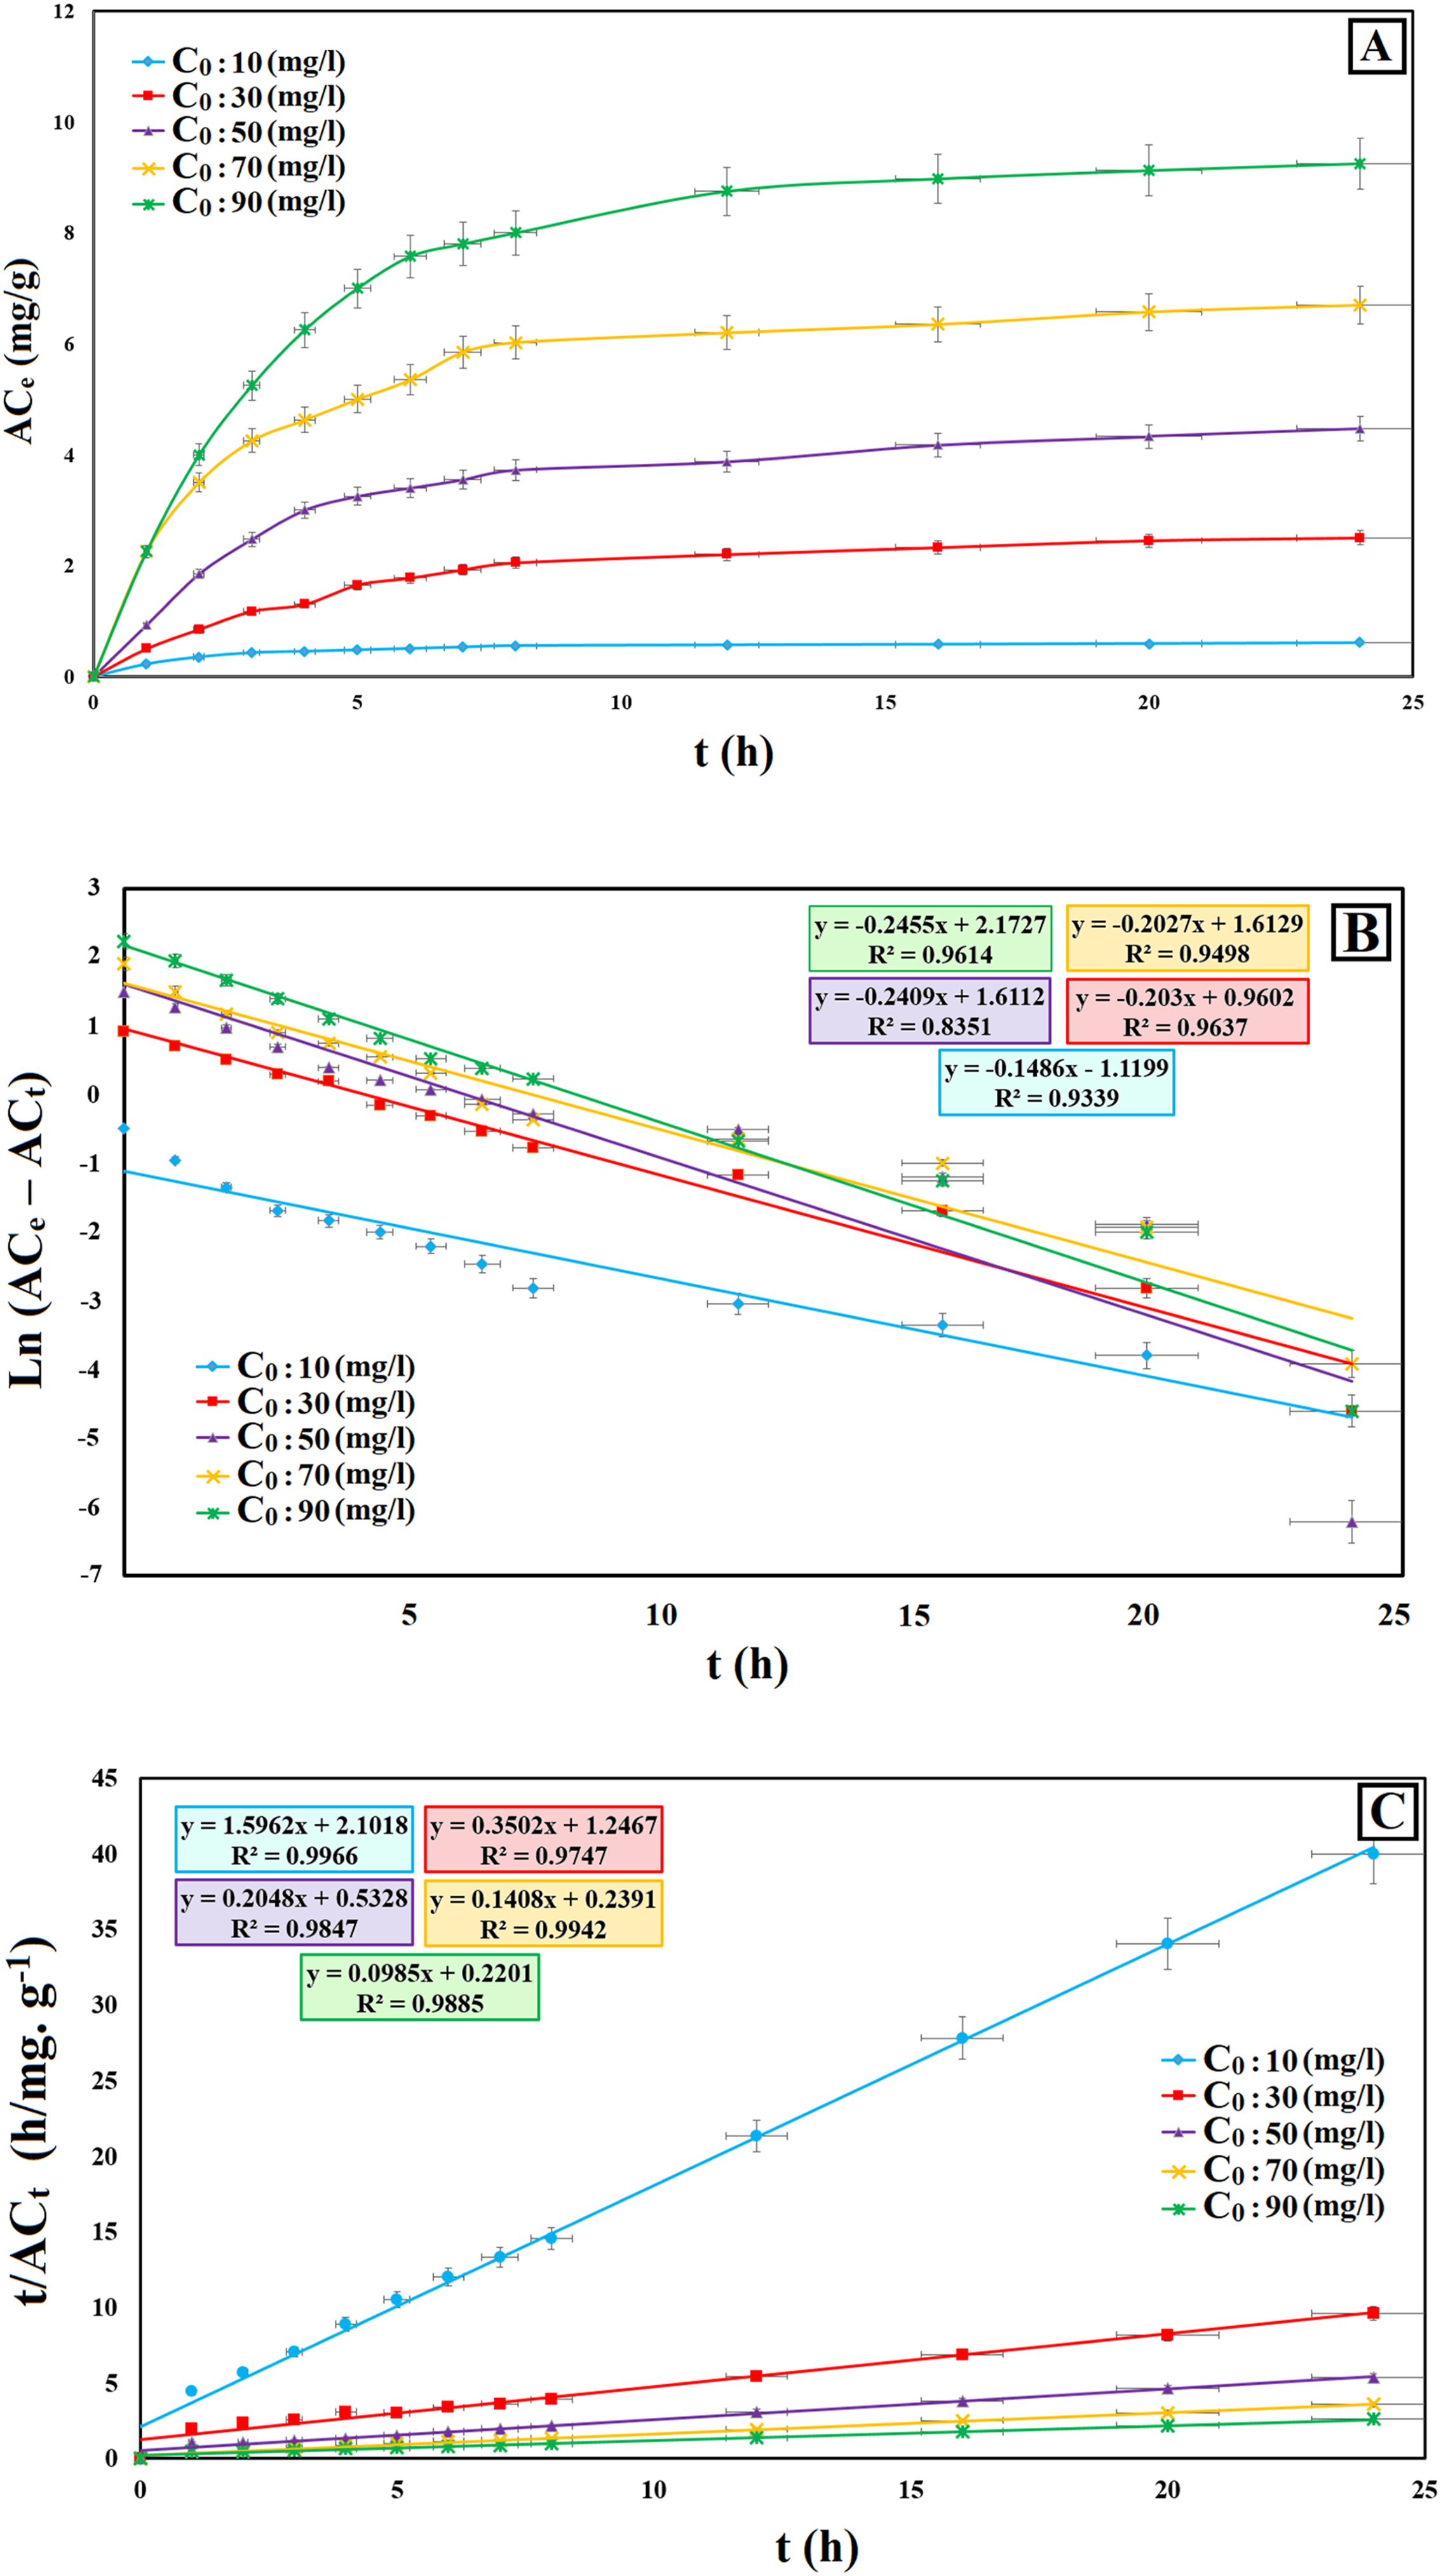
Following Figures 7(a) and 8(a), it can be expressed that the adsorption rate rises in the primary step and reaches the equilibrium adsorption state within 5 h, approximately. Also, Figures 7(a) and 8(a) reveal that PUF-0.1 achieves a high ACe over a short adsorption time of 5 h. So, it can be categorized as a potentially proper adsorbent aiming to MB removal in short periods.
Different adsorption steps of MB molecules on/in the PUF structure can be divided into three steps, namely initial, second, and steady state. MB molecules are rapidly attached to the surface of PUF through van der Waals forces initially. In the following, they penetrate slowly into the PUF structure via the open cells and cavities to find the proper adsorbing sites. Finally, a steady state is achieved between the MB molecules existing in the solution and those adsorbed on the cellular surface of PUFs.
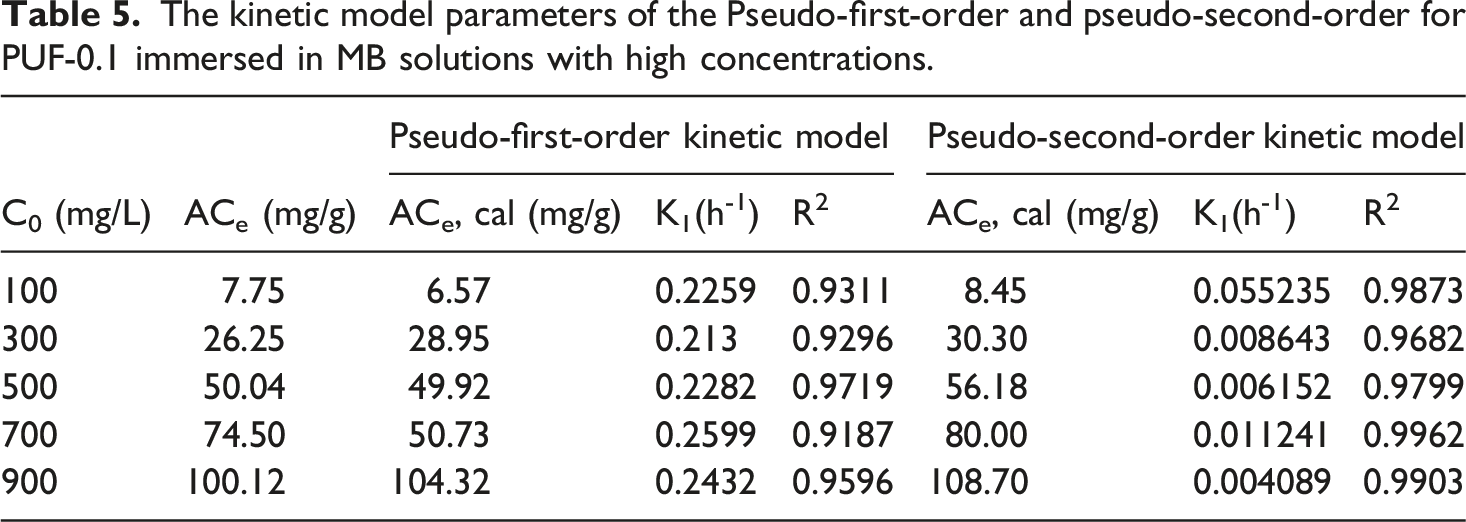
The kinetic model parameters of the Pseudo-first-order and pseudo-second-order for PUF-0.1 immersed in MB solutions with high concentrations.
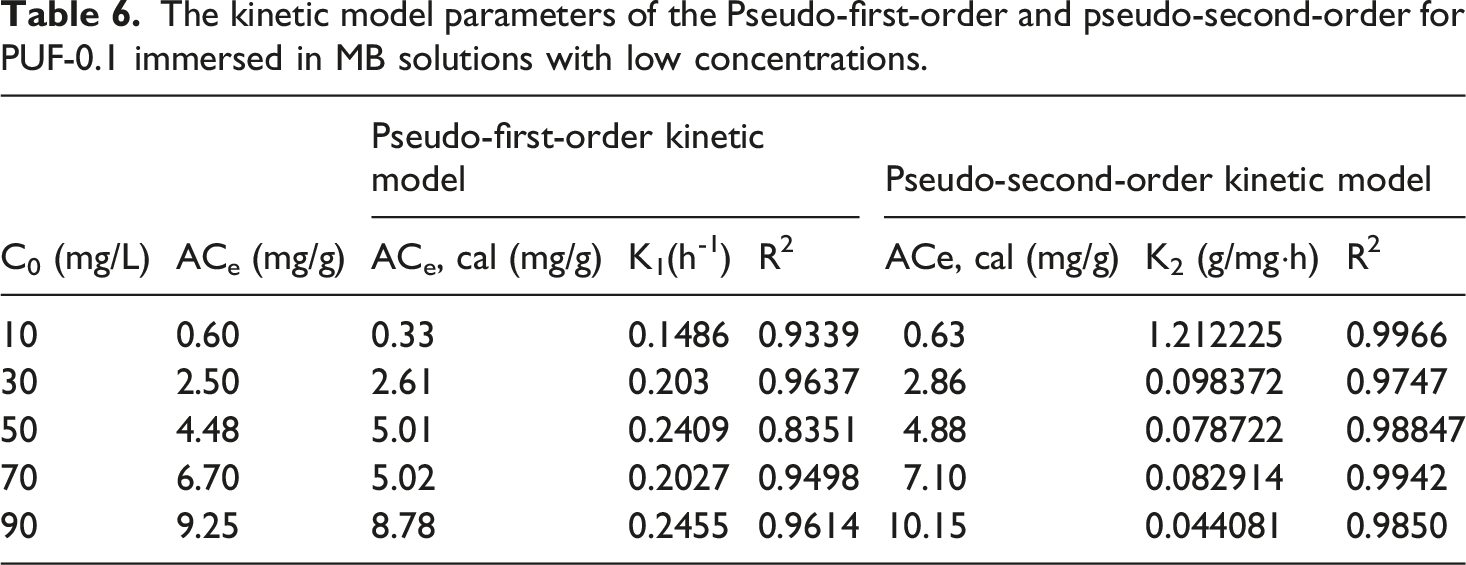
The kinetic model parameters of the Pseudo-first-order and pseudo-second-order for PUF-0.1 immersed in MB solutions with low concentrations.
Following Table 5, the R2 values attained using the pseudo-second-order kinetic model for PUF-0.1 in MB solutions with high concentrations are higher than those obtained by the pseudo-first-order model. The R2 value is a crucial index to correlate a particular adsorption kinetic model to a specific adsorption behavior. The nearer the R2 value is to 1, the greater its consistency. In other words, the pseudo-second-order kinetic model fits the achieved data better, and its R2 values are much closer to 1. In more detail, the experimental adsorption capacities (ACe) values are 7.75, 26.25, 50.04, 74.50, and 100.12 mg/g in highly concentrated MB solutions, while the ACe, Cal gained by the pseudo-first-order model are 6.57, 28.95, 49.62, 50.73, and 104.32 mg/g, respectively. Conversely, the ACe, Cal fitted by the pseudo-second-order model are 8.45, 30.30, 56.18, 80.00, and 108.70 mg/g, presenting a better fitting to experimental values and a lower gap between the calculated values and experimental ones.
Following Table 6, the R2 values achieved by the pseudo-second-order kinetic model are also greater than those attained by the pseudo-first-order model, for adsorption in low-concentration solutions. So, the pseudo-second-order kinetic model is more appropriate, owing to its closer R2 values to 1. Besides, the ACe values for PUF-0.1 immersed in MB solutions with low concentrations, including 10, 30, 50, 70, and 90 mg/L, are 0.60, 2.50, 4.48, 6.70, and 9.25 mg/g. Interestingly, the equilibrium adsorption capacities attained by the pseudo-second-order model (ACe, Cal) are 0.63, 2.86, 4.88, 7.10, and 10.15 mg/g, respectively. Notably, the ACe, Cal obtained by the pseudo-first-order model are 0.33, 2.61, 4.02, 5.01, and 8.78 mg/g, showing more differences from the investigational values. Accordingly, a better depiction of the adsorption process of PUF-0.1 to MB molecules was achieved by the pseudo-second-order model for both low and high-concentration MB solutions. The better applicability of the pseudo-second-order model can be interpreted using its higher capability to describe the physical and chemical adsorption process simultaneously, presenting a good agreement with previous studies. 38
It is worth mentioning that although the pseudo-second-order kinetic model is regularly related to chemisorption, it does not solely specify chemical bonding. Based on different studies, 38 this model effectively describes the adsorption systems where the rate-limiting step governs by availability of surface sites, for both chemical, physical, or a combination of physical-chemical interactions.
In the present study, the surface of PUFs was neither functionalized nor chemically modified; therefore, no specific covalent binding sites for MB molecules can be found. Therefore, the adsorption mechanism is directed principally by physicochemical interactions, among which electrostatic attraction attends as the primary driving force. The polar groups on the cell surface in PUF structure, particularly carbonyl (C = O) moieties originating from the polyester polyol backbone and urethane/urea linkages, carry a partial negative charge due to oxygen electronegativity. MB, as a cationic dye containing a delocalized positive charge on its aromatic rings and positively charged sulfur atom, is eagerly attracted to these negatively charged surface sites.38,39 The strength of this electrostatic interaction relies intrinsically on the density of accessible polar groups, which was constant across all samples (confirmed by FTIR and DSC), and on the morphological accessibility of these groups, which is directly reflected by the fractal dimension (Df). Beyond electrostatic forces, π–π stacking and also van der Waals interactions contribute to the adsorption process. Although the soft segment of the synthesized polyester polyol lacks aromatic rings, the MDI-based hard segments contain phenyl groups that can involve in weak π–π stacking with the aromatic rings of MB, as well as dispersion forces. Furthermore, hydrogen bonding between the N-H and C = O groups of urethane/urea linkages and the nitrogen atoms of MB molecules, or with water molecules, can stabilize the adsorbed state.38,39 In a highly fractal network, the probability of favorable hydrogen bonding orientations rises due to the greater number of accessible surface sites and extended residence times of dye molecules within tortuous pathways. Notably, a higher Df (∼2) signifies a more irregular, space-filling, and tortuous structure, which improves adsorption through mechanisms beyond simple surface area augmentation. These include spatial confinement effects within narrow and tortuous channels that increase the occurrence of dye-surface interaction, extended diffusion pathways that raise the interference efficiency, and multi-point contacts where a single MB molecule simultaneously interacts with multiple polar or aromatic sites on a rough fractal surface. Accordingly, while pure physical adsorption dominates, the enhanced dye removal performance at higher Df rises from a synergistic combination of electrostatic attraction, π–π/van der Waals interactions, diffusion-confinement effects, and hydrogen bonding, all directed by morphological complexity rather than changes in surface chemistry. This explains why the pseudo-second-order kinetic model, which efficiently describes systems where the rate-limiting step is governed by the accessibility of heterogeneous surface sites, enables an excellent fit even in the absence of chemisorption.
As shown in Figures 7(a) and 8(a), the MB removal performance of PUF-0.1 increases as time goes by, and reaches the equilibrium after about 5 h. It can be justified that MB in the solution with a low primary concentration attaches to the active sites on the cell walls of PUF-0.1 completely, expressing a more significant removal efficiency.
Adsorption isotherm
Ren et al. calculated the thermodynamic parameters of MB, indicating a spontaneous adsorption (ΔG <0), an exothermic process (ΔH <0), and better adsorption at a lower temperature. So, the adsorption isotherm is conducted at 25 (a): Thermodynamic isotherm of adsorption, (b): Langmuir isotherm, and (c): Freundlich isotherm for PUF-0.1 to MB at 25 (a): Thermodynamic isotherm of adsorption, (b): Langmuir isotherm, and (c): Freundlich isotherm for PUF-0.1 to MB at 25 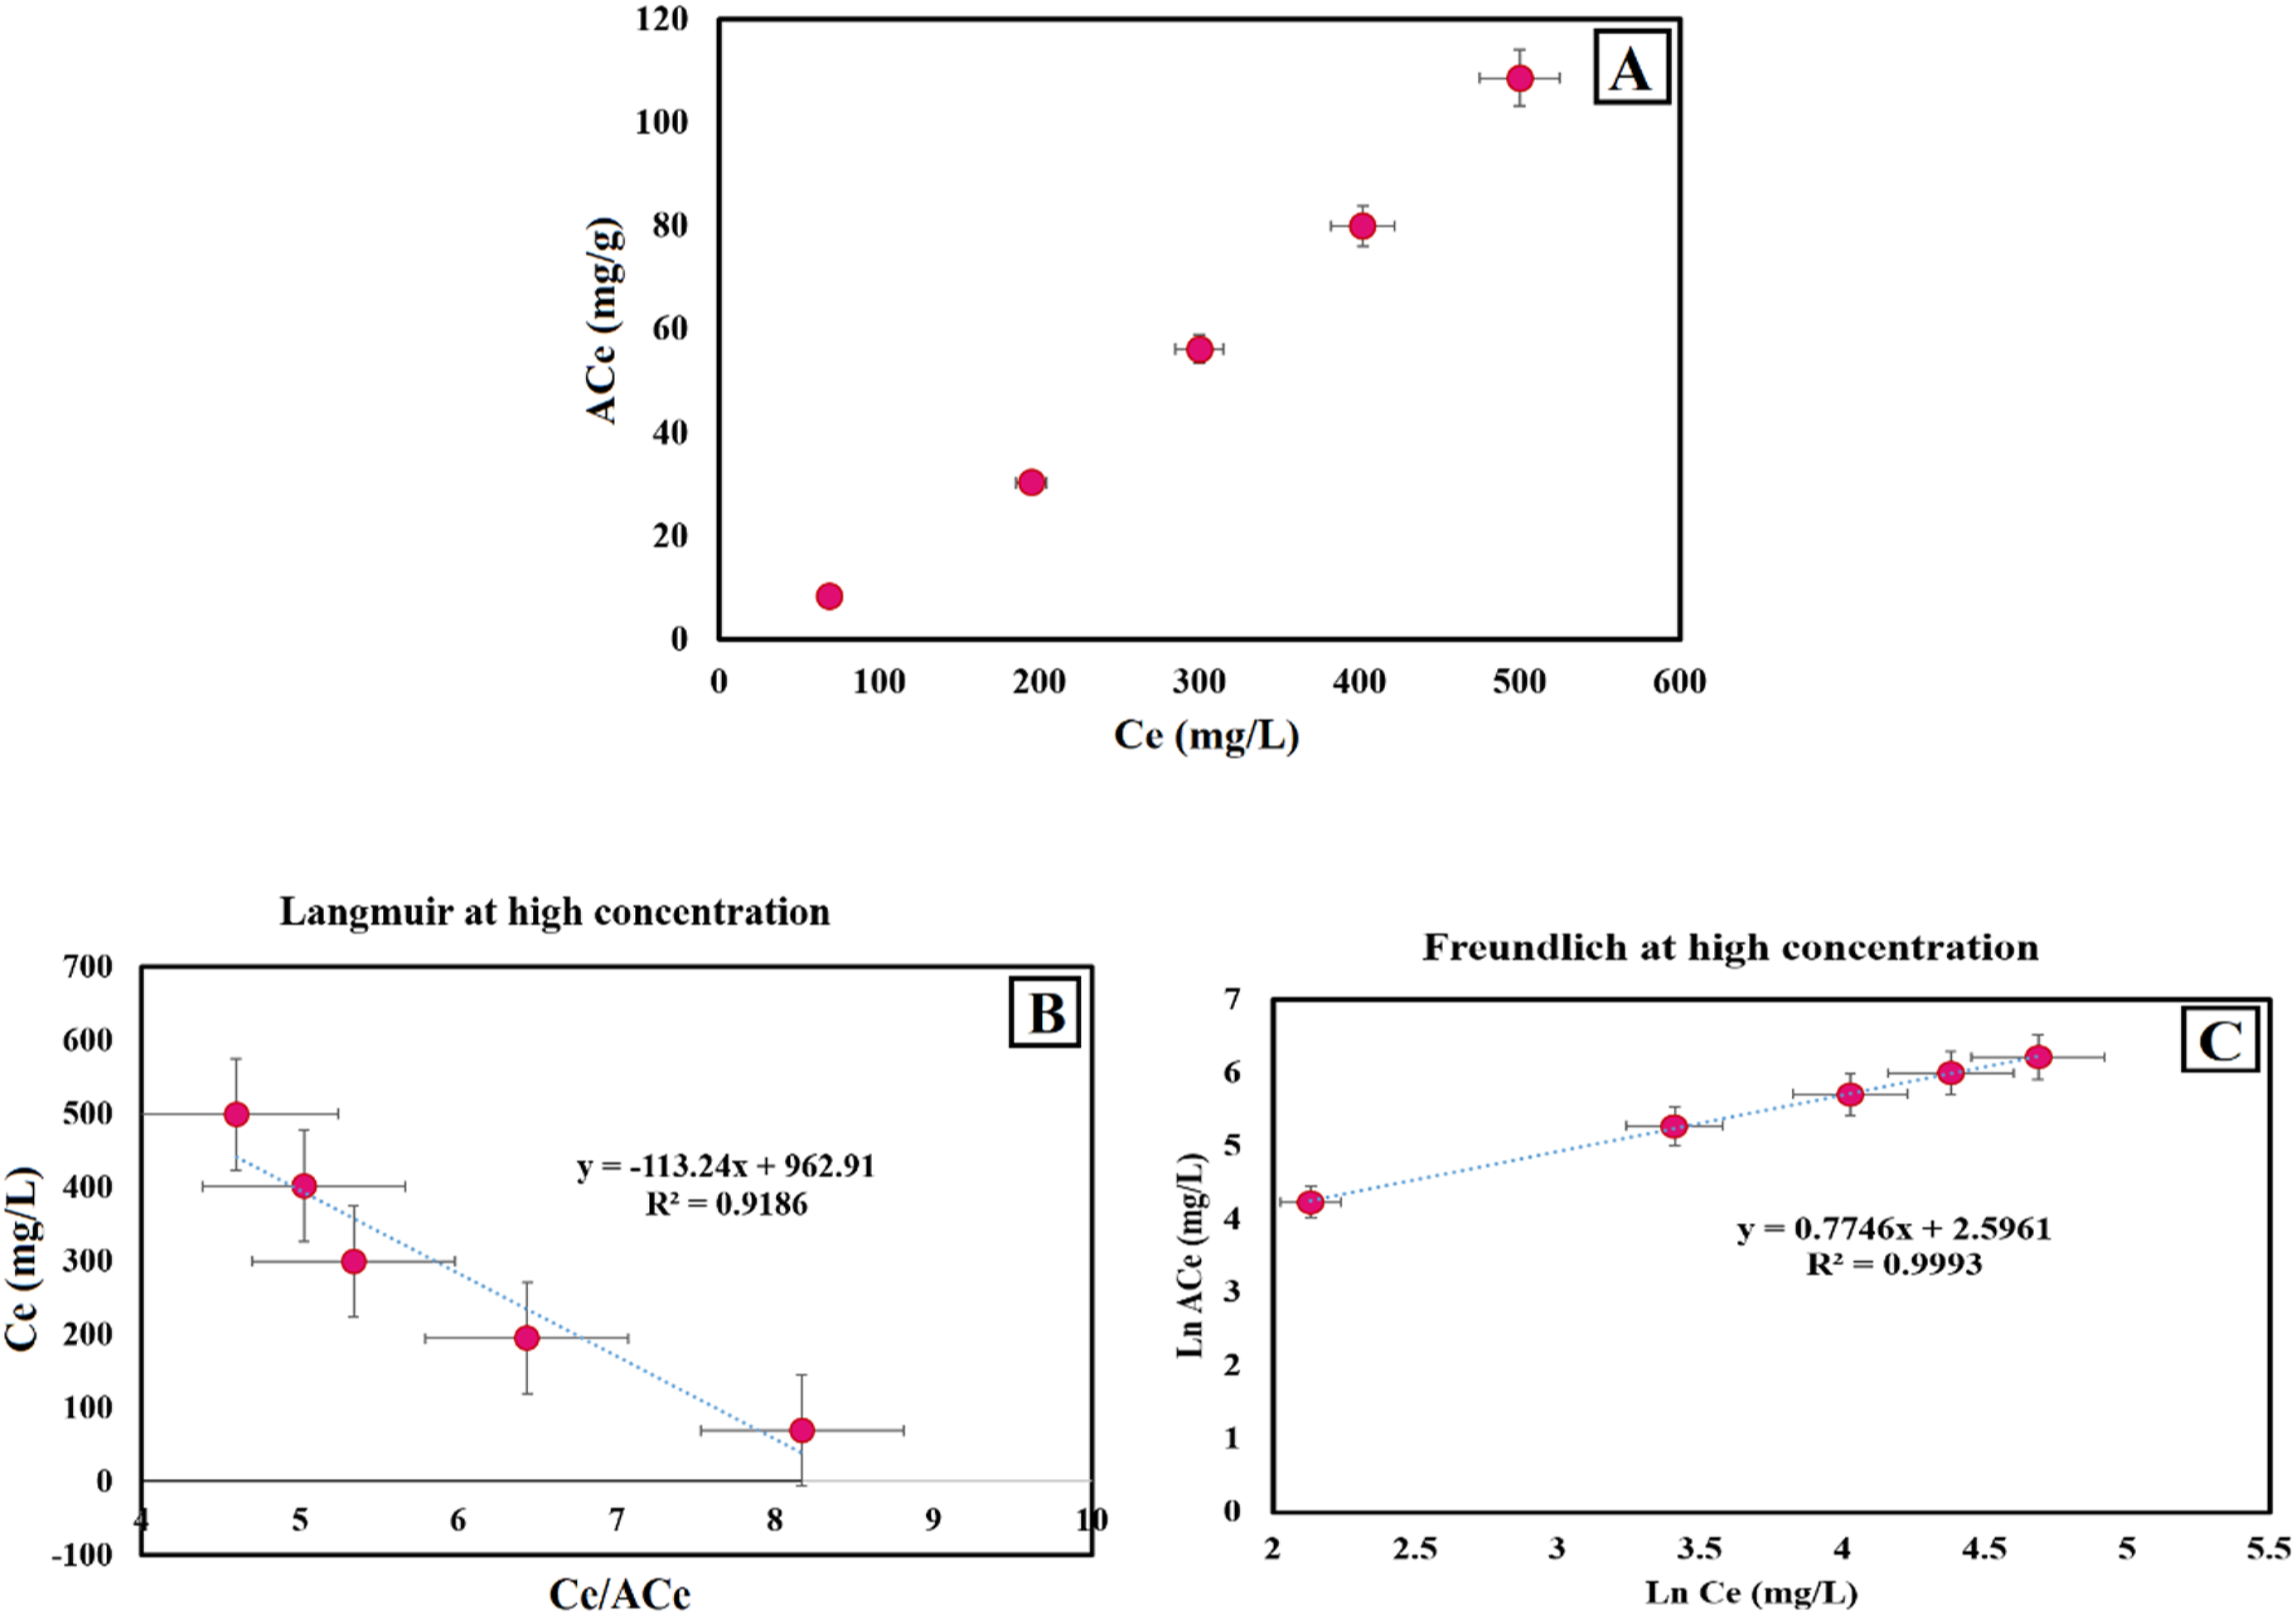
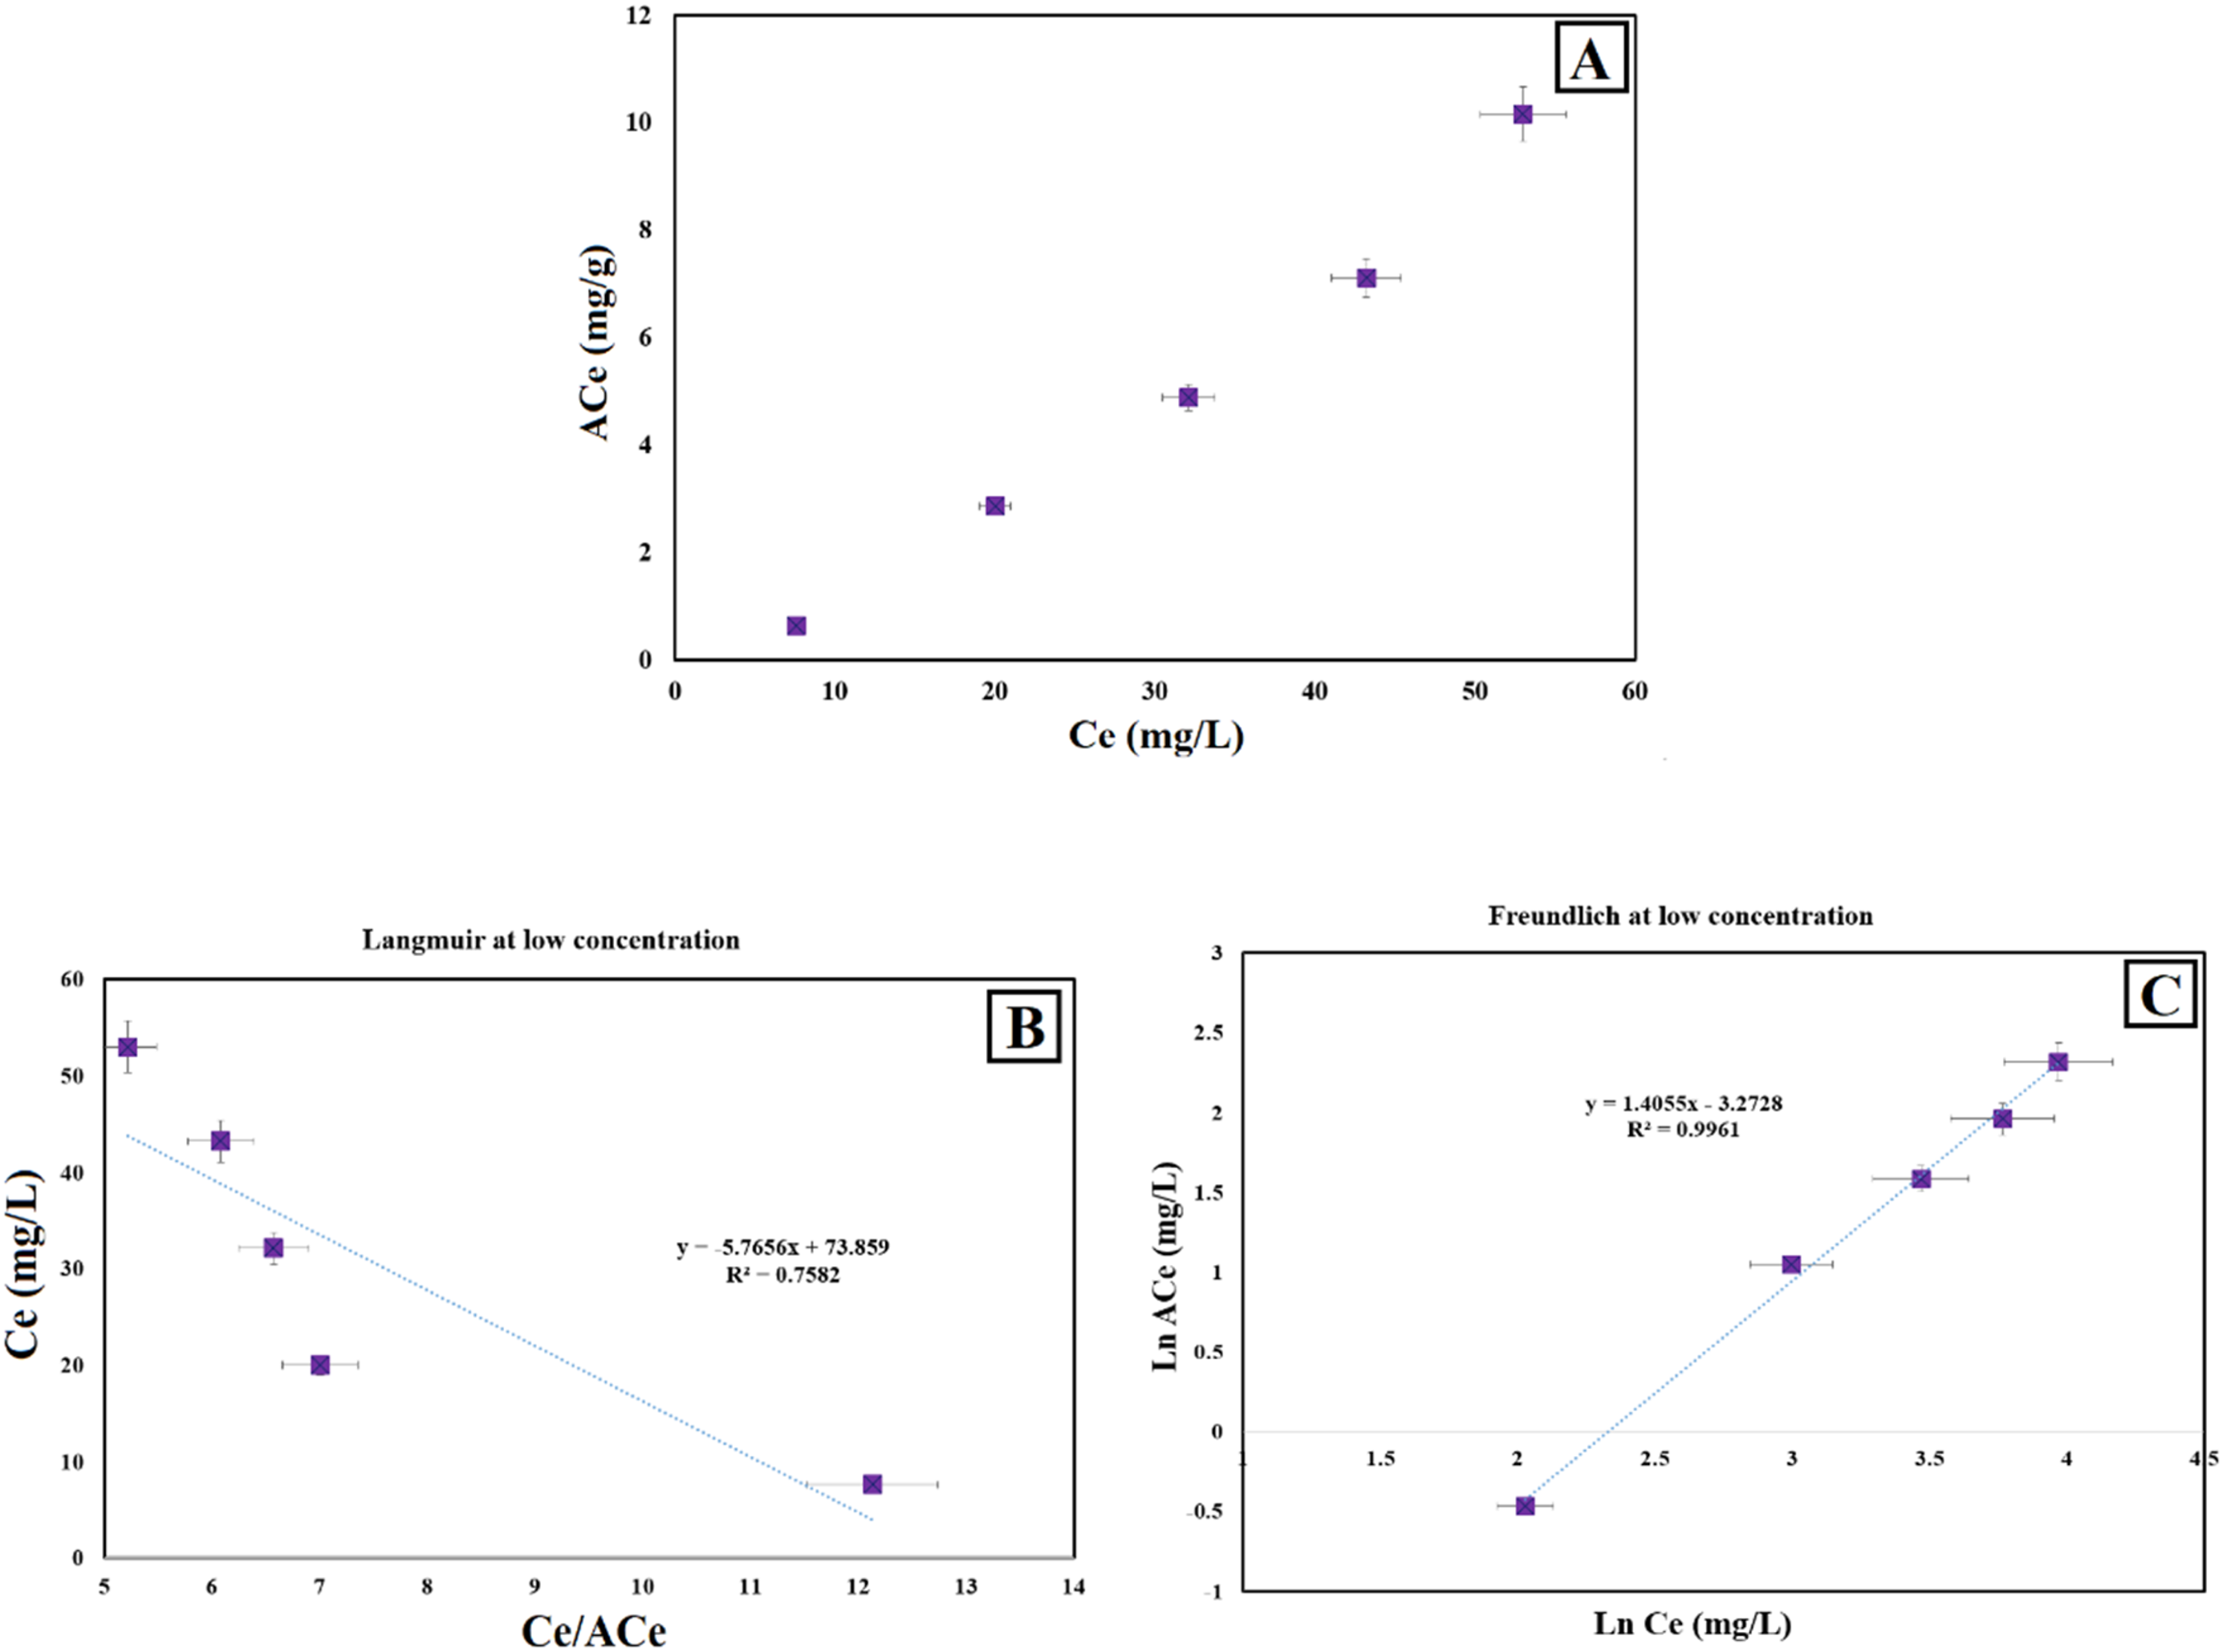
The fittings of Langmuir and the Freundlich kinetics models for PUF-0.1 immersed in MB solutions with high concentration are displayed in Figure 9(b) and (c), along with the achieved parameters mentioned in Table 5. Moreover, the fittings of the abovementioned adsorption kinetics models for PUF-0.1 in low-concentration MB solutions are reported in Figure 10(b) and (c), as well as Table 6.
Parameters of the Langmuir and the Freundlich adsorption isotherm models.
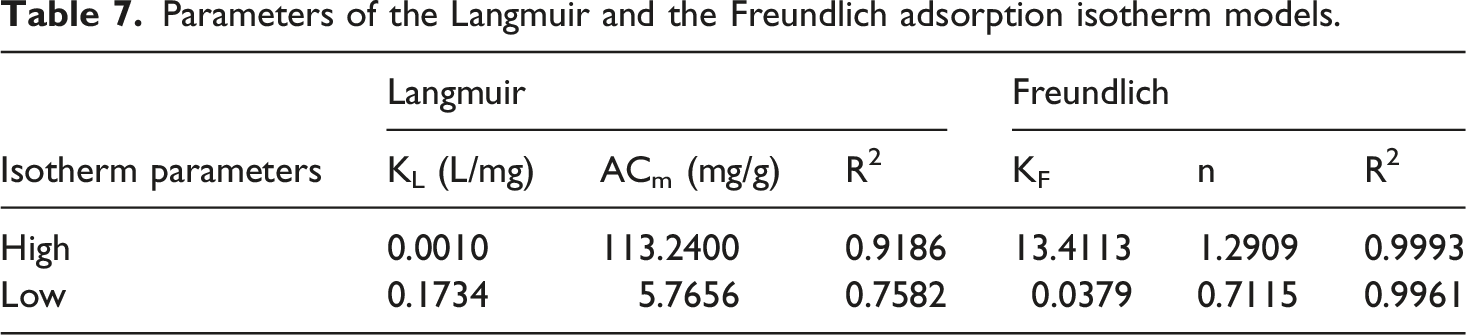
The proper fitting to the Freundlich isotherm supports multilayer adsorption on a heterogeneous surface in porous structure of PUF, which is consistent with the non-uniform energy distribution of adsorption sites in the PUF and fractal morphology. Consequently, the adsorption mechanism is described by heterogeneous multilayer physisorption with diffusion-influenced kinetics, which is effectively signified by the pseudo-second-order model.38,39
For practical treatment of real wastewater, the examination of chemical and mechanical stability of PUF adsorbents over repeated adsorption-desorption cycles is vital. 40 PUFs contain a highly crosslinked urethane-urea network structure and high level of micro-phase separation (monodentate and bidentate hydrogen bonding), which offer inherent chemical and mechanical stability under neutral aqueous conditions (pH:7 and 25°C).23,34 Furthermore, MB adsorption in unfunctionalized PUFs occurs chiefly through physical interactions compared to irreversible chemical bonding. Then, desorption can possibly be attained via mild pH adjustment or solvent washing without damage to the PUF structure.38,39 Also, the cellular framework of PUFs provides structural strength under common adsorption-desorption conditions. Though cyclic adsorption-desorption investigations are beyond the scope of this study, the mechanical stability of PUF before and after 10 adsorption-desorption cycles, as reported in SI (Figure S4), provides promising reusability possible. Mechanical integrity retention and multi-cycle performance can be investigated in future works, comprehensively. Moreover, the robust correlation achieved between dye removal efficiency and Df recommends that Df offers a beneficial integrated descriptor for predicting adsorption trends within the investigated PUF system. However, the present outcomes are authenticated within a particular system: 1) polyester-based PUFs adsorbing MB under controlled test center conditions. The applicability of these findings to other types of dyes, different adsorbate-adsorbent systems, real industrial wastewater, 40 mixed pollutant systems, or PUF with different chemical compositions remains to be examined comprehensively.
Though strong correlations were detected between Df and adsorption performance, the present study did not straightly assess transport-related properties such as liquid uptake, permeability, tortuosity, or pore connectivity. Thus, the transport mechanisms responsible for the detected adsorption behavior cannot be decisively established. Future studies including fluid-transport characterization can provide further insight into the morphology-transport-adsorption relationship.
Conclusions
This study investigated the relationship between the Df of PUFs and their adsorption efficiency for MB dye removal from wastewater. PUFs were synthesized with varying amounts of amine catalyst content (0.1–0.6 g), leading to differences in morphological properties such as open-cell content, density, cell size, and cell size distribution. The Df, calculated via the box-counting method, served as a key parameter to quantify structural complexity and predict adsorption performance.
The results demonstrated that PUFs with higher Df exhibited superior MB adsorption due to increased accessible surface area and structural irregularity, enhancing dye interaction. Moreover, increasing the MB dye concentration from 100 to 900 or 10 to 90 mg/L led to higher adsorption efficiency. Specifically, PUF-0.1 with Df = 1.8554 achieved the highest dye removal efficiency (44.5% at 900 mg/L MB), while PUF-0.6 (Df = 1.5415) showed the lowest performance. Adsorption kinetics followed a pseudo-second-order model, signifying chemisorption as the governing mechanism, while the Freundlich isotherm best demonstrated the adsorption process, suggesting multilayer adsorption on irregular surfaces of PUFs. This study highlights fractal dimension as a useful integrated morphological descriptor for assessing PUF adsorption performance. Rather than replacing conventional morphological parameters, Df provides a convenient quantitative metric and complements conventional morphology characterization that captures the combined influences of several interconnected structural features relevant to adsorption. Future work could explore synergistic effects by incorporating active agents (e.g., photocatalysts) into high-Df PUFs to further enhance dye removal efficiency. These discoveries highlight the potential of fractal-designed PUFs as cost-effective, scalable adsorbents for industrial wastewater treatment.
Supplemental material
Supplemental Material - Fractal dimension as a predictive morphological metric for dye removal in polyurethane foams
Supplemental Material for Fractal dimension as a predictive morphological metric for dye removal in polyurethane foams by Sahar Abdollahi Baghban, Dirk Poelman in Journal of Cellular Plastics
Footnotes

Author contributions
Funding
The authors received no financial support for the research, authorship, and/or publication of this article.
Declaration of conflicting interests
The authors declare that they have no conflict of interest.
Data Availability Statement
Data will be made available on request. All data generated or analyzed during this study are included in this published article and its supplementary information files.
Supplemental material
Supplemental material for this article is available online.
Appendix
References
Supplementary Material
Please find the following supplemental material available below.
For Open Access articles published under a Creative Commons License, all supplemental material carries the same license as the article it is associated with.
For non-Open Access articles published, all supplemental material carries a non-exclusive license, and permission requests for re-use of supplemental material or any part of supplemental material shall be sent directly to the copyright owner as specified in the copyright notice associated with the article.
