
Abstract
An experimental investigation into the adhesion of regenerated cellulose fiber lyocell, natural cellulose fiber ramie, and E-glass fiber to the polypropylene (PP) and epoxy matrices, by means of the microbond technique, was conducted. Force–displacement plots indicate a brittle failure of the interface, followed by high frictional forces in the PP matrix and low frictional forces in the epoxy matrix. The interfacial shear strength (IFSS) of lyocell–epoxy system was significantly higher than that measured in the lyocell–PP system. Chemical modification of lyocell fiber with maleic anhydride resulted in a two-fold increase in IFSS with PP. Ramie exhibits better adhesion characteristics, due mainly to the rough surface, than lyocell.
Introduction
There has been considerable interest recently in the development of bio-composites based on natural cellulose fibers such as hemp and ramie, which are eco-friendly as well as lower in cost as compared to the widely used E-glass fibers.1,2 However, these fibers also have a number of disadvantages with respect to their use in composites. The cross-section of natural fiber cell, which consists of cell wall and lumen, exhibits considerable variation in diameter due to the changes in growth conditions and retting degree. 1 Fiber processing technologies cause severe damage to the fiber structure, as dislocations or kink bands that may lead to reductions in fiber–matrix adhesion. 3 Due to the difficulties associated with fiber separation (fiber cells are linked to each other by the middle lamella which is rich in lignin), the fiber bundles of different lengths and diameters are often used as reinforcements in manufacturing unidirectional bio-composites. Similar to the natural fibers, the use of regenerated cellulose fibers in bio-composites is also increasing. 4 – 6 These fibers are made by dissolving the chemical pulp through viscose or rayon processes and, more recently, by direct dissolution in N-methyl morpholine N-oxide (NMMO)/water (lyocell process).2,7 The lyocell fibers having circular cross-section are commercially used in textile applications and currently being studied for technical applications. These fibers exhibit considerably less variability than the natural fibers, but are usually less stiff while being comparably strong.4,6,8
In a fiber-reinforced composite, the fiber–matrix interface transfers the stress from the matrix to the fiber and thus critically determines the mechanical performance of a composite. It is, therefore, critical to characterize the interface and to quantify the adhesion between fiber and matrix. In the case of model single fiber composites, techniques such as the single fiber pull-out and single fiber fragmentation test are commonly employed for such assessment. 9 For a successful fragmentation test, the strain to failure of the matrix should be at least three times that of the fiber. 10 This requirement makes it unsuitable for characterizing lyocell–epoxy combinations. For the pull-out technique, the embedded fiber length should be small enough so that the fiber does not break before it pulls free, which is difficult to achieve with fibers of small diameter and comparably low strength, such as lyocell fibers. In view of these limitations, the microbond testing technique is an alternative, 10 – 17 which is used in this study.
The bonding of E-glass and natural cellulose fibers with polymer matrices and the effect of fiber modification on adhesion was extensively examined.1,2,10– 22 Due to the differences between regenerated cellulose and natural cellulose fibers, for example, surface roughness, chemical composition, and shape, there is a need to study the adhesion between regenerated cellulose fibers and polymer matrices.2,20 For this reason, the interfacial adhesion of regenerated cellulose fiber (lyocell) and natural cellulose fibers (ramie) with polypropylene (PP) and epoxy matrices are studied here by means of the microbond technique. Ramie was selected as the natural fiber because of its high cellulose content (∼80%). In addition, E-glass–PP and E-glass–epoxy are studied as reference systems. Finally, the adhesion behavior on the macrolevel was also evaluated by means of shear tests 23 with unidirectional epoxy composites.
Experiment
Materials
Thin sheets of PP (homopolymer) with a thickness of 0.1 mm were procured from Goodfellow, UK (PP301400, melting point 180°C, www.goodfellow.com). Low-viscosity epoxy resin (37–127) and commercial hardener (37-601), which are based on benzyl alcohol, isophorone diamine, and trimethyl hexamethylene diamine, were obtained from Farbenwolf, Vienna (www.farbenwolf.at). The viscosity of resin and hardener at 25°C are 600 and 30–70 mPa-s, respectively. They were mixed in 2 : 1 ratio (volume) resulting in the processing time of 40 min. The lyocell fibers with diameters of around 34 and 10 µm were supplied by Lenzing R&D, Austria. The ramie fibers (20–30 µm) were obtained from Lotteraner, Vienna, Austria. As shown in Figure 1, qualitative analysis of the surface roughness of lyocell and ramie fibers was carried out using scanning electron microscopy (SEM). E-glass fiber rovings (20 µm) and the reactive diluents for the epoxy resin (EPD BD) were procured from R&G Faserverbundwerkstoffe GmbH, Waldenbuch, Germany. The viscosity of the diluent at 25°C was reported as 15 ± 5 mPa-s. E-glass fiber containing commercial sizing agent and ramie were used as received.
SEM image of the lyocell single fiber: (a) showing the smooth surface and carefully extracted ramie single fiber, (b) showing the rough surface (scale bar, 20 µm).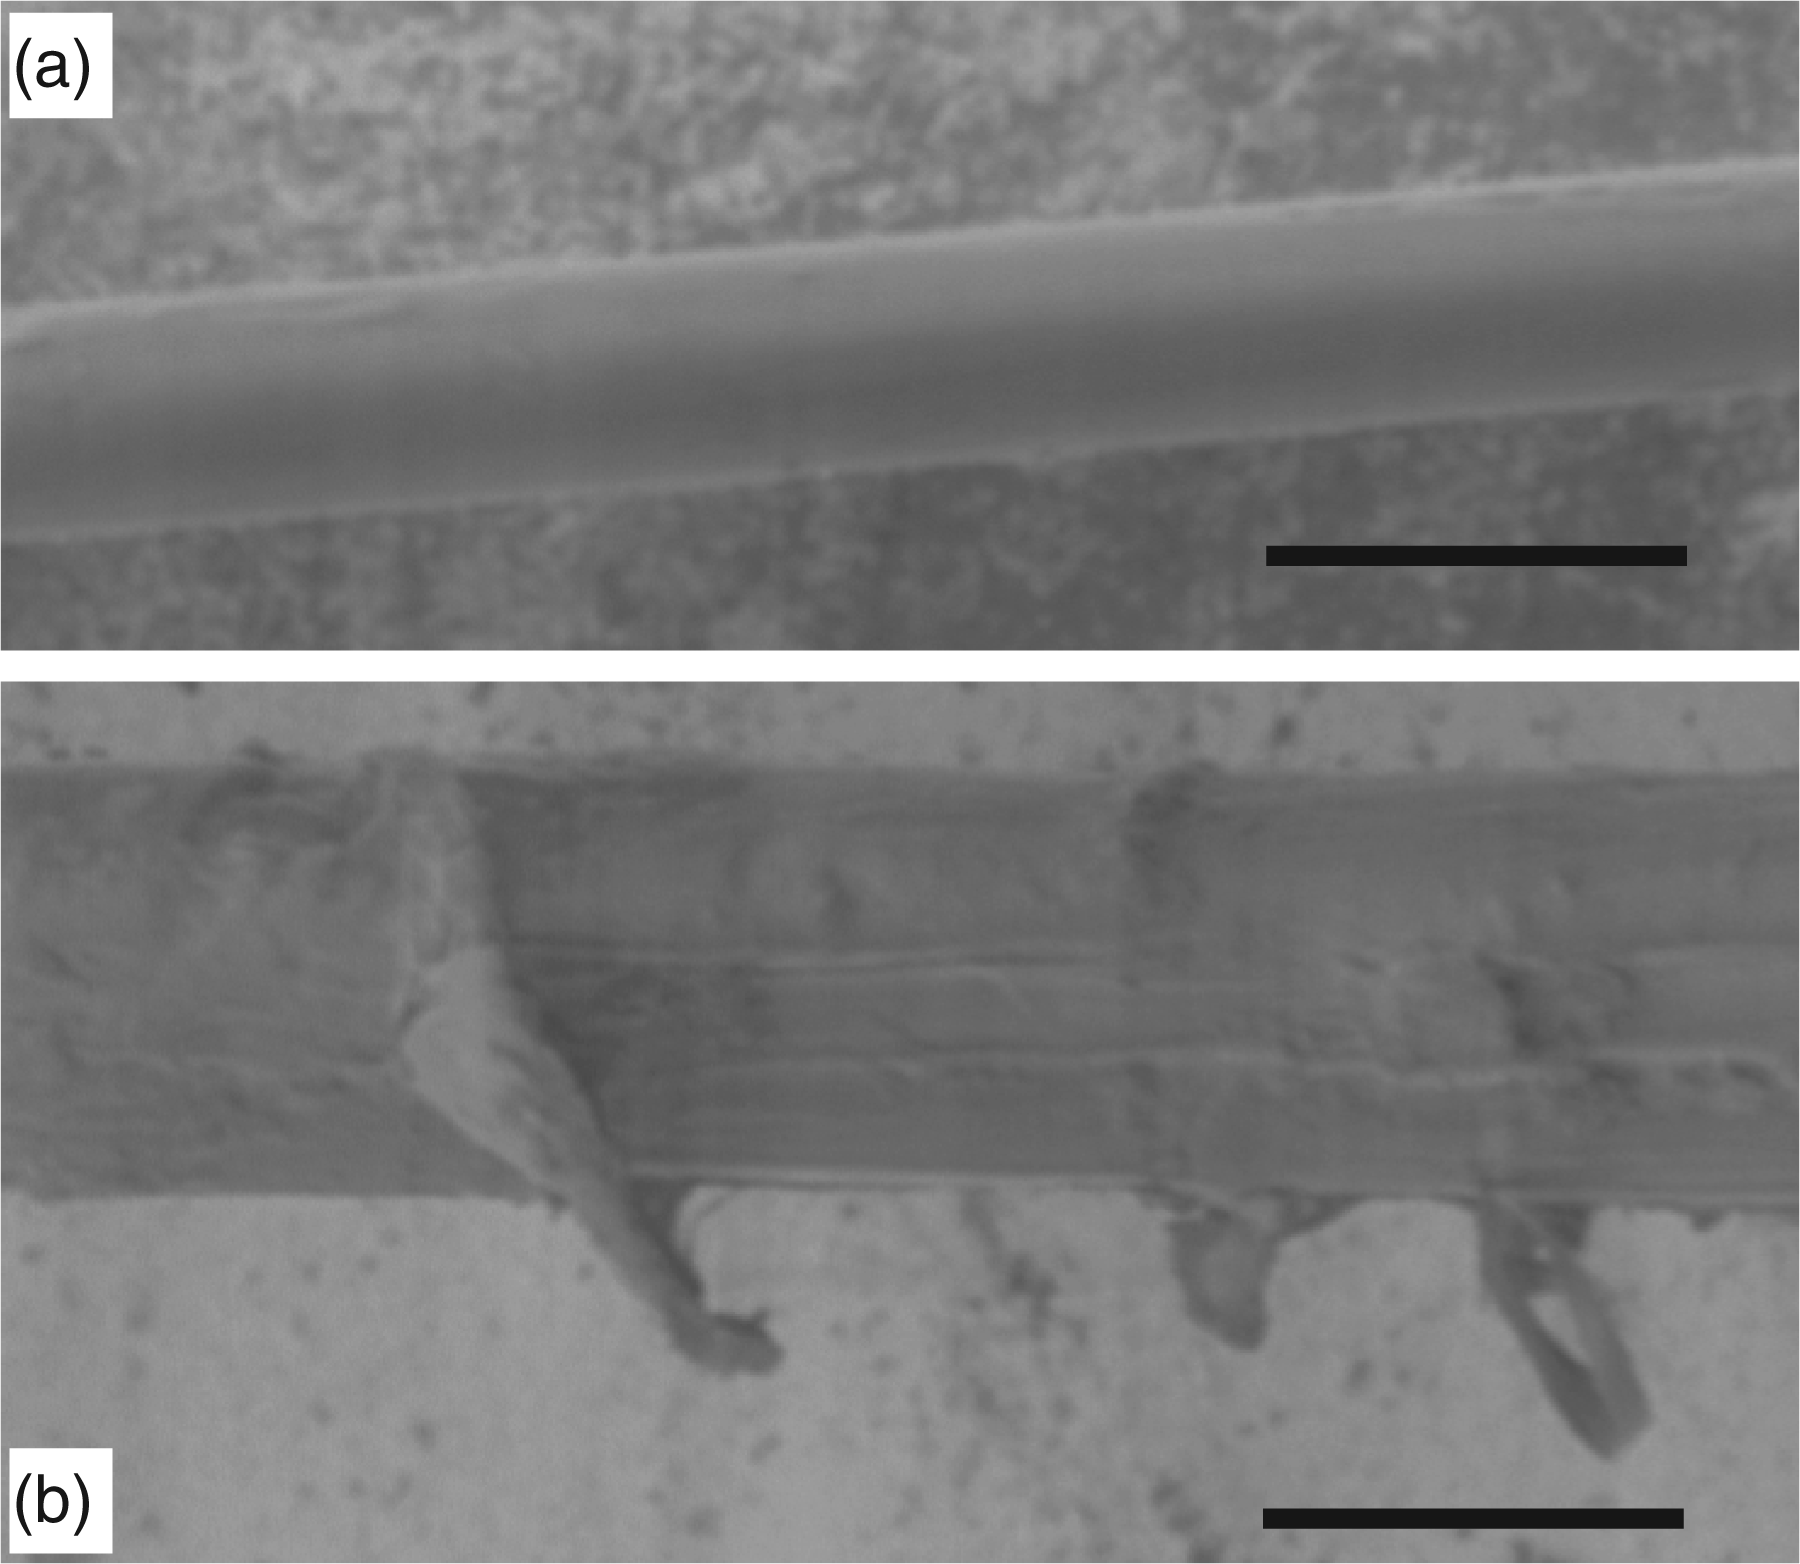
Chemical modification of lyocell fibers
Maleic anhydride (MAH, 63210, Fluka), and polypropylene–graft–maleic anhydride (PP–MAH, 426512-250G, Aldrich) were used for chemical modification of lyocell fiber (34 µm). For MAH modification, fibers were immersed in a solution of MAH in acetone with a concentration of 2.5 wt% for 24 h at room temperature, and the solution was mixed continuously. 24 The fibers were then removed from the solution, washed under acetone four times and dried in an oven at 75°C. For modification with PP–graft–MAH (PP–MAH), pellets were dissolved in hot toluene at a concentration of 0.2 wt%.18,20 Fibers were immersed in the hot solution (160°C) for 5 min and oven-dried at 75°C.
Single fiber tensile testing
For a correct interpretation of force–displacement curves from microbond tests and to measure the critical fiber lengths, it is necessary to know the tensile data of single fibers. Tensile test specimens were prepared as per the ASTM D3379-75 standard.8,25 Prior to tensile tests, fiber diameter was measured at three different locations along the fiber length using an optical microscope. Since the diameter values were found to be consistently underestimated when compared to the diameter values from linear density measurements (internal report), the corrected values of the optical microscopic measurements were taken as input parameters for stress calculations. Single fiber tests were conducted on both untreated and modified fibers with a gage length of 20 mm. Tests were conducted using a Zwick/Roell tensile testing machine equipped with 50-N load cell. Strain was calculated from the cross-head movement, which is found to be accurate and published elsewhere.
25
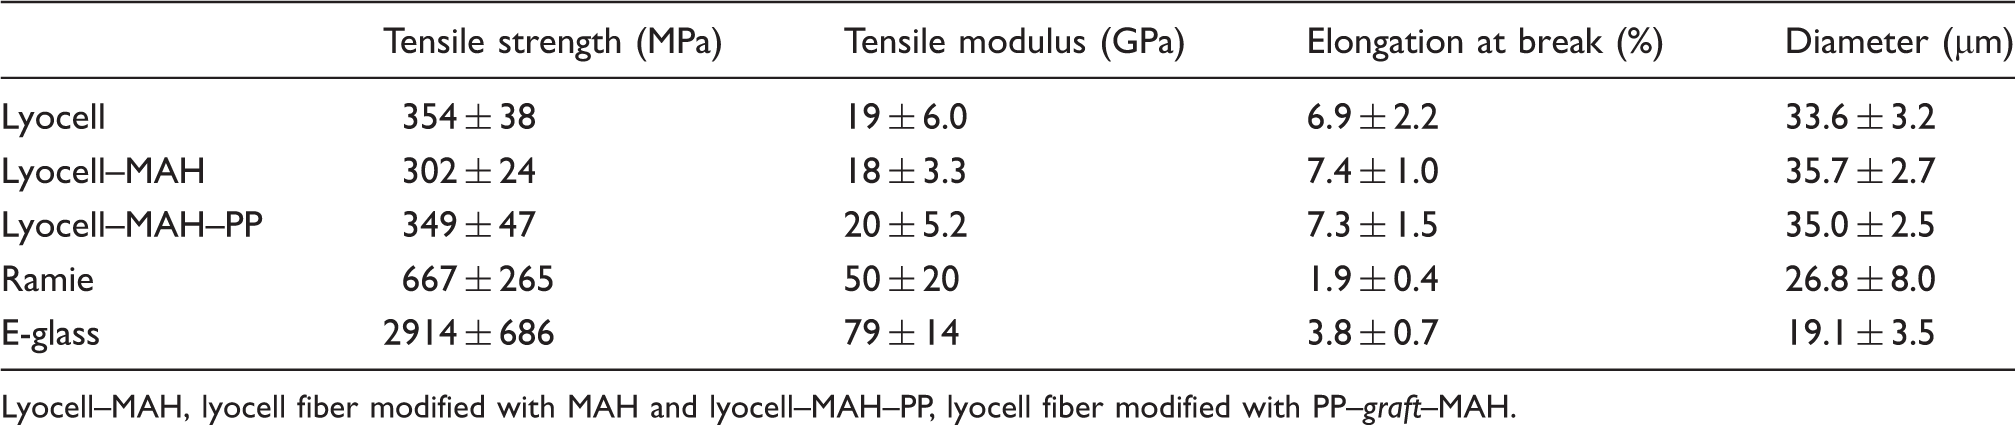
Specimens for each kind of fiber were tested and the results are listed in Table 1 and Figure 2. All tensile tests were carried out at 23°C and 55% relative humidity (RH).
Stress–strain diagram of the modified and unmodified lyocell fibers (diameter of 34 µm) obtained from single fiber tensile testing. Tensile properties of the single fibers Lyocell–MAH, lyocell fiber modified with MAH and lyocell–MAH–PP, lyocell fiber modified with PP–graft–MAH.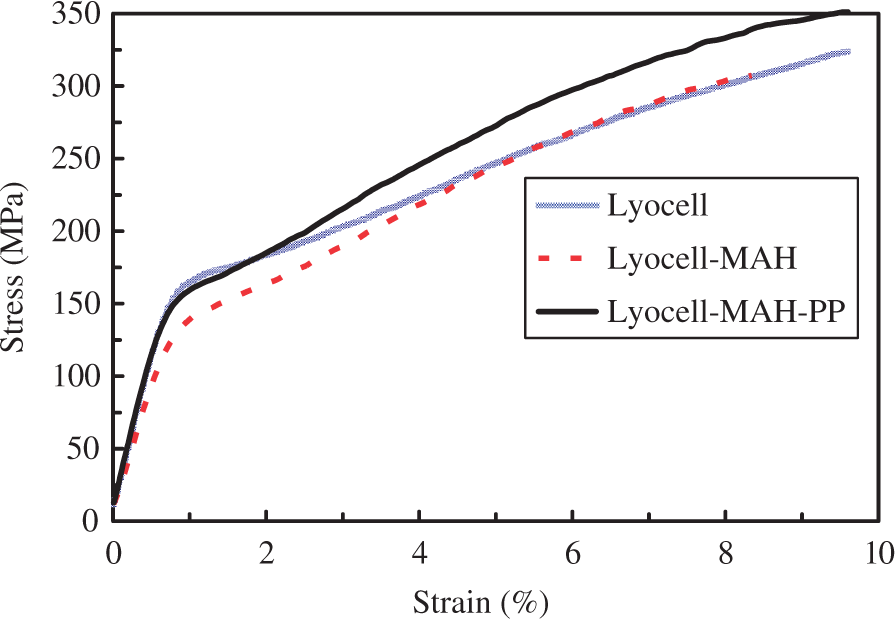
Microbond tests
Small pieces of PP films were cut into a trouser-like shape and placed onto the fibers, which were mounted to paper frames, using small tweezers. These trousers were melted and formed into symmetrical droplets by keeping the whole specimen in the oven for 30 min at 175°C as described in detail in Adusumalli et al.
8
In the case of epoxy, a thin metallic rod was used to place the resin on the fiber under an optical microscope and allowed for curing at 80°C for 3 h. Before testing, the embedded length and the fiber diameter were measured with a ZEISS light microscope, as explained in the previous section. Subsequently, the fiber was mounted on the testing machine as shown in Figure 3. Note that free fiber length was 12 mm for all droplets and remained almost constant for all the microbond tests. With a micrometer, the matrix droplet was gripped and the fiber was pulled from the droplet with a speed of 50 µm/min using 50-N load cell. In a microbond test, the force on the fiber rises continuously with displacement until the microdrop abruptly debonds from the fiber surface indicated by a sharp force drop (Figures 4 and 5). Only such clear debondings indicating brittle fracture were considered for further analysis (see Piggott et al.
26
for a thorough review on visualization of pull-out debonding). Tests were conducted until eight or more such clear debondings were obtained for each fiber–matrix combination. The peak force reached before final debonding, F, is used to calculate the apparent interfacial shear strength (IFSS), τapp, according to the Equation (1).
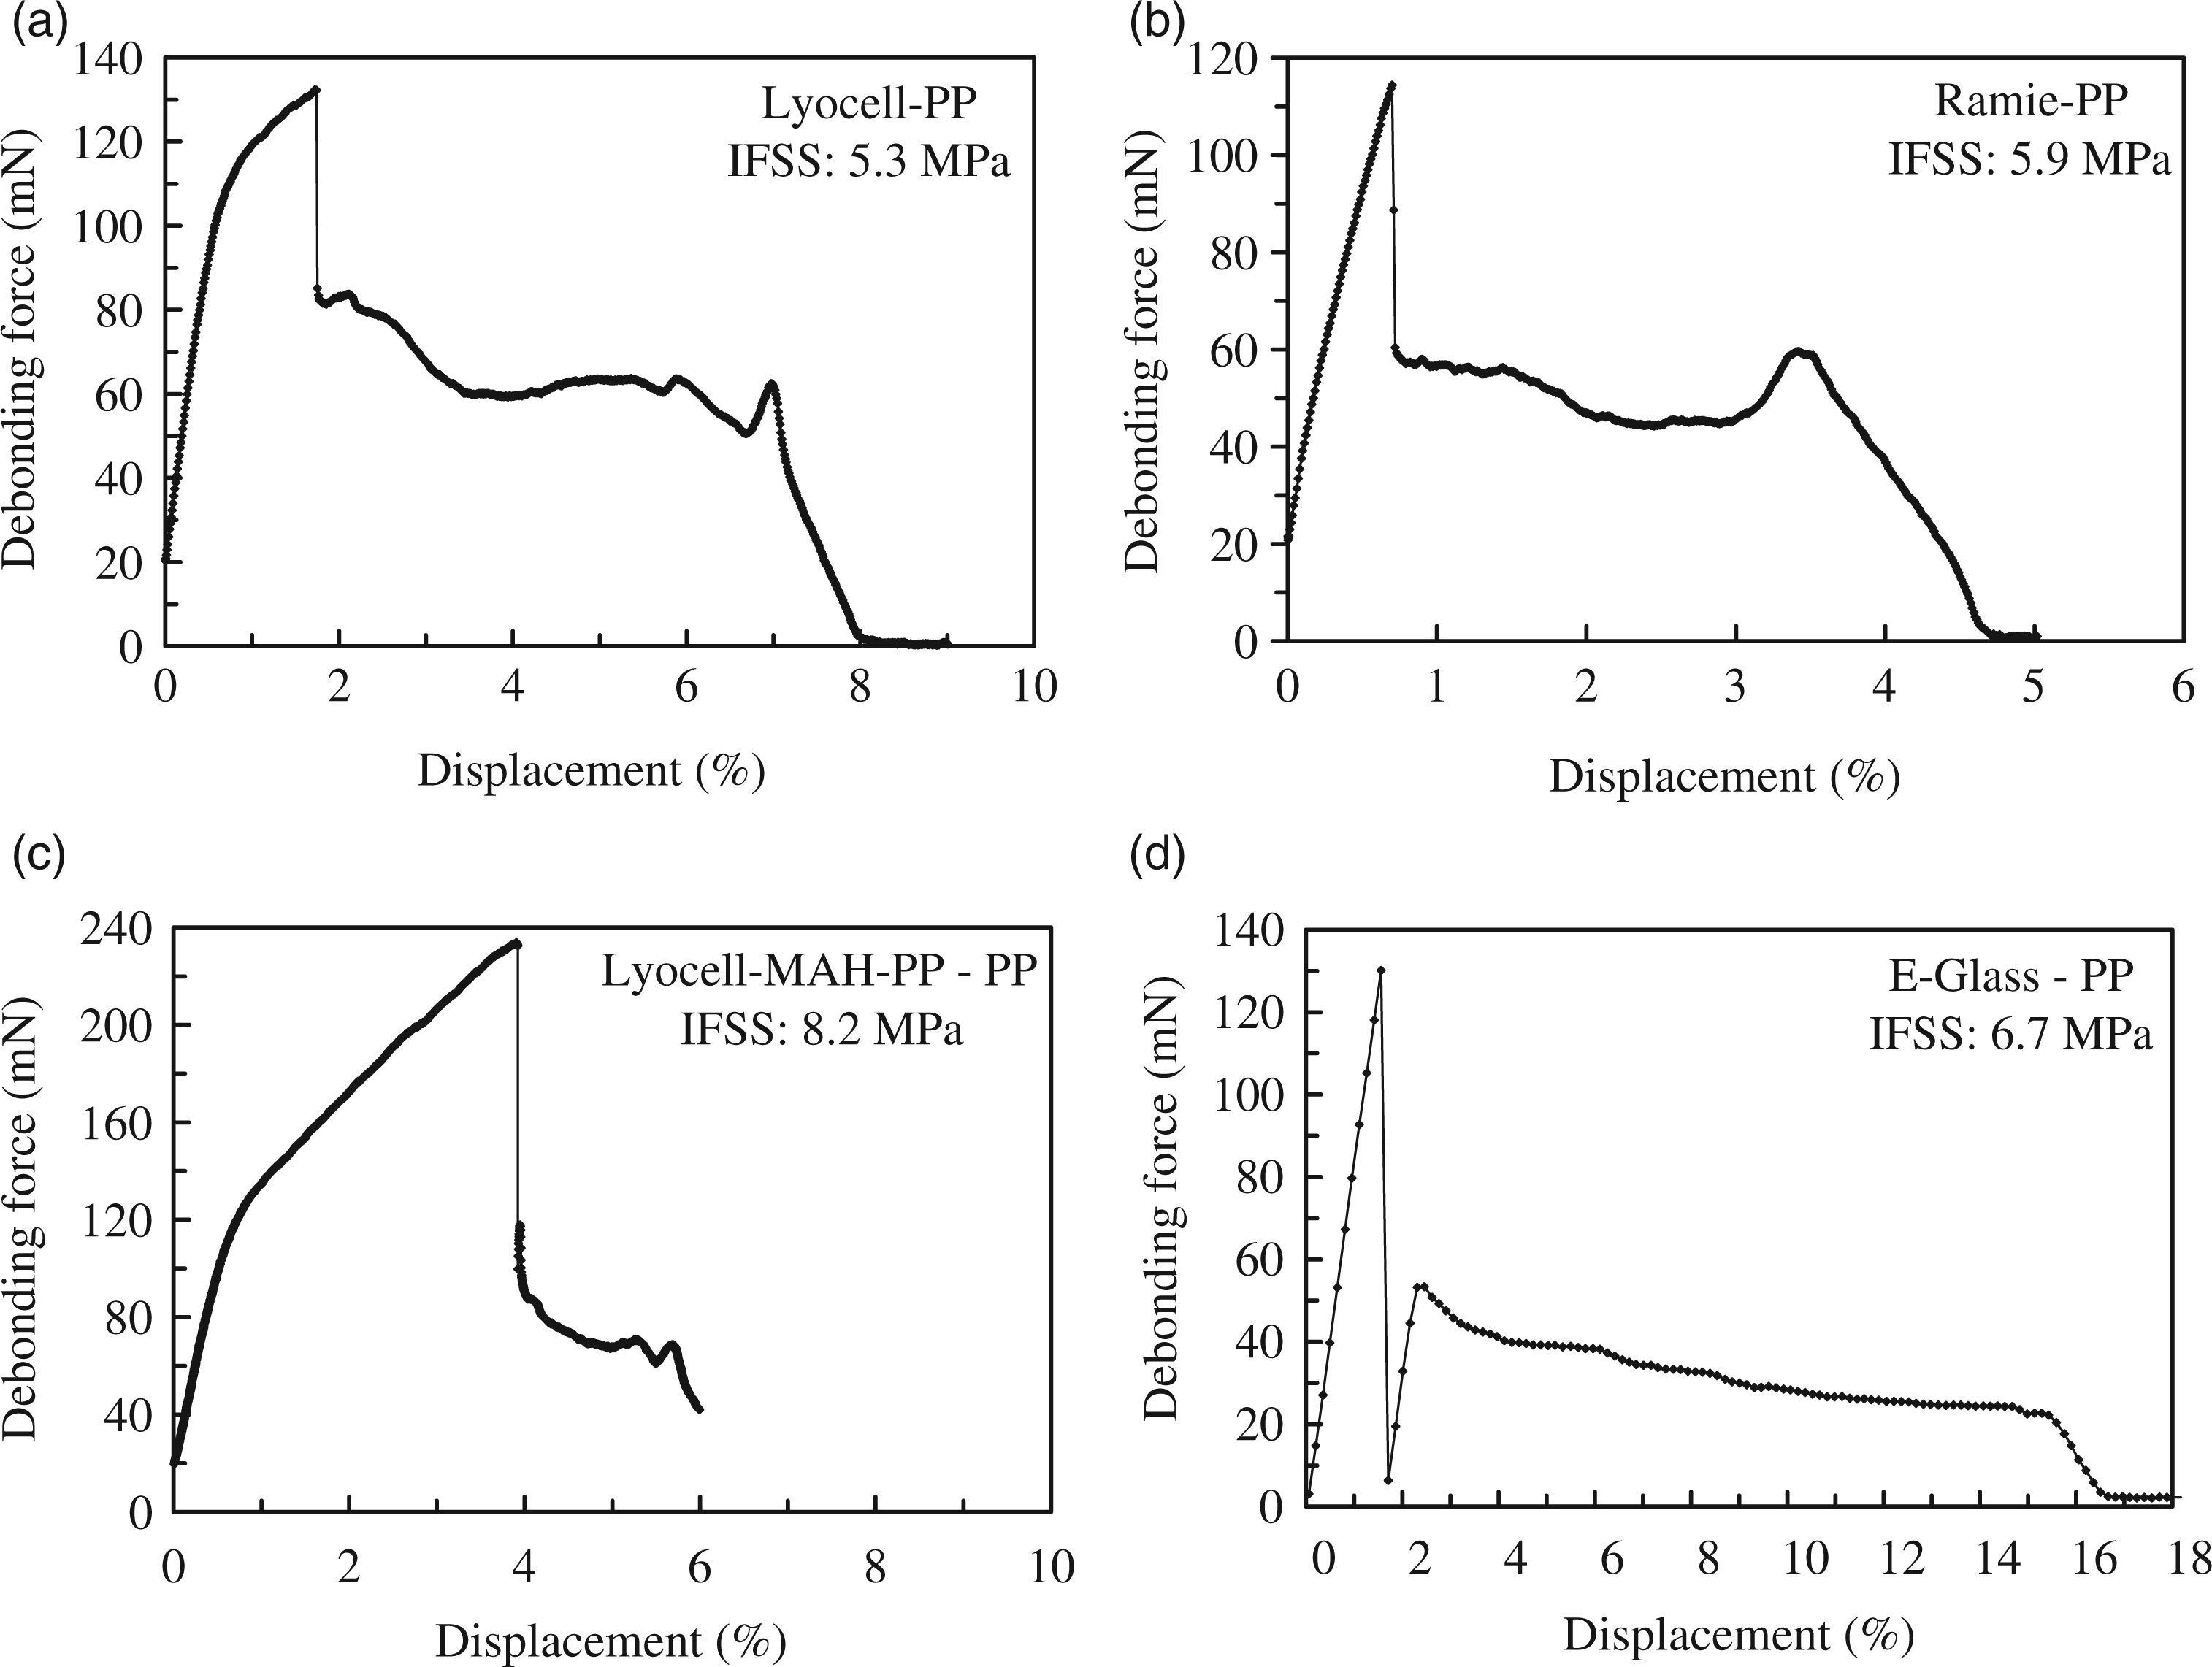
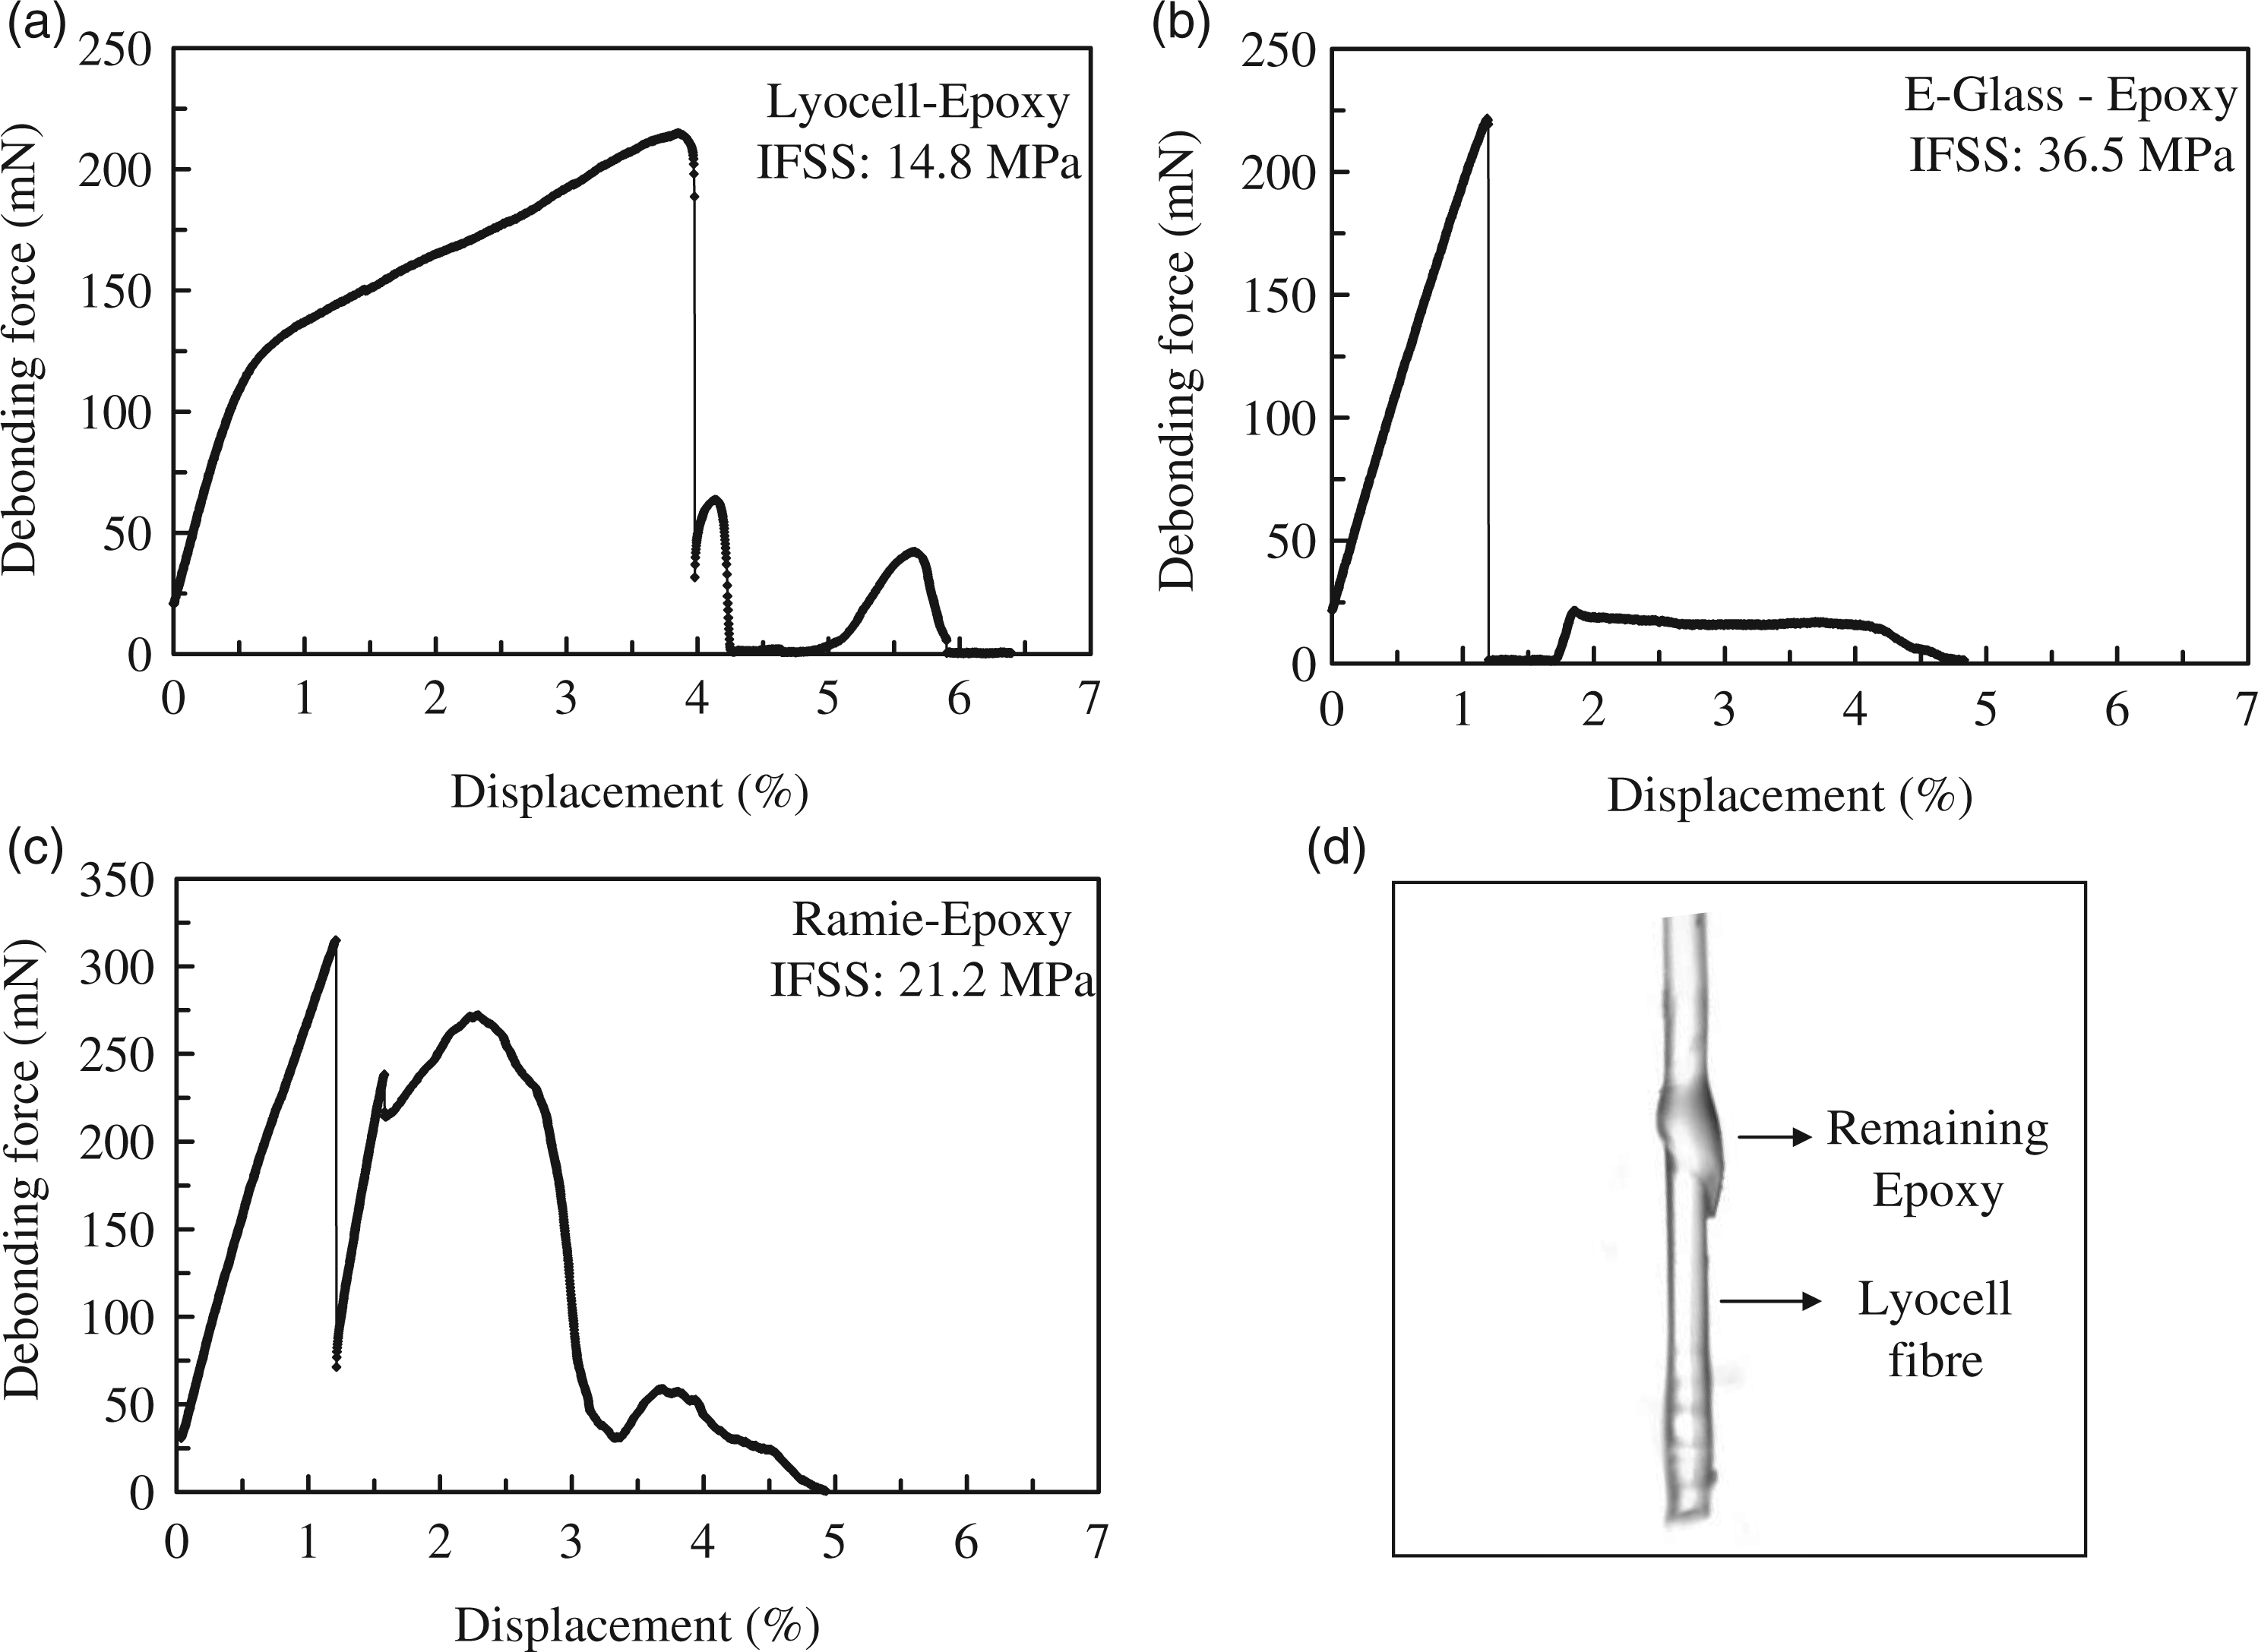
Set-up for microbond testing. The five elements shown in diagram are: (1) upper gripping, (2) micrometer, (3) lower gripping, (4) matrix droplet, and (5) single fiber. The fiber with the droplet is mounted to the tensile testing machine equipped with 50-N load cell. Upon testing, the fiber is pulled from the droplet until the fiber breaks or debonding occurs. Carbide cutter edges (microvise) are controlled with the help of micrometer allowing only the fiber to pass between flat edges, not the droplet. Free fiber length is around 12 mm and remained constant for all microbond tests. Typical force–displacement curves with PP matrix for: (a) lyocell, (b) ramie, (c) lyocell–MAH–PP, and (d) E-glass fibers obtained from microbond test. The shape of the curves remained constant for all embedded lengths (E-glass–PP, 322 ± 51 µm; lyocell–PP, 313 ± 71 µm; ramie–PP, 277 ± 41 µm; and Lyocell–MAH–PP – PP, 265 ± 15 µm). Typical force–displacement curves of lyocell–epoxy (a), E-glass–epoxy (b), and ramie-epoxy (c) obtained from microbond test. The shapes of the curves are not influenced by embedded lengths which were 132 ± 29 µm for lyocell–epoxy, 175 ± 30 µm for ramie–epoxy, and 145 ± 22 µm for E-glass–epoxy systems. Cohesive failure of the matrix (d) for lyocell–epoxy system could be the reason for the observed necking in its force–displacement curve.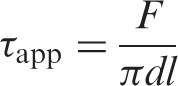

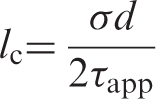
The critical fiber length, lc, was calculated using Equation (2)
Production and testing of unidirectional epoxy composites
Lyocell fiber rovings with a diameter of ∼10 µm and glass fibers rovings with a diameter of ∼20 µm were used as reinforcements. Epoxy composites were manufactured with a fiber content of 55 vol.% by compression molding. Composites were pressed at 80°C and 18 bar pressure for 3 h. To increase the wetting between fibers and matrices, 5 vol.% diluent was added to the uncured resin and the whole resin mixture was heated up to 50°C prior to pouring it into the mold. From each composite type, five rectangular specimens (145 × 20 × 2 mm3) were cut from the center of the composite block and two notches with a width of 2 mm were made prior to the shear test. 23 For tensile testing, only lyocell composites were selected and their fractured surfaces were studied using SEM with an acceleration voltage of 5 keV. To avoid the charging while imaging, specimens were sputter-coated with Au/Pd for 60 s.
Results and discussion
PP matrix
Compilation of IFSS results obtained from microbond test
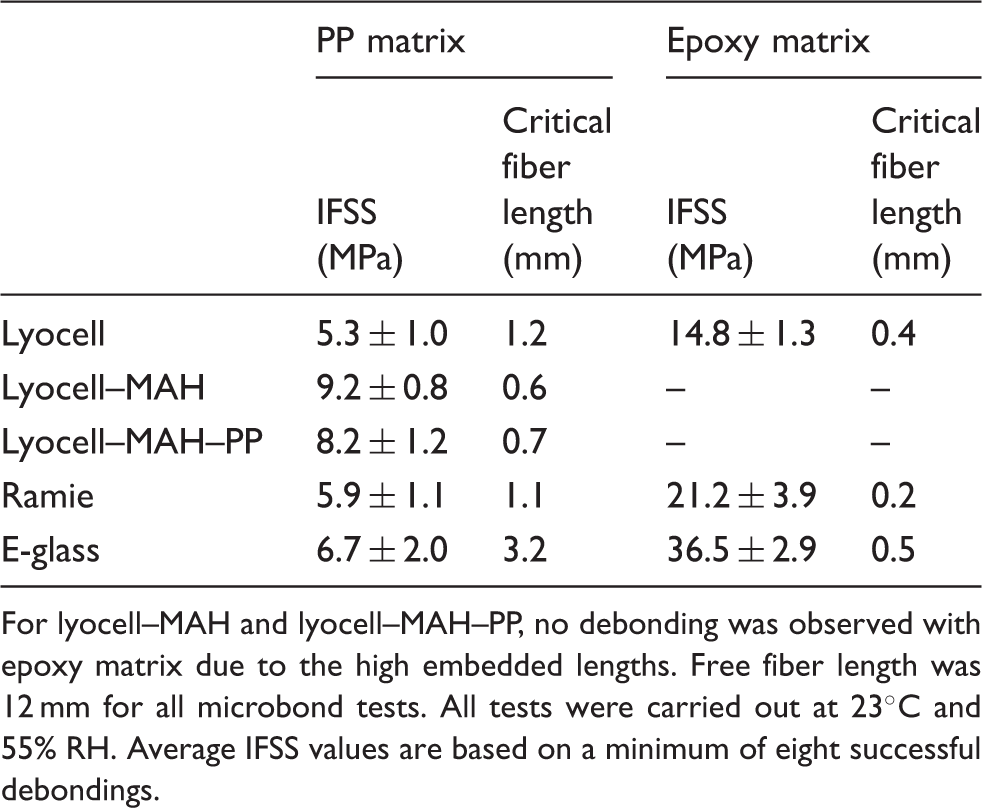
For lyocell–MAH and lyocell–MAH–PP, no debonding was observed with epoxy matrix due to the high embedded lengths. Free fiber length was 12 mm for all microbond tests. All tests were carried out at 23°C and 55% RH. Average IFSS values are based on a minimum of eight successful debondings.
The shape of the force–displacement curves corresponds closely to tensile stress–strain curves of the respective single fibers until the maximum force is attained (Figures 2 and 4). After that, catastrophic debonding or brittle fracture of the interface is typical of all fibers for a given free fiber length of 12 mm. After the brittle fracture of the interface, a renewed increase in force followed by a significant tail force of 20 mN is typical for the E-glass–PP system (Figure 4(d)). In contrast to this, a final frictional force of >50 mN was observed for lyocell–PP and ramie–PP. As shown in Figure 4(a) and (b), the final increase in force occurs at 7% and 3.4% displacements in the force–displacement curve of lyocell–PP and ramie–PP, respectively. This may be attributed to the entry of the fiber end into the microdrop. These fiber ends formed during scissor cutting, possess a higher diameter than the rest of the fiber and hence require a higher force to be pulled out through the microdop. As seen in Table 2, ramie fiber showed a slight increase in IFSS compared to unmodified lyocell. It is likely that mechanical interlocking due to surface roughness (Figure 1) is responsible for this difference.
By comparison, there is a clear increase in IFSS for MAH-modified and MAH–PP-modified lyocell compared to unmodified lyocell (Table 2). As reported in the literature,18,20 the formation of covalent bonds and hydrogen bonds between polar cellulose molecules and MAH could be the reason for such an increase. This improvement is also observed in the corresponding force–displacement curves irrespective of embedded lengths. Lyocell–MAH–PP shows debonding at 4% displacement (τapp = 8.2 MPa), as compared to pure lyocell (τapp = 5.3 MPa), in which debonding occurs at 2% displacement only (Figure 4(a) and (c)). As shown in Figure 2, around 9% displacement and ultimate strength of >300 MPa was observed for lyocell and lyocell–MAH–PP single fibers prior to the tensile fracture. In general, no significant difference was observed in the tensile stress–strain curves of untreated and modified lyocell fibers, conforming that chemical modification caused no mechanical damage to the fibers. Figure 6(a) shows the relationship between debonding force and embedded length for lyocell, lyocell–MAH, and lyocell–MAH–PP specimens. Regardless of embedded length, lyocell–MAH and lyocell–MAH–PP need a higher debonding force than lyocell fibers with PP matrix. In pull-out tests, such a relationship is described as bond ductility.
27
The above results illustrate the sensitivity of the microbond technique in distinguishing between modified and unmodified fiber surfaces.
Relationship between (a) debonding force-embedded length for PP and (b) debonding force-embedded length area for epoxy matrices observed in the microbond test.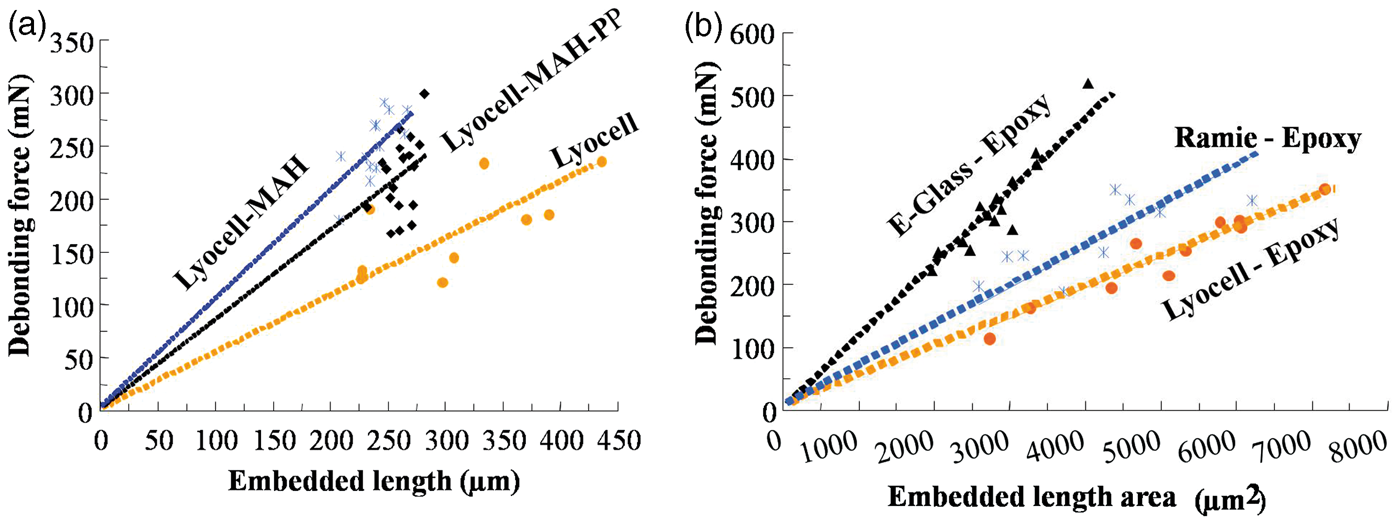
Epoxy matrix
In thermosets, thermal strains generated during curing or uneven distribution of hardener can induce significant variability. Therefore, each sample was carefully examined after post-curing. The average values of measured IFSS are shown in Table 2. E-glass fibers show an IFSS value of 36.5 MPa, which is almost twice as high as the IFSS values obtained for lyocell fiber. This is presumably due to the sizing of E-glass fibers, where coupling agents interact with E-glass and epoxy. 26 In contrast to the smooth-surfaced lyocell fibres (Figure 1), the ramie fibers revealed an increase in 50% of the IFSS values, presumably due to their surface roughness and good chemical bonding with the epoxy matrix. The linear relationship between the debonding force and embedded area as shown in Figure 6(b) confirms the above-mentioned differences among the IFSS values. The slope of the curves indicates an increase in fiber–matrix interaction in the order lyocell–epoxy (slope, 0.048) <ramie–epoxy (slope, 0.059) E-glass–epoxy (slope, 0.116). No debonding was observed between modified lyocell–epoxy combinations due to the high embedded lengths (or) increased bonding compared to the lyocell–epoxy system.
Typical force–displacement curves obtained from the microbond tests are shown in Figure 5. The absence of a tail force in the E-glass–epoxy curve and a negligible tail force in other curves indicate perfect debonding and brittle fracture of the final interfacial failure in thermoset composites. In contrast to lyocell–PP, necking can be assumed during the final debonding of the lyocell fiber from epoxy droplet (Figure 5(a)). This could be due to the Poisson shrinkage of the fiber or cohesive breakage in the upper meniscus of the matrix as shown in Figure 5(d). Cohesive fracture of the polymer was also reported for E-glass–epoxy 28 and for flax–polyester systems 17 in which only small amount of resin was remained on the fiber compared to the amount of epoxy remained on lyocell fiber in this study (Figure 5(d)). The very high frictional force observed in the force–displacement curve of ramie–epoxy is typical for rough natural cellulose fibers. The peaks in the force–displacement curves caused by the ‘fiber ends,’ which are typical for cellulose fibers, can also be observed here at 5.5% (Figure 5(a)) and 3.8% (Figure 5(c)) displacements for lyocell–epoxy and ramie–epoxy, respectively. The shapes of the curves are not influenced by embedded lengths which were 132 ± 29 µm for lyocell-epoxy, 175 ± 30 µm for ramie–epoxy, and 145 ± 22 µm for E-glass-epoxy systems.
Critical fiber length derived from IFSS
Critical fiber length plays a significant role in matrix–fiber stress transfer. 29 In composite production, the actual fiber length should be at least the critical fiber length in order to use the full fiber strength for the composite. Critical fiber lengths calculated for different fiber–matrix combinations are displayed in Table 2. Due to the low shear strength values obtained with the PP matrix, lyocell fibers show high critical fiber length (1.2 mm). For the modified fibers, however, there is a noticeable decrease in the critical fiber lengths, as compared to unmodified fibers. Similar results were published by Karlsson 30 for fibrillated lyocell with low-density polyethylene matrix. So it is recommended to use modified lyocell fibers not longer than 1 mm for extrusion or injection molding. This would minimize the well-known problematic behavior of regenerated fibers in these processes (clumping, entangling, and fiber breakage). 31 contrast to thermoplastics, very low critical fiber lengths (0.2–0.4 mm) are observed with thermoset matrices. Due to the high tensile strength of E-glass fiber compared to lyocell, high critical fiber lengths of 3.2 and 0.5 mm are obtained for E-glass with the PP and epoxy matrices, respectively. These results can serve as a confirmation of the accuracy of the microbond test, since chopped E-glass fibers with length of 3 and 0.2 mm are generally used as fillers rather than reinforcements in PP and epoxy matrices, respectively.
Shear strength of unidirectional epoxy composites
Shear stress–strain diagrams of three different epoxy composites are shown in Figure 7(b). The in-plane or interlaminar shear strength (ILSS) values of lyocell-epoxy, E-glass–epoxy, and ramie–epoxy are 37, 34, and 28 GPa, respectively. The ILSS values of E-glass–epoxy are quite comparable to the IFSS from the microbond test. The ILSS of ramie–epoxy and lyocell–epoxy are 20% and 50% higher than their respective IFSS values measured from microbond test. Apart from these quantitative values, the shear fracture observed both in micro- and macrolevels are quite similar. The shear stress–strain diagram shown in Figure 7(b) again indicates a brittle fracture of the interface (sudden force drop). Mode-ІI shear failure in lyocell–epoxy specimen is clearly a matrix-dominated failure as shown in Figure 7(a). Interface failure occurred catastrophically between the two notches dividing the specimen into upper half and lower half with very little fiber pull-out.
The lyocell–epoxy composite specimen (145 × 20 × 2 mm3) after the double notch shear test is shown in (a). Shear stress–strain diagrams of three different composites including lyocell–epoxy are shown in (b) and the maximum value of the each curve is designated as ILSS. From (a) and (b), it can be noticed that the interfacial failure of the lyocell–epoxy specimen is brittle in nature.
In addition to microbond and In-plane shear tests, the SEM fractographs of the tensile specimens were also analyzed to understand the phenomena of interfacial failure between lyocell fibers and epoxy matrix. As shown in Figure 8(a), the fracture surface of the composite revealed quite a bit of fiber pull-out. The majority of the fibers broke in line with the fracture of the matrix. In the zone of fiber pull-out, the surfaces of the pulled-out fibers are in general smooth and are hardly distinguishable from the original lyocell fibers. Only isolated particles of the epoxy matrix are visible on the surface of the pulled-out fibers, as shown in Figure 8(b). It is assumed that fibers are pulled from the surrounding matrix in a brittle manner followed by less frictional forces. It is likely due to the Poisson contraction of lyocell fibers and debonding. This could serve as an extra evidence for the brittle failure of the lyocell–epoxy interface.
SEM picture showing the tensile fracture surface of the epoxy composites reinforced with lyocell fiber rovings (diameter of 10 µm). Excellent bonding between lyocell–epoxy composite systems can be assumed due to the low fiber pull-out shown in (a). For the pulled-out fibers shown in (b), no significant amount of resin is adhering on the fiber surface, which could provide the evidence that the interfacial debonding is brittle in nature for the lyocell–epoxy composite system.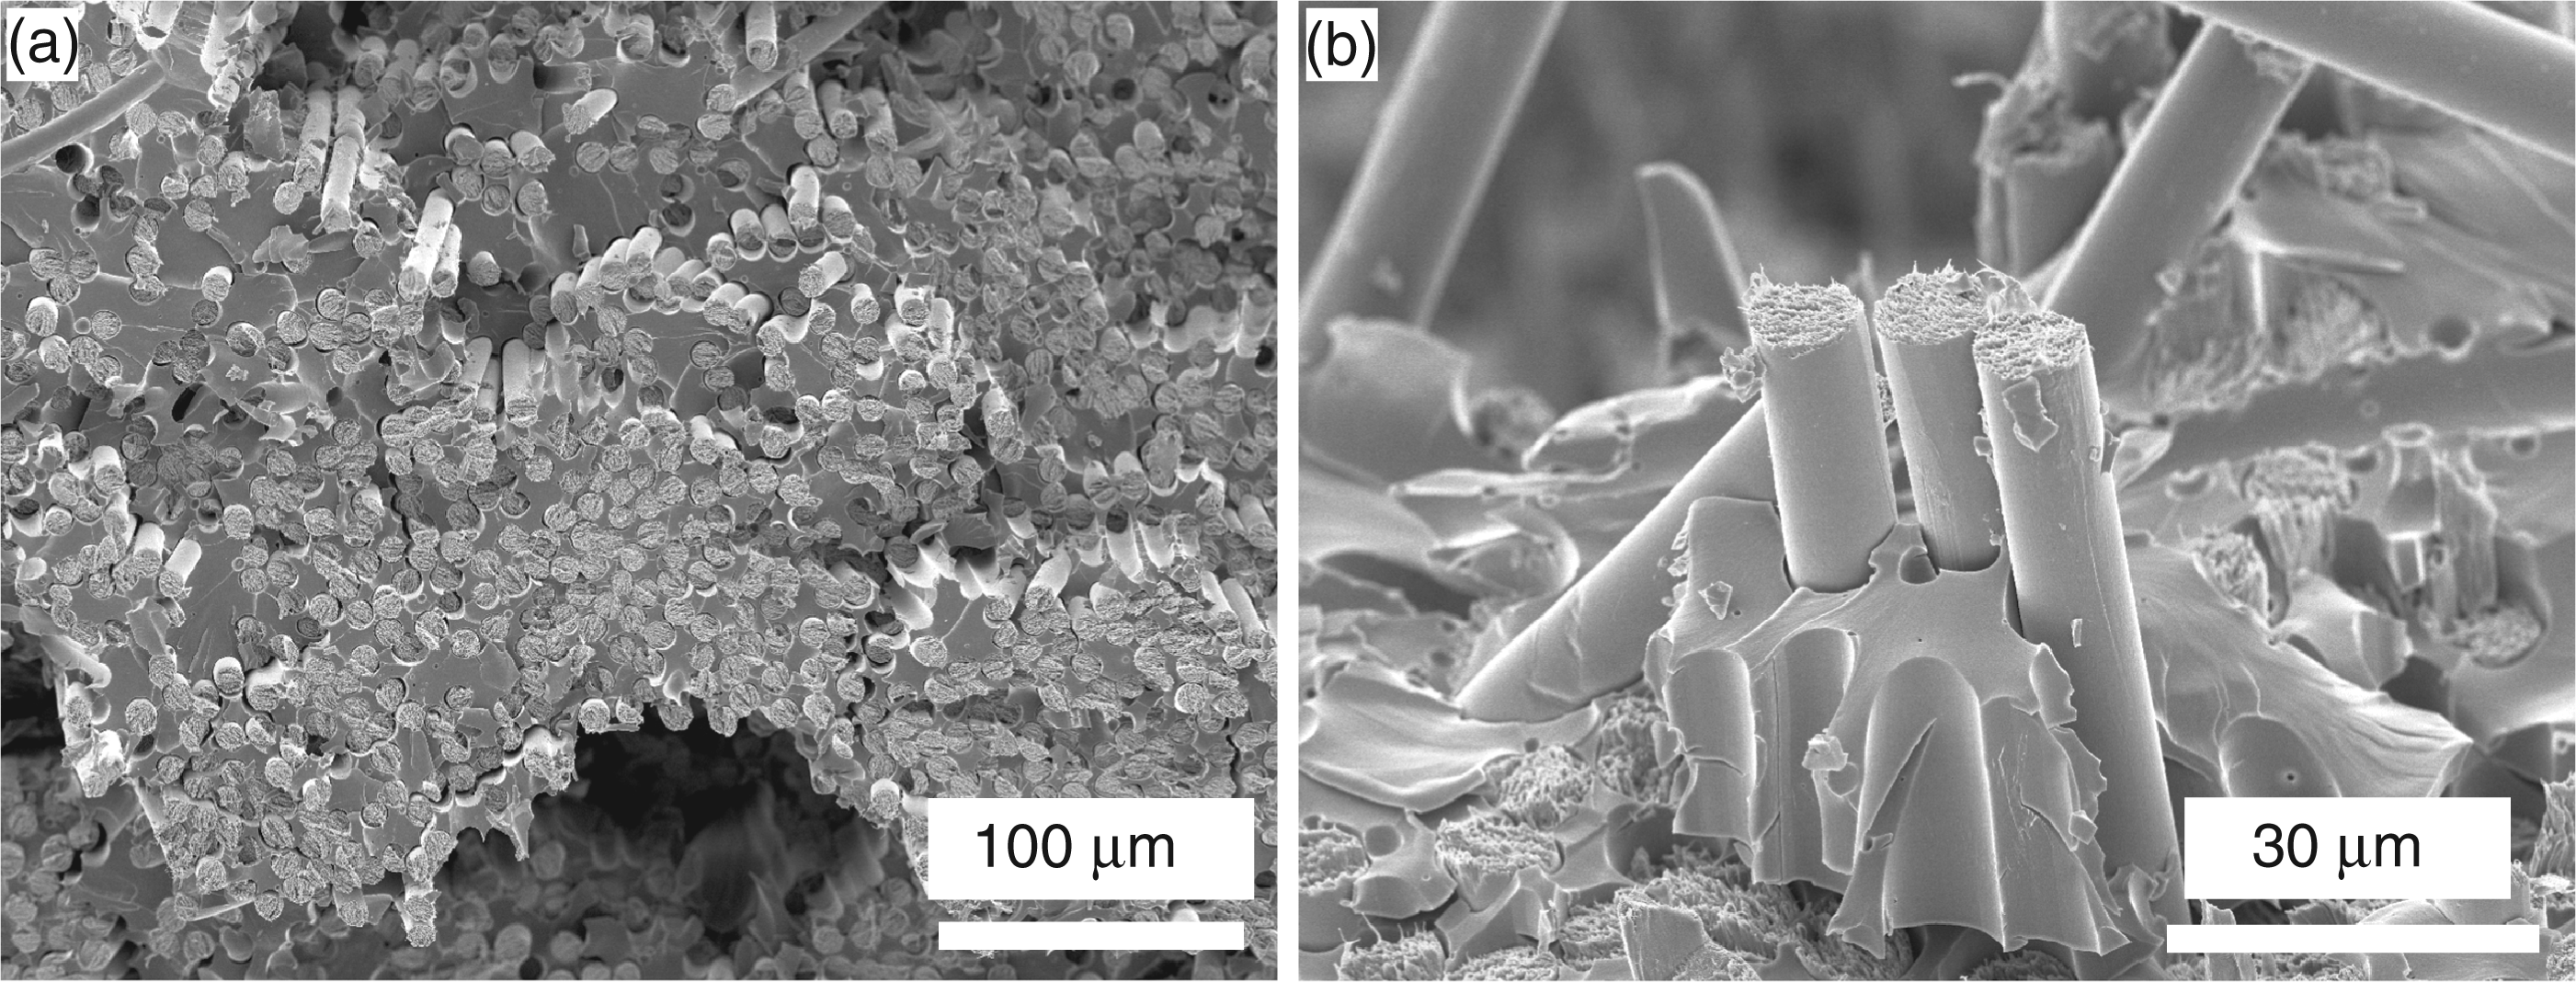
Summary and conclusions
Microbond test was used to determine the adhesion between lyocell fibers and polymer matrices (PP and epoxy matrices). Unmodified lyocell fiber shows inferior adhesion with the PP matrix compared to the E-glass and ramie fibers. Surface modification of lyocell with MAH and PP–graft–MAH (PP–MAH) significantly improves the adhesion with PP matrix. Lyocell shows excellent adhesion to epoxy and no modification is needed with this matrix polymer. The interfacial failure between lyocell fiber and epoxy matrix was found to be brittle in nature.
Footnotes
Acknowledgments
Financial support was provided by the Austrian government, the provinces of Lower Austria, Upper Austria, and Carinthia as well as by the Lenzing AG. We also thank the Johannes Kepler University, Linz, the University of Natural Resources and Applied Life Sciences (BOKU), Vienna, and the Lenzing AG for their in-kind contributions. R.B. Adusumali thank Prof U. Ramamurty (IISC, Bangalore, India), Dr Follrich, and Prof Barbara Hinterstoisser (BOKU, Vienna, Austria) for facilitating fruitful discussions during the manuscript preparation.