
Abstract
A micromechanics parametric study was performed to investigate the effect of carbon nanofiber morphology (i.e. hollow vs. solid cross-section), nanofiber waviness, and both nanofiber–resin interphase properties and dimensions on bulk nanocomposite elastic moduli. Mori–Tanaka and self-consistent models were developed for composites containing heterogeneities with multilayered coatings. For a given nanofiber axial force–displacement relationship, the elastic modulus for hollow nanofibers can significantly exceed that for solid nanofibers resulting in notable differences in bulk nanocomposite properties. In addition, the development of a nanofiber–resin interphase had a notable effect on the bulk elastic moduli. Consistent with results from the literature, small degrees of nanofiber waviness resulted in a significant decrease in effective composite properties.
Introduction
Composite materials are widely used in aerospace/automotive applications due to their good mechanical properties, tailorability, and multi-functionality.1,2 Over the past two decades, nanoreinforced composite materials have been developed3,4 with the goal of obtaining significant material property enhancements resulting from the relatively high surface-area-to-volume ratio associated with common nanoreinforcements. Recent studies have emphasized the development of analytic and numerical models to facilitate nanomaterial design in order to minimize the requisite amount of specimen preparation and testing. 5 Nanocomposite effective properties depend on a number of factors including nanoreinforcement volume fraction, aspect ratio, orientation, and dispersion, as well as matrix characteristics. 6 – 8 In addition, the development of a nanoreinforcement–matrix interphase region can have a large influence on bulk composite properties since the volume fraction of the interphase can be significant in comparison to the volume fraction of the nanoreinforcement; this is in contrast to traditional fiber-reinforced composites where the volume fraction of the interphase is relatively small. 8
In this study, classic analytic micromechanical models (i.e. Mori–Tanaka and self-consistent) have been employed to estimate effective properties for composites containing multilayered ellipsoidal heterogeneities. 9 – 11 The influence of nanofiber aspect ratio, cross-section (hollow vs. solid), interphase, and degree of waviness on effective properties is specifically addressed.
Morphology and properties of vapor-grown carbon nanofibers
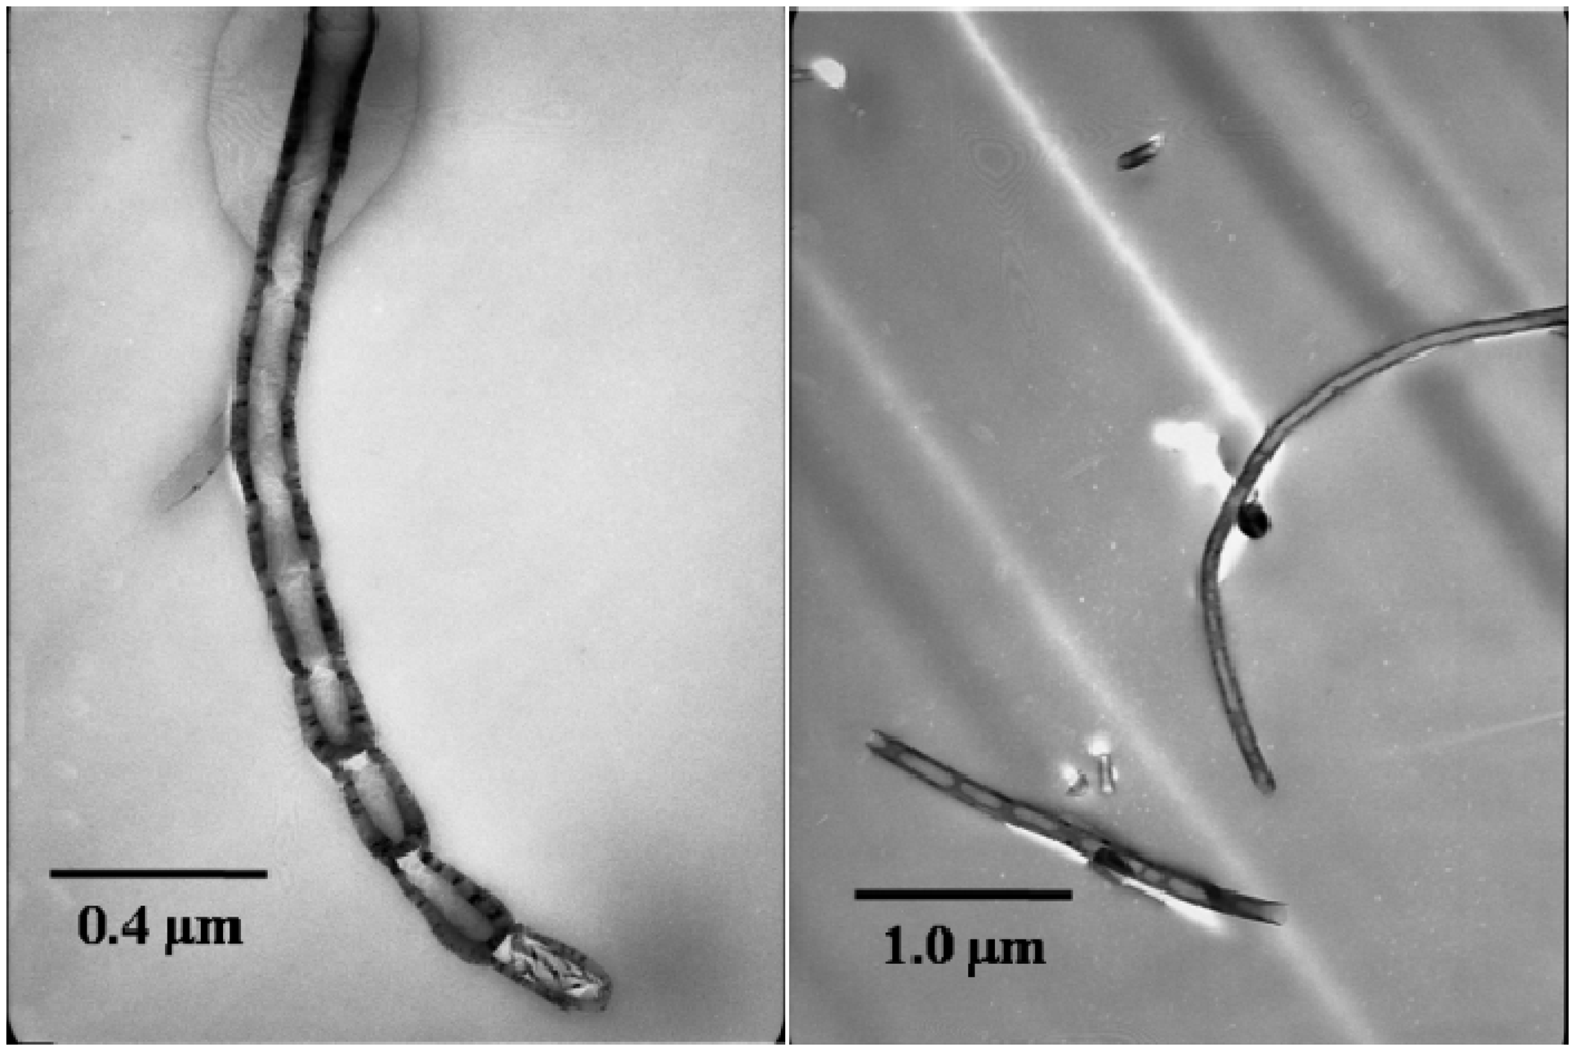
As-manufactured vapor-grown carbon nanofibers (VGCNFs) may display a variety of fiber architectures. Individual fibers are most often hollow (Figure 1), or display a bamboo-like structure (Figure 2). Typically, VGCNF diameters and aspect ratios fall in the ranges 60–200 nm and 50–2000+, respectively.
12
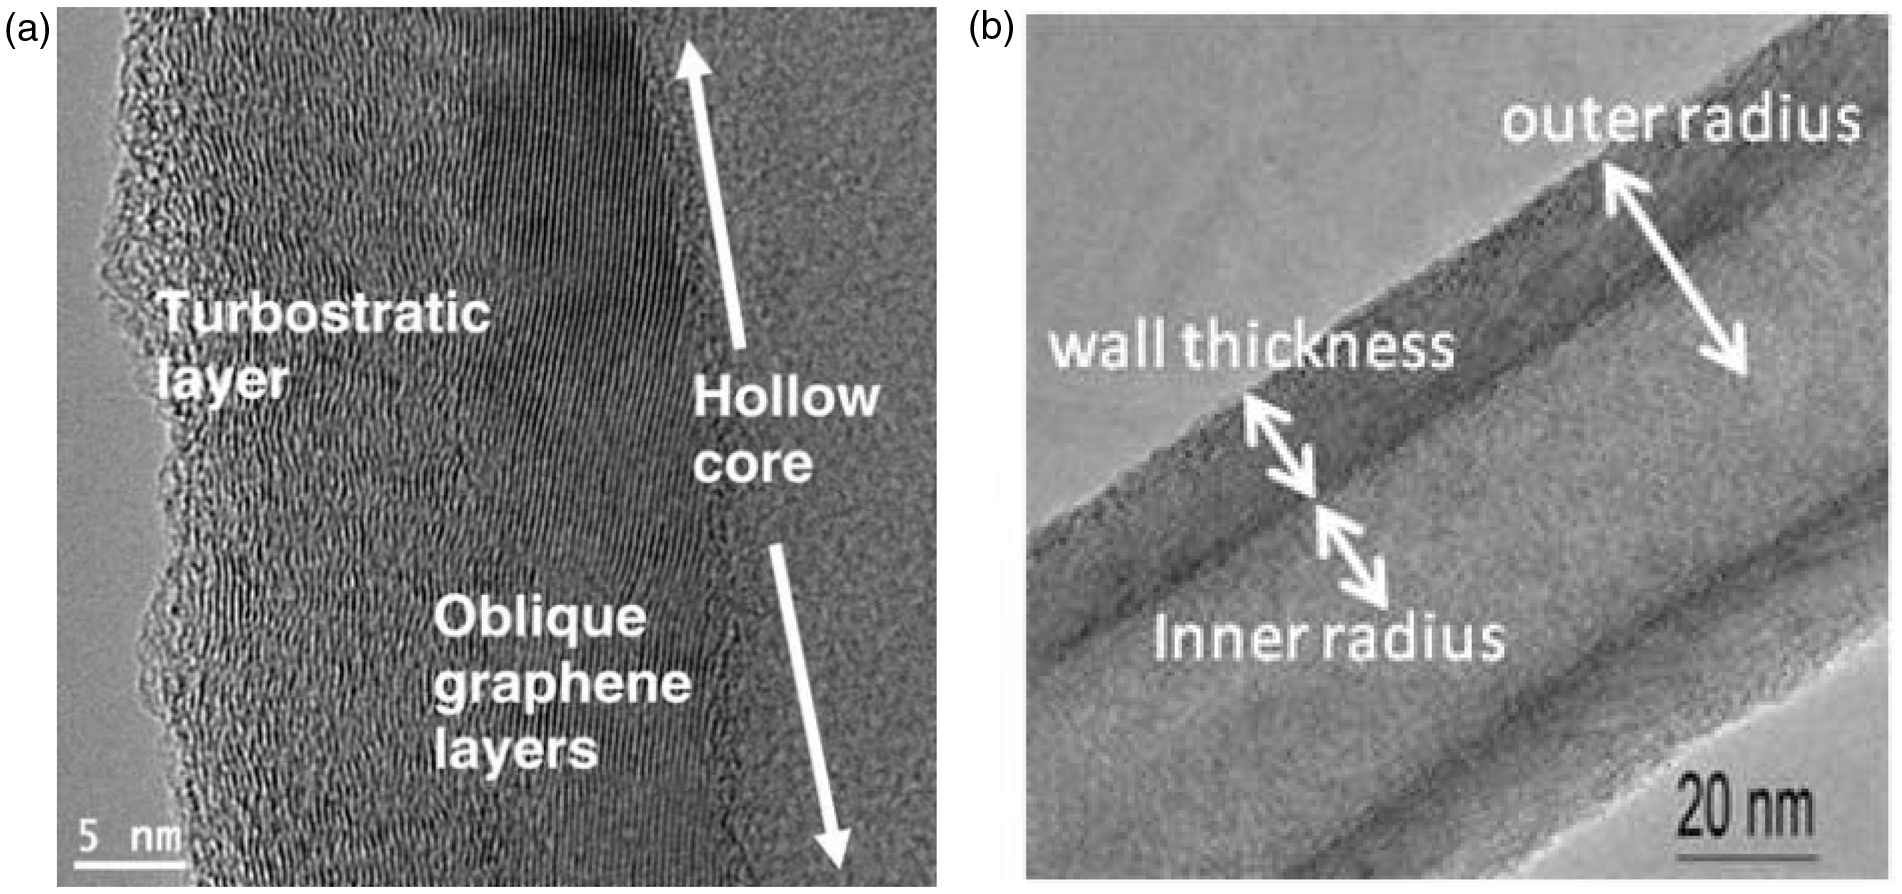
In addition, the composition of VGCNFs may vary radially throughout the wall thickness. For example, Figure 3 shows a transmission electron microscopy (TEM) image of a VGCNF cross-section from Ozkan et al.
12
and Tibbetts et al.
13
that clearly shows a hollow VGCNF core surrounded by aligned graphene and then outer turbostratic layers. Provided that the mechanical properties of these layers are known, the bulk nanocomposite properties could be estimated using the procedure outlined in this study.
SEM images of hollow VGCNFs. TEM images of VGCNFs with bamboo-like structure.
Several recent studies have employed novel experimental approaches to determine VGCNF moduli and strengths, as well as to measure nanofiber–matrix interphase properties. Manoharan et al.
14
performed single-nanofiber pullout tests using in situ scanning electron microscopy (SEM) with a tungsten probe tip to measure VGCNF/epoxy interphase properties. Ozkan et al.
12
performed microelectromechanical system-based tensile tests of Applied Sciences Inc. PR-24-XT series VGCNFs. The tensile force (F) vs. displacement (Δ) response was determined for a large number of nanofibers over a range of typical nanofiber diameters. These data were used to determine a statistical distribution of nanofiber tensile moduli (nominal value 240 GPa) and strengths (nominal value 2.35 GPa). In developing the nanofiber stress–strain responses,
12
the authors assumed the VGCNFs had solid cross-sections due to difficulties in measuring the hollow VGCNF wall thicknesses. Note that for a given force–displacement response and fixed nanofiber outer radius (Ro), the stress in a hollow nanofiber (σH) will exceed that of a solid nanofiber (σS) due the lower amount of solid carbon in the hollow nanofiber’s cross-section. Accordingly, the elastic modulus (EF) of the solid carbon in a hollow nanofiber with inner radius, Ri, will exceed that of the solid nanofiber (EFS) for this case. i.e.,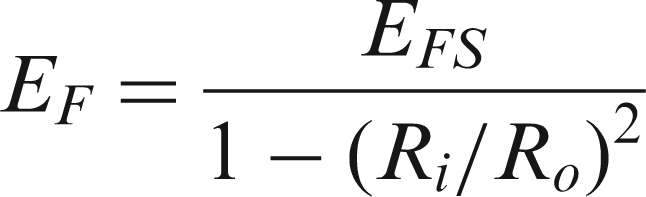
This suggests the previous literature treatment
12
underestimated the true carbon stiffness and strength. This is shown schematically in Figure 4. Figure 4(c) contains a plot of the elastic modulus of solid carbon in a hollow nanofiber, EF, as a function of the ratio, Ri/Ro (this assumes a fixed nanofiber force–displacement relationship). In this figure, the modulus has been normalized by that of a solid nanofiber, EFS. Included in Figure 4(c) is the range of experimentally observed nanofiber wall thicknesses, (Ri/Ro)
EXP
, based upon TEM imaging of PR-24-XT-LHT-OX VGCNFs in as-manufactured thermoset nanocomposites.
15
Clearly, accurate determinations of typical nanofiber cross-section dimensions and morphology are crucial for quantifying the elastic properties and strengths of VGCNFs. As an aside, the authors have characterized the statistical distribution of nanofiber diameters, wall thicknesses, aspect ratios, and degree of fiber waviness based upon extensive TEM imaging of PR-24-XT-LHT-OX VGCNFs in a vinyl ester resin.
15
For reference purposes, a nominal VGCNF outer diameter of 150 nm was assumed in developing effective nanocomposite properties in this study.
(a) Nanofiber subjected to fixed value of tensile force, (b) axial stress–strain response for solid and hollow fibers, and (c) nanofiber elastic modulus as a function of nanofiber wall thickness (Equation (1)).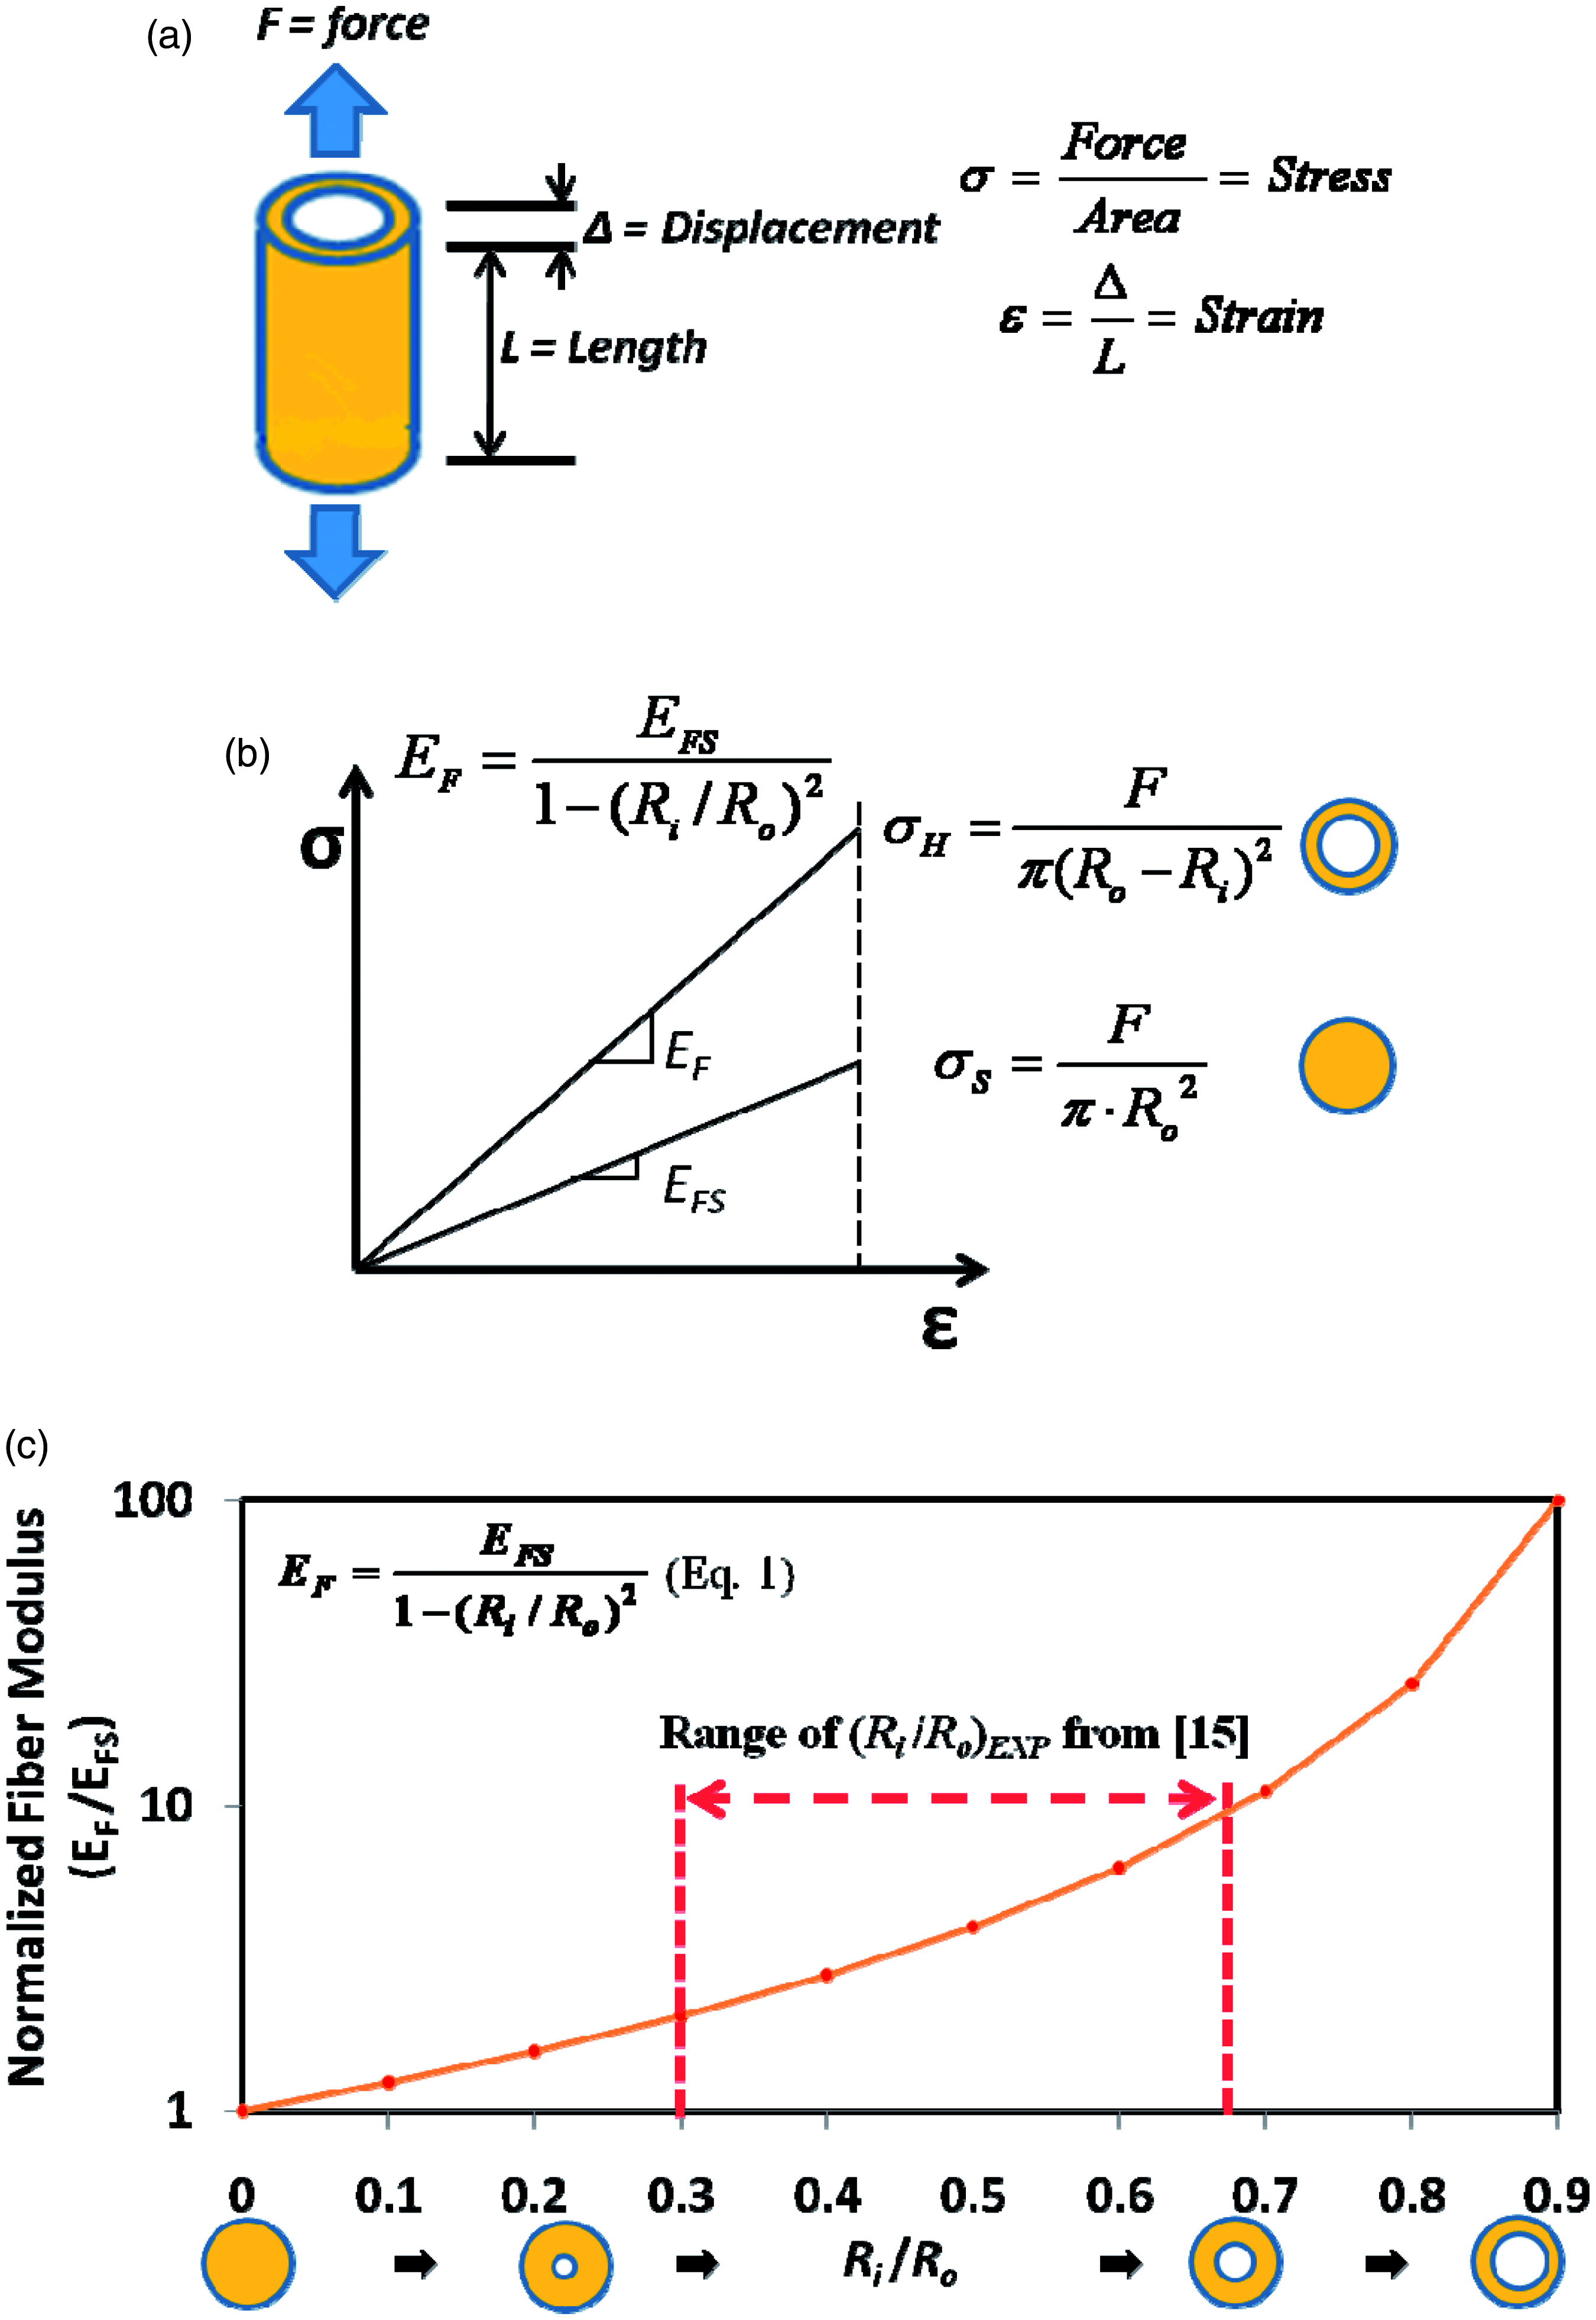
Nanofiber–matrix interphase properties
One key issue is determining the effect of a nanofiber–matrix interphase on bulk composite properties. The interphase plays a crucial role in the load transfer from matrix to fiber.8,16,17 Given the relatively large surface area-to-volume ratio associated with typical nanoreinforcements, the volume fraction of an interphase region may be significant compared to that of the nanoreinforcements. Thermoplastic composites with 6–10 µm diameter continuous carbon fibers have fiber–matrix interfacial regions over 500 nm thick in some cases. 18 – 22 If a 100 nm diameter nanofiber induced a similar interphase thickness, then the interphase volume fraction would be 120 times greater than that of the nanofibers. This suggests that the mechanical properties of the interphase, while very difficult to experimentally measure, may play a crucial role in determining the effective nanocomposite properties. As part of a parallel study, we are investigating the determination of nanofiber–matrix interphase properties using molecular dynamics simulations. 23 In this study, a parametric study was performed to assess the influence of the mechanical properties and dimensions of both the fiber and the interphase region on the predicted elastic moduli.
Micromechanical modeling
Mori–Tanaka and self-consistent models have been used to estimate effective heterogeneous material properties, particularly for composites containing low volume fractions of reinforcements in elastic resins. Such approaches are based upon the Eshelby solution 24 for the stress and strain field due to an ellipsoidal inclusion in an infinite domain subjected to uniform far-field loading. 9 ,10
Mori–Tanaka method
The Mori–Tanaka method (MTM) assumes that a single ellipsoidal heterogeneity is embedded into a matrix domain, whose strain field has been perturbed by other heterogeneities in the system. The MTM uses the continuum averaged stress and strain fields to predict effective material properties.
9
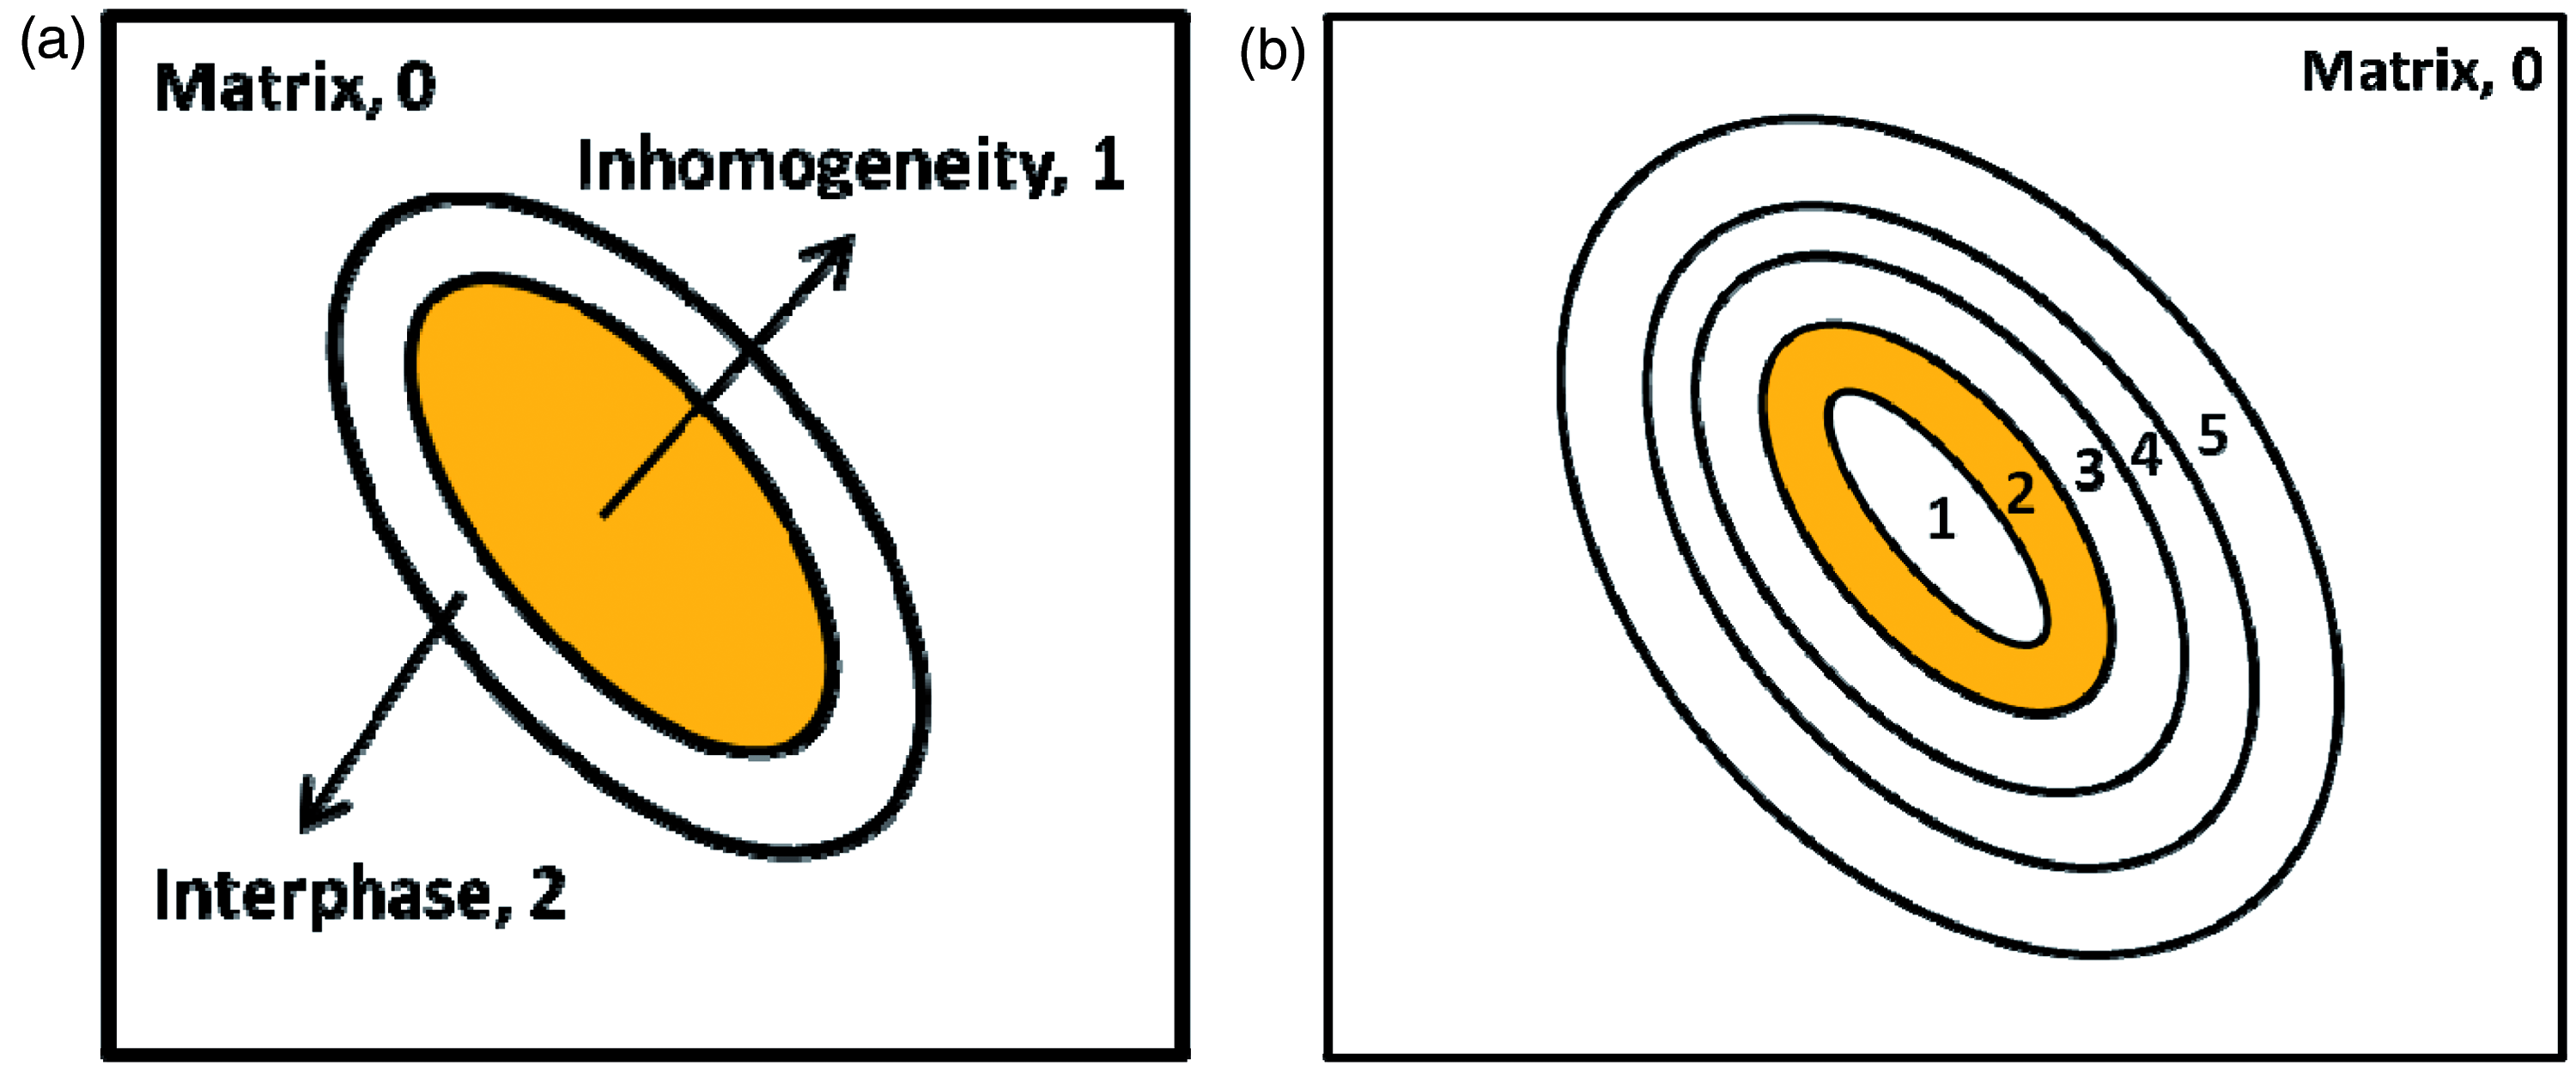
–11,25,26 For a composite with matrix phase (0) and fiber phase (1), the effective fourth-order elastic stiffness tensor can be expressed as10 Schematics of: (a) an ellipsoidal fiber surrounded by an interphase and (b) a hollow ellipsoidal fiber surrounded by multiple interphase layers adapted from Nemat-Nasser and Hori.10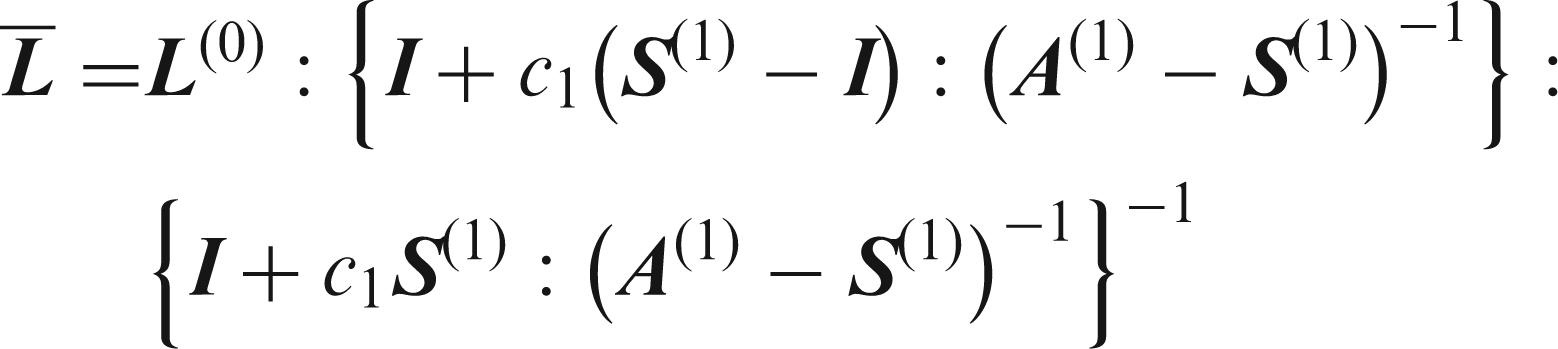


Here, 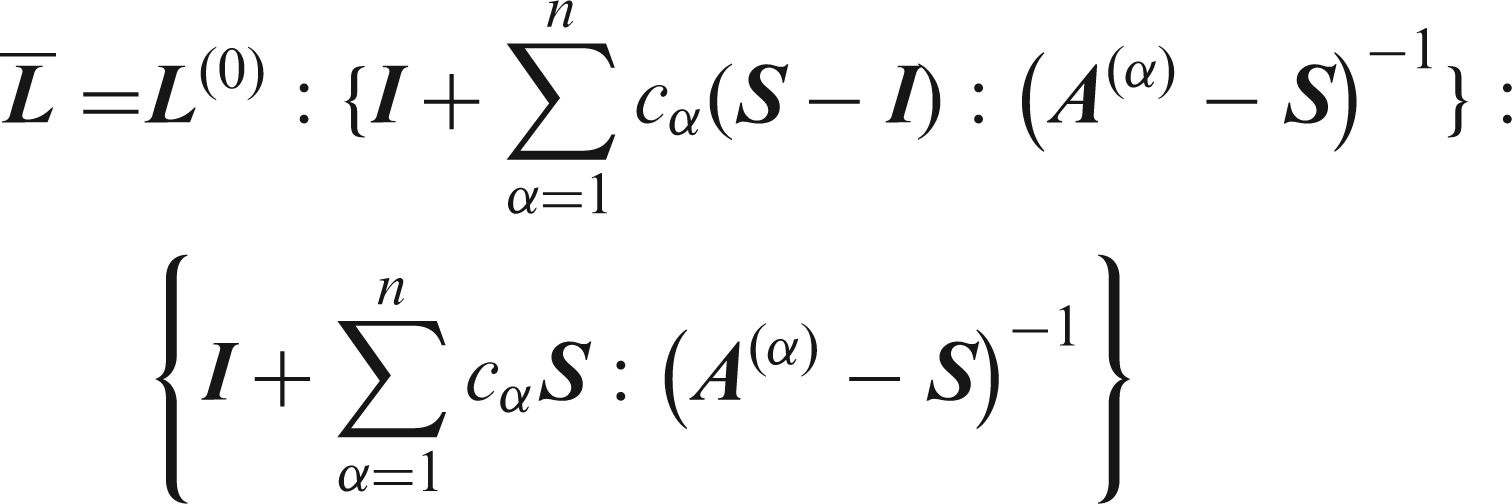
Self-consistent method
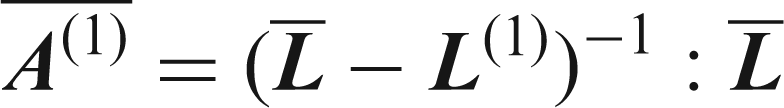
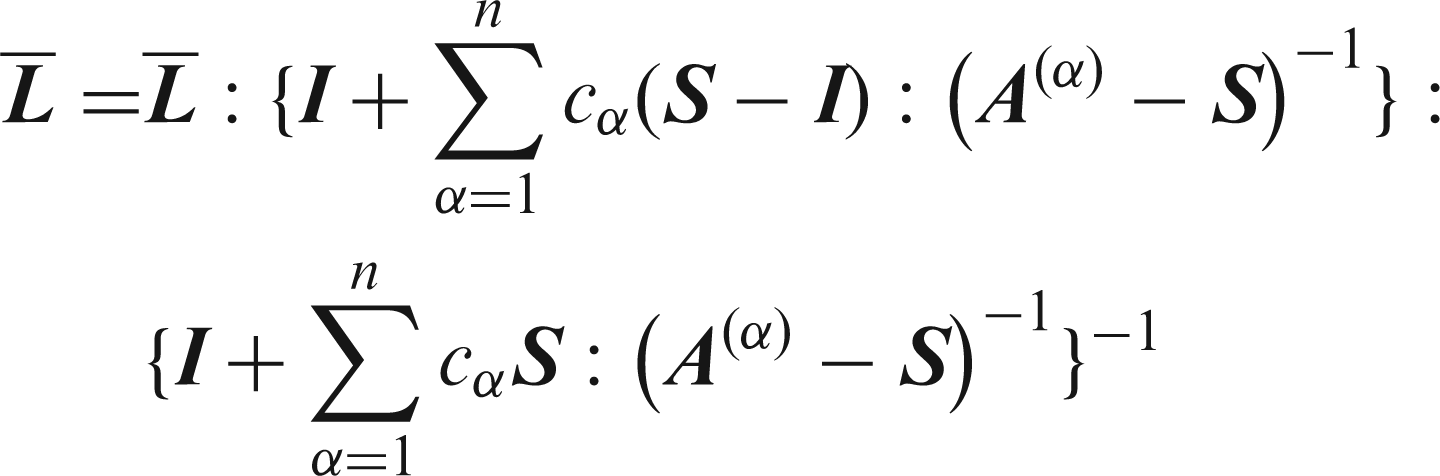
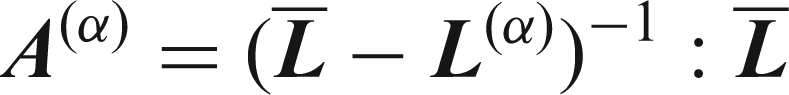
The self-consistent method (SCM)
9
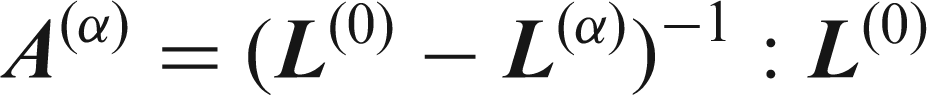
–11,27 assumes that the nth ellipsoidal inhomogeneity is embedded within a homogeneous matrix with unknown effective stiffness tensor, 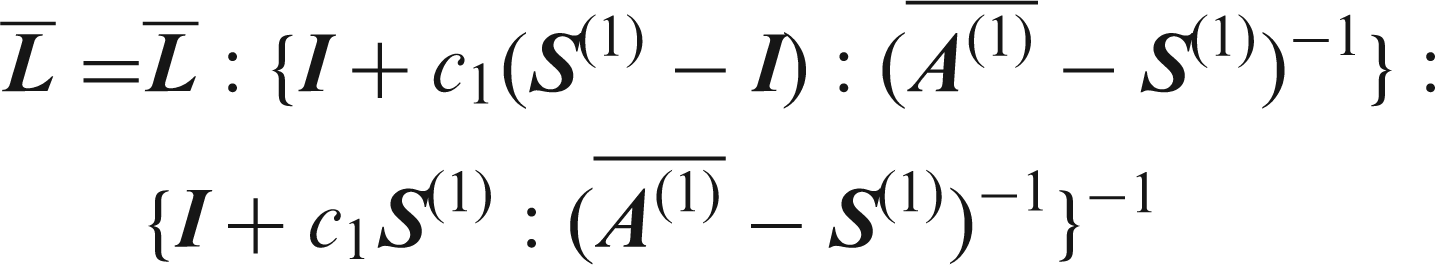
Here,
Similar to the MTM, the SCM may be modified to include the effect of a fiber–matrix interphase on bulk composite properties. For example, for a composite reinforced with matrix (0), solid fibers (1), and fiber–resin interphase (2), the effective elastic stiffness tensor may be expressed as10

Here, 
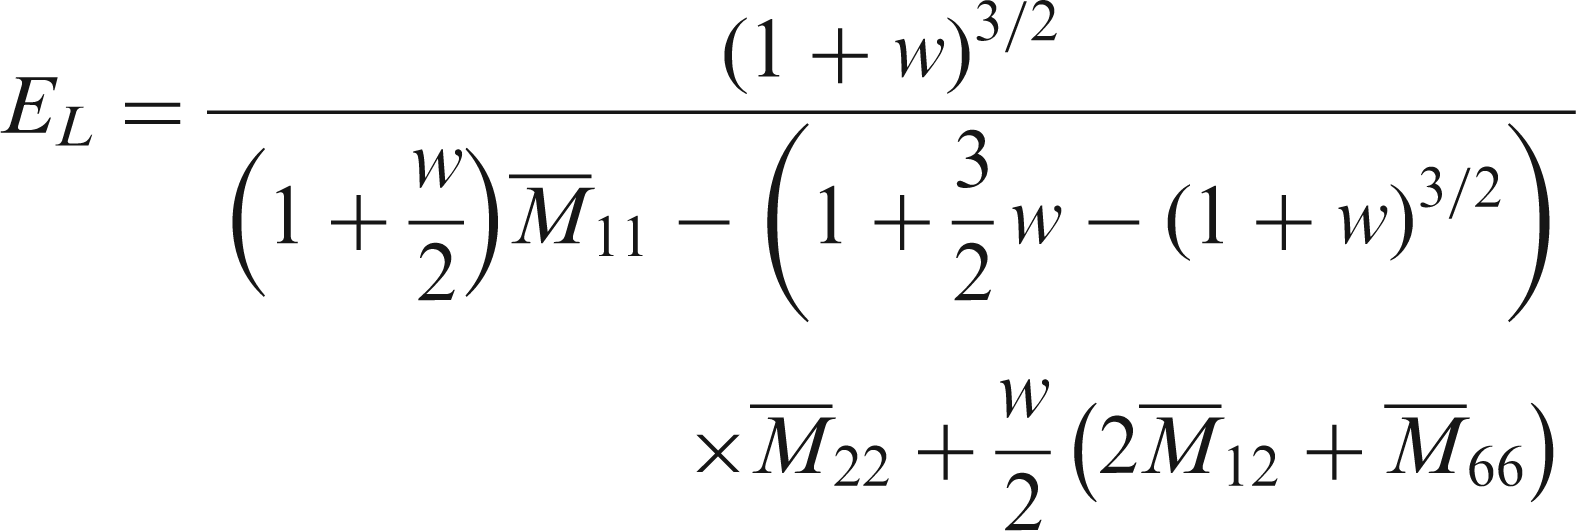
Effect of fiber waviness
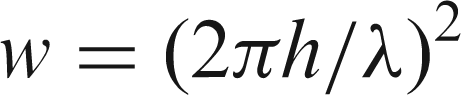
In general, the bulk elastic properties of composites containing straight fibers will exceed those of otherwise identical composites containing fibers with varying degrees of fiber waviness.28–30 Even small amounts of overall fiber waviness can result in a significant decrease in composite elastic moduli; this is particularly a concern for VGCNFs or other fibers that exhibit a large degree of waviness in their as-manufactured state. Figure 6(a) contains a SEM image of a typical VGCNF. The geometry of a wavy fiber may be approximated using a simple cosine function. For such a fiber aligned in the x-direction, the y-coordinates of points lying on the centerline of the fiber may be expressed as (a) SEM image of a VGCNF, (b) idealized segment of a wavy fiber, and (c) examples of different degrees of fiber waviness (h/λ = fiber waviness ratio).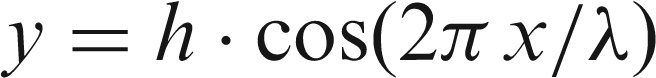

Here,
MATLAB
31
algorithms were developed, based upon both the MTM and SCM, to predict the effective properties for composites containing ellipsoidal heterogeneities with an arbitrary number of coating layers. Figure 7 shows a flow chart summarizing the calculation steps used in the composite effective property estimation.
Flow chart for micromechanically based composite effective properties estimation.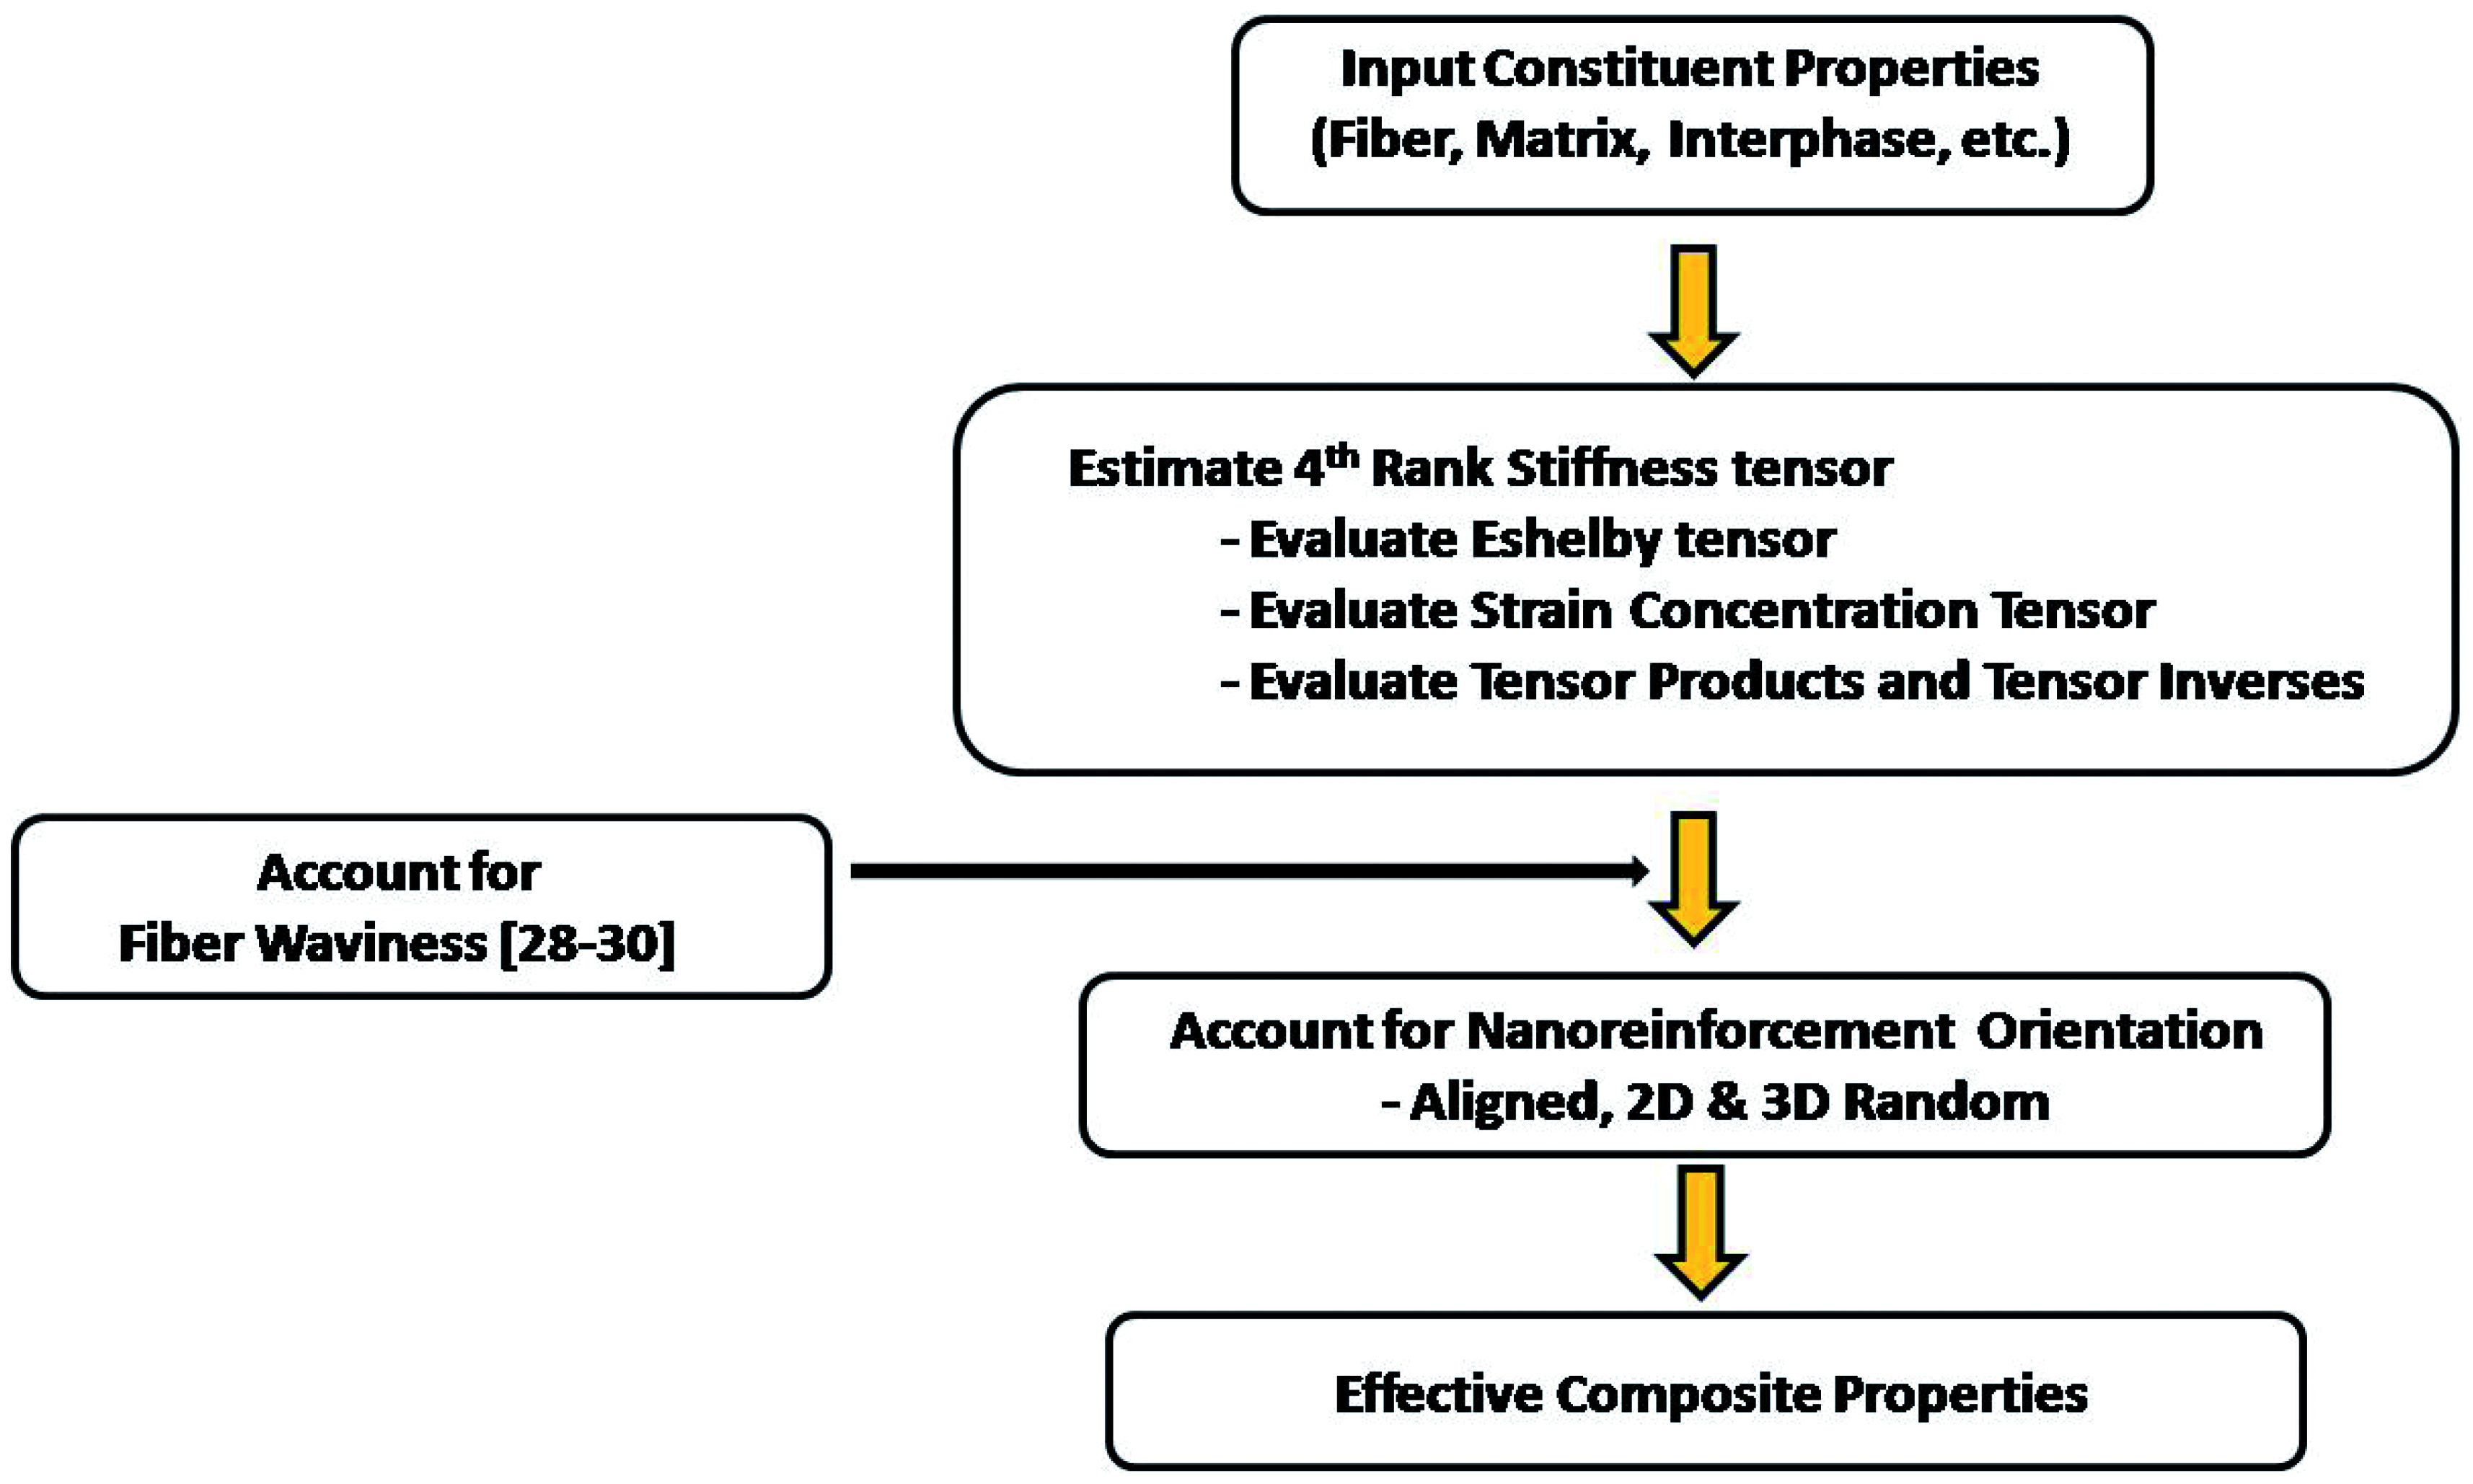
Effective properties for VGCNF/vinyl ester nanocomposites
Typical material properties
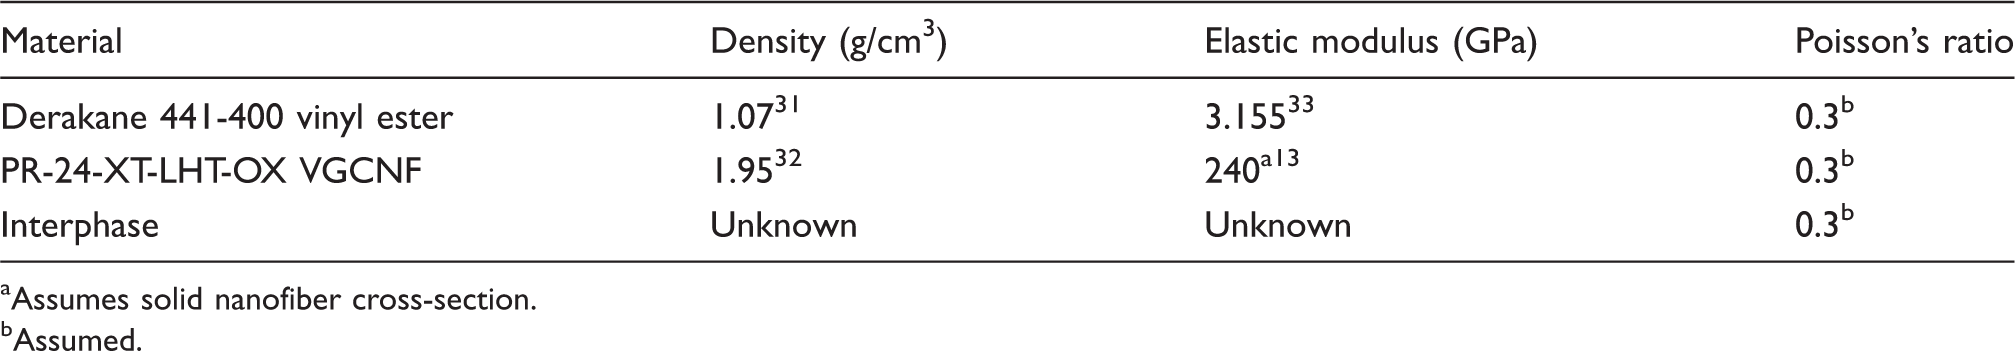
Assumes solid nanofiber cross-section.
Assumed.
Hollow nanofiber elastic moduli (assumes fixed axial force–displacement relationship)
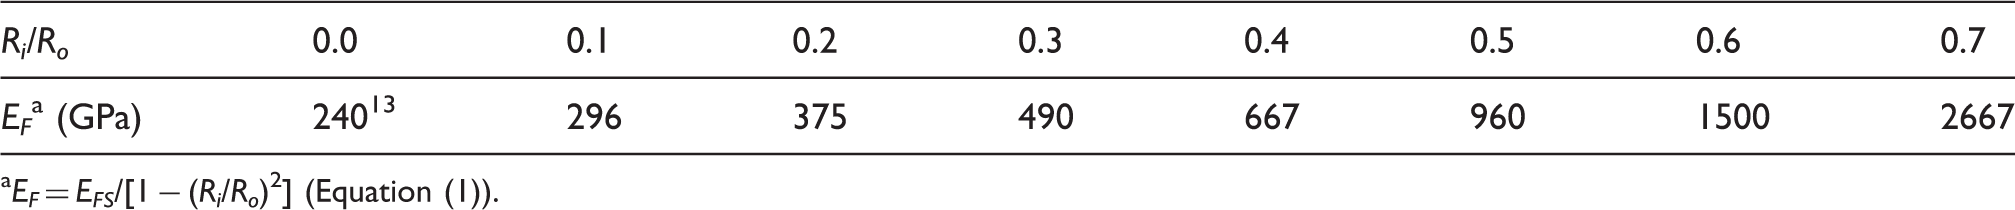
EF = EFS/[1 − (Ri/Ro) 2 ] (Equation (1)).
The modified MTM and SCM were used to determine the effective elastic moduli of nanocomposites with either solid or hollow fibers. Parametric studies were performed to assess the effect of nanofiber aspect ratio and orientation, interphase layer thickness and properties, and nanofiber waviness on elastic moduli. While the methodology has been employed for ellipsoidal nanoreinforcements with arbitrary aspect ratios (continuous and short fibers, platelets, spheres, etc.) and orientations (aligned, two- and three-dimensionally random), the results presented here will focus for simplicity on the longitudinal and transverse properties of nanocomposites with aligned nanofibers. From Table 2, the ratio of the Young’s modulus of the VGCNFs to that of the vinyl ester resin was EF/Em = 76.1[1 − (Ri/Ro) 2 ]. In all calculations, the effective moduli for the composite were normalized by the matrix modulus, Em. In addition, the calculations were based upon 0.63% VGCNFs by volume (∼1.0 wt%), which is consistent with ongoing experimental studies.34,35
Effect of nanofiber aspect ratio
Ensuring a uniform distribution of nanofibers is a key challenge in producing nanoreinforced resins. Nanofibers are often aggressively mixed in the Part A resin using some combination of ultrasonication and/or high-shear mixing.34,35 One concern is that the nanofibers may be chopped or broken during mixing, with processed nominal fiber aspect ratios falling below those of the as-manufactured VGCNFs, resulting in reduced effective composite properties. For the given material system, Figure 8 shows a plot of the effective longitudinal modulus, EL, as a function of fiber aspect ratio (L/D) based upon both the MTM and SCM for a nanocomposite with solid aligned VGCNFs (Ri/Ro = 0, EF/Em = 76.1). In both solutions, the effective modulus increased with increasing fiber aspect ratio and asymptotically approached the continuous fiber solution (L/D = ∞) for aspect ratios L/D > ∼90. This suggests that aggressive mixing, aimed at minimizing nanofiber agglomerations and obtaining uniform distribution of nanofibers within the resin, may be beneficial provided the nominal aspect ratio of the processed fibers does not become too small.
Effect of VGCNF aspect ratio on effective longitudinal modulus for nanocomposites with solid (Ri/Ro = 0) aligned nanofibers (0.63 vol.% VGCNF).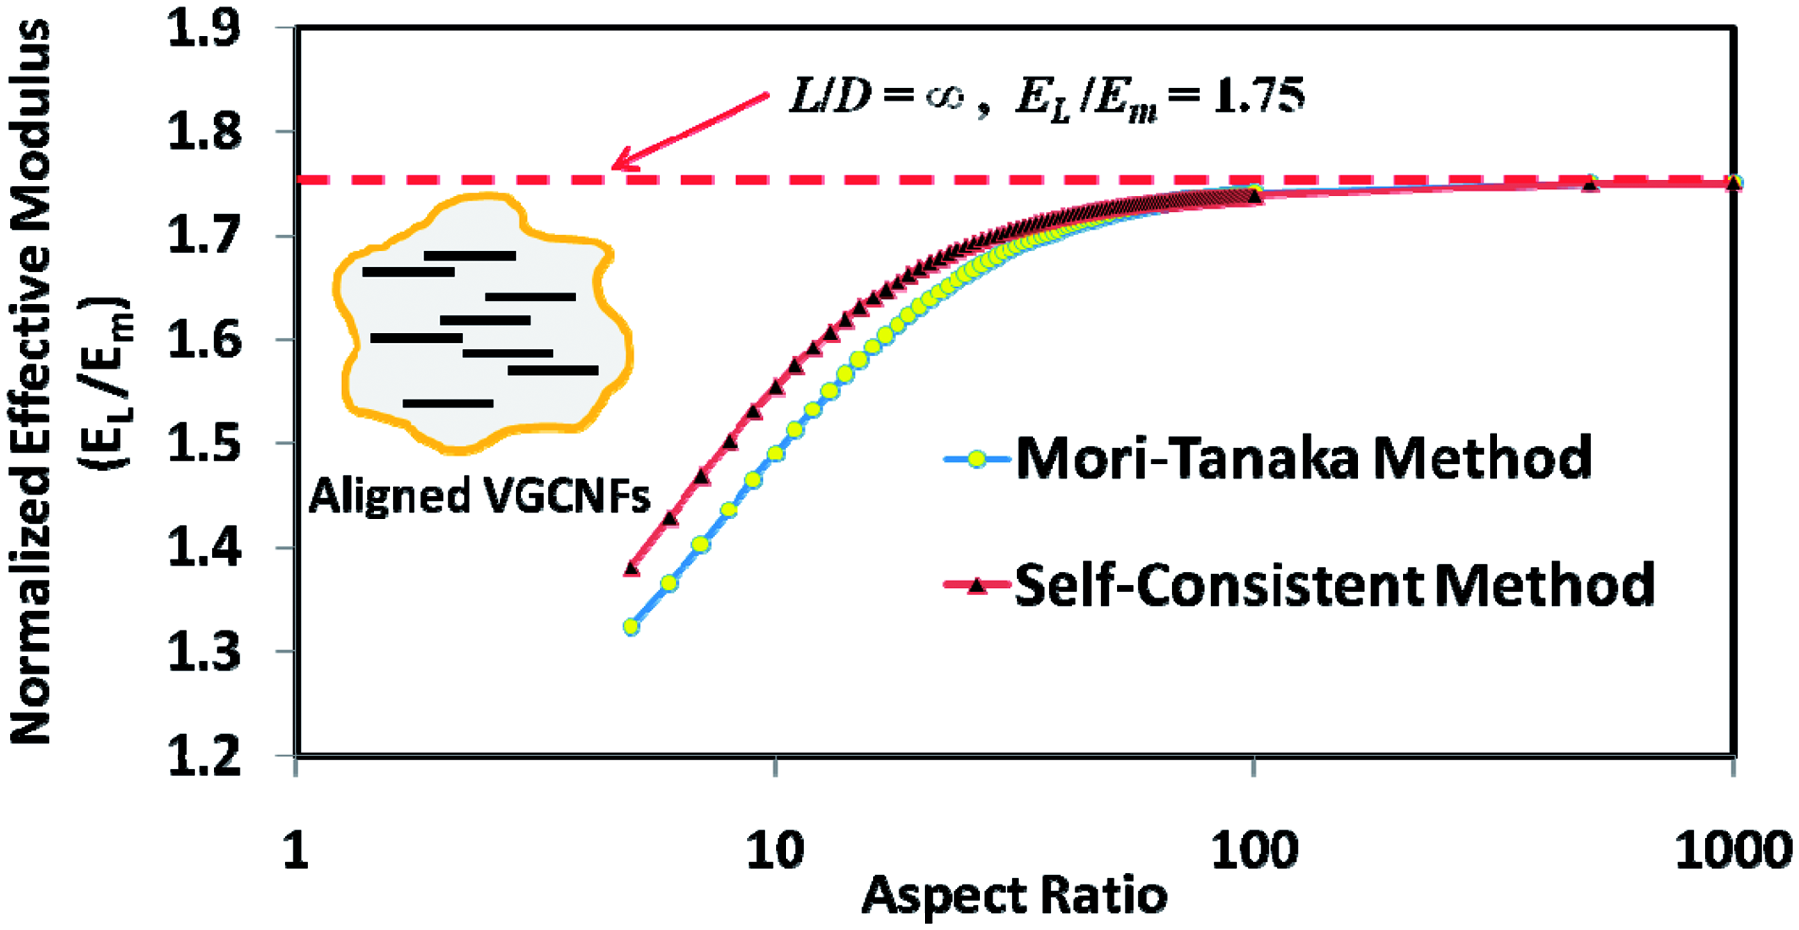
Effect of nanofiber–matrix interphase, nanofiber cross-section geometry, and nanofiber waviness
As mentioned previously, the development of a nanofiber–matrix interphase can have a profound effect on effective composite properties. The average thickness, t, and elastic modulus, Ei, of the interphase are strongly influenced by nanofiber surface chemistry, use of thermoplastics or thermosets, resin properties, and curing protocol for thermosets. A parametric study was performed to assess the effect of interphase modulus and thickness on nanocomposite bulk properties. In the following discussion, the average interphase thickness, t, has been normalized by the nominal VGCNF outer radius, R = Ro = 75 nm. For example, an interphase thickness ratio, t/R = 0.4, would correspond to an interphase thickness of 30 nm. Note that such an interphase thickness is small in comparison to the typical sizing thickness used on traditional E-glass or carbon fibers and much smaller than many interphase regions previously observed with thermoplastic/carbon fiber composites that can exceed 10 µm.
36
The volume fraction of the interphase between nanofiber and matrix, however, is significant in comparison to the volume fraction of VGCNFs due to the relatively high nanofiber surface area-to-volume ratio. In this study, the interphase modulus, Ei, is expressed as a fraction of the matrix modulus (i.e. Ei/Em). Figure 9 shows a plot of the effective longitudinal modulus, EL, as a function of interphase thickness for straight solid fibers (Ri/Ro = 0, L/D = 100) based upon both the MTM and SCM. The interphase modulus was assumed to be 10 times higher than that of the matrix (Ei/Em = 10). As the average thickness (and volume fraction) of the interphase is increased, there is a significant increase in the predicted effective composite modulus. This underscores the importance of the contribution of the interphase to overall composite properties.
Effect of interphase thickness on effective longitudinal modulus (L/D = 100, Ei/Em = 10) for nanocomposites with solid (Ri/Ro = 0) aligned nanofibers (0.63 vol.% VGCNF).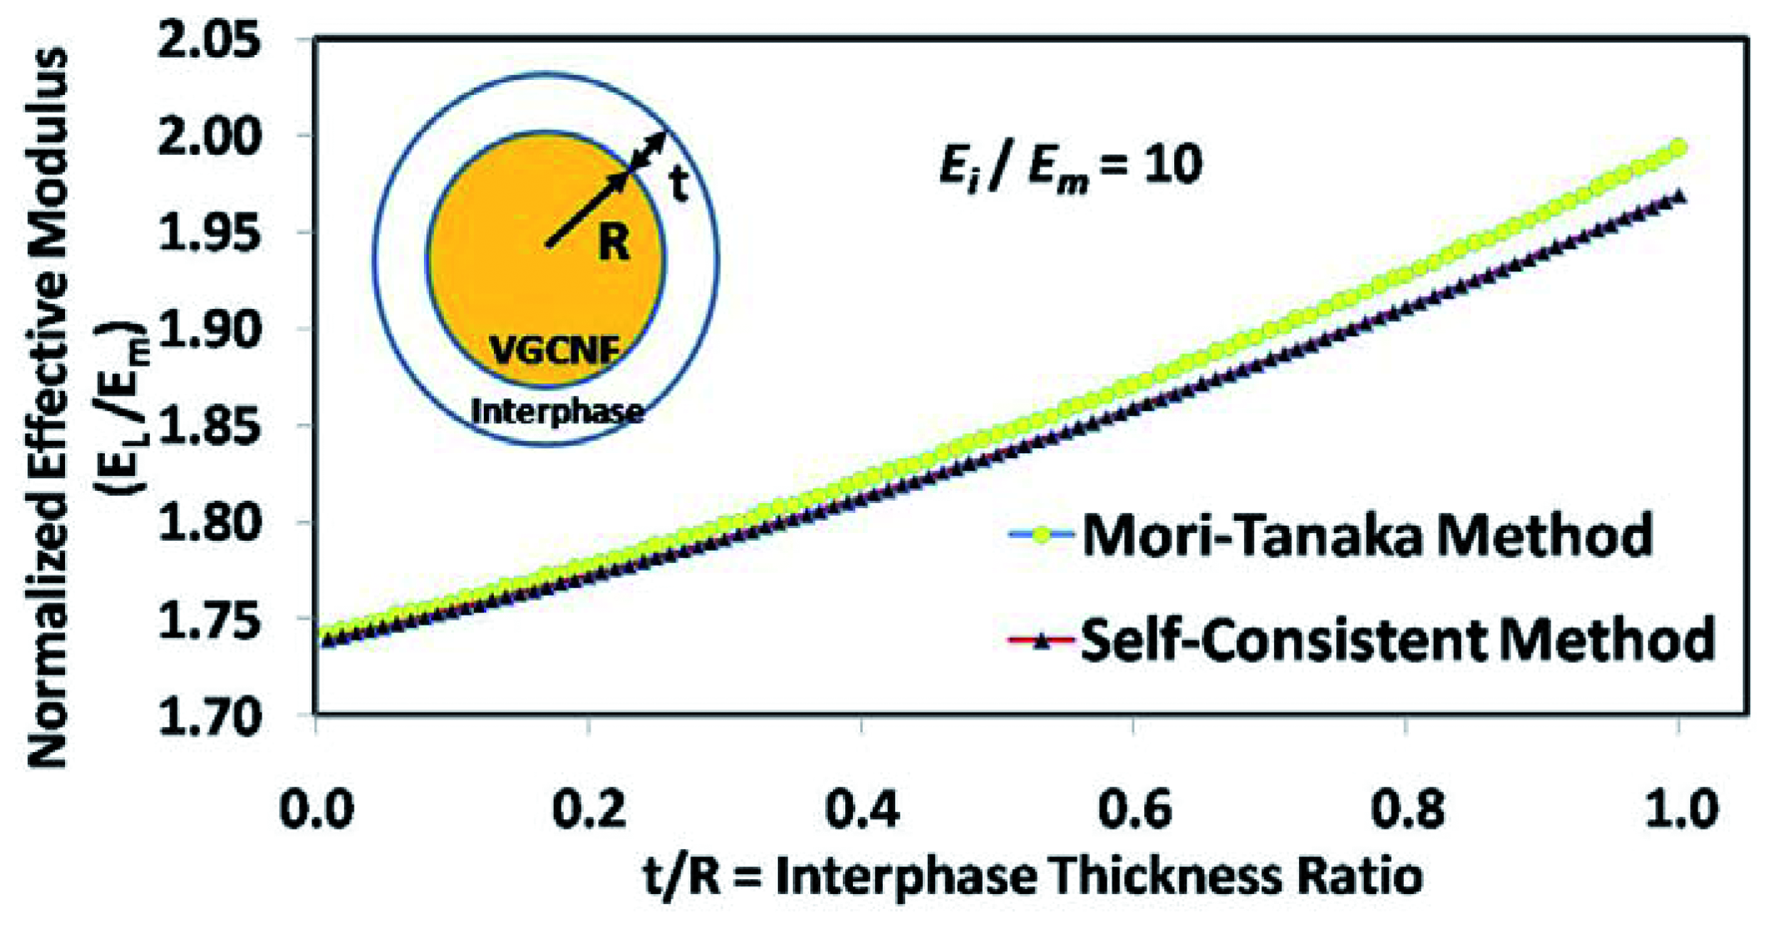
Similarly, Figure 10(a) shows a plot of the effective longitudinal modulus, EL, as a function of average interphase thickness for straight solid fibers (Ri/Ro = 0, L/D = 100) based upon the MTM where the interphase properties were varied over the range 0.5 ≤ Ei/Em ≤ 20 in order to encompass both relatively compliant and stiff interphases. With the exception of Ei/Em = 0.5 (i.e. a relatively compliant interphase), the predicted effective composite modulus increased as the interphase layer thickness increased.
Effect of interphase thickness on effective longitudinal modulus for nanocomposites containing (a) solid straight nanofibers (Ri/Ro = 0, L/D = 100, EFS = 240 GPa) and (b) hollow straight nanofibers (Ri/Ro = 0.3, L/D = 100, and EF = 490 GPa) (0.63 vol.% VGCNF for both (a) and (b)).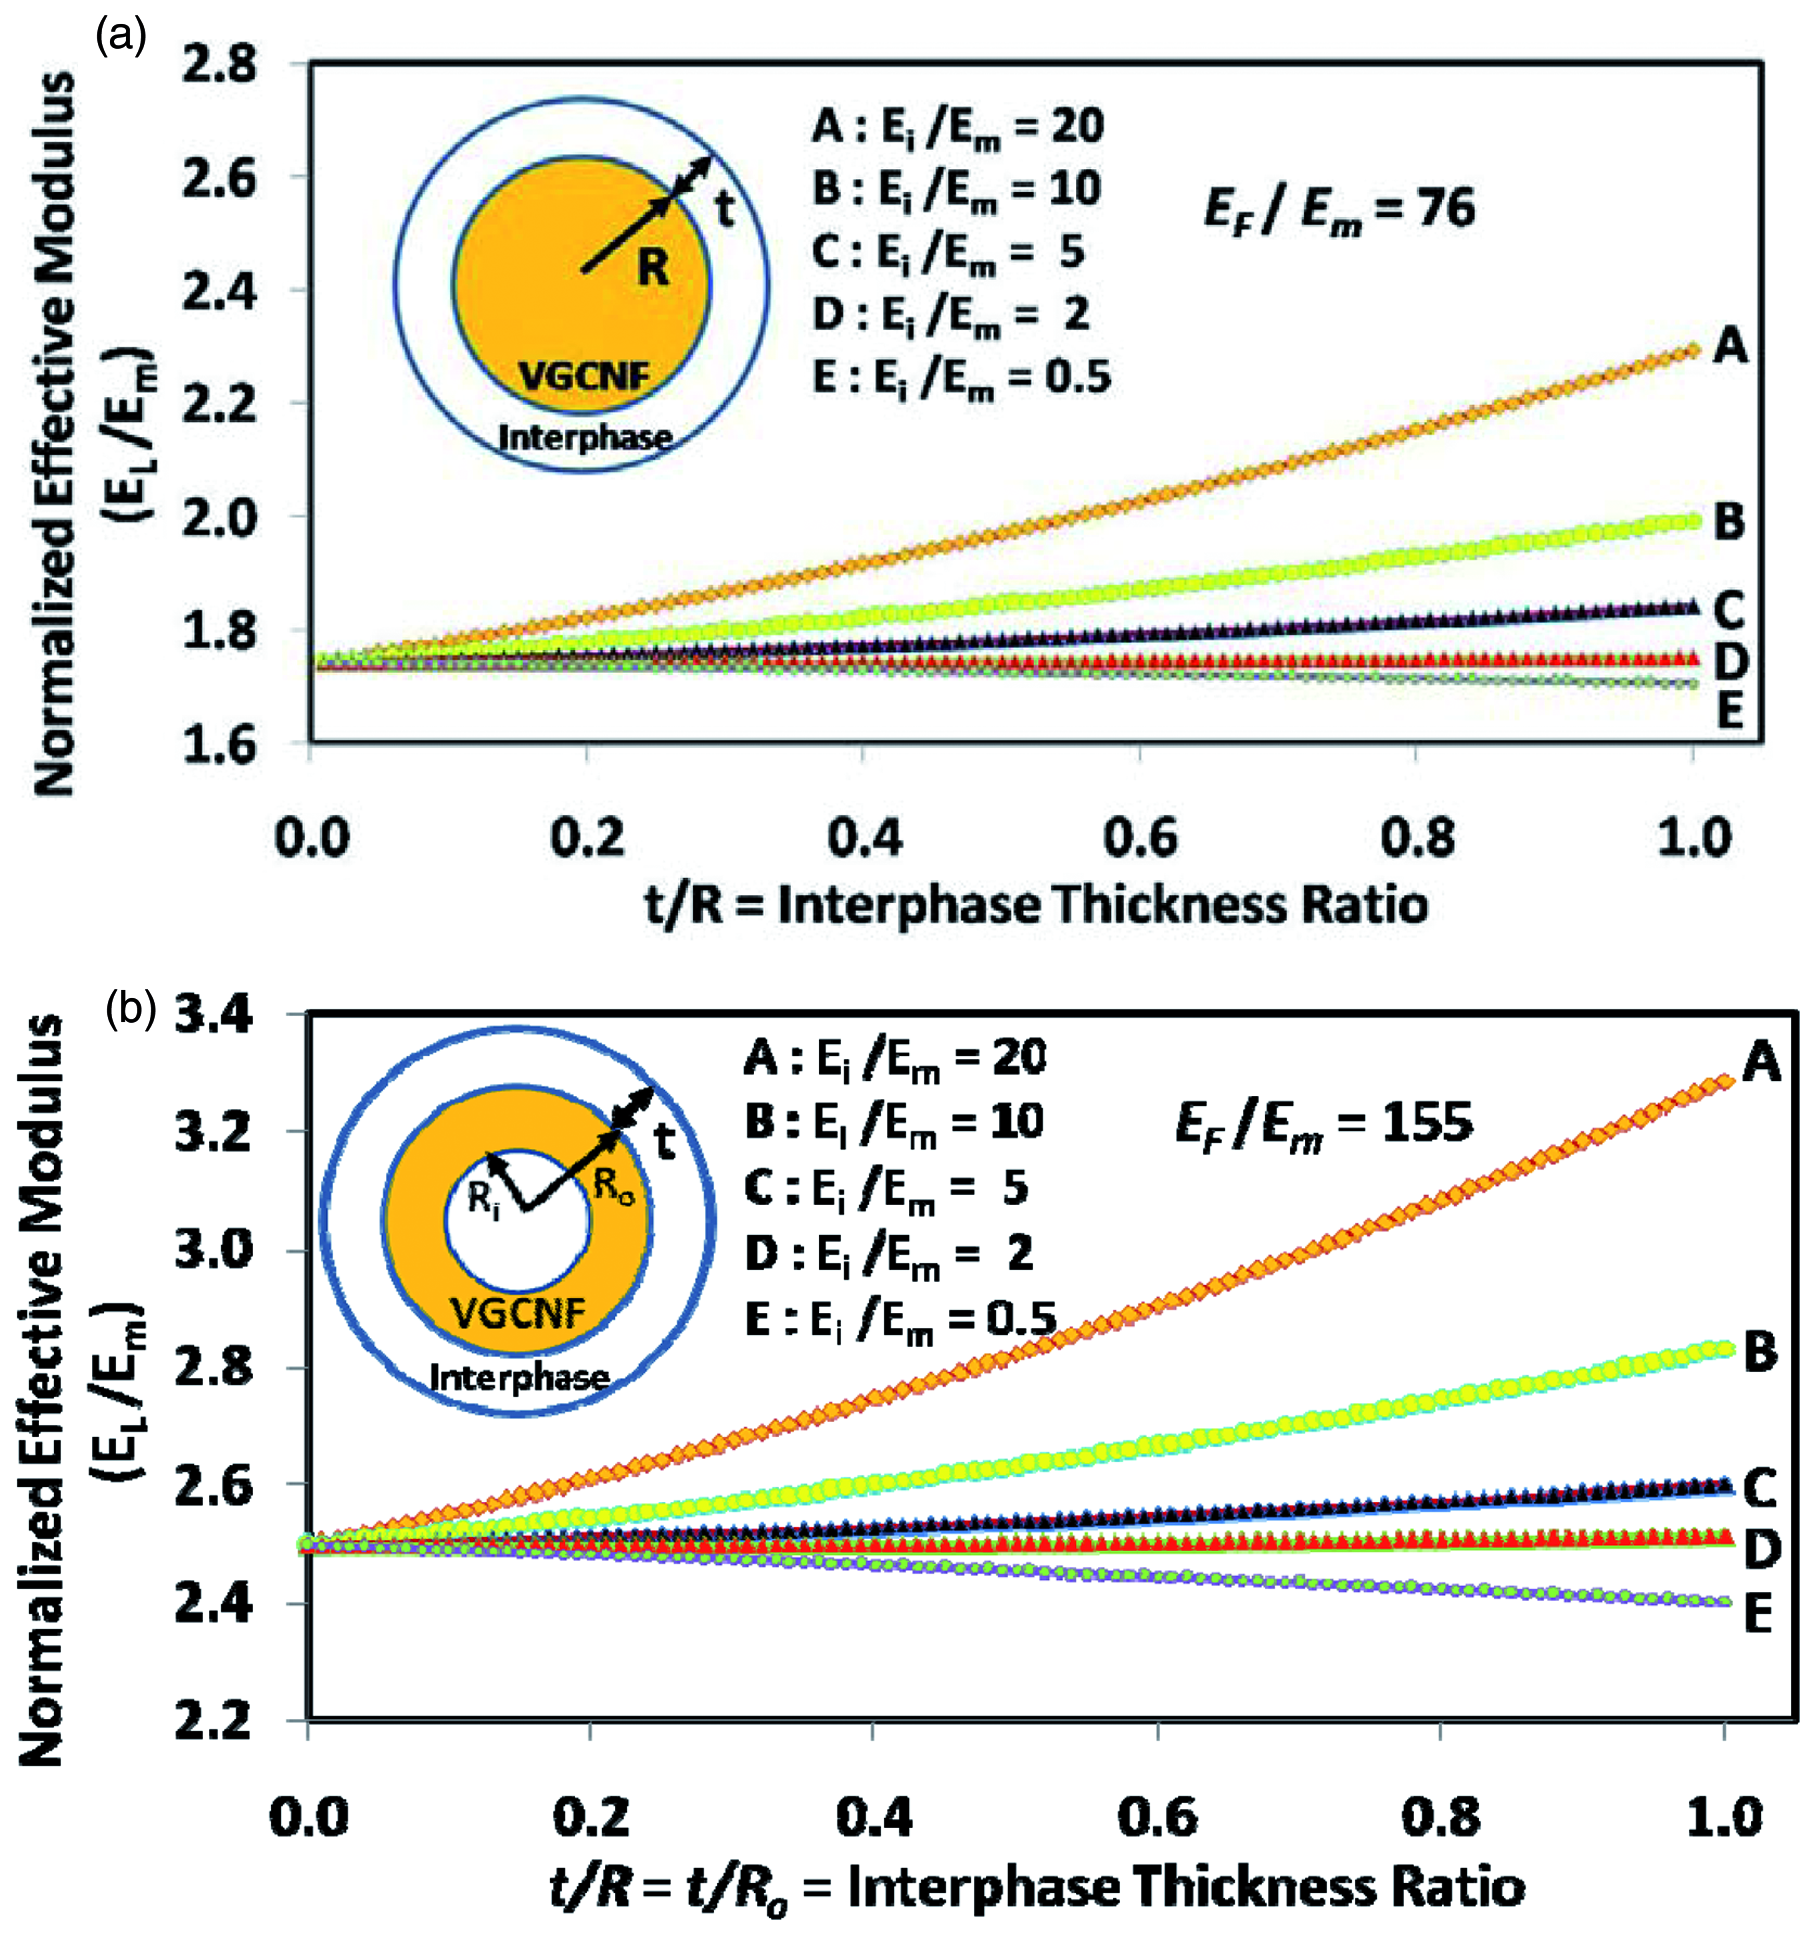
Similar calculations were performed for the case of composites containing straight hollow nanofibers, where the ratio of the inner nanofiber radius to outer radius was held fixed (Ri/Ro = 0.3), the nanofiber elastic modulus was calculated using Equation (1) (EF/Em = 155) and the volume fraction of the hollow nanofiber ‘core’ was assigned essentially null material properties. Figure 10(b) shows a plot of the effective longitudinal modulus, EL, as a function of average interphase thickness for straight hollow nanofibers (Ri/Ro = 0.3, L/D = 100) based upon the MTM. Again, the effective composite modulus increased with increasing average interphase thickness for cases where the interphase modulus exceeded the matrix modulus (Ei/Em > 1). A comparison of Figure 10(a) and (b) suggests that for the same volume fraction of solid carbon (0.63 vol.%), composites comprised of hollow nanofibers had a higher effective modulus due to the relatively larger fiber modulus (Equation (1)). To illustrate this point, Figure 11 contains a plot of the effective longitudinal modulus, EL, and effective transverse modulus, ET, for nanocomposites containing straight hollow nanofibers (L/D = 100), where the ratio of the inner nanofiber radius to outer radius was varied such that 0 ≤ Ri/ Ro ≤ 0.9 and the nanofiber modulus was calculated using Equation (1). For the same volume fraction of solid carbon in the nanocomposite (0.63 vol.%), a decrease in the nanofiber wall thickness resulted in a significant increase in the effective longitudinal modulus. As can be seen from the figure, the calculated effective longitudinal moduli over the range of observed nanofiber wall thicknesses from Yu et al.
15
are significantly greater than the modulus for a nanocomposite with solid nanofibers (Ri/Ro = 0). This underscores the importance of using realistic VGCNF geometry data when calculating effective properties. Not surprisingly, a decrease in the nanofiber wall thickness resulted in a slight decrease in the effective transverse modulus, ET. As an aside, for a given nanofiber diameter and fixed volume fraction of solid carbon, the number density of hollow fibers must exceed that for solid fibers. This may also contribute to the relatively higher longitudinal stiffness values associated with the use of hollow nanofibers.
Effect of nanofiber cross-section on: (a) the effective longitudinal modulus (EL) and (b) the effective transverse modulus (ET) for nanocomposites containing straight nanofiber (L/D = 100, 0.63 vol.% VGCNF).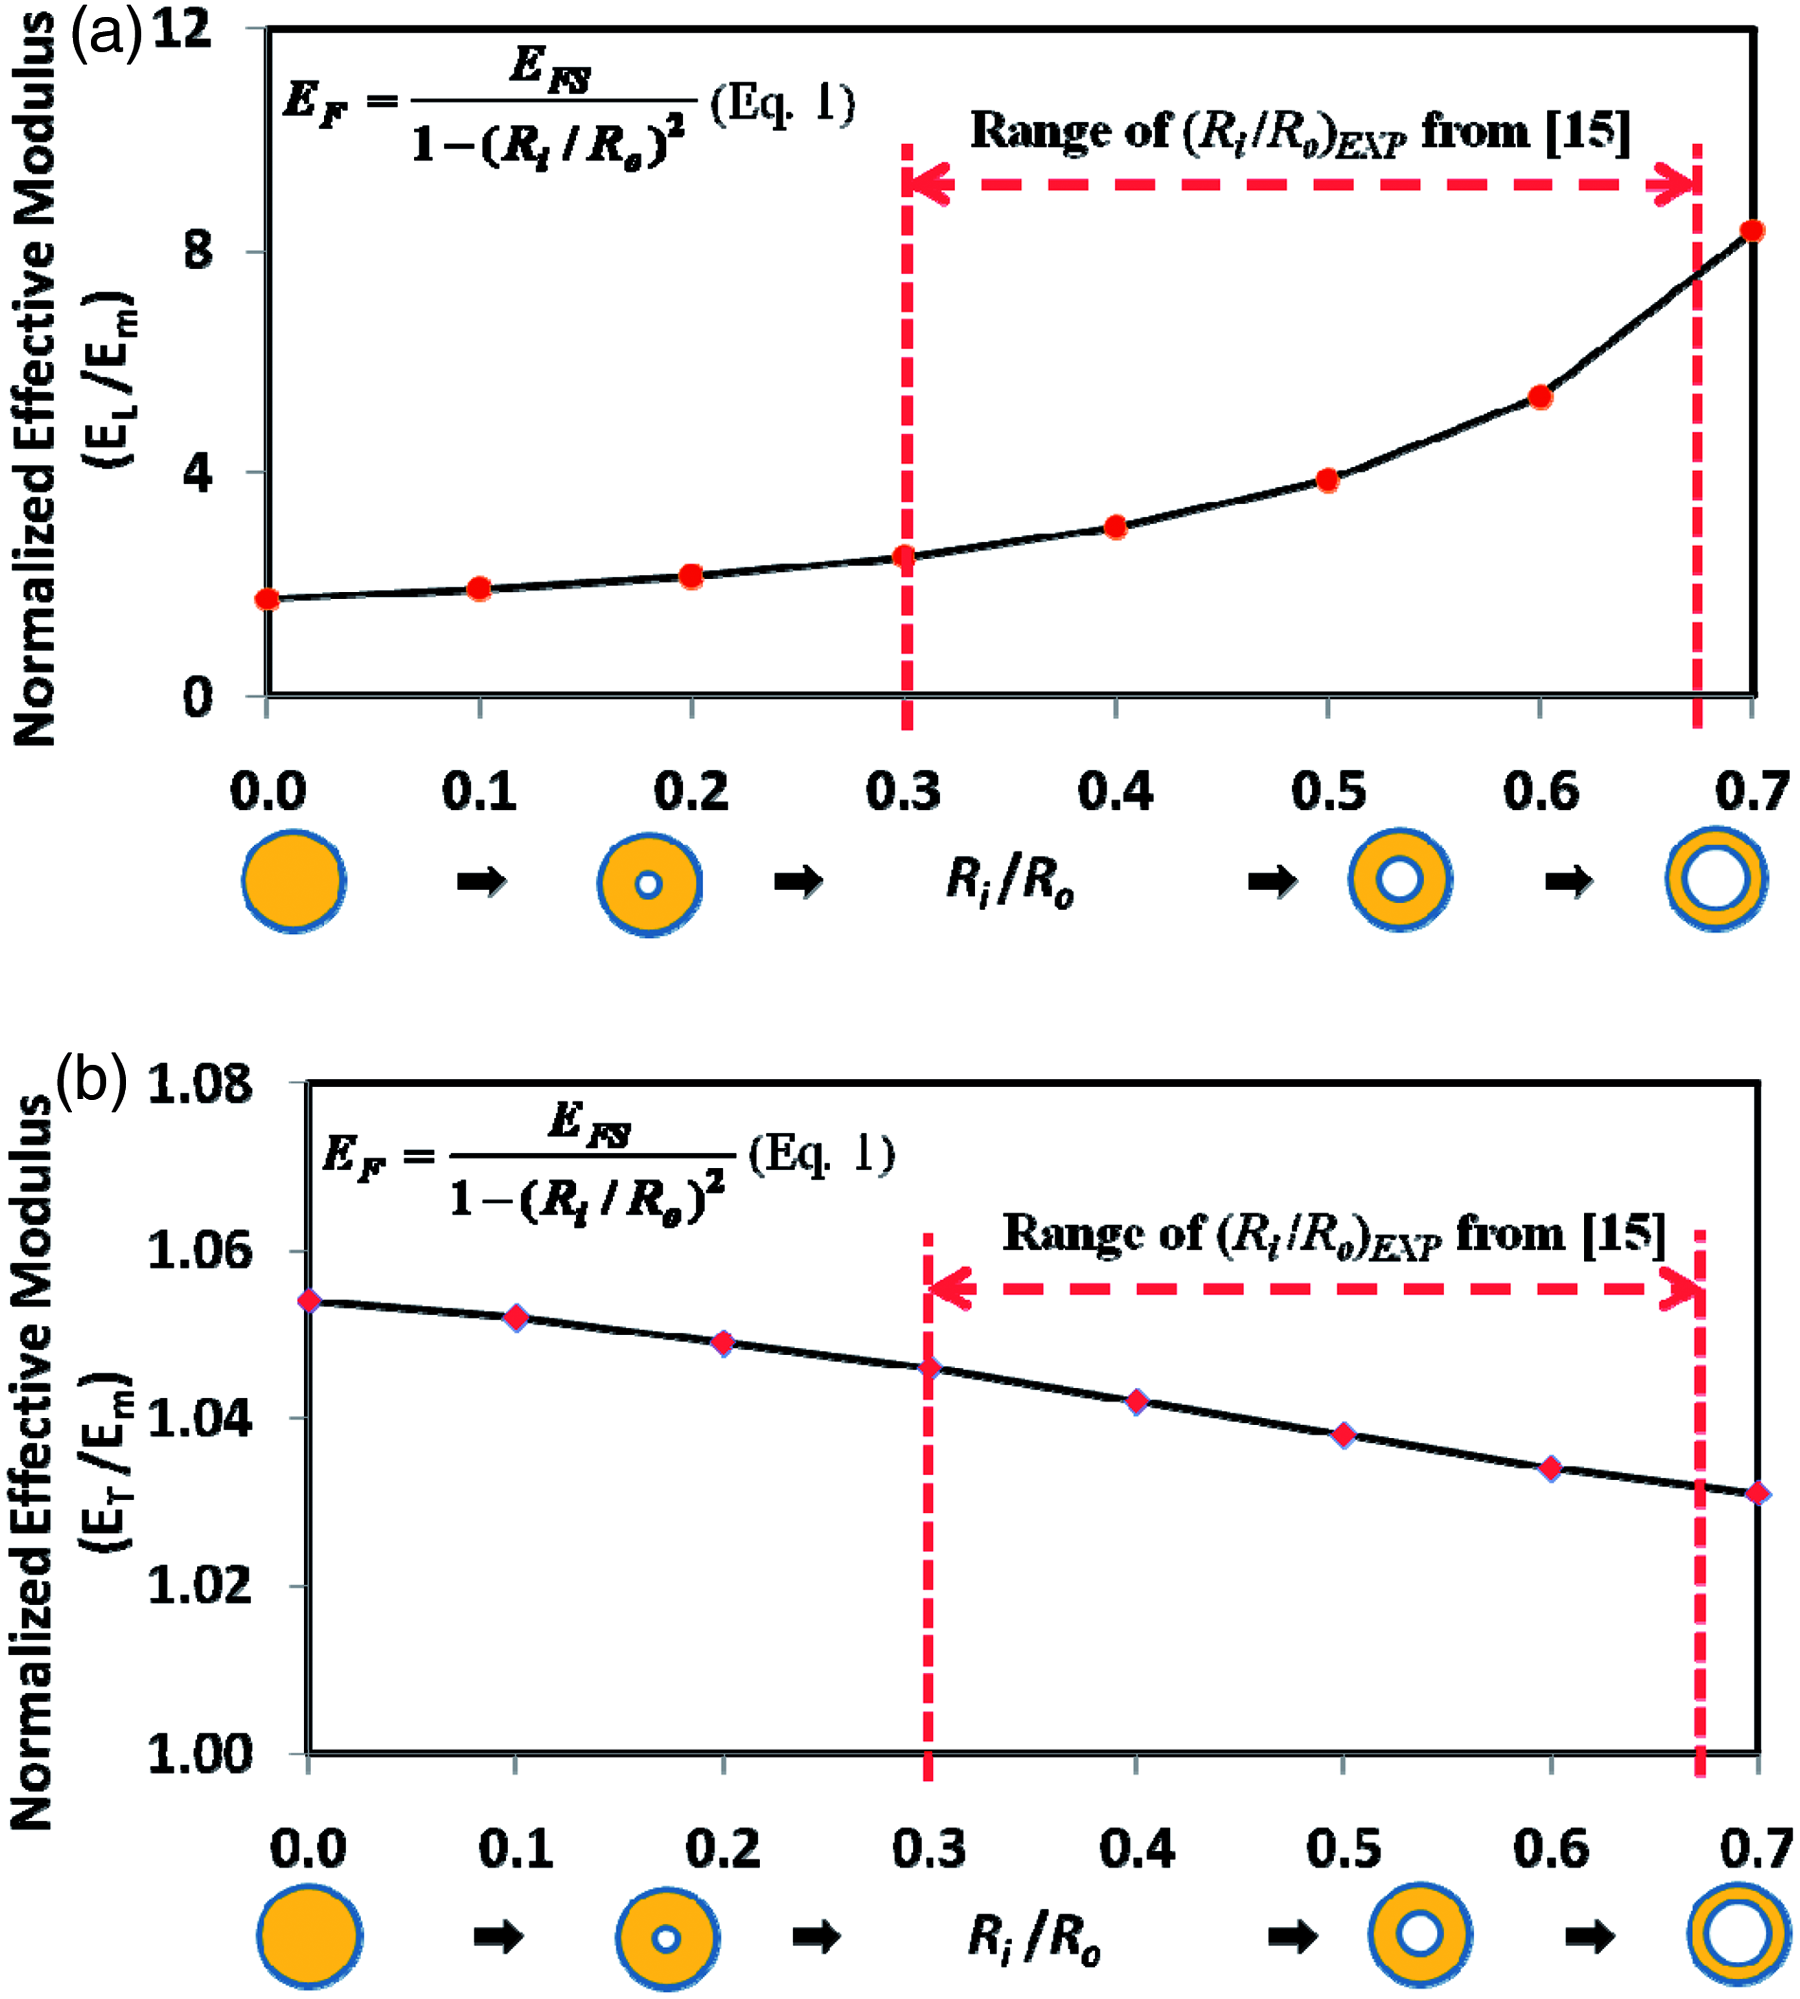
Figure 12(a) and (b) shows plots of the effective transverse modulus, ET, as a function of average interphase thickness for nanocomposites containing straight solid (Ri/Ro = 0) and hollow (Ri/Ro = 0.3) nanofibers, respectively (L/D = 100), where the interphase properties were varied over the range 0.5 ≤ Ei/Em ≤ 20. Similar to the results shown in Figure 10, the predicted effective transverse modulus increased somewhat with increasing interphase modulus and thickness; this trend was slightly more pronounced for nanocomposites containing hollow nanofibers (Figure 12(b)). Conversely, for nanocomposites with a relatively compliant interphase (Ei/Em = 0.5), the predicted effective transverse modulus decreased with increasing interphase thickness.
Effect of interphase thickness on effective transverse modulus for nanocomposites containing (a) solid straight nanofibers (Ri/Ro = 0, L/D = 100, and EFS = 240 GPa) and (b) hollow straight nanofibers (Ri/Ro = 0.3, L/D = 100, and EF = 490 GPa) (0.63 vol.% VGCNF for both (a) and (b)).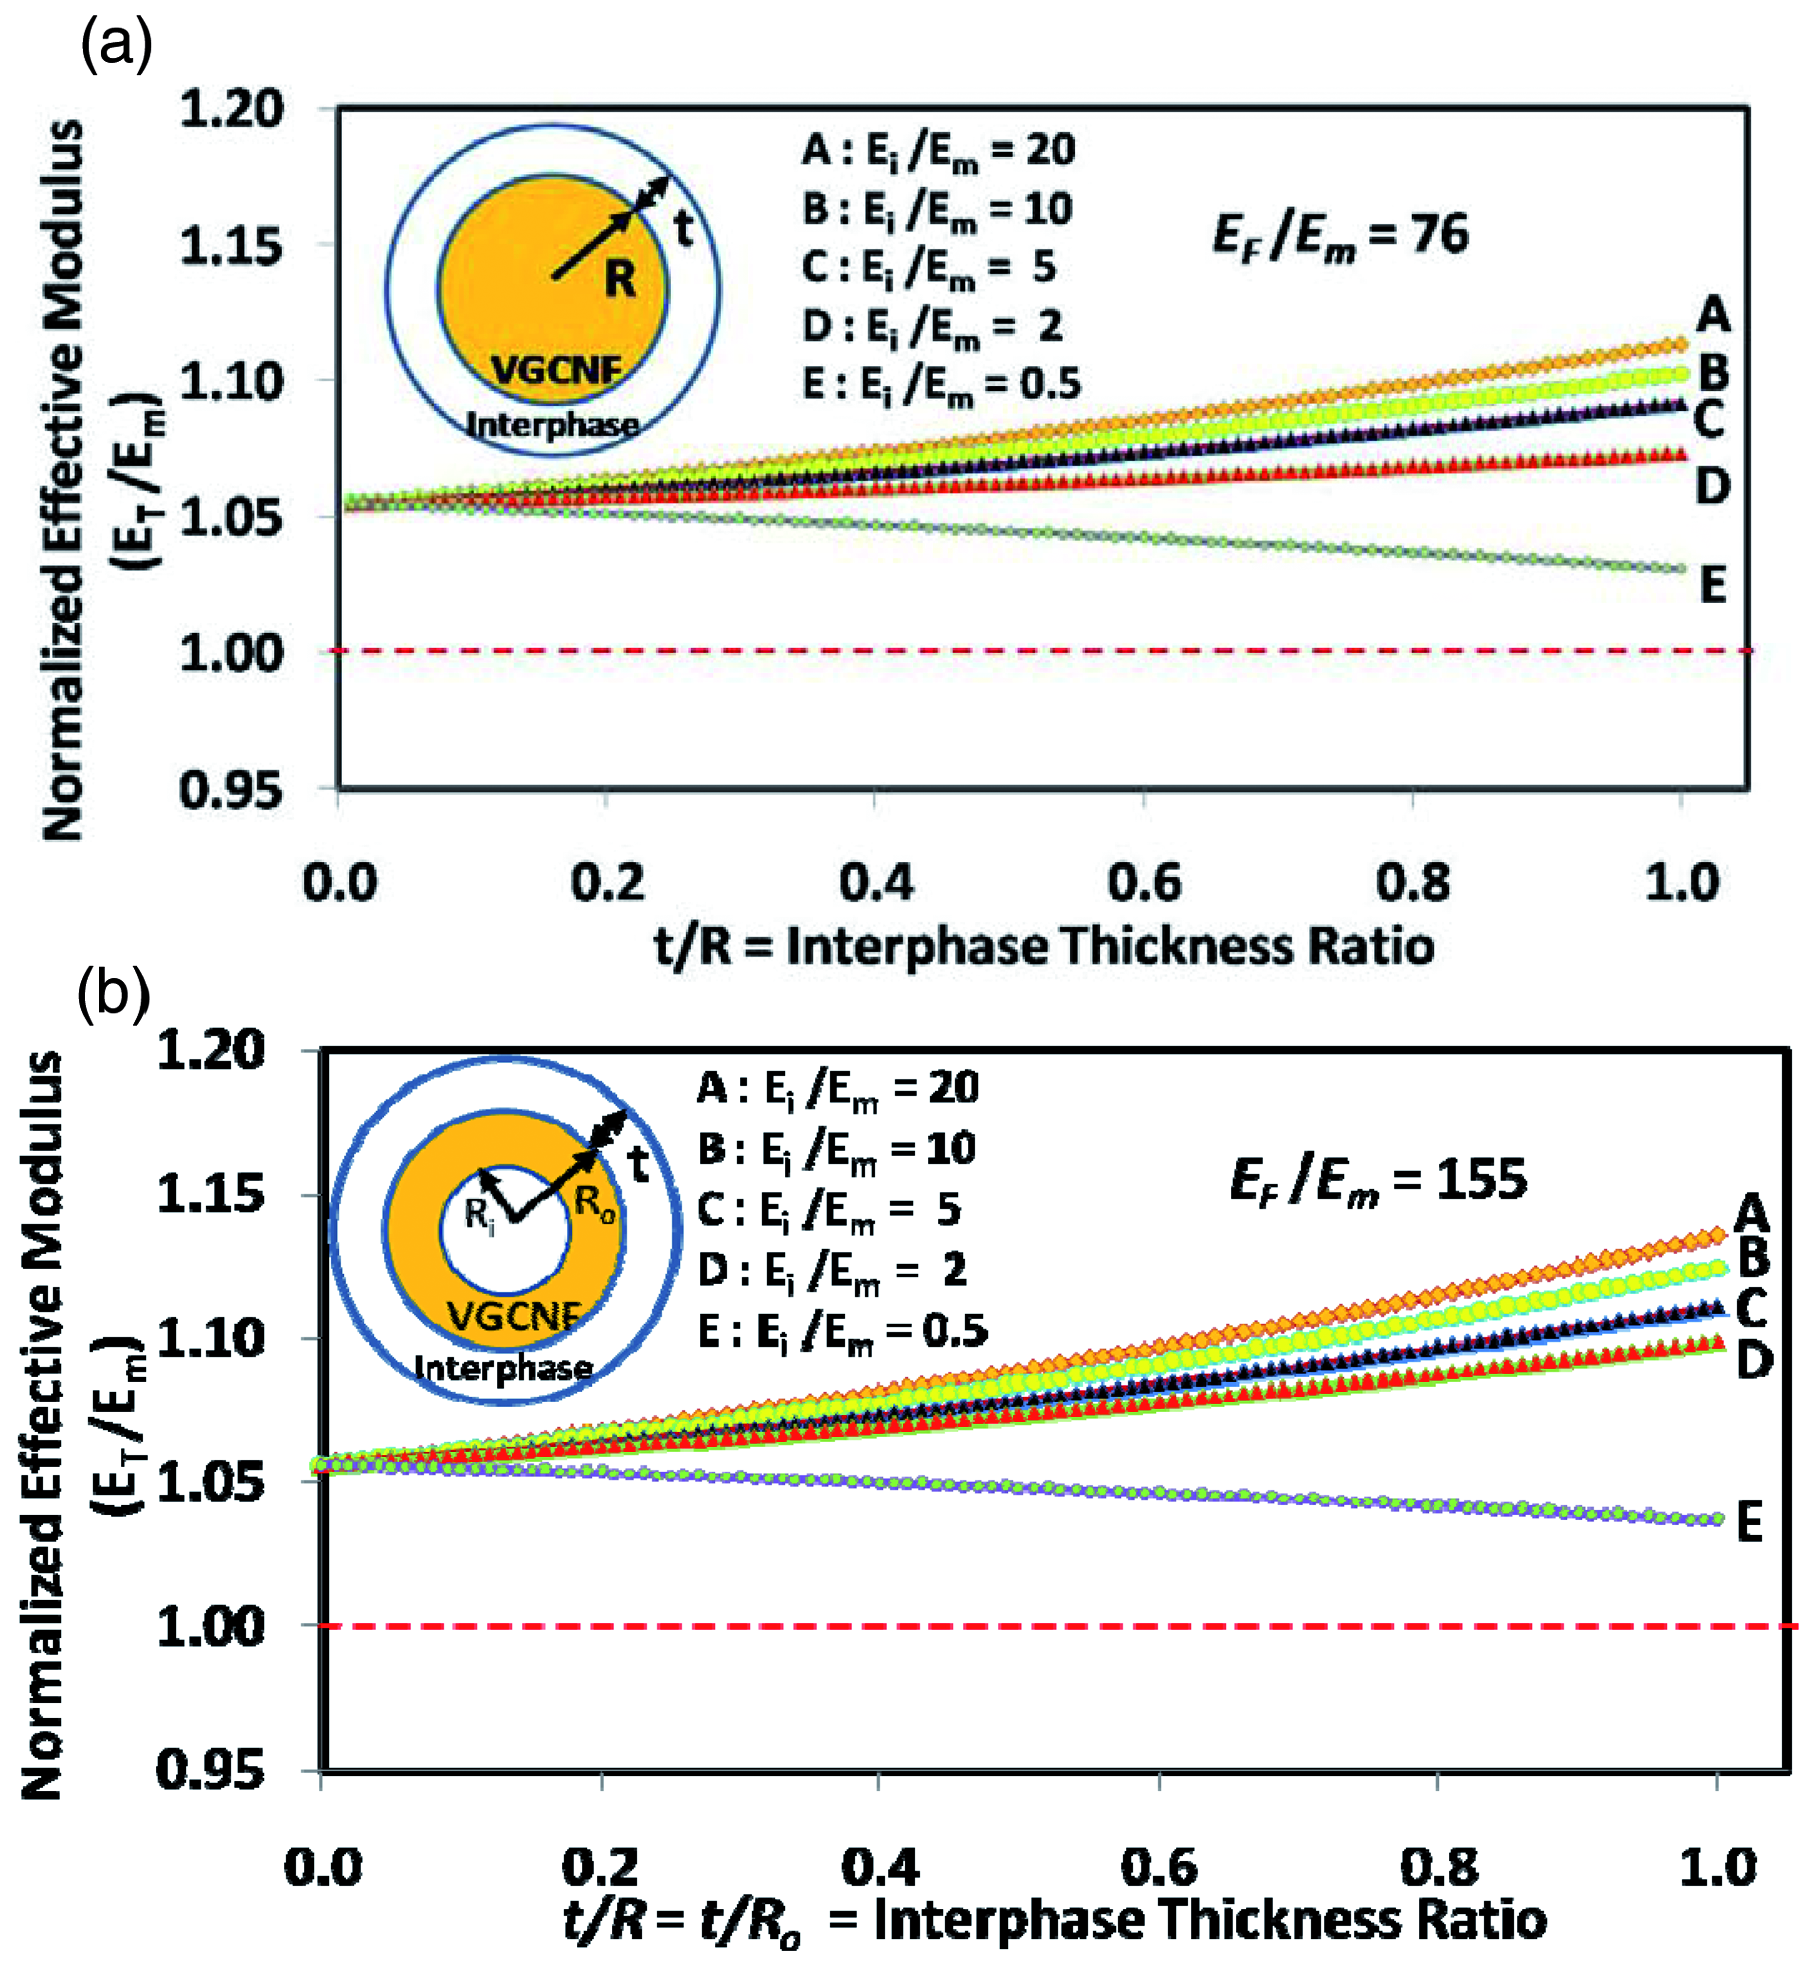
A comparison of Figures 9 and 10 suggests that the use of very small amounts of VGCNFs (0.63 vol.%) results in over a 70% improvement in the predicted effective longitudinal modulus of the nanoreinforced resin for the case where no interphase exists (t/R = t/Ro = 0). Improvements in experimentally measured moduli, however, typically are less profound.30 The discrepancy between measured and predicted results may be attributed to nanofiber waviness, poor nanofiber dispersion, poor fiber-to-matrix adhesion, and/or the presence of nanofiber agglomerates in the actual composite specimens. Using the approach developed by Brinson et al. (Equation (13)),28–30 effective modulus calculations were performed for composites containing solid (Ri/Ro = 0) and hollow (Ri/Ro = 0.3) nanofibers with varying degrees of fiber waviness and 0.63 vol.% of solid carbon. Two different fiber aspect ratios were considered (L/D = 10, 50). Figure 13(a) contains a plot of the effective nanocomposite longitudinal modulus, EL, as a function of nanofiber waviness ratio (h/λ). Note that for a given nanofiber aspect ratio, the use of straight hollow fibers (h/λ = 0) led to substantially higher modulus values than for straight solid fibers (h/λ = 0, Ri/Ro = 0) with the same volume fraction of solid carbon (0.63 vol.%) due to the proportionally higher fiber modulus (Equation (1)). For example, at this same carbon volume fraction and L/D = 50, straight hollow (Ri/Ro = 0.3) fibers induced a 41% greater effective normalized modulus than solid fibers. Interestingly, the predicted modulus for composites with a fixed amount of short straight hollow fibers (L/D = 10, Ri/Ro = 0.3) was roughly the same as that for a composite comprised of the same weight fraction of longer straight solid fibers (L/D = 50, Ri/Ro = 0). As the fiber waviness ratio increased to a modest level (h/λ = 0.1), the predicted modulus for all four cases decreased substantially. For higher degrees of fiber waviness (h/λ > 0.3), the nanofibers ceased to make a significant contribution to the effective longitudinal modulus and the bulk composite properties are more consistent with those of the unmodified matrix; the variation in the effective modulus due to changes in VGCNF aspect ratio and cross-section decreased with increasing nanofiber waviness. Figure 13(b) contains a similar plot for nanocomposites containing either solid or hollow VGCNFs where a nanofiber–matrix interphase is present (t/R = t/Ro = 0.3, Ei/Em = 10). Again, an increase in fiber waviness sharply decreases the effective modulus. Consistent with the results shown in Figures 9 and 10, the presence of a relatively stiff interphase layer resulted in an increase in bulk composite properties. Finally, Figure 13 includes the experimentally determined mean fiber waviness ratio, (h/λ)
EXP
= 0.05, obtained from TEM imaging of 45–85 nm thick VGCNF/vinyl ester specimens by Yu et al.
15
Given the two-dimensional nature of the images and the fact that the sections contained portions of actual nanofibers, the reported value likely represents a lower bound on expected h/λ values. The actual mean fiber waviness ratio may be somewhat greater than h/λ = 0.05, resulting in a significant decrease in effective modulus in comparison with the straight nanofiber case.
Effect of fiber waviness on effective longitudinal modulus for nanocomposite containing aligned (a) solid (Ri/Ro = 0, EFS = 240 GPa) and hollow (Ri/Ro = 0.3, EF = 490 GPa) nanofibers with no interphase and (b) solid (Ri/Ro = 0, EFS = 240 GPa) and hollow (Ri/Ro = 0.3, EF = 490 GPa) nanofibers with interphase (t/R = 0.3, Ei/Em =10), (0.63 vol.% VGCNF for both (a) and (b)).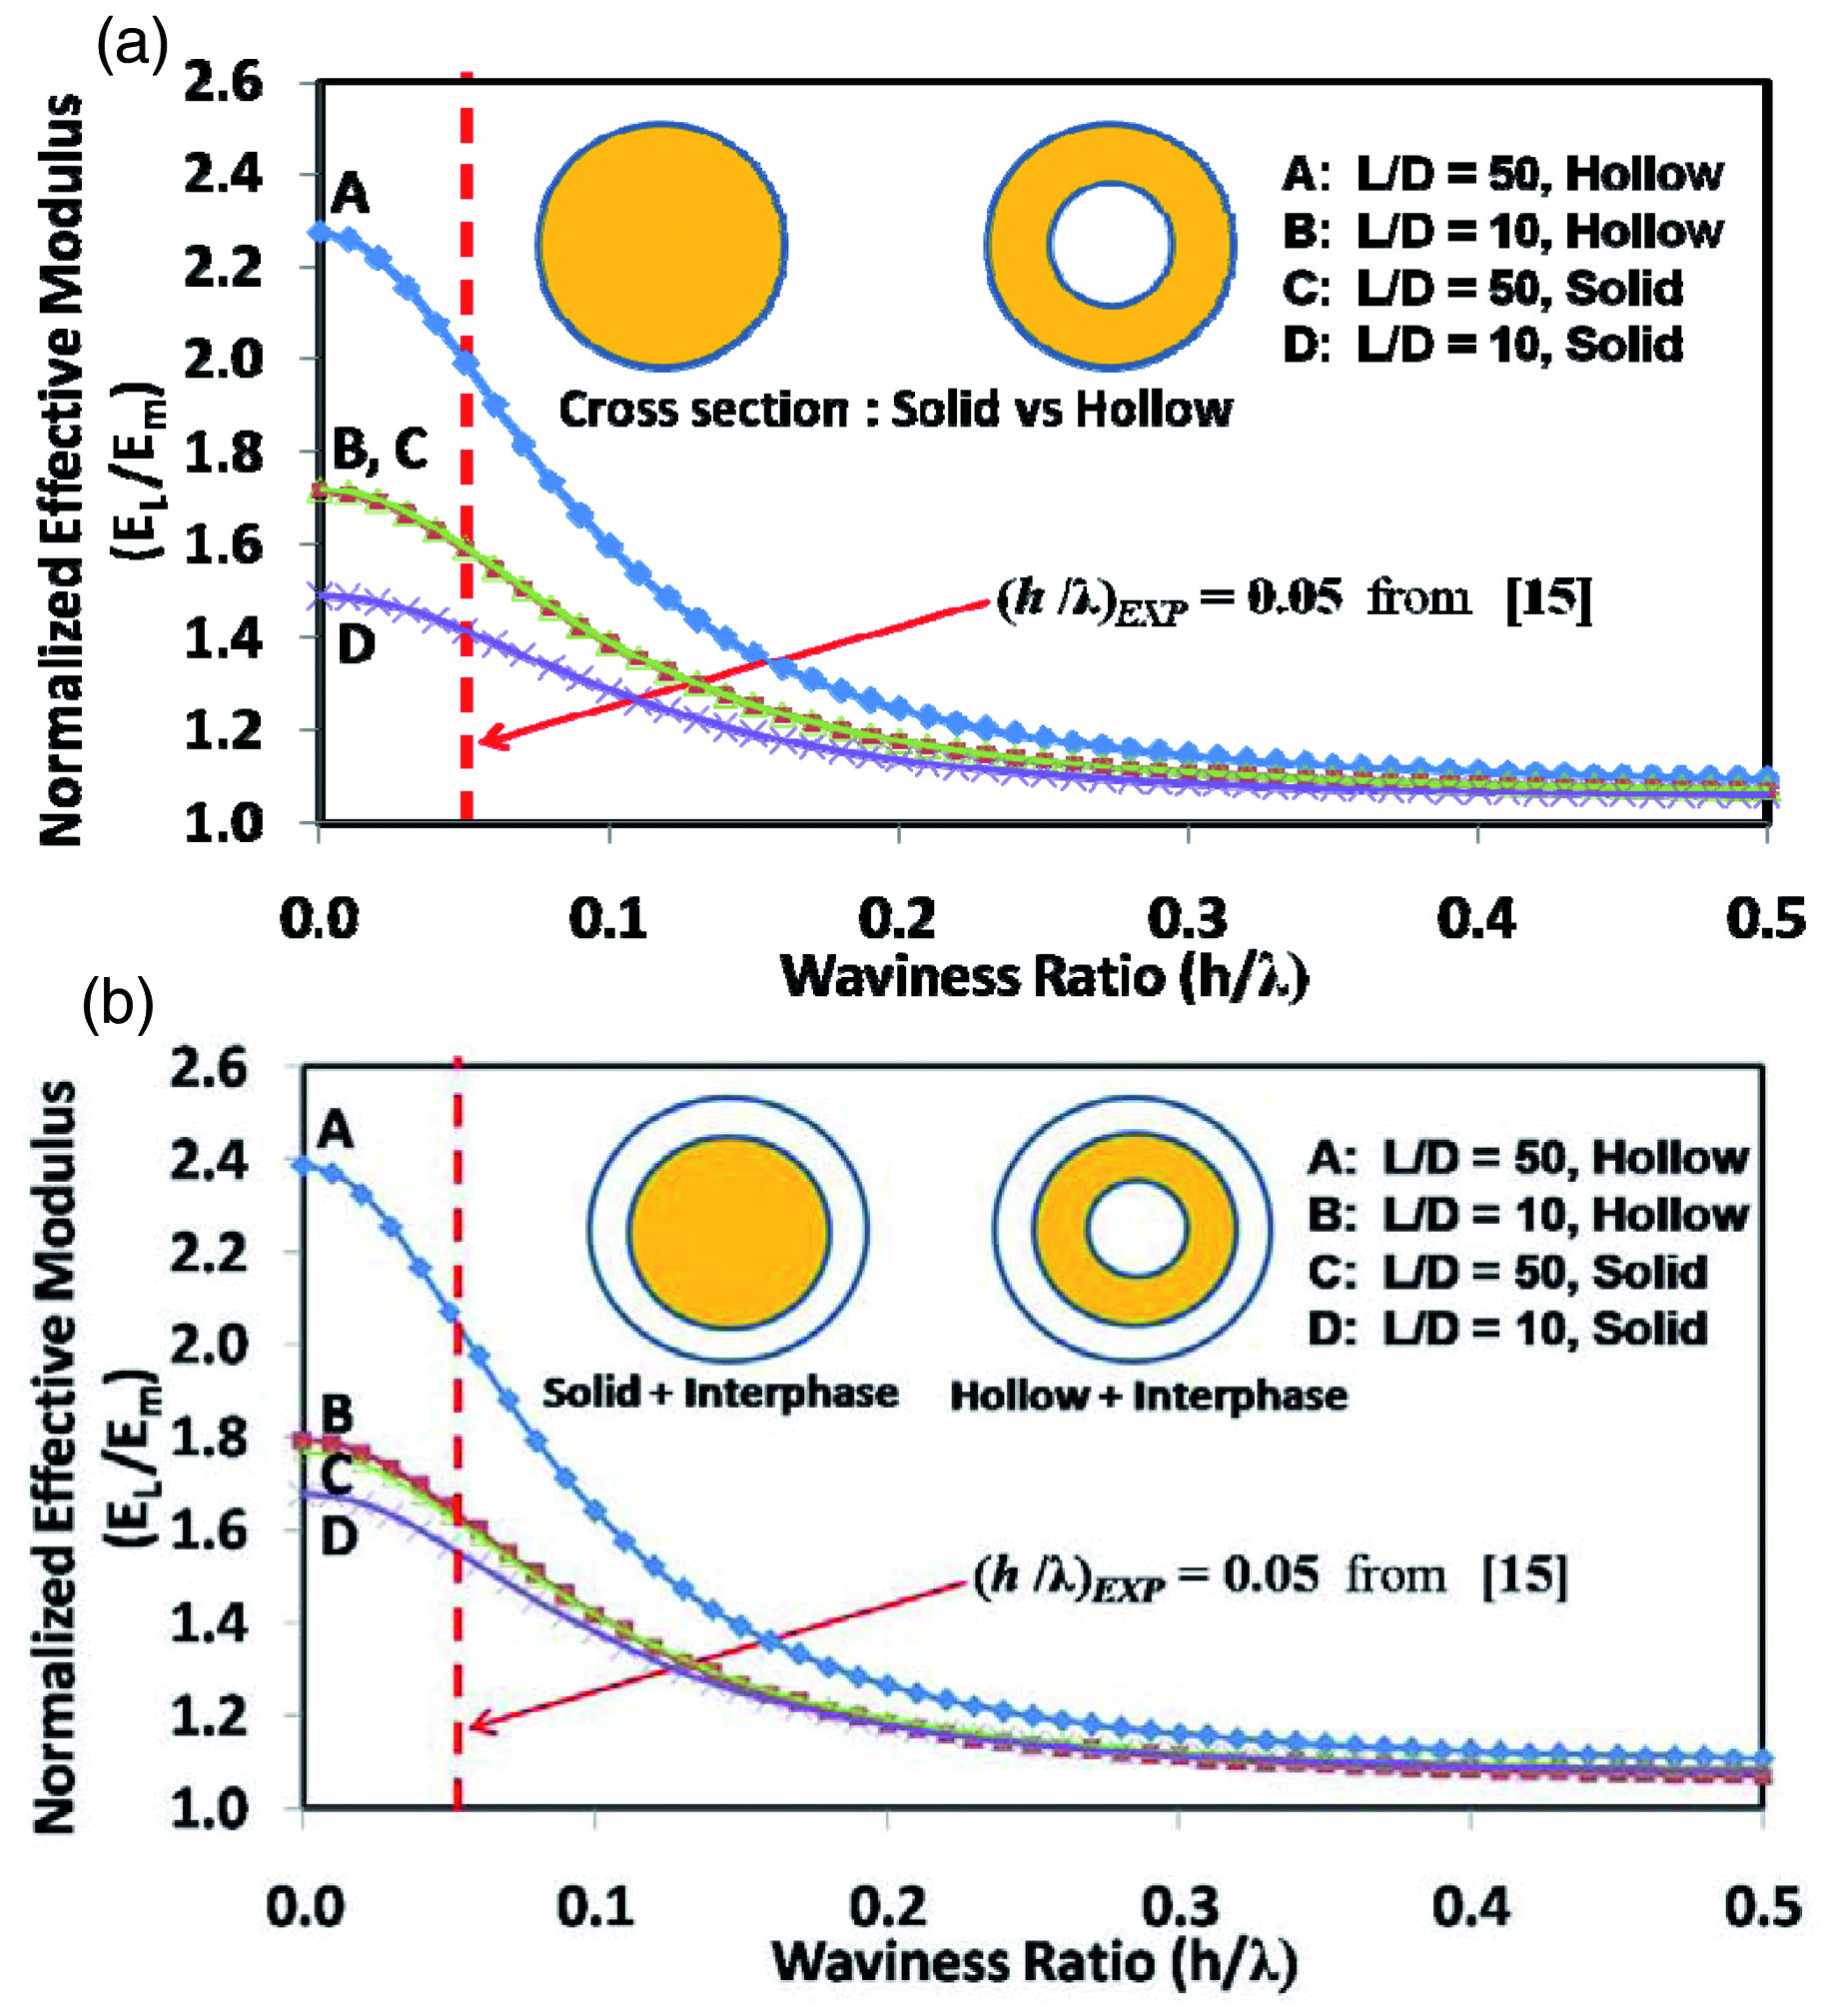
Conclusions
A parametric study was performed investigating the effect of VGCNF morphology (i.e. hollow vs. solid cross-section), nanofiber–resin interphase properties and dimensions, and nanofiber waviness on bulk nanocomposite elastic properties. Mori–Tanaka and self-consistent models were developed for composites containing multilayered-coated heterogeneities and applied in the study of nanocomposites. For a given nanofiber axial force–displacement relationship, the elastic modulus for hollow nanofiber can significantly exceed that for solid nanofibers resulting in notable differences in bulk nanocomposite properties. In addition, the development of a nanofiber–resin interphase can have a profound effect on bulk elastic moduli. Consistent with results from the literature, small degrees of nanofiber waviness can result in a significant decrease in effective composite properties.
In the future, this study will be extended to include solid and hollow nanoreinforcements with arbitrary shapes (fibers, spheres, platelets, etc.) and orientations. Different types of heterogeneities will be combined in a single micromechanical model in order to investigate the effect of combining distinct nanoreinforcements (carbon nanofibers, nanoclay platelets, etc.) on bulk composite properties, as well as to assess the influence of impurities or other entities (carbon clusters, nanofiber agglomerations, etc.) on effective properties. As part of a parallel study, molecular dynamics simulations are being performed with the goal of characterizing the chemistry, structure–property relations, and geometry of the interphase region arising between nanoreinforcements and matrix. 23 Such information can feed directly into micromechanical models similar to those presented here, with the aim of extending these approaches to account for the effect of imperfect or weakened nanofiber–matrix interfaces. 37 Computational micromechanics models are being developed, within an integrated multiscale modeling approach involving the NASA special purpose composite failure analysis code MAC/GMC 38 – 41 coupled with traditional finite element solvers, in order to assess the mechanical properties, progressive failure, and strength of nanoreinforced materials. The long-range goal of this effort is to facilitate engineered multiscale materials design by providing insight into relationships between nanomaterial fabrication/processing, chemical and physical characteristics, and interaction and evolution of structure across disparate spatial scales that lead to improved macroscale performance.
Footnotes
Acknowledgment
This research was supported by Department of Energy grant DE-FC26-06NT42755. The authors are especially grateful to Professors Sia Nemat-Nasser and Frank Fisher for their enlightening conversations on micromechanical model development. In addition, all TEM and SEM imagings associated with this study was performed at the Mississippi State University’s Institute for Imaging and Analytical Technologies (Director, Dr Giselle Thibaudeau).