
Abstract
The first stage of the RTM process concerns the preforming of the part. During the preforming of multilayered reinforcements, frictions between the plies occur. An experimental device designed to analyze the ply/ply, ply/tool, and yarn/yarn frictions has been built. Specific contact behavior for ply/ply friction is directly related to shocks taking place between overhanging yarns of each sample. Within the signal, two particular periods can be exhibited. This work shows for four different architecture woven fabrics that the two periods are directly related to the meso-architecture of the studied woven fabrics and more precisely to the characteristics of the fabric unit cell. The friction response appears to be very sensitive to the relative positioning and orientation of the samples. It can also lead to manufacturing defects such as unweaving or wrinkles. Up to now, finite element codes predicting the forming behavior of woven reinforcement fabrics do not take into account this friction coefficient evolution to model accurately the process. This point could therefore be addressed in future works on this topic with the view to optimize the multi-ply forming of composite parts.
Introduction
The market demand for fibre-reinforced composites in various industries and especially in the transportation area is increasing. Processes of the liquid composite moulding (LCM) family such as resin transfer moulding (RTM) can be considered in the manufacture of lightweight complex shapes parts. The first step of the process consists of draping a dry preform before injection of the liquid resin. The mechanisms taking place during the preforming stage are complex and very different than the ones occurring during the stamping of metallic sheets. These mechanisms are far from being fully understood. 1
Many methods have been proposed recently to achieve representative sheet forming simulations for one layer of dry or thermoplastic fabric, with different approaches. 2 – 5 Several key entry parameters for the simulation models need to be determined experimentally. The mechanical properties of a single layer of different types of woven fabric reinforcement plies have been widely studied. 6 – 11 In addition to the reinforcement properties, the fabric/tool contacts and, for those dealing with multi-ply forming, the fabric/fabric contact has to be studied and modeled. The tool/fabric contact and to a lower extent the yarn/yarn contact have been investigated by different authors for carbon fibre-reinforced thermoplastics or dry fabrics. 12 – 17
The numerical studies carried out to simulate multilayer forming of dry fabrics use an approximate ply/ply friction coefficient not dependant on the yarn angle 5 whereas preliminary forming tests conducted on a stack of reinforcement confirmed the significant influence of the relative positioning between dry plies 18 and therefore contact between layers. This phenomenon was also observed for thermoplastic pre-impregnated reinforcements. However, the friction behavior taking place during the forming of CFRTP is mainly a viscous friction due to the resin film between the layers. Consequently, the models based on the fact that the viscous interlayer plays a major role in the interply and tool-ply slip2,19,20 cannot be used to quantify and analyze the friction between dry fabrics as the fabric meso-structure should play a much more significant role in the contact behavior.
Studies investigating dry fabric frictions can be found in the textile scientific community 21 – 26 and are among the most relevant over the past years. However, the yarns in terms of mechanical properties and geometry are different from the ones used in composite reinforcements. Therefore, a direct use of the textiles results seems difficult, and a dedicated study concerning composite reinforcement is necessary.
The goal of this article is then to propose an analysis of the contact behavior between two layers of different dry technical fabrics using a specific device27,28 (Figure 1) specifically developed in the lab to understand, optimize, and model the first preforming stage of the RTM process. After a brief review of the device principles, the contacts mechanism involved and the specific aspect of the tangential force, results are presented. The influence of parameters such as the relative angle between the two layers and type of patterns of dry fabric forming will be presented. This discussion will also attest to the potential of the device to perform further studies.
External view of the friction device.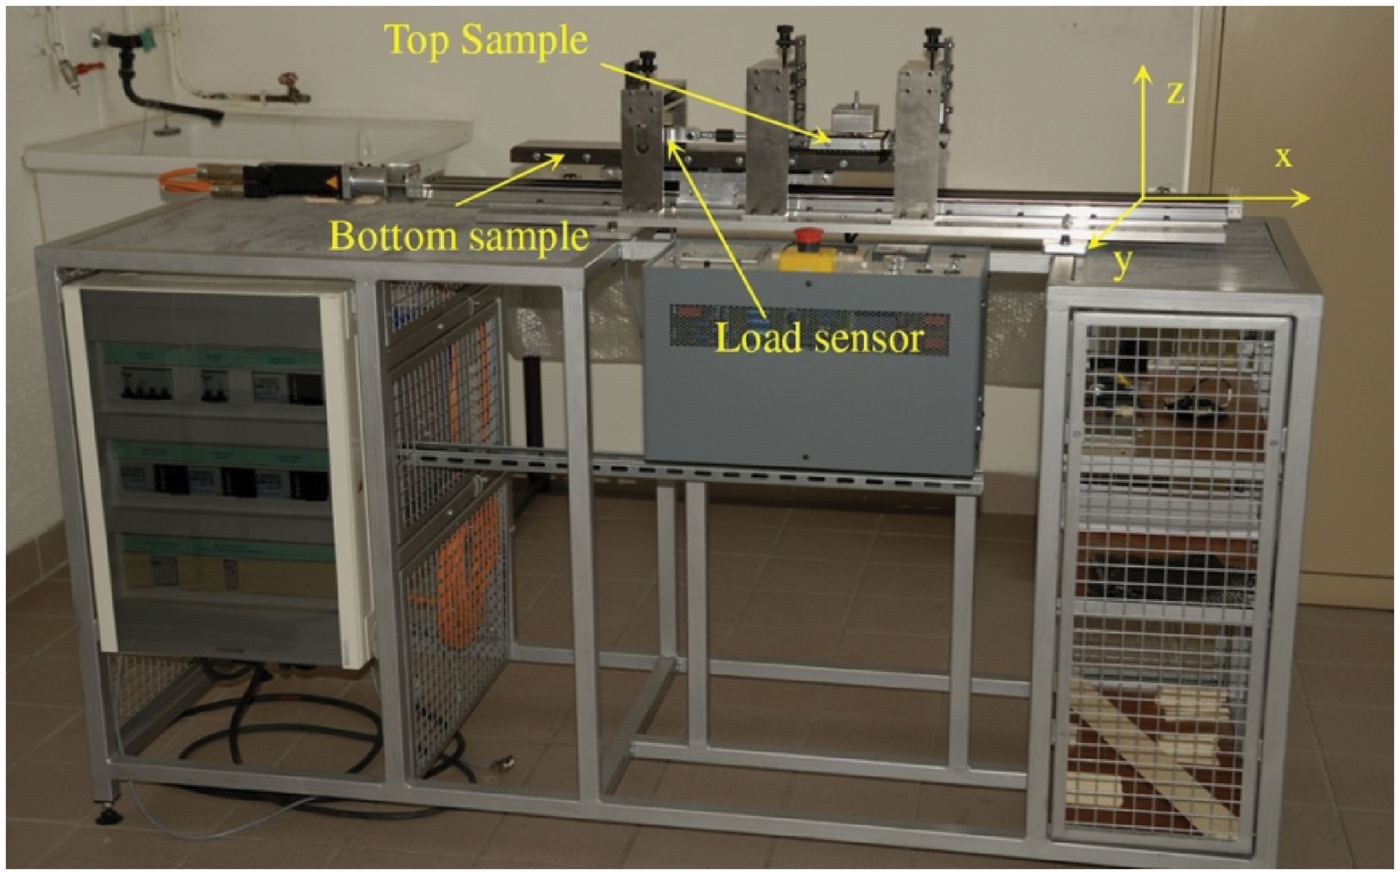
Materials tested
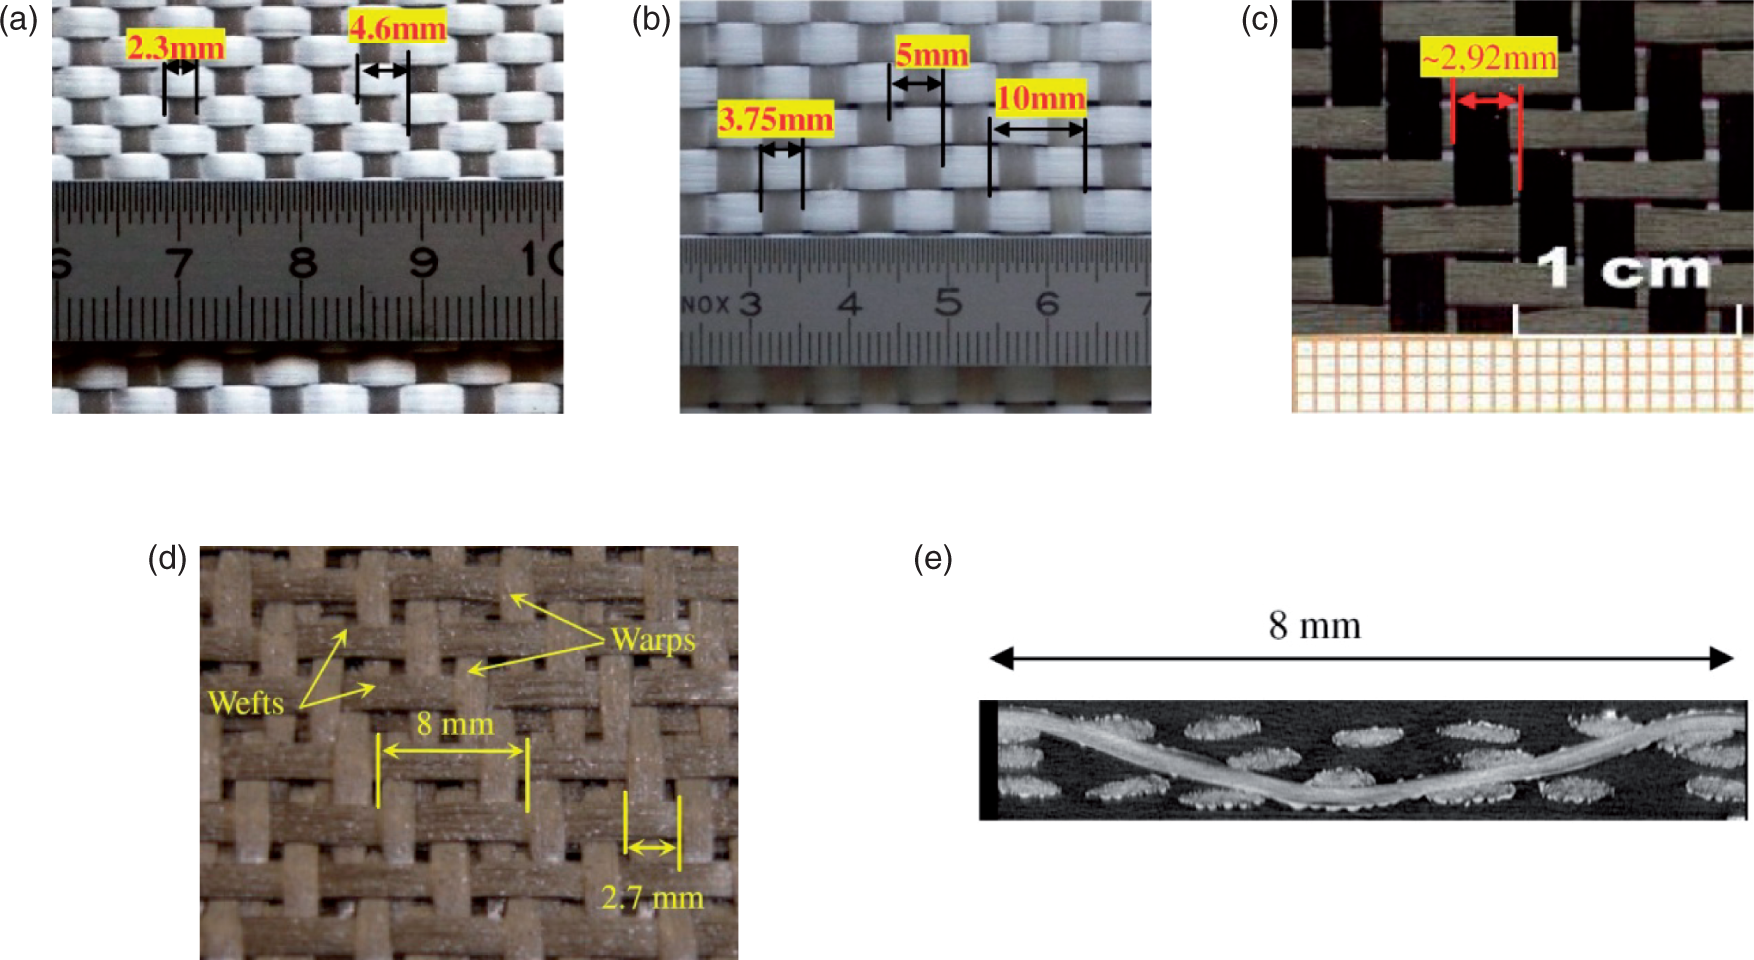
Four commercial woven fabrics with different architectures have been used for this experimental study (Figure 2). Two glass plain weave fabrics, a carbon twill weave, and a carbon interlock. The first glass plain weave is a 0.6 mm thickness Tissa+ glass plain weave with an areal weight of about 740 g/m2. The yarns have widths of a 2.1 mm and an average spacing between yarns of 2.3 mm. The second material tested in this work is a 0.75 mm thickness ‘balanced’ glass plain weave with an areal weight of 504 g/m2. It has 3.75 mm-wide yarns, 5 mm average spacing between weft yarns and 4.5 mm spacing between warp yarns. The carbon twill weave is the Hexcel G986®. It has an areal weight of 285 g/m2 and is made of HTA 5131 6K yarns. The average yarn width is 2.68 mm (∼2.6 mm for warp, ∼2.8 mm for weft). The average yarn spacing is 2.92 mm (∼2.91 mm for warp, ∼2.93 mm for weft). The interlock fabric is a powdered Hexcel G1151®. It has an areal weight of 630 g/m2 and is comprised of T300JB 6K yarns. The nominal construction is 7.5 yarns/cm for warp and 7.4 yarns/cm for weft. The G1151® unit cell consists of 6 warp yarns and 15 weft yarns, with the weft yarns being distributed on three levels (Figure 2).
29
In situ average yarn width is about 2 mm for warp and 3 mm for weft.
Fabrics used for fabric/fabric friction. (a) Glass plain weave 1. (b) Glass plain Weave 2. (c) carbon twill 2*2 weave. (d) Interlock fabric Hexcel G1151®. (e) Tomography of G1151® unit cell- Cut along warp yarn.
29
Description of the device and preliminary results
Description of the device
When considering experimental investigations of dry-fabric friction, various mesoscopic heterogeneities with very different unit cell sizes and anisotropy should be considered. This requirement suggests that specific experimental equipment should be considered to take into account these details. A specific experimental device dedicated to this task has consequently been designed in the lab and is presented in Figure 1.27,28 The classical principle consisting of two plane surfaces sliding relative to each other is considered to be the most promising for this study. This principle has been chosen by most of the teams working on fabric friction.12,13,22,25,30 This experimental principle is furthermore directly related to the interply sliding during forming. The bottom sample (60 cm long and 9 cm wide) is fixed on a steel plate. It is rigidly and accurately guided by a linear system to translate horizontally in a fixed direction. A motor and an electronic speed controller are used to impose the displacement with a speed variation from 0 to 100 mm/s. The top sample (10 cm long and 8 cm wide) is fixed on a steel plate which is linked to the load sensor. The lateral positioning of the upper sample is ensured by a linear joint. The load sensor is calibrated and used in the 0–20 N range to get 0.01 N accuracy. A data acquisition system is used to record measurements. Details on the device design and validation can be found in reference 28.
Preliminary results on one pair of plain weave samples
Before going to a more extensive and accurate analysis of the fabric/fabric friction, let us remember the preliminary results and conclusions already presented in references 27 and 28 (Figures 3 and 4) for the fabrics presented in the section Materials tested. The friction coefficient µ is assumed to be calculated using the coulomb's theory
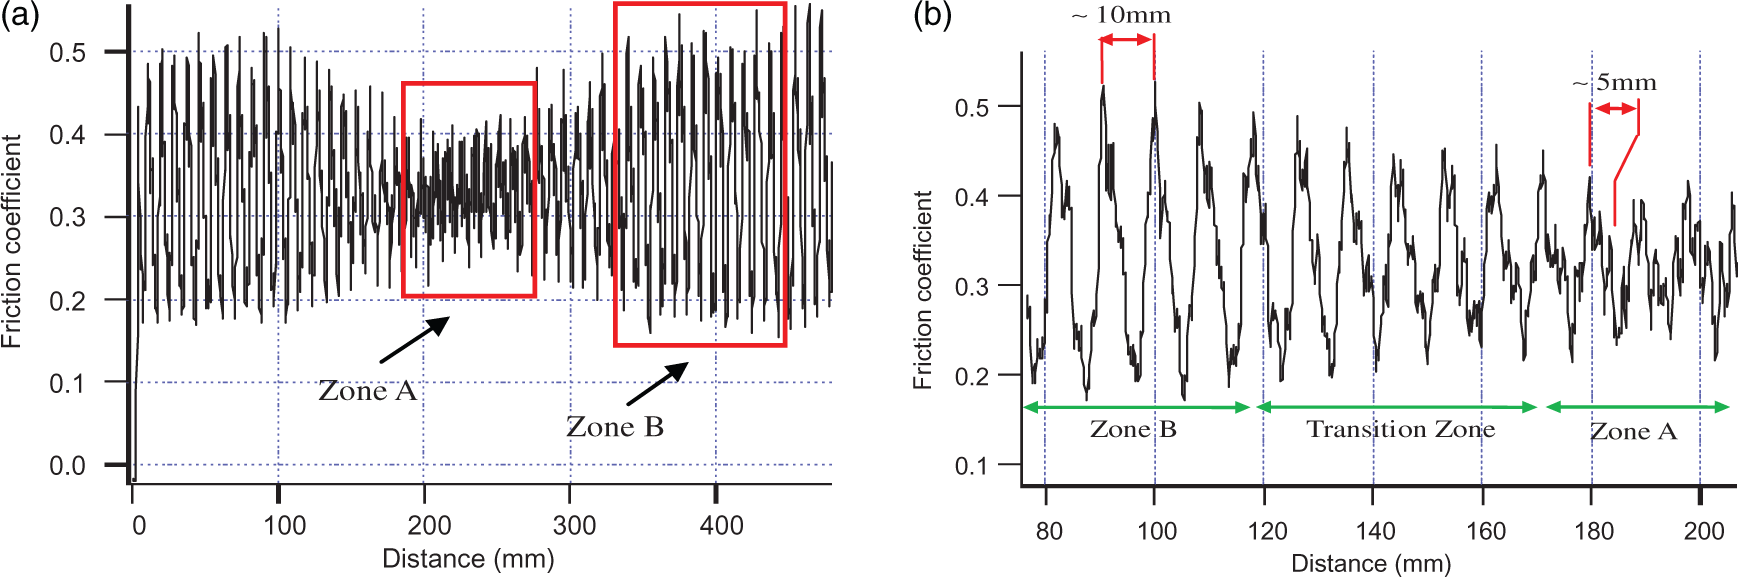
Experimental results for the glass plain weave 1, v = 5 mm/s, N = 10N, 66 Hz sampling. (a) Tangential load T (N). (b) Average friction coefficient. (c) Zoom on the zone A, zone B, and transition zone. Friction coefficient results for two other identical pair of samples of the glass plain weave 1, v = 5 mm/s, N = 10 N, 66 Hz sampling. (a) Results of pair of samples 2. (b) Results of pair of samples 3.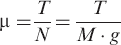
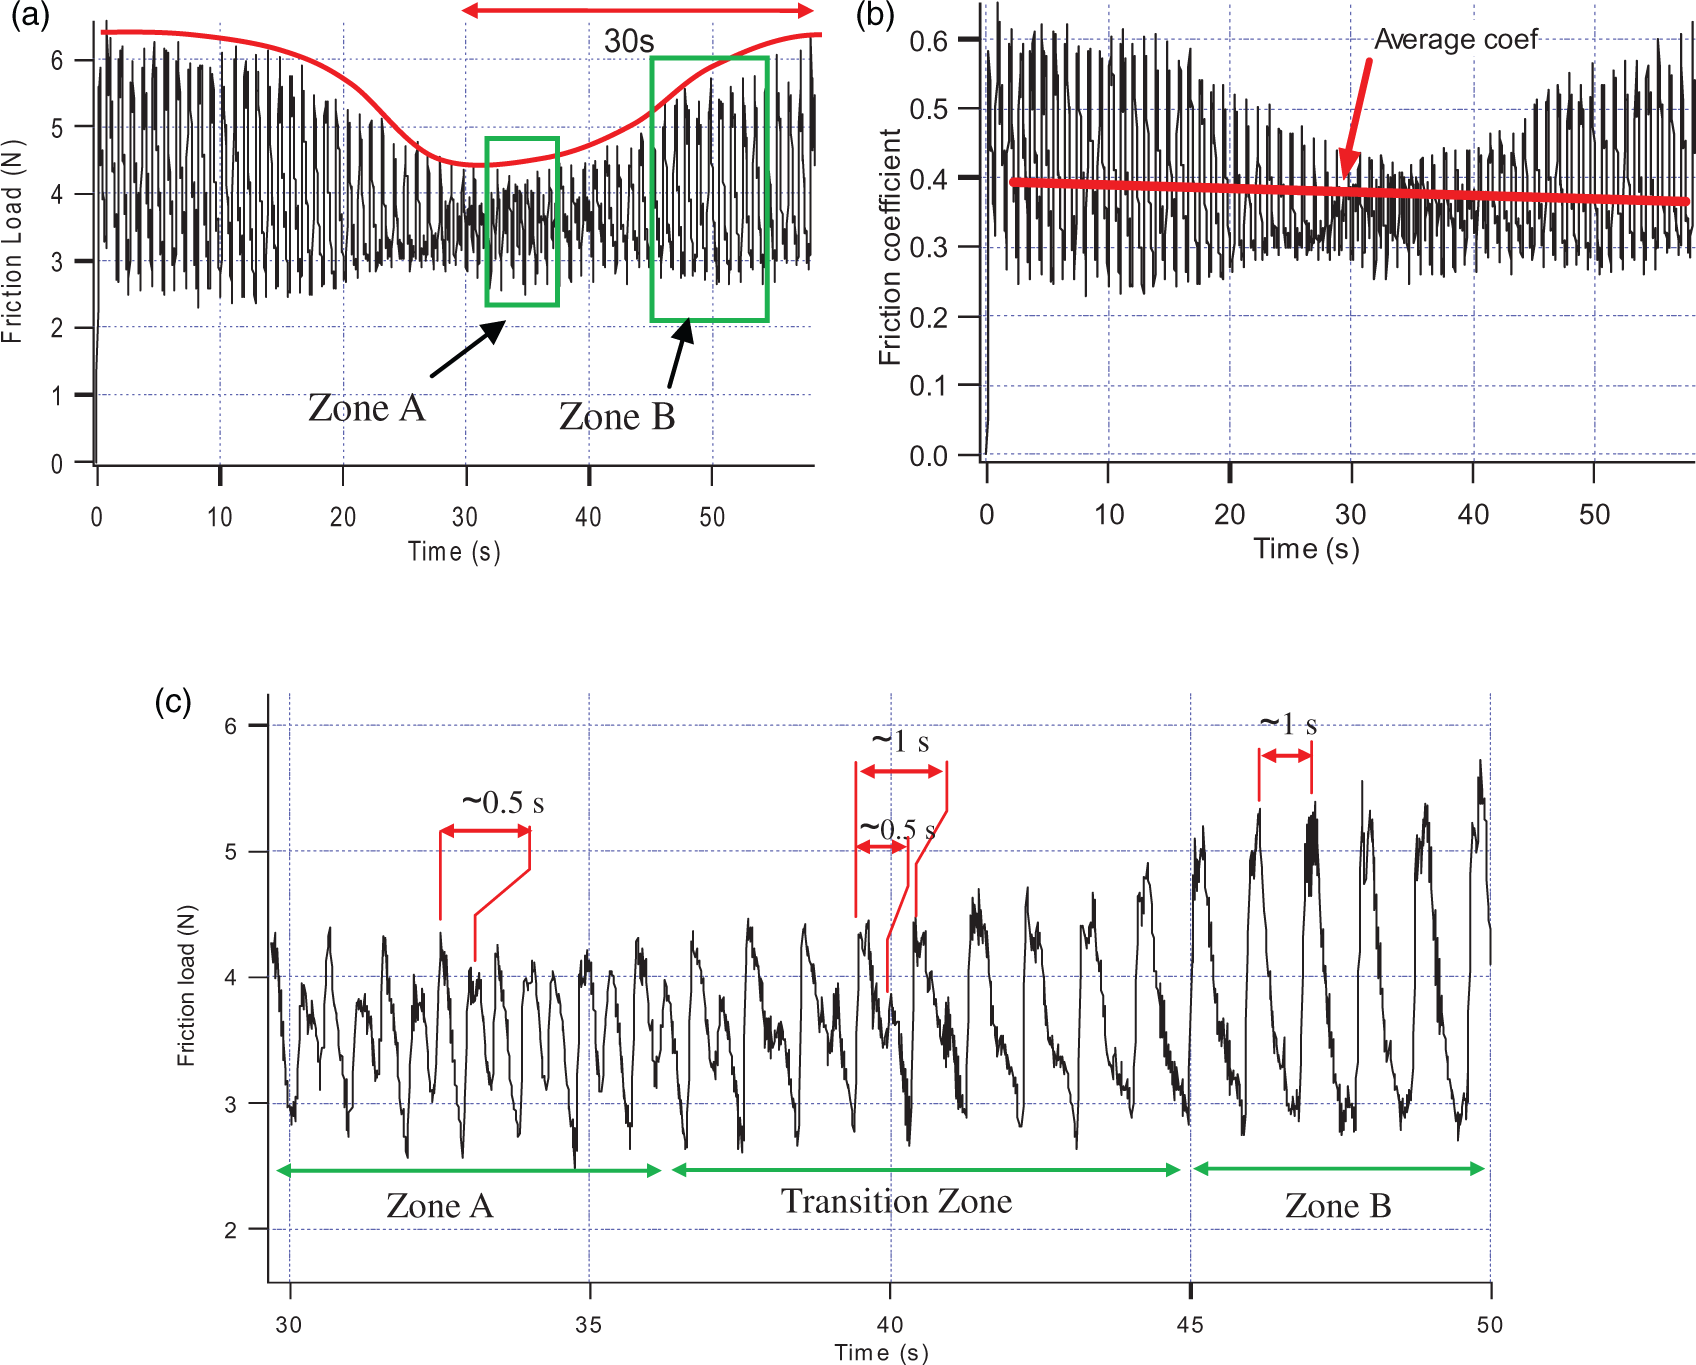
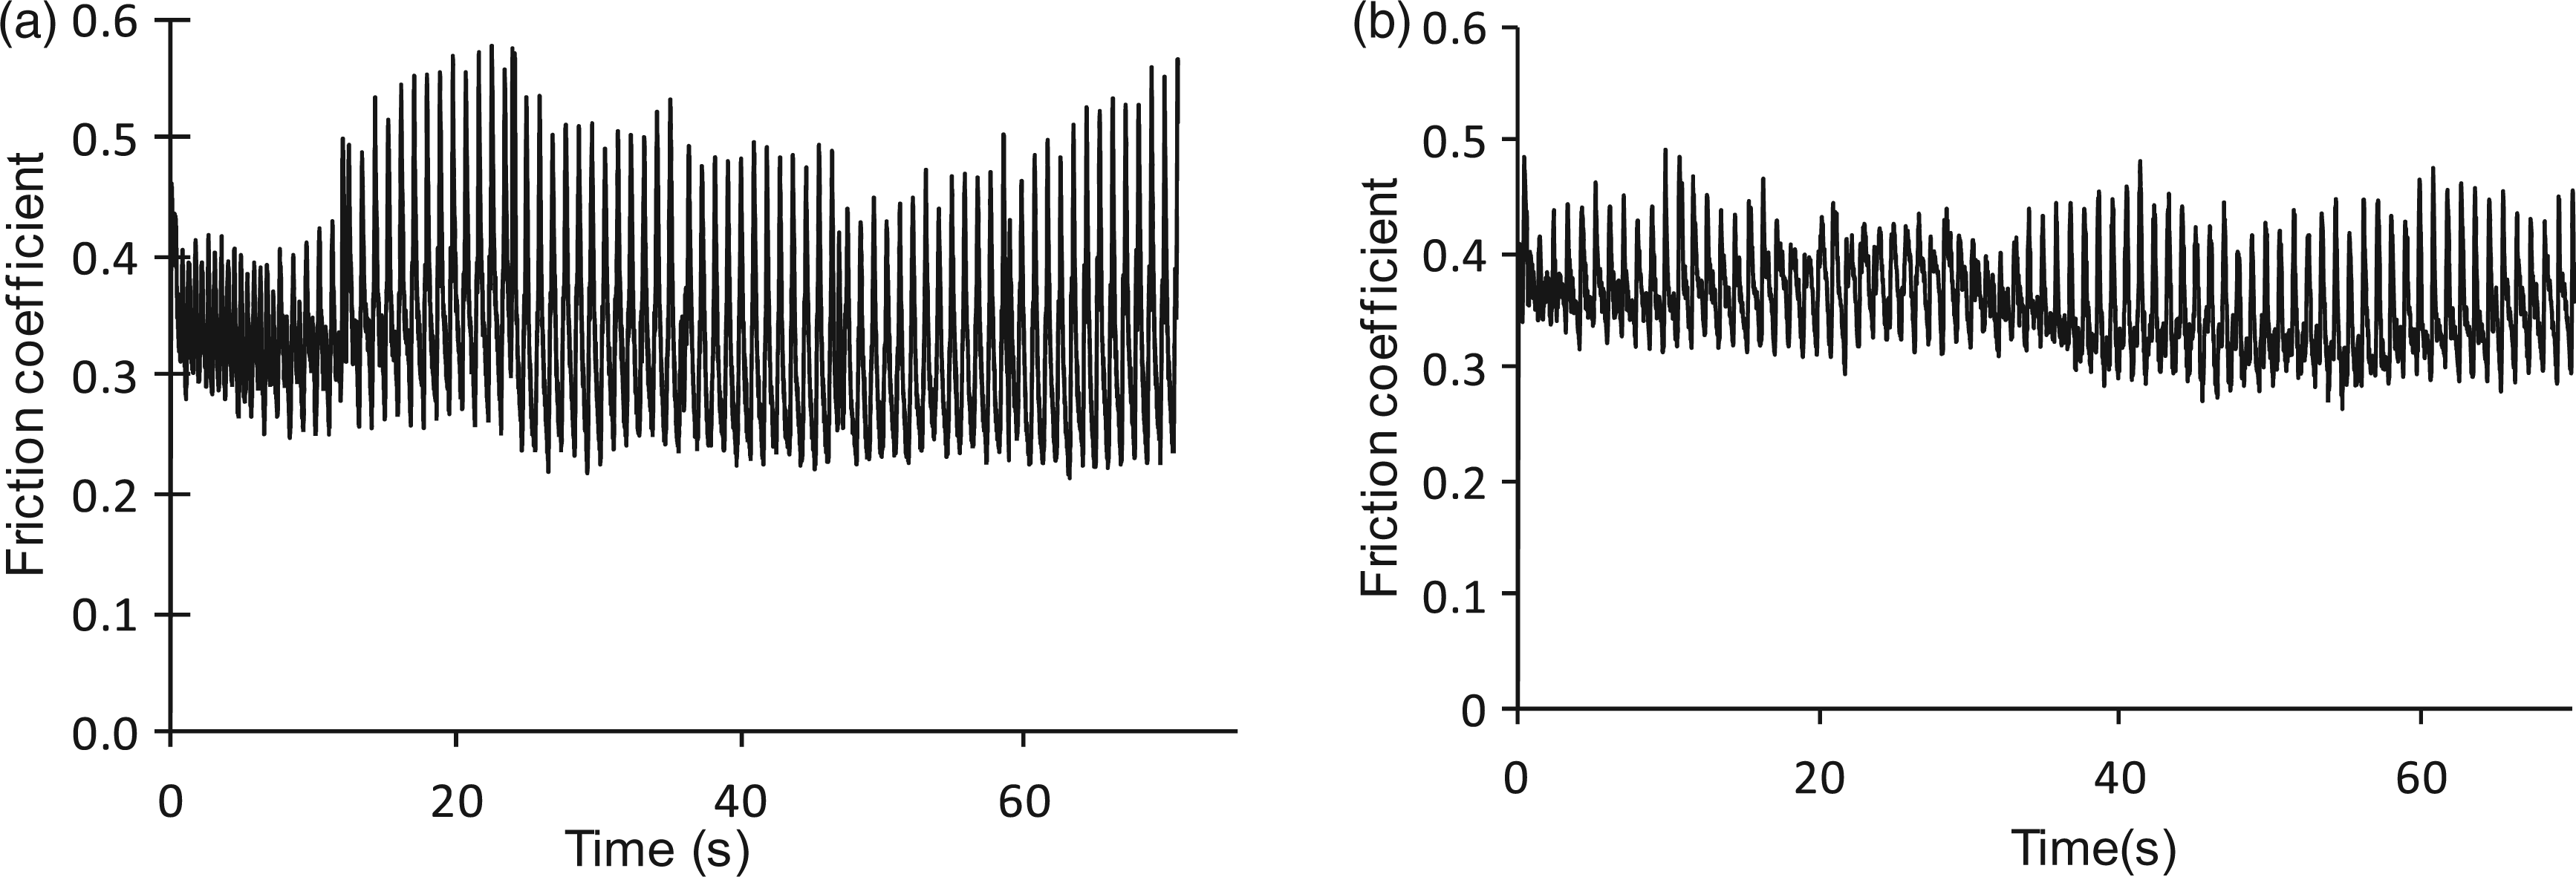
As it was expected, specific contact behavior was observed for dry reinforcement fabrics in comparison to nontechnical textiles (garments …), yarn/yarn or fabric/metal (Figure 3). Particularly, variations of the contact tangential loads appeared to be very substantial while all the test parameters remained constant. It was consequently concluded that defining an average friction coefficient (about 0.39 in this case) would lead to a high amount of uncertainties in the mechanical analysis of these materials (Figure 3(b)).
A more accurate analysis of the response enables us to distinguish three characteristic pseudo periods. The first one depicts the undulation of the local maximum values (Figure 3(a)). Even if its value is not so easy to quantify, this first period can be approximately evaluated and is equal to about T = 60 s. Local minimum values are not submitted to the same type of undulation as the maximum values, and their magnitude is much smaller. A representative period does not appear so clearly, the lack of symmetry is noticeable. The second period is associated to the interval between two maximum load values when the response magnitude is the highest (∼6 N, Figure 3(c)). Its value is about TB = 1 s. The third one is the duration separating two maximum load values when the response magnitude is the lowest (∼4 N, Figure 3(c)). Its value is about TA = 0.5 s. These last two periods were observed to be repeatable (Figure 4).
These preliminary experiments have also pointed out a honing (effect classically observed in dry fabric testing) through cyclic experiments. It has been attributed to fibres material abrasion and to fibre reorganization in the yarn. 28 Using the potential of the designed device and experiments at higher sampling frequencies, the goal of this article is to analyze the origin of this particular behavior and especially to point out the influence of the fabric meso-structure.
Influence of the mesoscopic architecture of the fabric: tests at higher sampling frequency
Physical phenomena: analysis of plain weave results
To analyze more accurately the signal variations, tests at a high sampling frequency have been performed. All the tests were conducted at classical environmental conditions (T ∼23°C). After preliminary tests, a 5 mm/s displacement speed is chosen for the bottom sample. A 3-ms (333 Hz) acquisition period to distinguish the frequencies of the different physical phenomena taking place during the measurement is considered. As the total amount of recordable data points is limited (maximum 4000), only a part of the global sliding stroke can be covered (6 cm). Consequently, different tests at different locations of the stroke have been performed to get results in the different zones of interest (zone A, zone B, and transition zone in Figure 3). If a longer part of the sample needs to be covered, consecutive tests can be performed. Continuous curve along the whole stroke can be obtained through this protocol. It is not completely continuous because for each test the time needed to reach the steady state needs to be considered (0.7 s in our case).
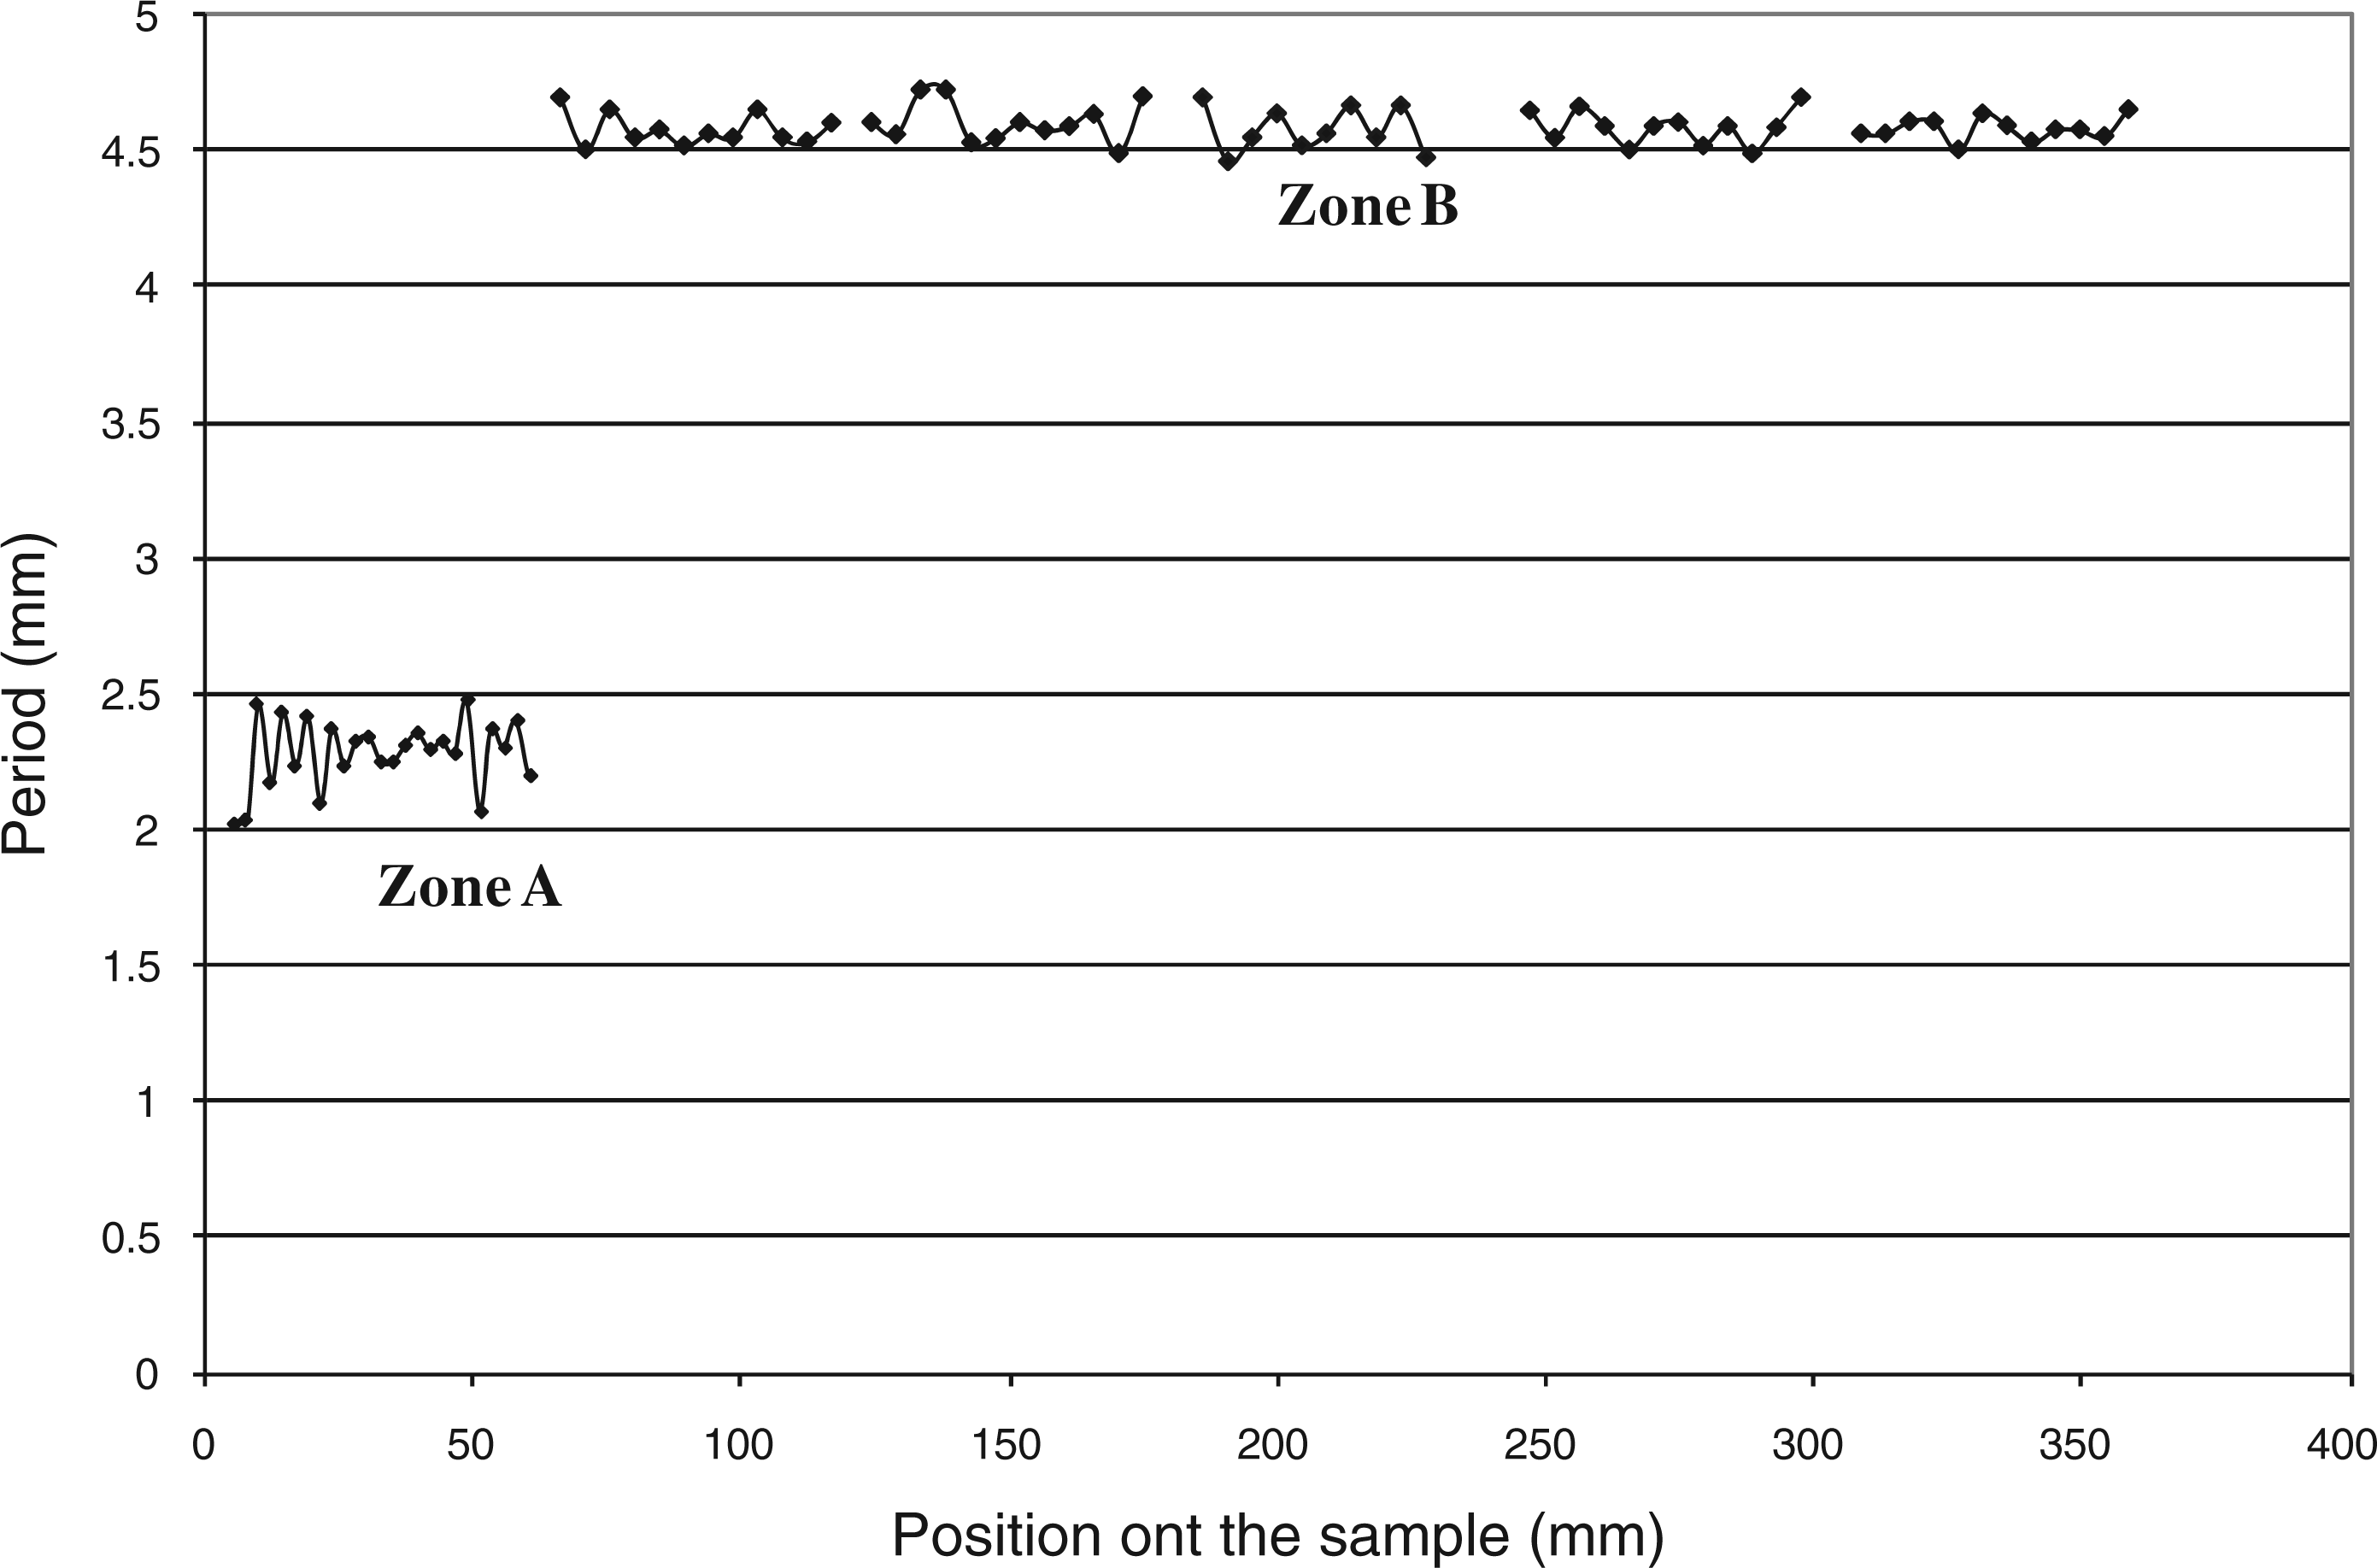
An example of results obtained through this protocol for two consecutive zones of the same sample is presented in Figure 5. Two different signals are clearly visible in Figure 5(a) and (b). The respective period and magnitude of each are globally constant. They can be accurately measured using these fine results, plotted in time units. The average value for each of them is: TA = 0.46 s and TB = 0.92 s, with a standard deviation lower than ±10%, which is remarkable considering the fabric structure. The transition zone (Figure 5(c)) consists of the progressive appearing and disappearing of an additional peak. Figure 6 gives the period value on all stroke of the pair of samples studied in Figure 5, expressed in length units. This curve shows very clearly the two different zones (A and B) previously observed and confirms the noticeable stability of the period inside each of them. A comparison between the measured length periods, dA ∼2.3 mm and dB ∼4.6 mm, to the geometrical parameters of the fabric unit cell can be conducted. The distance between two consecutive yarns is 2.3 mm. Thus, the size of the unit cell (periodic geometry) is 4.6 mm for this plain weave. The characteristic period values found in the friction test signal are similar to the meso-geometrical parameters of the fabric. This statement implies an influence of the fabric meso-structure on the friction behavior. Figure 7 presents an example of results obtained for different samples of the second glass plain weave. The specific contact behavior already shown in Figure 5 is also observed and the consistency between the period values and the fabric geometrical parameters is unquestionably confirmed as the values of the characteristic period are similar to the values of the space between two yarns and the elementary cell length as described in the section Materials tested.
Experimental results for the glass plain weave1, v = 5 mm/s, N = 10 N, 333 Hz sampling. (a) Detailed results in zone A. (b) Detailed results in zone B. (c) Transition zone. Characteristic periods of the signal in zones A and B in length units for the glass plain weave 1. Results for a pair of samples of the second glass plain weave (v = 4 mm/s, N = 7 N). (a) Friction coefficient for a global test (33 Hz sampling) in length units. (b) Periods in length units for zone A and B (200 Hz sampling).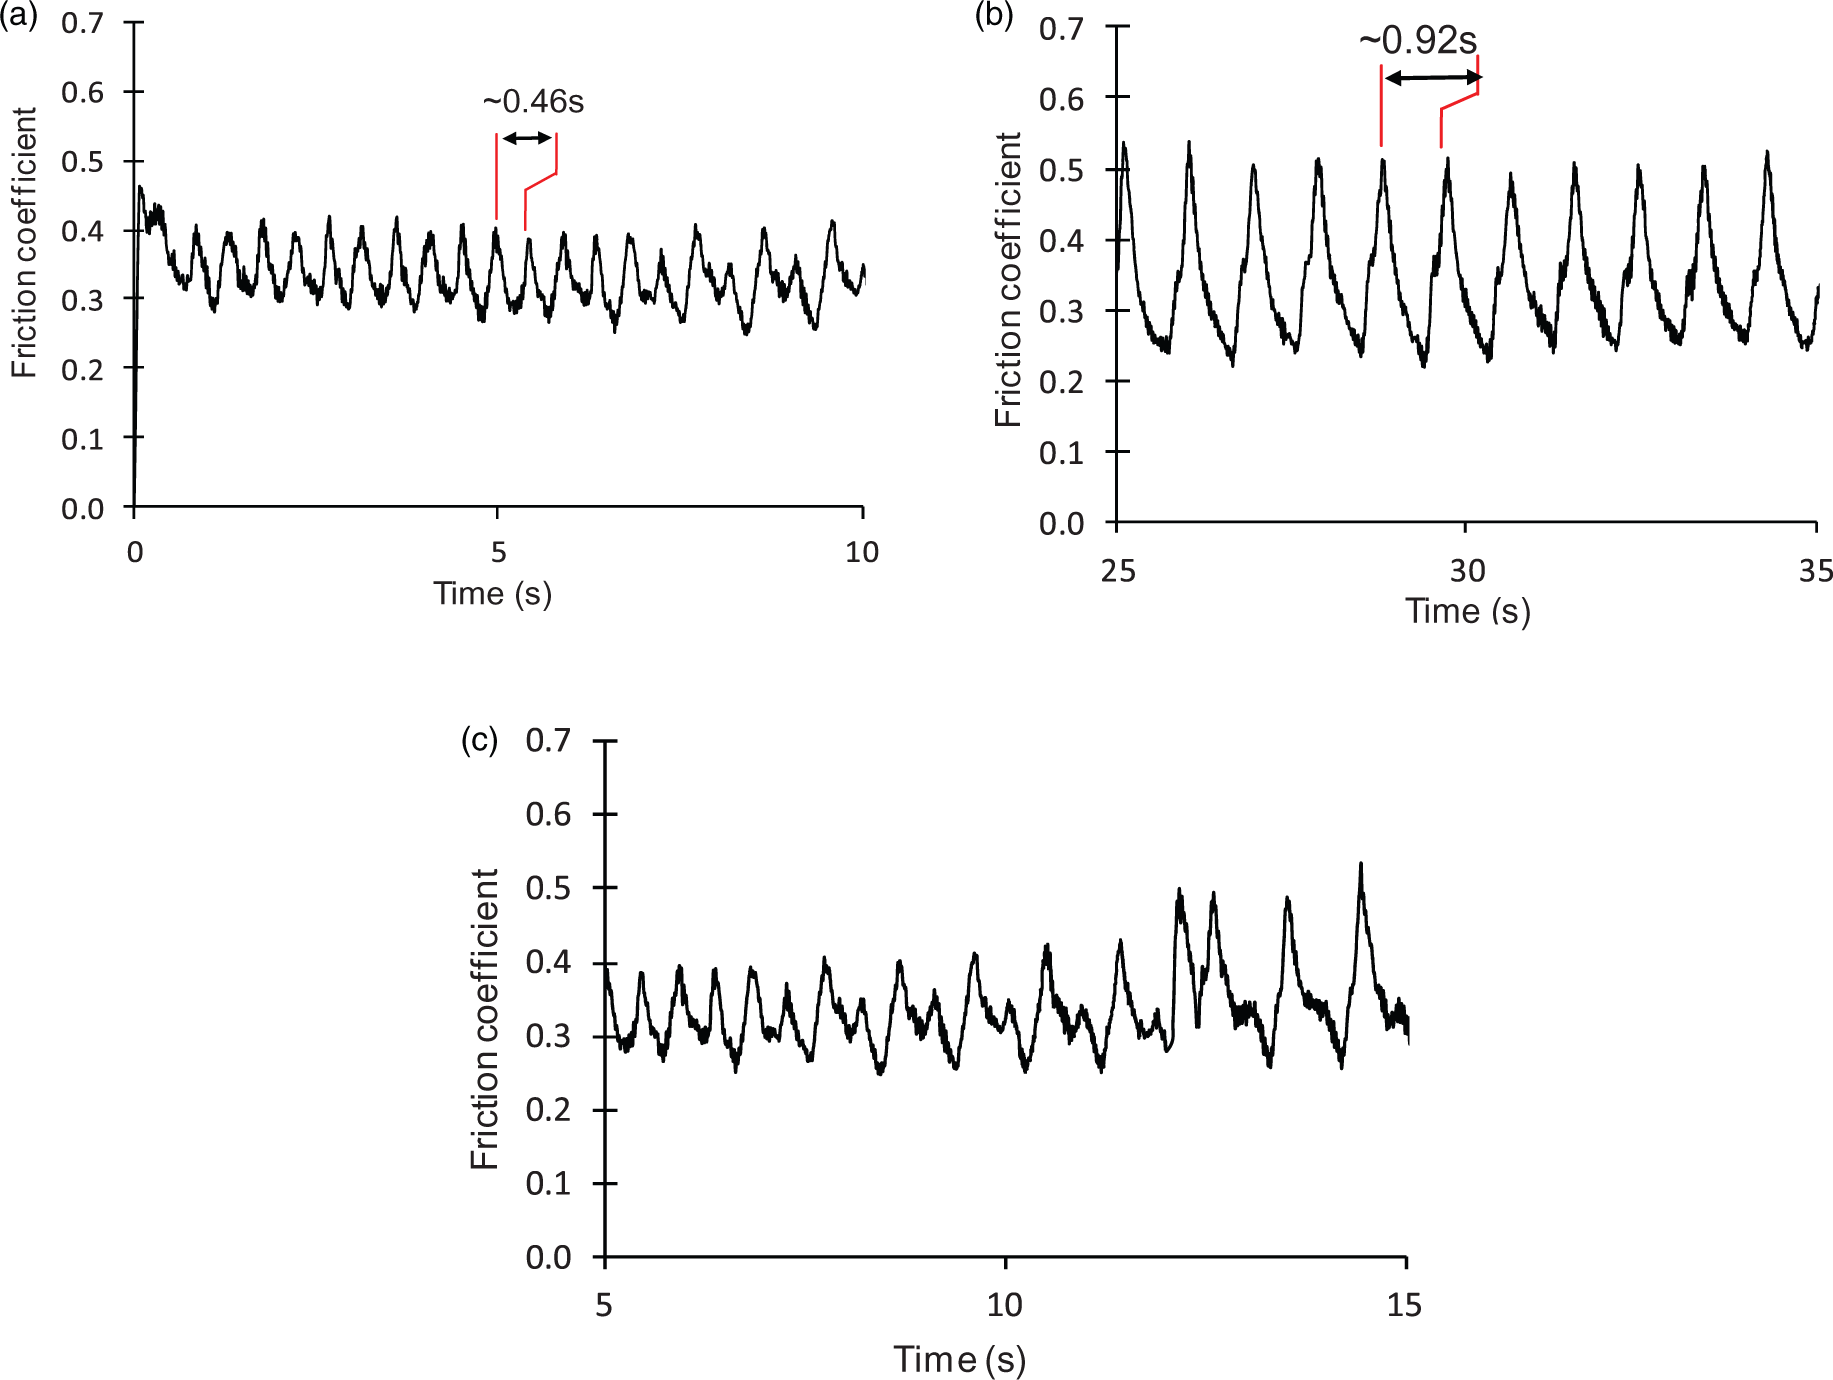
The influence of the meso geometrical structure of the fabric is easily understood through a simple geometrical analysis as illustrated in Figures 8 and 9.
Samples relative lateral positioning for the Glass plain weave 1, (blue continuous line: the top sample, red dashed line: the bottom sample). (a) Superimposed samples, (b) Shifted samples Phenomena occur during fabric/fabric contact behaviour. (a) Representation of the shock phenomenon caused by overhanging yarns for a plain weave. (b) Representation of the overhanging yarn's phenomenon for interlock fabric.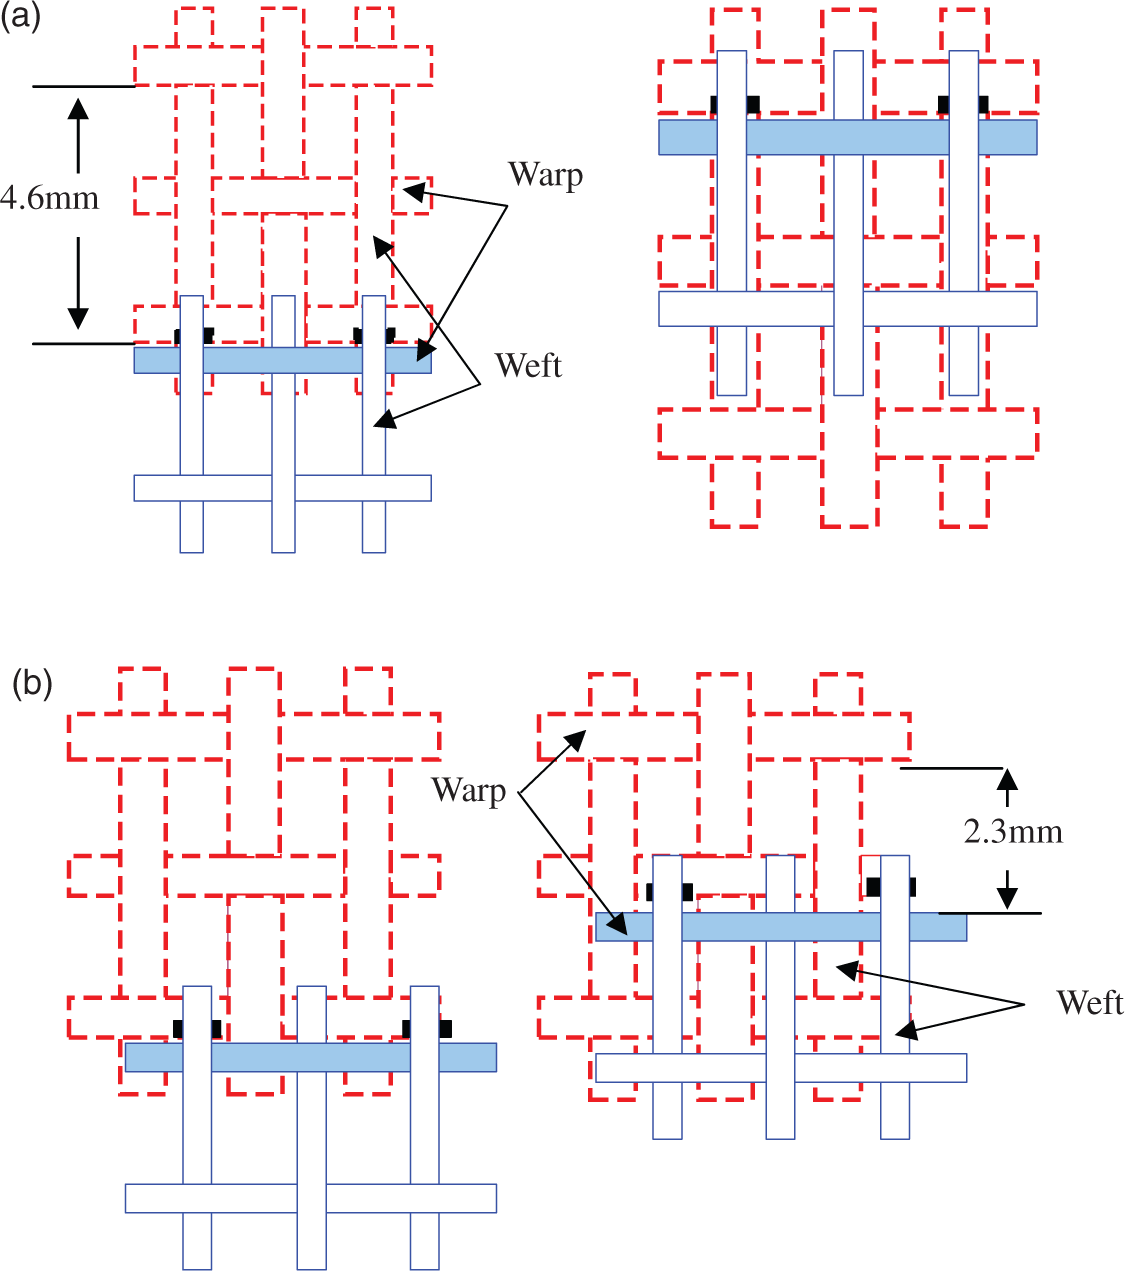
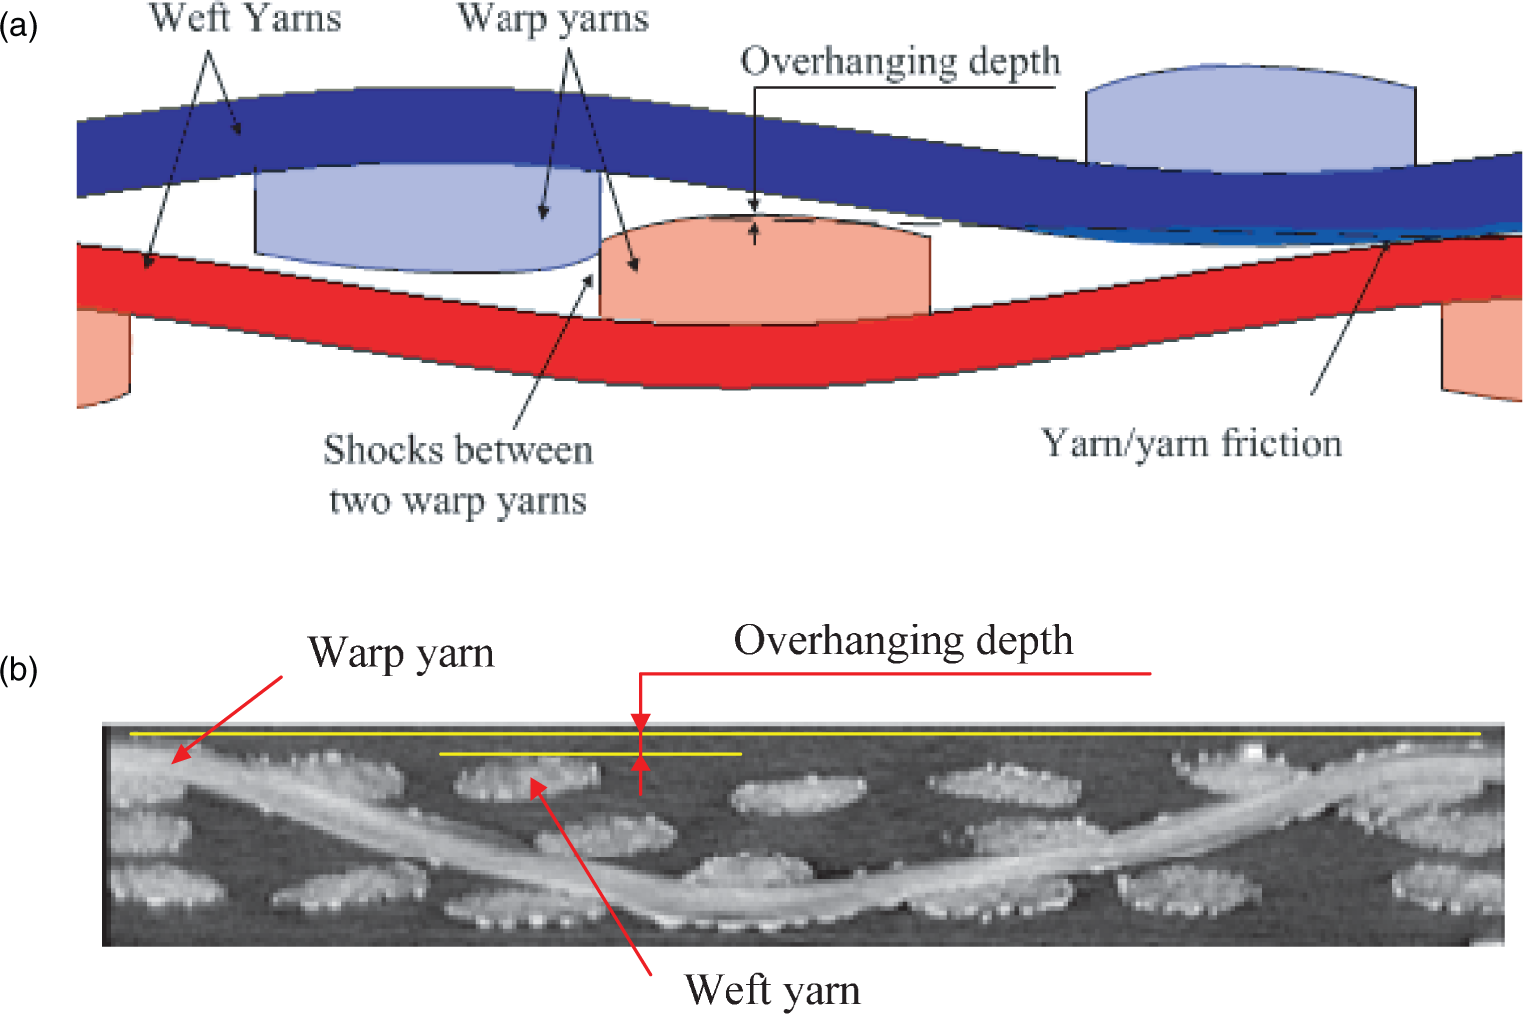
If the two samples are perfectly superimposed, the higher zone of the bottom layer encounters the lower zone of the upper sample (Figure 8(a)). This configuration is representative of zone B on Figures 3(c), 5(b), and 7(b). The fabric/fabric contact behavior consists in the superposition of two phenomena (Figure 9(a)). The first one is on the yarn/yarn sliding friction that occurs between the yarns oriented in the stroke direction. The second phenomenon is the shocks that take place between the transverse yarns of each sample, at each period of the unit cell, at the same time everywhere on the sample width. Reaction force due to this phenomenon increases leading to high maximum friction values (peaks of zone B). Once the obstacle, the fabric/fabric contact behavior will be the sum of the sliding friction between the different yarns of the two samples (warp/warp, weft/weft, and weft/warp), which tends to minimize the tangential loads.
Shock's phenomenon takes place because the warp yarns overhang the weft yarns (Figure 9). The overhang depth depends on the weaving defects, the meso-architecture of the fabric (crimp, yarn's thickness, fabric thickness, pattern, density …). This explains why the nontechnical fabrics with lower crimp and lower thickness yarns are submitted to lower magnitude variations. Shocks are more significant if the crimp is high and the yarns are thick.
On the contrary, if samples are shifted by half of a geometrical period (Figure 8(b)), the higher zone of the bottom layer does not encounter the lower zone of the top layer. In that configuration, the contact period is lower and is repeated every half geometrical period. The shock between the yarns is also lower. As a consequence, lower maximum friction values, lower variations, and a signal period corresponding to half of a unit cell can be observed. This corresponds to zone A in Figures 3(c), 5(a), and 7(b).
Between the two extreme shifts (transition zone), the signal is a combination of these two contact configurations, and the magnitude of the friction load depends on the actual shift between the bottom and the top sample.
In Figure 3, the signal indicates that the configuration corresponding to superimposed samples takes place as the period corresponding to a geometrical period is observable. On the same signal, a lower period signal corresponding to shifted samples is also observable. This lower signal therefore suggests that a lateral shifting displacement during the test took place. This displacement is the consequence of the play in the linear joint (between the two plates and the roller) to ensure the planar positioning between the two samples and of the difficulty to align perfectly all the yarns of two samples of dry fabrics. This point is even more valid if the fabric cohesion is weak. Depending on the initial positioning of each sample (shift, angle), there can be more or less relative displacement between the two samples at different location along the samples. When the two samples are large enough and if the samples are very carefully positioned, only one characteristic period is observed along the stroke (Figure 4(b) for instance).
Extension to other patterns: t will weave and interlock results
Results obtained for the interlock and twill weaves are presented in Figures 10 and 11, respectively. The curves look very similar to the one presented in the previous section for the two glass plain weave fabrics. Period values and magnitudes are obviously different because the meso-architecture (pattern, crimp), the yarns construction, and geometry are different (width, thickness, density…). For the interlock weave, despite the complexity of the pattern and the yarn's lower width and thickness, contact zones and transitions appear clearly (Figure 10). The two characteristic periods can be easily extracted: dA ∼4 mm and dB ∼4 mm. These two values are here again fully consistent with the geometrical parameters of the fabric unit cell. The 8 mm period is related to the distance between two consecutive overhanging yarns (Figure 2(d)) in the case of superimposed samples. Due to the complexity of the interlock pattern, the 4 mm period (half of the first characteristic period) is much more difficult to analyze. Indeed, it was expected to observe for instance a 2.7 mm period corresponding to the distance between two neighboring overhanging warp yarns (Figure 2(d)). The lateral shift of the sample is accompanied by a more diffuse occurring of the shocks and by a strong decrease of the magnitude as observed for the glass plain weave fabric.
Friction coefficient as a function of the distance for two pairs of interlock fabric samples (v = 5 mm/s, N = 10 N, 66 Hz sampling). (a) Global results for pair of sample 1. (b) Global results for pair of sample 2. (c) Zoom on the first 100 mm for the pair of sample 1. (d) Zoom on 50 to 100 mm for the pair of sample 2. Friction coefficient as a function of the position on the sample for a twill weave pair of samples (v = 5 mm/s, N = 10 N, 200 Hz sampling).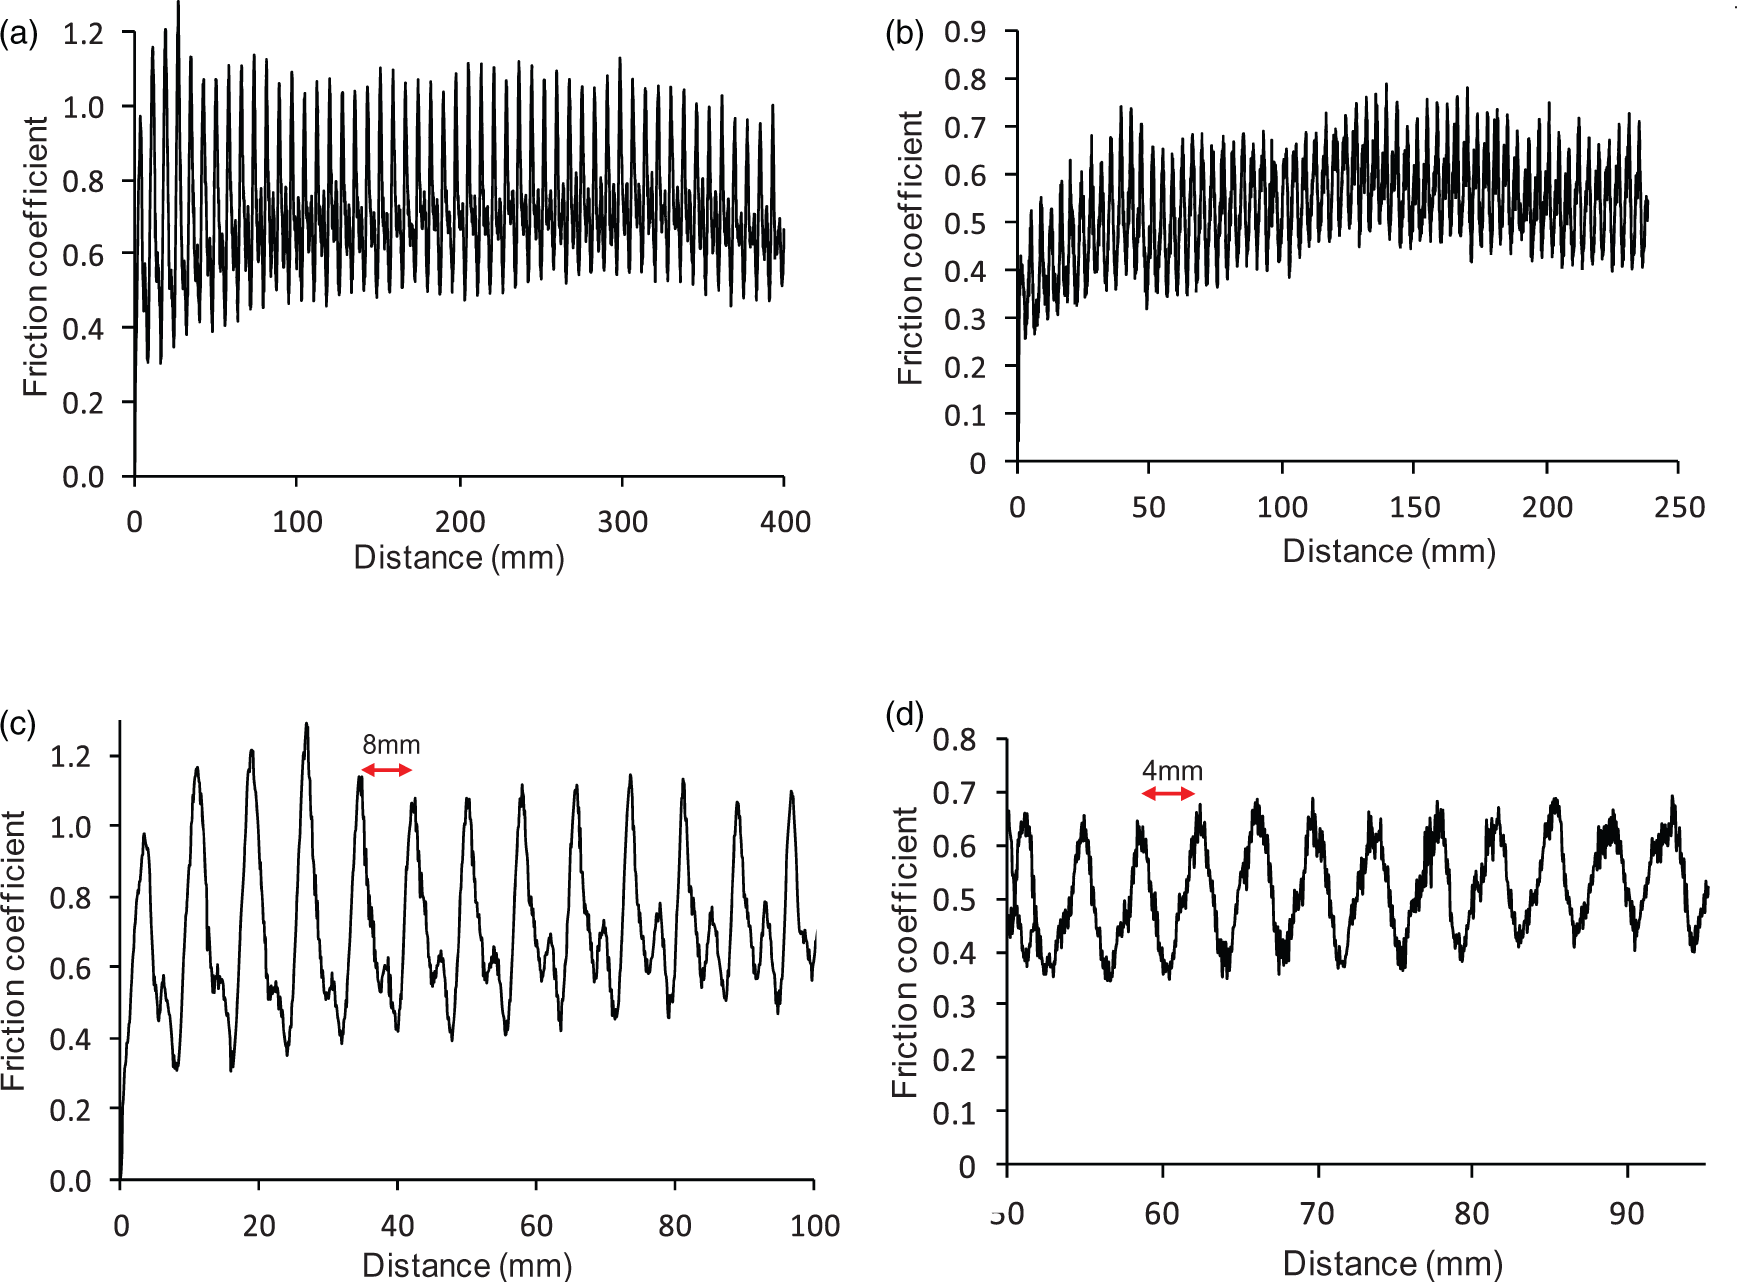
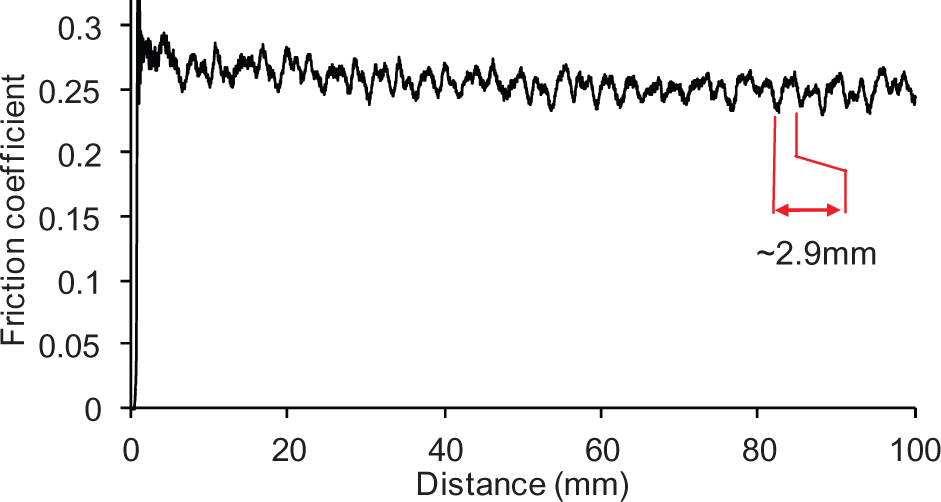
Carbon-twill results confirm and complement our analysis. The curve shape is as expected similar to the previously observed curves, but the variations in magnitude are much lower than for the other pair of samples. By looking at the fabric geometry, it observed a small crimp and a low thickness of the yarns. As a consequence, the weft yarn has little overhang on the upper part of the warp yarns. Shock impacts are then reduced, and magnitudes are lower. In this case, also (even if the pattern is more simple than for the interlock weave), the contact chains are not as simple as in the case of plain weave fabrics. Indeed, contacts between the lowest zone of the upper sample and the highest zone of the lower sample concern several yarns and occur at different locations. However, the value of the characteristic period is of about 2.9 mm (Figure 11). This value can be associated to the unit cell length (Figure 2(c)). The impact of the meso-structure on the friction response is clear in this case also even if the complex contact chains and yarns profiles lead to a more confuse signal and lower variations in magnitude.
As a matter of conclusion, even if the pattern is much more complex, high variations are observed in the friction response. The highest level of variation due to the shock between overhanging yarns of each sample leads to a periodic signal. This period is linked to the distance between two consecutive overhanging yarns which is the unit cell length of the studied fabrics. The second peak due to the initial or progressive shifting of the two samples seems to be associated with half the unit cell length. This last point needs to be investigated further. The weaving process parameters influence the variations magnitude as shocks between weft and warp yarns are more intense when the weft yarns significantly overhang the warp yarns. This situation happens when yarns are thicker and crimp is higher. This point will be confirmed in the next section when dealing with the orientation of the two samples.
Influence of the relative orientation of the two plies
During forming, the plies can be stacked with various orientations. In addition, even if the orientation of the different plies is originally the same, in-ply shear corresponding to yarn reorientation regularly takes place. It is then crucial to study the evolution of the friction forces as a function of the ply angles. Plain weave fabrics are first addressed because of their pattern simplicity and more complex fabrics are subsequently considered.
Plain weave fabrics
Seven relative ply/ply orientations have been tested for the first glass plain weave fabric with angle variation of 15° from 0°/0° to 0°/90°. The position 0°/0° is considered as the reference position where the weft yarns of the two samples are oriented in the stroke direction. Results presenting the average friction coefficient and the standard deviation as a function of the relative orientation are shown in Figure 12(a). The sample positioning leads to high amounts of signal variations. The average value is not easy to define, especially for the 0°/0° orientation. However, it has been calculated averaging the friction coefficient found for different tests.
Average friction coefficient and average standard deviation as a function of the relative orientation between the two samples. (a) Case of the second glass plain weave. (b) Case of the interlock fabric.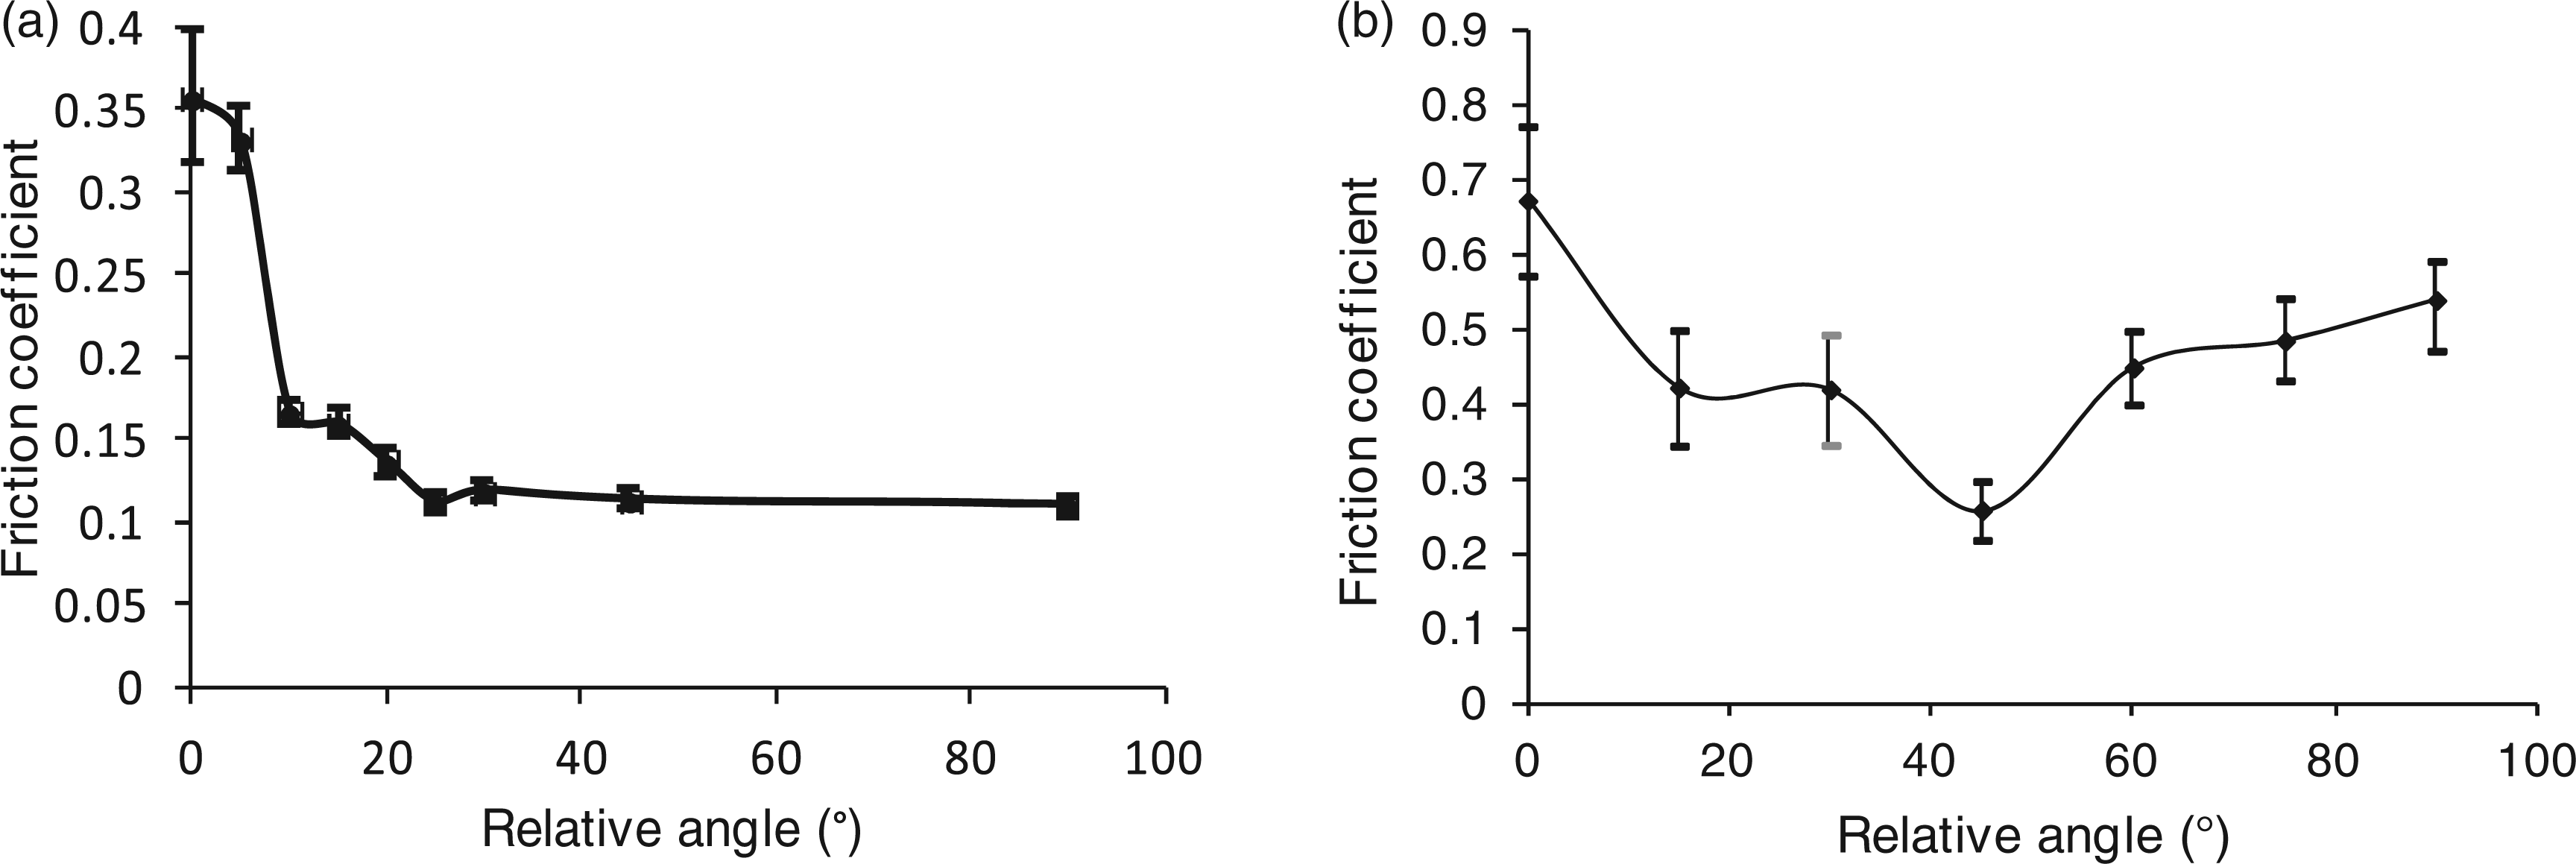
When the angle between yarns increases, a significant decrease of the average coefficient and of the standard deviation is observed. When the yarns are not parallel, contacts between yarns do not appear at the same time everywhere on the sample width. As a consequence, a decrease of the friction load is expected. The theoretical minimum friction coefficient should be observed for yarn angles of about 45°. However, at an angle of 25°, the friction coefficient values remain constant for higher ply/ply angles and an asymptotic value is reached. The achieved value is about one third of the friction coefficient at the reference position 0°/0°.
It is also interesting to notice that although the weft yarns are parallel to the warp yarns when the orientation 0°/90° is considered, the friction coefficient is lower than for the 0°/0° orientation. This result tends to confirm the impact of the weaving parameters. This plain weave fabric is therefore far from being balanced. As it has already been mentioned, warp yarns significantly overhang weft yarns. Thus, warp shocks are more severe than weft shocks. If the fabric was balanced, a symmetrical curve with respect to the 45° ply/ply angle should be observed.
Other patterns
The average friction coefficient and standard deviation are presented on Figure 12(b) for the interlock weave. The influence of the orientation appears clearly. A decrease of the friction coefficient is observed below a ply/ply angle of 45°. The decrease rate occurred with the same proportion as the plain glass fabric (two-thirds). Above 45°angles, the friction coefficient rises. The curve is almost symmetrical relative to the 45° angle. This symmetry is probably due to the fact that the overhanging of the warp yarns is almost the same as the overhanging of the weft yarns. The behavior observed for the interlock is consequently close to that of a balanced fabric.
Conclusion
In relation to the influence of the meso-architecture and the physical phenomena associated with the fabric/fabric friction behavior, sample relative orientation has a significant influence on the friction response. The meso-architecture is responsible for the high variations of the friction coefficient as a function of the ply orientations for different fabrics.
Comparison with yarn/yarn friction
Yarn/yarn average friction coefficient and standard deviation for glass and carbon yarns
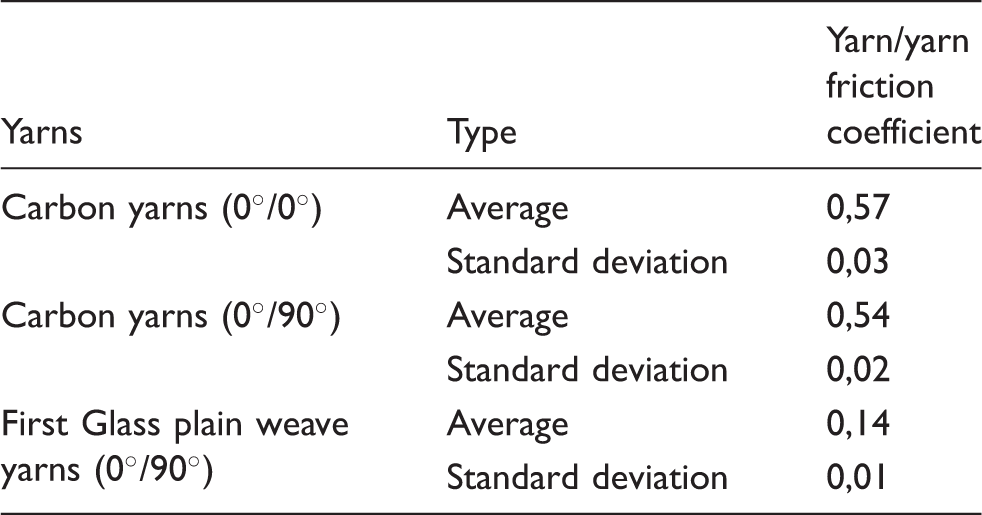
Considering the standard deviation, friction coefficient is not dependent of yarns testing orientation as it is observed for interlock carbon (0°/0° and 0°/90°; Table 1). However, the comparison between the results obtained for carbon interlock and those of the glass plain weave gives an unexpected result (0.54 and 0.14, respectively). Indeed, the yarn/yarn carbon should have had a less important friction coefficient. This is attributed to the resin powdering of the carbon yarns used in the tests, which add an intermediate material between yarns and then interferes with the contact behavior. This phenomenon is also extended to the case of the interlock fabric/fabric friction results. In fact, interlock carbon is the only powdered fabric from those used for this study. Its average fabric/fabric friction coefficient is about 0.57 in the 0°/0° test configuration when its is about 0.28 for the twill weave carbon that has the least important coefficient of all the fabric. There is certainly the structural effect on the global contact behavior but also the effect of the powdering treatment. Further study on this aspect is in progress in our lab.
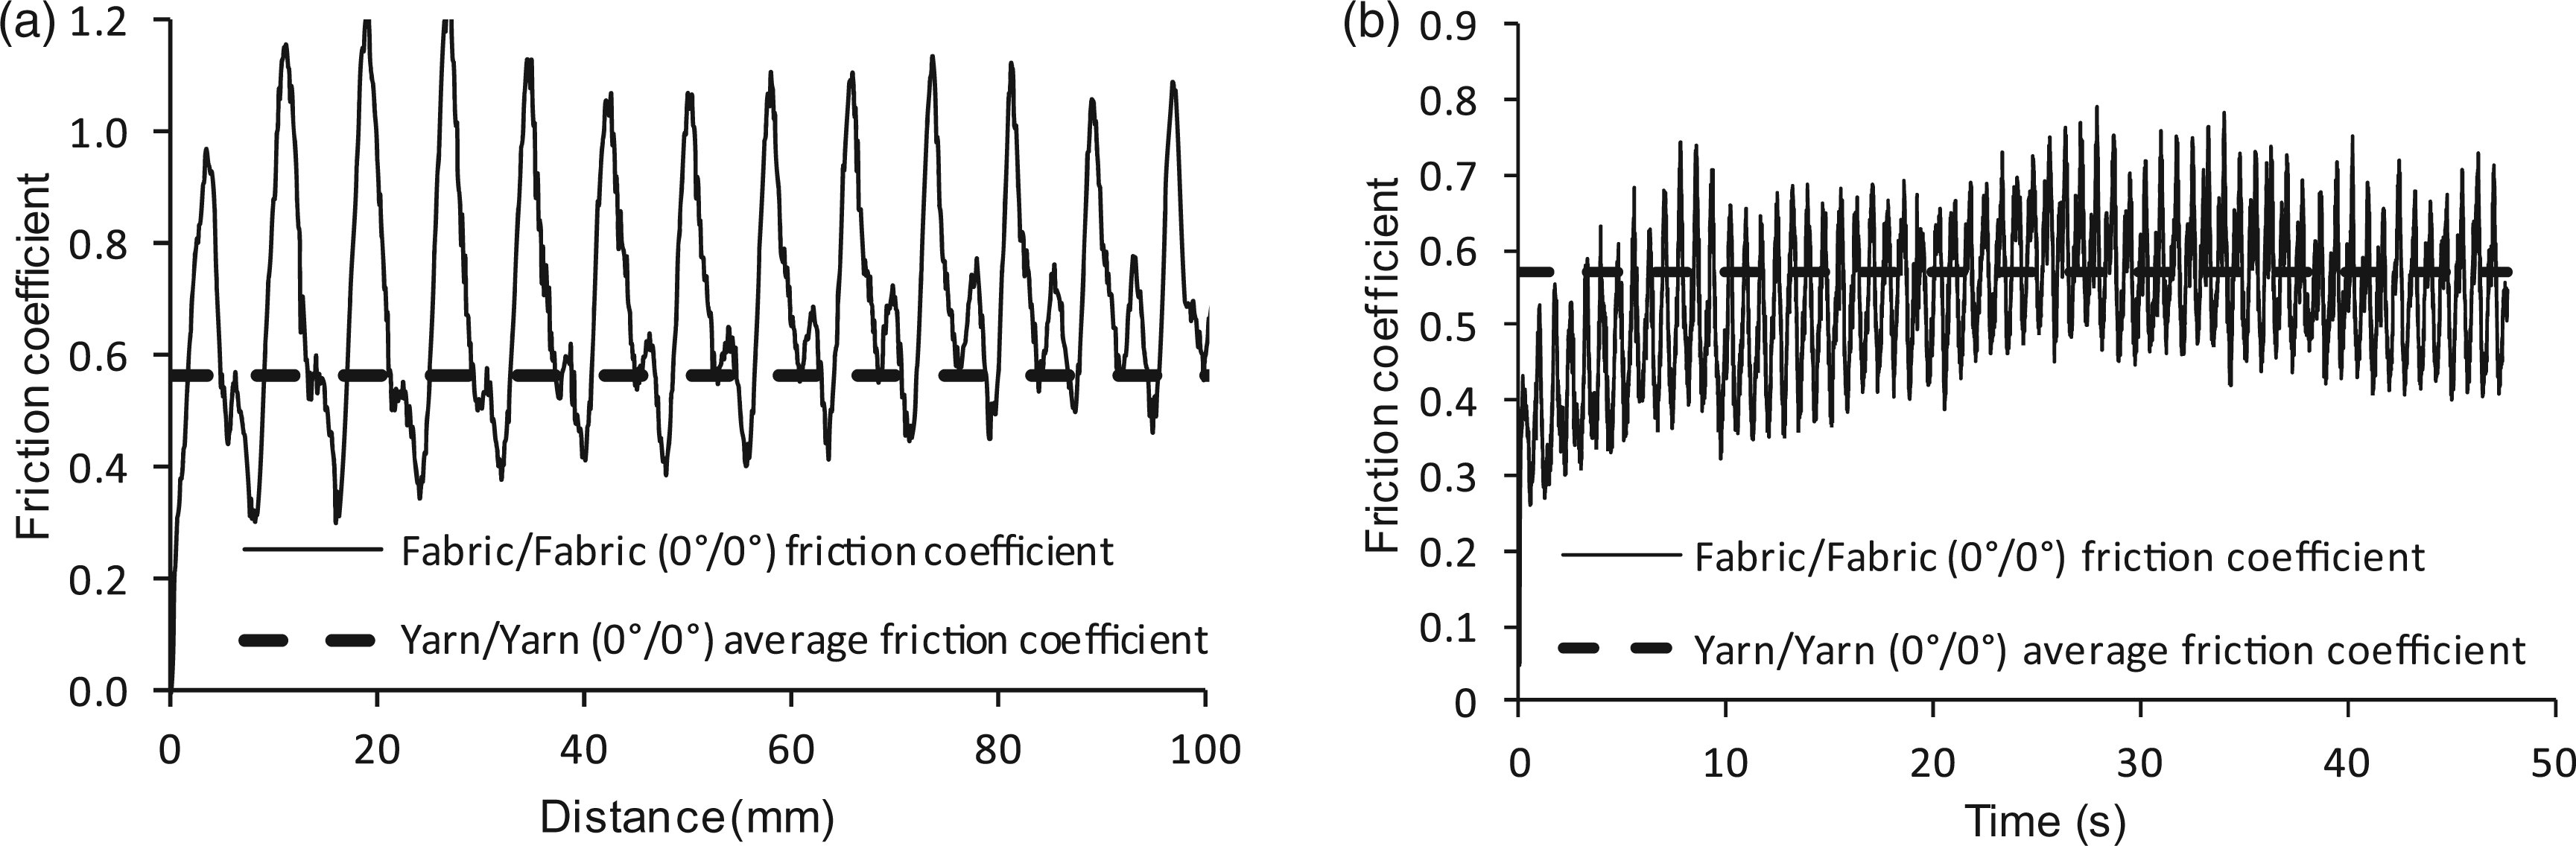
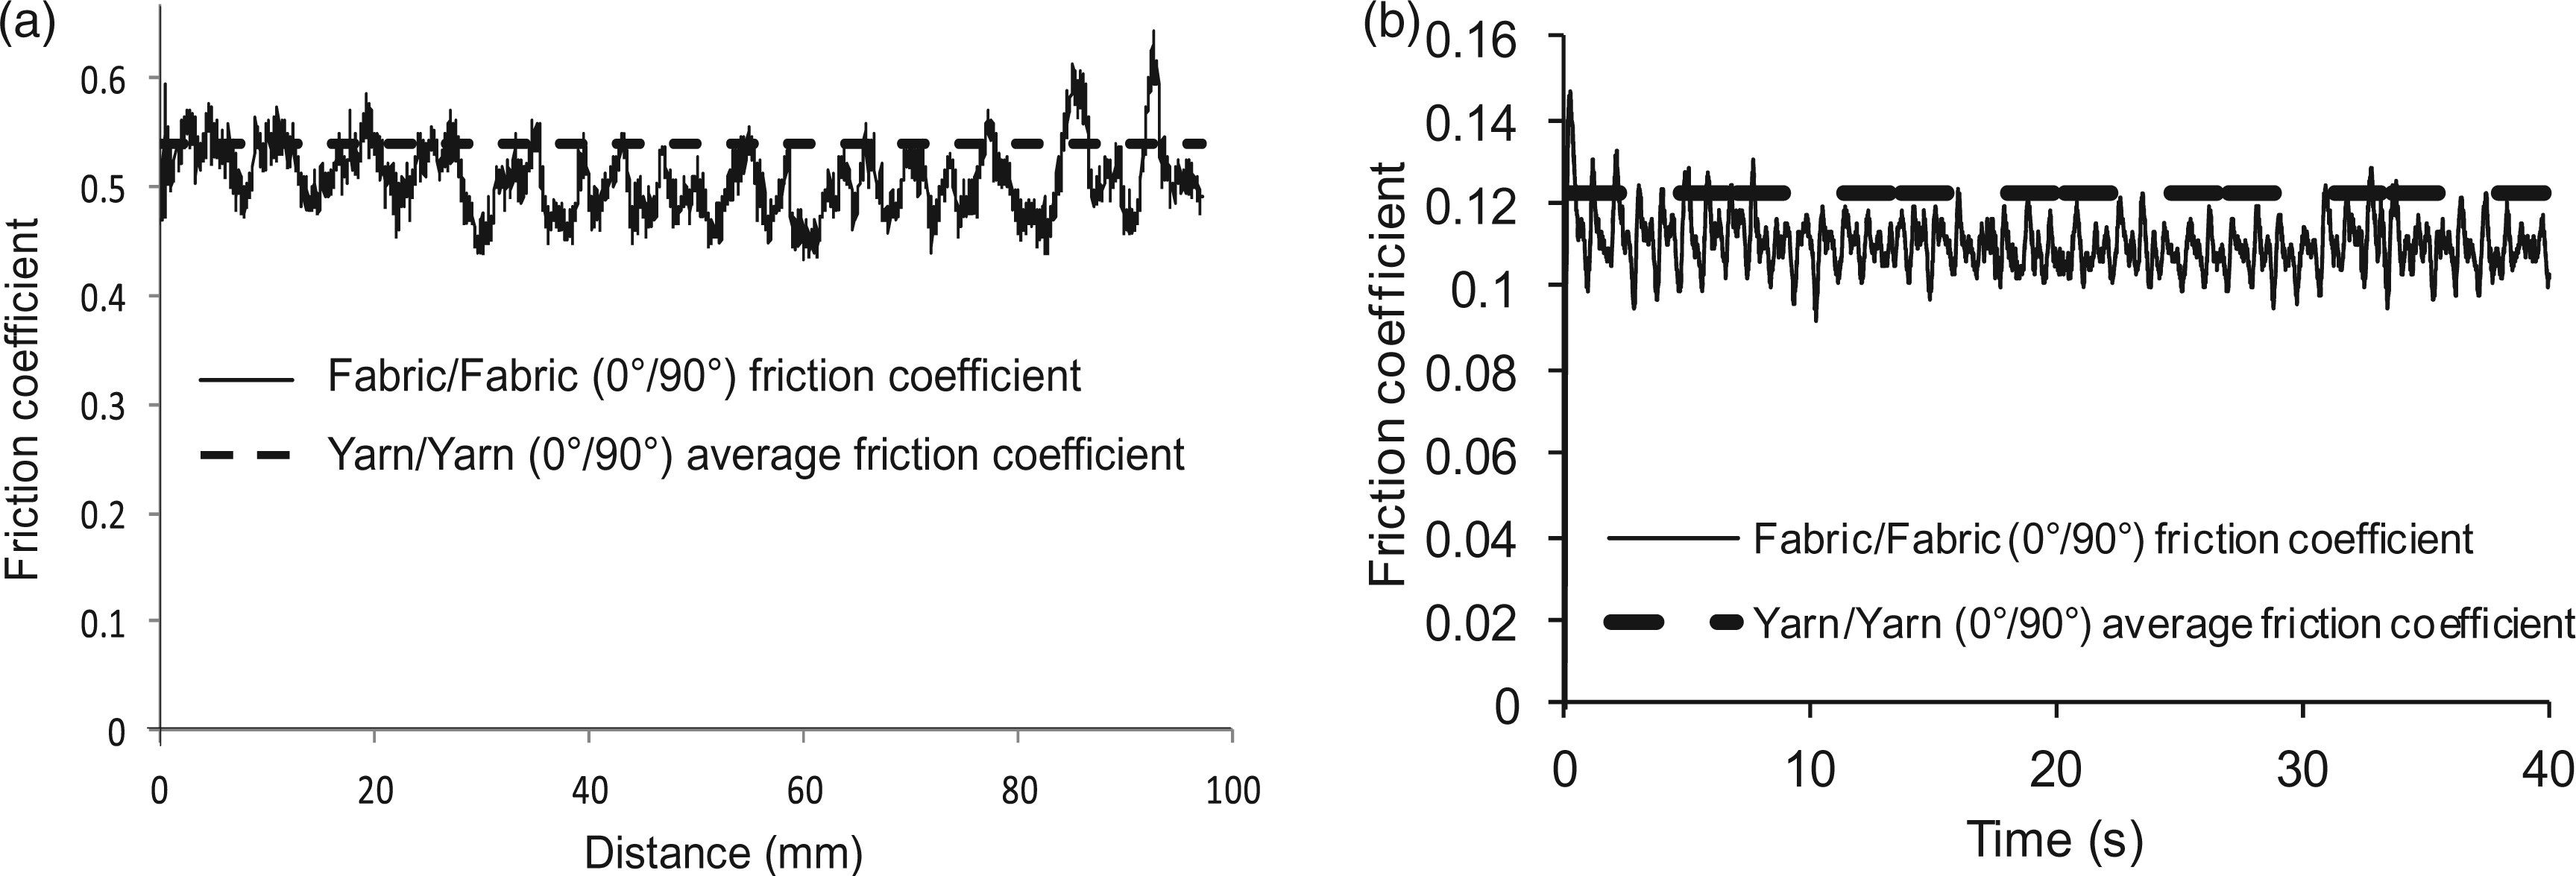
The comparison between yarn/yarn and fabric/fabric friction coefficient gives results that are fully consistent with the theory previously developed. Indeed, shocks between yarns induce a sudden increase of the tangential response (Figure 13). To a lesser degree, the end of the lateral impact between yarns tends to minimize the tangential loads. We could expect yarn/yarn 0°/0° friction coefficient values to be similar to the average value of the fabric/fabric 0°/0° friction coefficient. This comparison is presented in Figure 14. However, yarn/yarn 0°/0° friction coefficient value is lower than the average value of the fabric/fabric 0°/0° friction coefficient, which implies that the increase of the maximum friction values due to the shocks is more important than the minimization taking place at the end of the shocks. Experiments conducted with 0°/90° oriented yarns are not as conclusive as in the 0°/0° case because friction values and variations are lower and then much more supsceptable to discrepancies. Nevertheless, it has to be noticed that the average fabric/fabric friction coefficient is close to the yarn/yarn friction coefficient (Figure 15).
Yarn/yarn 0°/0° friction coefficient results for the interlock fabric. Comparison between yarn/yarn and fabric/fabric friction for the interlock weave with a 0°/0° orientation. (a) Pair of samples 1. (b) Pair of samples 2. Comparison between yarn/yarn and fabric/fabric friction with 0°/90° orientation. (a) Interlock weave. (b) First glass plain weave.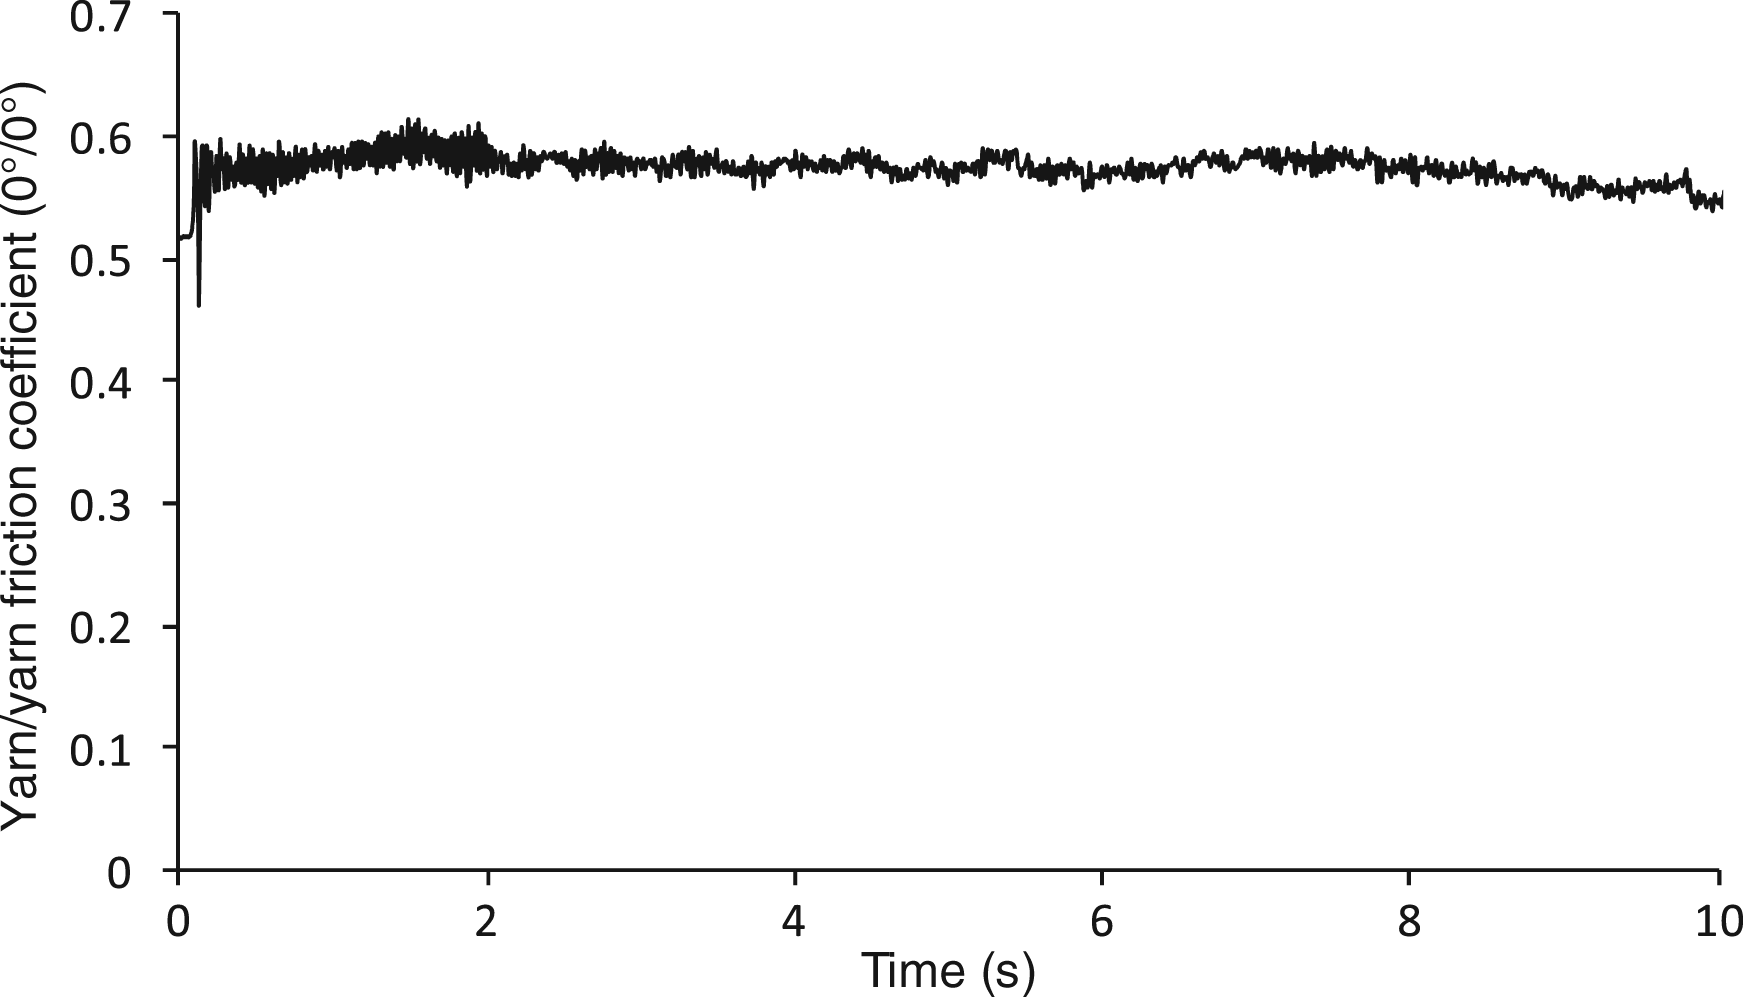
Conclusion
A specific device was previously developed to characterize the contact behavior between two layers of woven fabrics. The knowledge of the contact behavior between layers of woven fabric is of particular importance when multi-ply forming is concerned. The device was shown to be well adapted to investigate fabric/fabric friction. The specific behavior observed in preliminary results is a substantial variation of the contact tangential loads. All the test parameters remaining constant, this can be explained by shocks between overhanging yarns of each sample. The observed behavior correlates with the fabric meso-structure. It has been demonstrated that period of the friction response can be predicted. It is directly related to the length of the unit cell in the tested direction. Parameters influencing the magnitude of these variations were not quantified in this study. Nevertheless, whatever the type of pattern, both the weaving parameters and the yarn thickness and cohesion are of primary importance. The friction response was also observed to be very sensitive to both the relative positioning and orientation of the samples. Moreover, the resin powdering effect on the yarn/yarn and fabric/fabric contact behavior has been identified. Further study on this aspect is in progress.
Variations of the friction load magnitude observed during fabric/fabric friction may be important suggesting that it could be considered when trying to optimize multi-ply forming. The evolution of the relative orientation between yarns of each ply may involve high variations of the tangential friction forces. It can also lead to manufacturing defects such as unweaving or wrinkles. Up to now, finite element codes predicting the forming behavior of woven reinforcement fabrics do not take into account this friction coefficient evolution to model the process accurately. This point could therefore be addressed in future works on this topic with the view to optimize the multi-ply forming of complex-shape composite parts.