
Abstract
This article is concerned with the tensile characteristics of polymers at various strain rates. Tensile characteristics at the high strain rate are important in the prediction of deformation modes of polymeric components which undergo high-speed deformation during car crashes. Uniaxial tensile tests at strain rates ranging from 0.001 to 100 s−1 were conducted using a tensile testing machine (INSTRON 5583) and developed high-speed material testing machine. Since the deformation of polymers is accompanied by localized deformation and a conventional extensometry method is no longer valid for strain measurement, a force equilibrium grid method (FEGM) is newly proposed to acquire accurate true stress–true strain curves of polymers. FEGM is utilized with images of the non-uniform distribution of deformation at each elongation stage captured by a high-speed camera in combination with a grid method. The relation between true stress and true strain at the desired strain rate and increment was determined by collecting the load data from the equilibrium and deformation images.
Keywords
Introduction
Polymers have been widely used in interior parts of automobiles such as dashboards and airbag modules. They also have been utilized in exterior parts such as bumpers. The interior parts of an automobile directly influence the safety of passengers with the fracture of the polymeric components. Therefore, the tensile properties of polymers should be fully understood to predict injury of passengers. The tensile properties of polymers at high strain rates have to be considered in the designing of a vehicle in case the vehicle undergoes high-speed deformation in an event such as a collision. The tensile properties of polymers at intermediate strain rates are particularly important because the range of the strain rate is several tens to hundreds per second in a real auto-body crash.
The static tensile properties of polymers are well established by a standard tensile testing method using a standard specimen. However, it is difficult to obtain tensile properties of polymers at high-speed deformation influenced by the strain rate because testing methods and conditions are complicated and are not specified in the standard yet. Engineering stress–engineering strain curves are acquired by uniaxial tensile tests at the quasi-static and intermediate strain rates. True stress–true strain curves converted from engineering stress–engineering strain curves are required for finite element crash analysis of those polymers. In metallic materials, the gage section deforms uniformly until necking takes place during uniaxial tensile tests with slight deviation of strain when an appropriate specimen is used. A conventional extensometry method (CEM), therefore, has been used to acquire a load–displacement curve for true stress–true strain curve of the selective region before the necking. However, in polymeric materials, the deformation is nonuniformly concentrated due to localized deformation in the gage section right after the loading even before the necking. It is due to cross-linking or chain-branching molecular structures of polymers. Therefore, a new conversion method is required to acquire accurate true stress–true strain curves of polymers.
The effect of the strain rate on the mechanical properties of polymers has been widely investigated. Kolsky 1 introduced an experimental method which uses a split Hopkinson pressure bar to examine material properties at high strain rates. He investigated strain rate sensitivities for many materials, including polythene, rubber, polymethyl-methacrylate, copper, and lead. Since then, the strain rate sensitivities of various polymers have been extensively studied. 2 Wally et al. 3 studied the deformation behavior of various polymers over three strain rates, 0.01, 1000, and 10,000 s−1. Peterson et al. 4 investigated the mechanical response of glass fiber reinforced thermoplastic at static and high strain rates. Arruda et al. 5 reported that the flow stress increased as the strain rate increased in their study, and this hypothesis was verified by further studies. Mayr et al. 6 reported the effect of the strain rate and composition on epoxy thermosets. Kim 7 studied the strain rate sensitivity of polypropylene as a core material used in the sandwich sheet. Tsai et al.8,9 also investigated the strain rate effect on the mechanical behavior of nylon 6-clay nanocomposites with a split Hopkinson pressure bar. McKown et al. 10 examined the effect of the strain rate on self-reinforced polypropylene composites with a servo-hydraulic test machine. Song et al. 11 investigated the mechanical response of an alumina-filled epoxy at various strain rates ranging from 9.4 × 10⁻⁴ to 1.35 × 10³ s−1. It has been clearly verified that the material properties of polymers are influenced by the strain rate.
The CEM is adopted to acquire a load–displacement curve for true stress–true strain curve of common steels assuming that steels undergo uniform deformation before the necking in the gage section during uniaxial tensile tests.12,13 On the other hand, the CEM is no longer valid for some polymers since the polymers undergo localized deformation by unbinding their molecular structures during the uniaxial tensile test. To overcome this problem, many researchers proposed good estimations by thorough observation of deformation behavior. Marquez-Lucero et al. 14 observed a propagation of the necking for round and flat specimens at room temperature and several strain rates. G'Sell et al.15–17 observed evolution of the volumetric strain and obtained stress–strain behavior by using a video-controlled testing system. Parsons et al. 18 suggested a new method to measure strains along the all three axes simultaneously during a uniaxial tensile test. Kim et al.19,20 proposed an approach to obtain a true stress–true strain curve from an engineering stress–engineering strain curve with an optimization scheme to reduce deviation between experimental and numerical results.
In this study, uniaxial tensile tests at the quasi-static and intermediate strain rates were conducted to acquire the tensile properties of auto-body polymers with various strain rates. There are many different kinds of polymers, and their material properties vary accordingly. Hence, the deformation behavior of each kind of polymer should be separately analyzed in order to acquire accurate true stress–true strain curves. A force equilibrium grid method (FEGM) is newly proposed to analyze deformation behavior accurately at various strain rates to acquire accurate true stress–true strain curves. We obtain the flow stresses grid-wise using the equilibrium of each grid under the tensile force applied. The accuracy of the proposed method was evaluated by finite element analysis which simulated uniaxial tensile tests of specimens at intermediate strain rates using the acquired tensile properties of polymers.
Uniaxial tensile tests of polymers
Experimental conditions
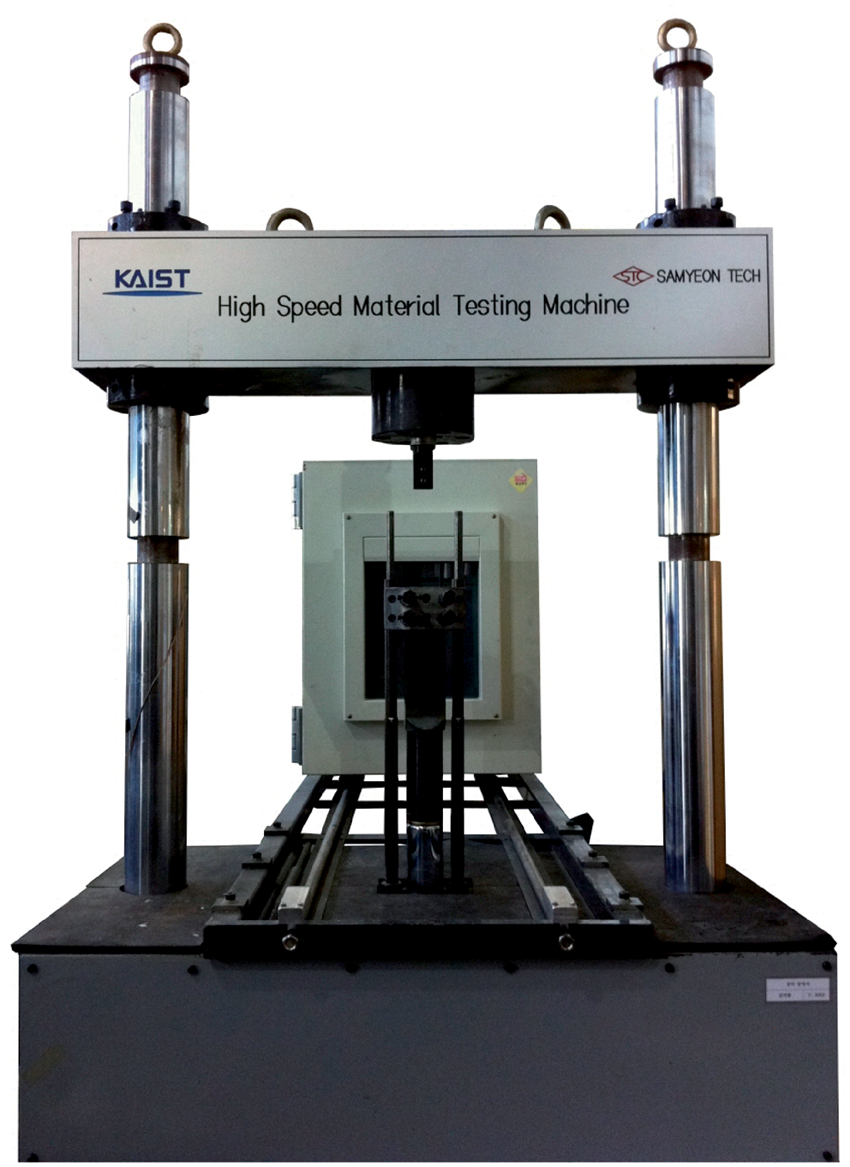
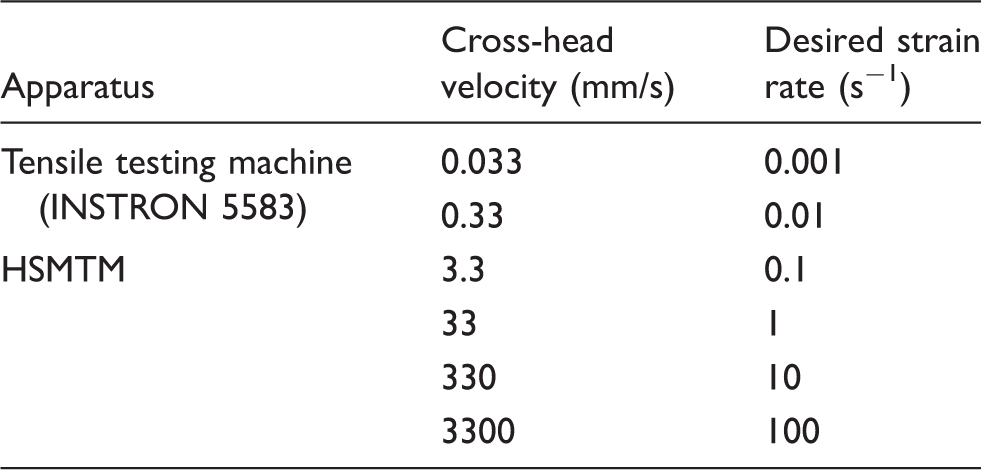
Tensile specimens for the standard test are specified in the regulation of ASTM IV as shown in Figure 1. However, this regulation is valid only for the quasi-static test and does not include the high-speed tensile testing method and the corresponding specimens. A modified ASTM IV standard specimen with an extended grip section was used for uniaxial tensile tests at intermediate strain rates to realize the desired tensile velocity. The gage section is 33 mm long, 6 mm wide, and 2 mm thick. Grids were marked with an interval of 1 mm by a method of silk screen in order to observe the nonuniform localized deformation behavior and measure instantaneous displacements conveniently. A tensile test specimen with grid marks is shown in Figure 2. The materials used in the uniaxial tensile tests were acrylonitrile butadiene styrene (ABS) and polypropylene (PP). The uniaxial tensile tests at the quasi-static strain rate were conducted at strain rates ranging from 0.001 to 0.01 s−1 using a tensile testing machine (INSTRON 5583). Uniaxial tensile tests at intermediate strain rates were conducted at strain rates ranging from 0.1 to 100 s−1 using a servo-hydraulic type high-speed material testing machine (HSMTM) developed as shown in Figure 3. A maximum speed of the moving cylinder is 7800 mm/s and a maximum allowable load is 30 kN. The tensile load is acquired from a piezoelectric-type load cell, Kistler 9051 A, and the displacement is measured from a linear displacement transducer (LDT) from SENTECH and a high-speed camera, PHOTRON FASTCAM SA4. Two electric compressors are used to compress the operating hydraulic oil up to the pressure of 300 bars and two accumulators with the capacity of 5 L are used to make the response time faster. The servo-hydraulic valve, MOOG D792, has a maximum flow rate of 240 L/min. The experimental conditions are tabulated in Table 1.
ASTM IV standard specimen. Tensile test specimen with grid marks. High-speed material testing machine at KAIST. Experimental conditions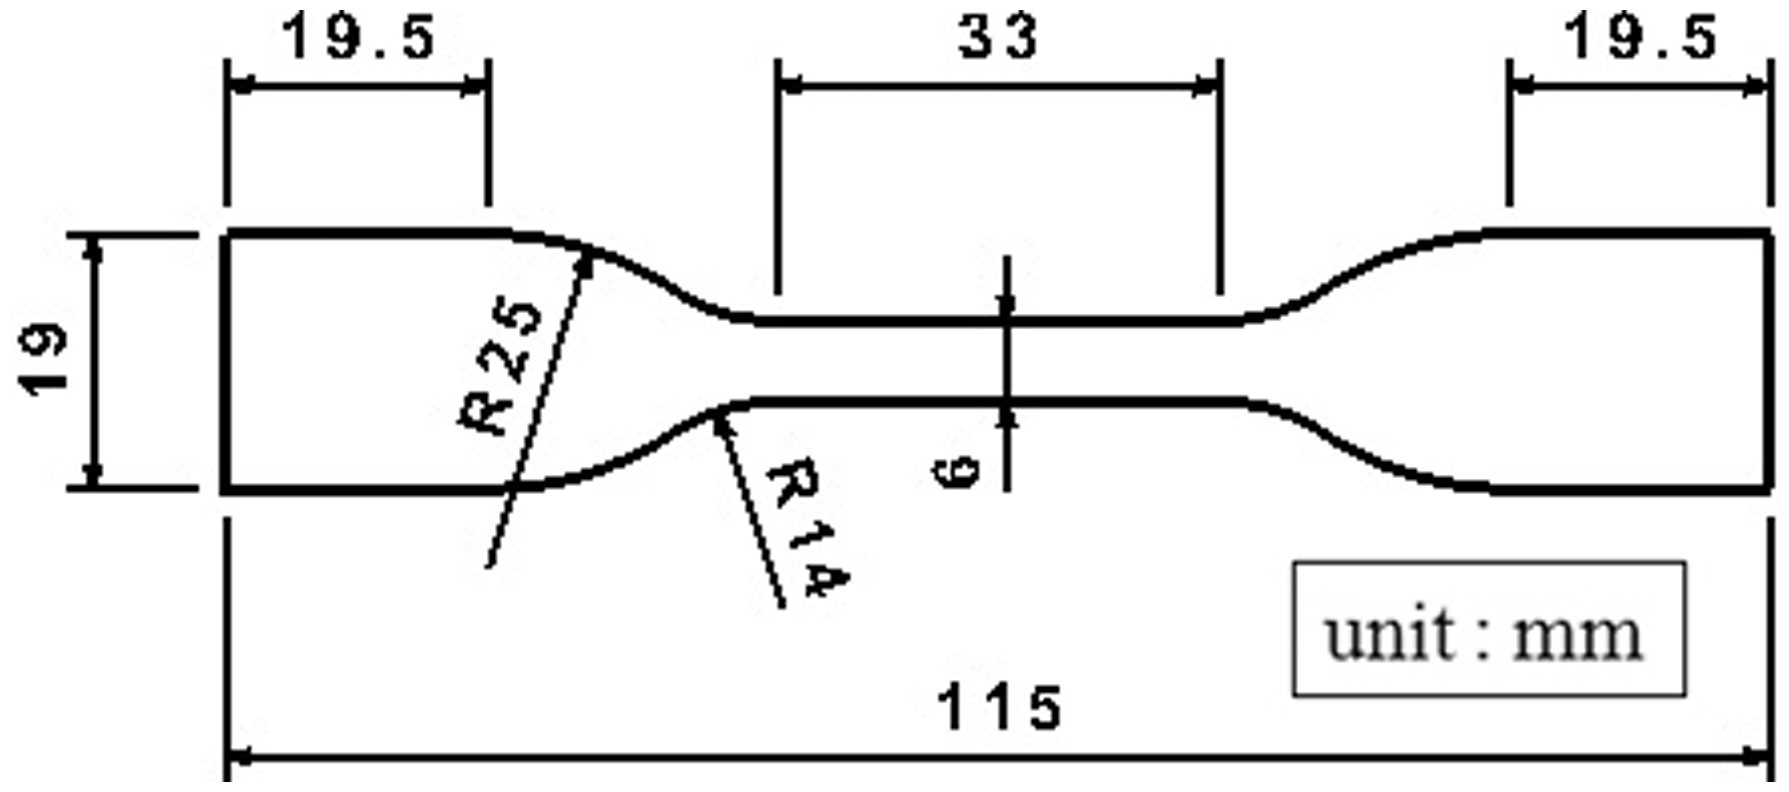

Experimental results
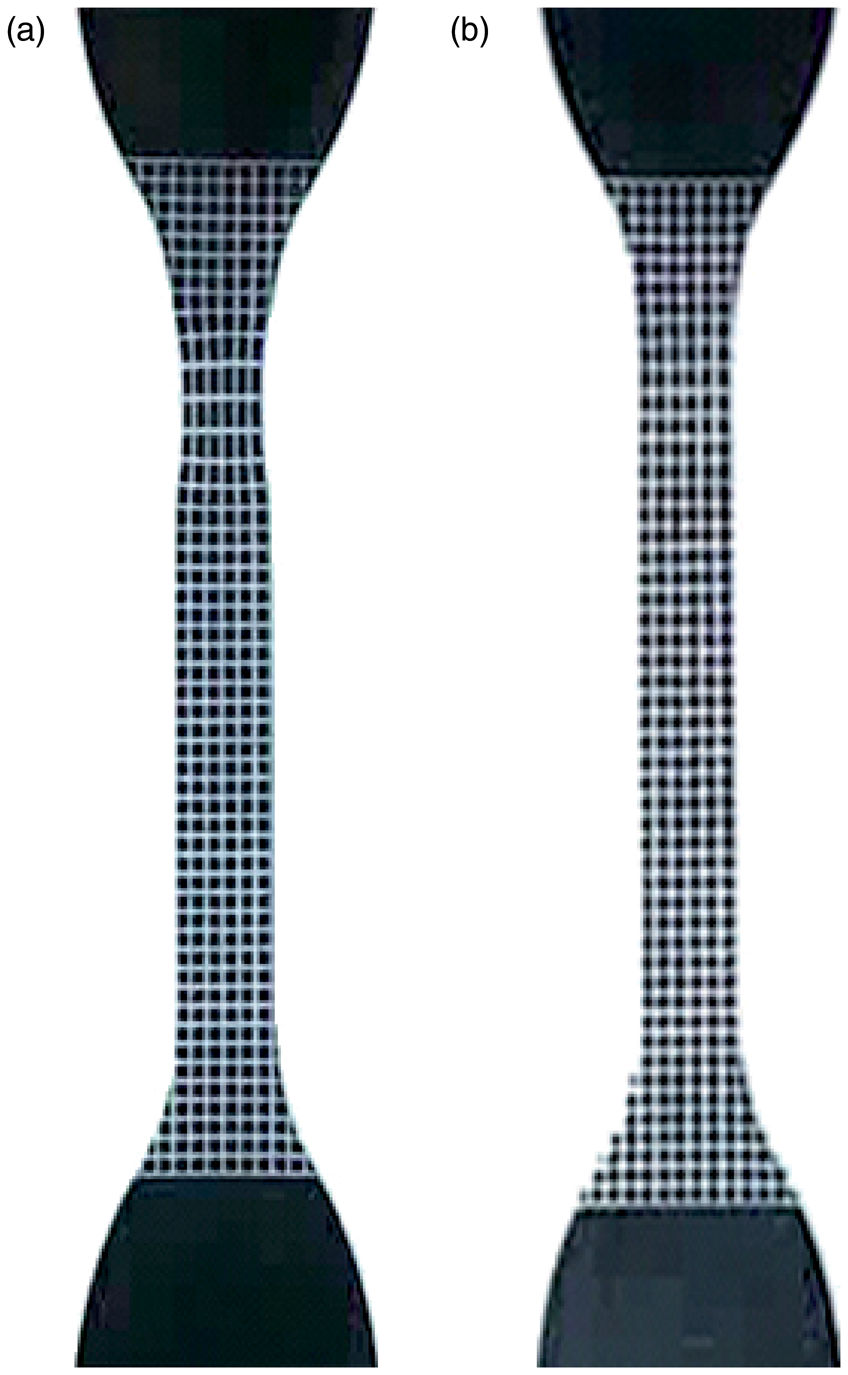
The engineering stress–engineering strain curves acquired from uniaxial tensile tests at the quasi-static and intermediate strain rates are shown in Figure 4. These results accord with previous research works of Kim et al.19,20 for PP. In their researches, the researchers proposed an approach to obtain a true stress–true strain curve from an engineering stress–engineering strain curve with an optimization scheme in order to reduce deviation between experimental and numerical results and describe the true stress–true strain curves of PP accurately. The results show that the flow stress increases as the strain rate increases in both polymers. However, the tendencies of the engineering stress–engineering strain curves for the two polymers differ because they show different deformation behavior. Figure 5 shows the deformed shapes of two polymer specimens during uniaxial tensile tests at the quasi-static strain rate of 0.001 s−1 and the stroke of 6.0 mm. While PP shows relatively uniform deformation, ABS has severe localization of deformation at a small region in the gage section. The difference of deformation behaviors comes from the difference of compositions and molecular structures between PP and ABS. ABS consists of styrene and acrylonitrile in the polybutadiene matrix and has a long chain of polybutadiene criss-crossed with shorter chains of polystyrene-co-acrylonitrile. It is observed that the deformation behaviors depend on the compositions and the molecular structures of polymers since the deformation behaviors are different among several kinds of polymers even with the identical specimen dimensions. Therefore, a new conversion method should be adopted which considers the variation of deformation behavior in order to obtain accurate true stress–true strain curves.
Engineering stress–engineering strain curves with the variation of the desired strain rate: (a) ABS and (b) PP. Deformed shapes of polymers during uniaxial tensile tests at the strain rate of 0.001 s−1 and the stroke of 6.0 mm: (a) ABS and (b) PP.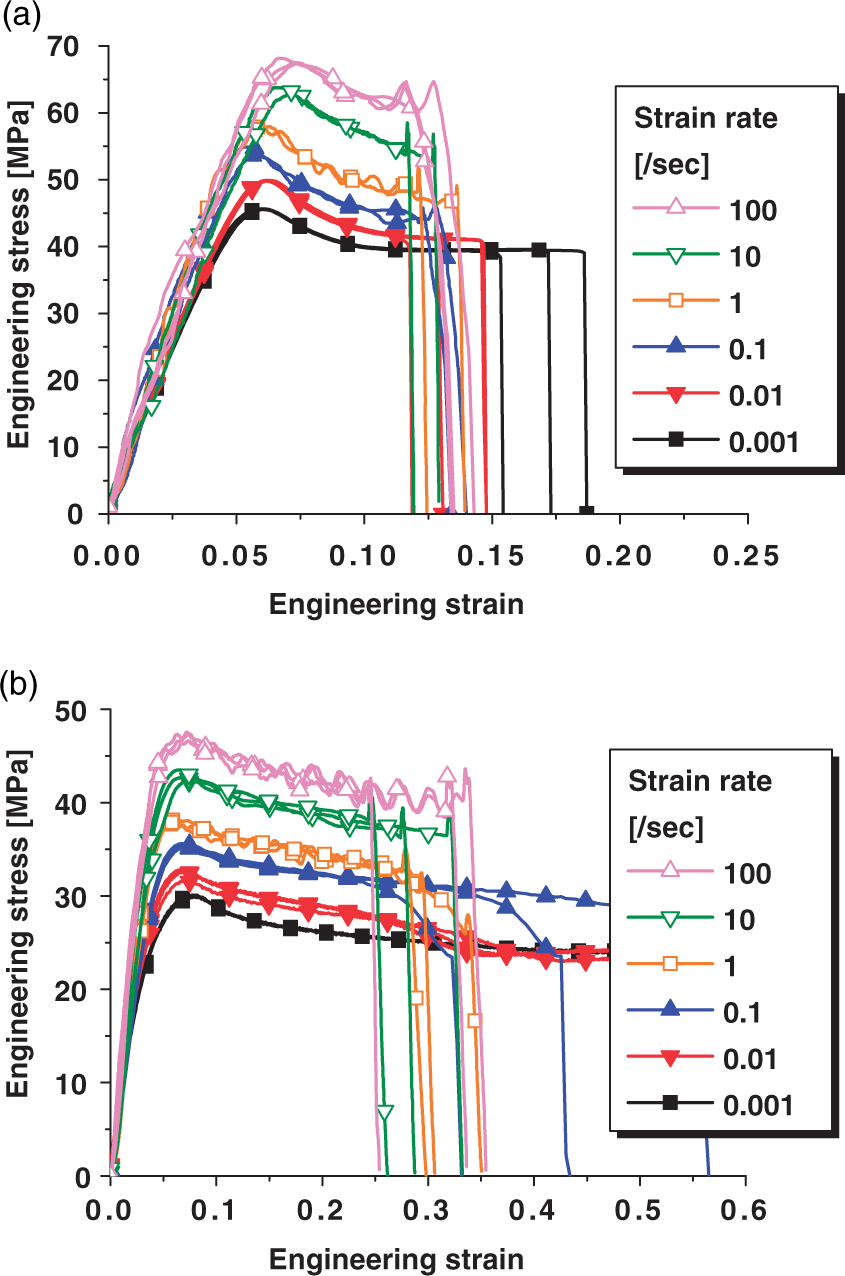
Sequential deformed shapes of two polymer specimens during uniaxial tensile tests at the strain rate of 100 s−1 are represented in Figure 6. It demonstrates that deformation is localized only in a small region of the whole gage section. The elongation tends to be localized right after the onset of yield causing inhomogeneous deformation and the necking takes place at a small amount of elongation. The strain level at the localized region should be larger than that obtained with the average sense and the cross-sectional area at the necking region should be smaller than that obtained with the average sense. A reliable process to convert engineering stress–engineering strain curves to true stress–true strain curves is required for accurate structural analysis at high strain rates. The CEM, which is usually applied to general metallic materials, is valid when the specimen deforms uniformly in the whole gage section. However, the deformation of polymers is localized in a small portion of the gage section as shown in Figures 5 and 6, and the CEM is not applicable to measure the elongation corresponding to flow stress. To accurately measure strain, localized deformation in a small portion of the gage section has to be carefully evaluated with the corresponding flow stress. A new analysis method has to be developed to convert engineering stress–engineering strain curves to true stress–true strain curves.
Sequential deformed shapes of polymers during uniaxial tensile tests at the strain rate of 100 s−1: (a) ABS and (b) PP.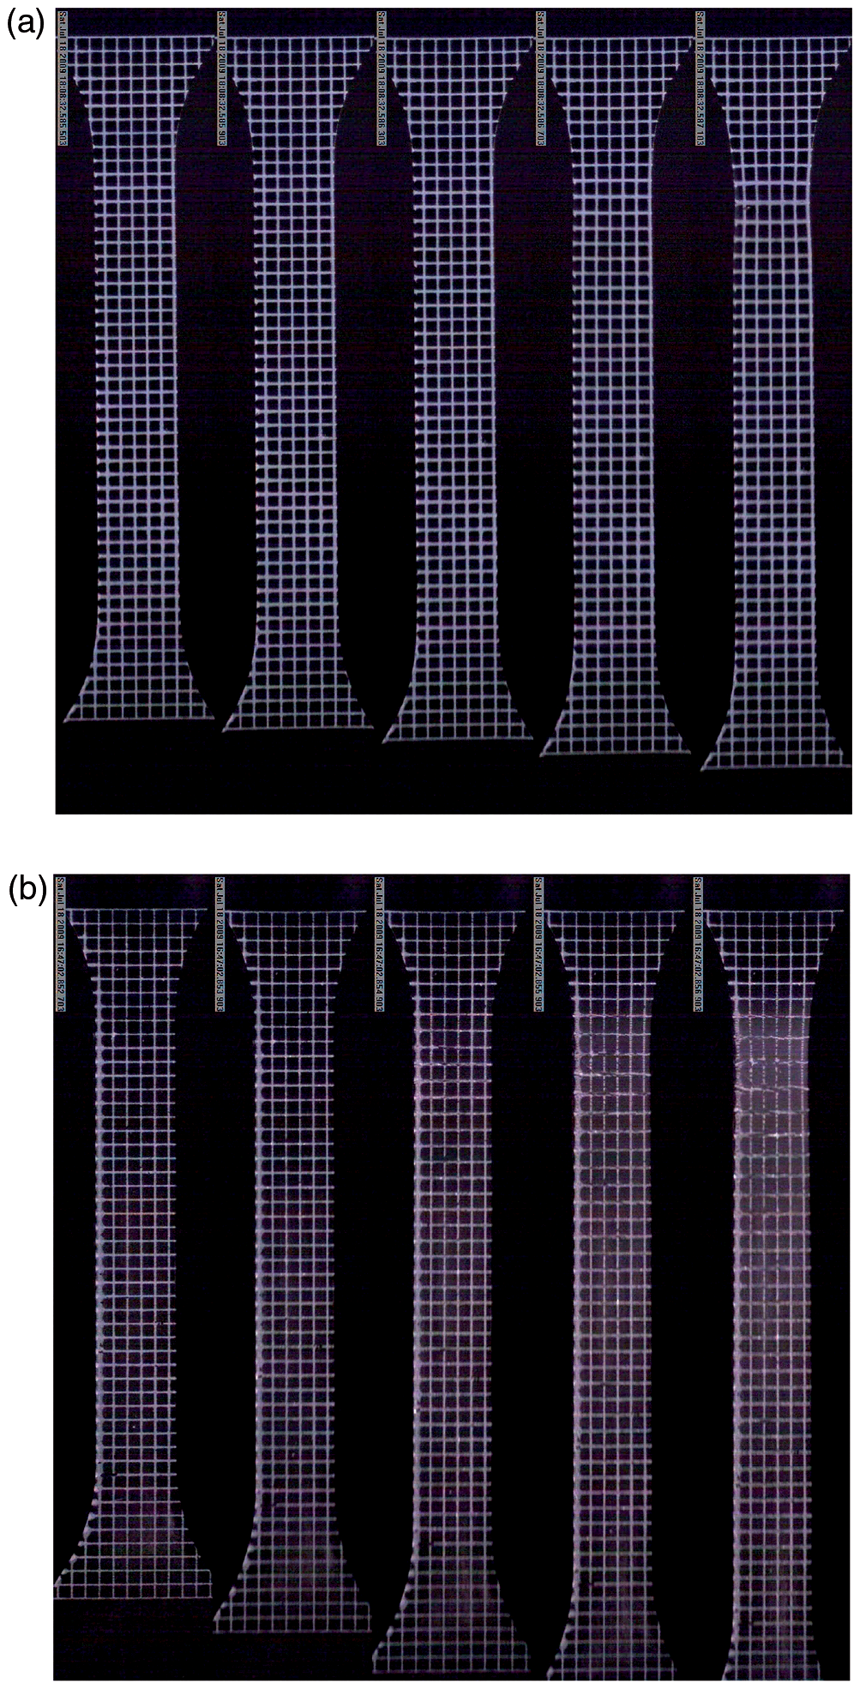
Force equilibrium grid method
Basic concept of FEGM
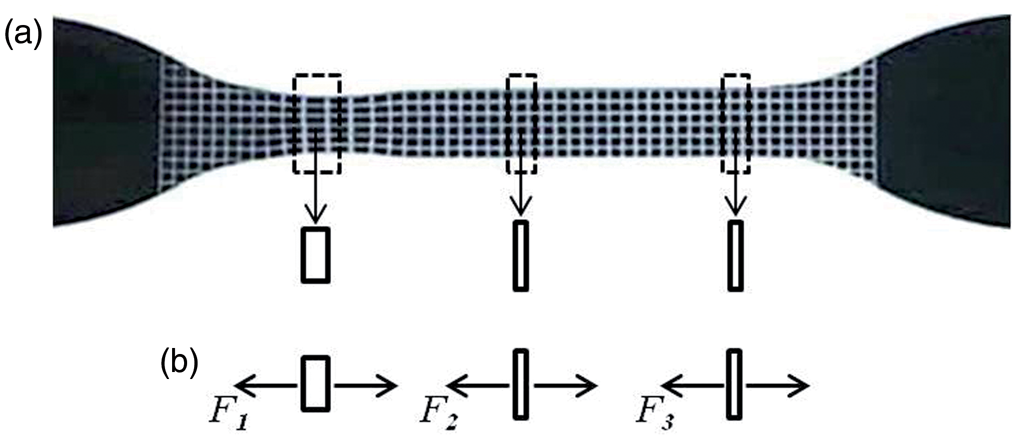
An FEGM is proposed to correctly convert engineering stress–engineering strain curves to true stress–true strain curves. Figure 7 demonstrates the deformation behavior of a polymer specimen during a uniaxial tensile test. To calculate a correct flow stress at each deformation stage, the concept of force equilibrium is utilized in each grid system. A free-body diagram of three grid elements marked in Figure 7(a) shows that the applied forces of each grid element, F1, F2, and F3, are equal along the axial direction when the inertia effect is negligible. The deformed specimen shows that there is no inertia effect because the localized deformation occurs at the other end of the loading. From the force equilibrium condition, the relation among these forces is expressed as
(a) Deformed shapes of three grid elements during a uniaxial tensile test and (b) a free-body diagram of three grid elements.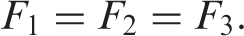
Using this basic concept, the true stress can be obtained from applied forces, and the true strain can be obtained by measuring the amount of deformation of a grid at each time increment of a uniaxial tensile test. This new conversion method can measure the true strain and calculate the true stress from images captured by a high-speed camera and force data obtained during a uniaxial tensile test. Note that this method requires tensile testing of several specimens at different strain rates for a true stress–true strain curve at the desired strain rate because the strain rate is different from point to point within the gage section due to non-uniform deformation.
FEGM is a kind of digital image correlation (DIC). While general DIC is good for measurement of full-field deformation, it needs post-processing step to convert the experimental results into a form of true stress–true strain curves. FEGM is a specialized method for polymeric materials which exhibit various deformation behaviors in order to acquire the material properties of polymers in a form of true stress–true strain curves and their relation from the uniaxial tensile tests. It provides a consistent measuring reference in order to obtain generalized strain from the displacement with respect to the equal length in the undeformed state. It can also calculate the true stress, the true strain and the actual strain rate conveniently with measuring width and length of single grid elements.
Relation between true stress and true strain
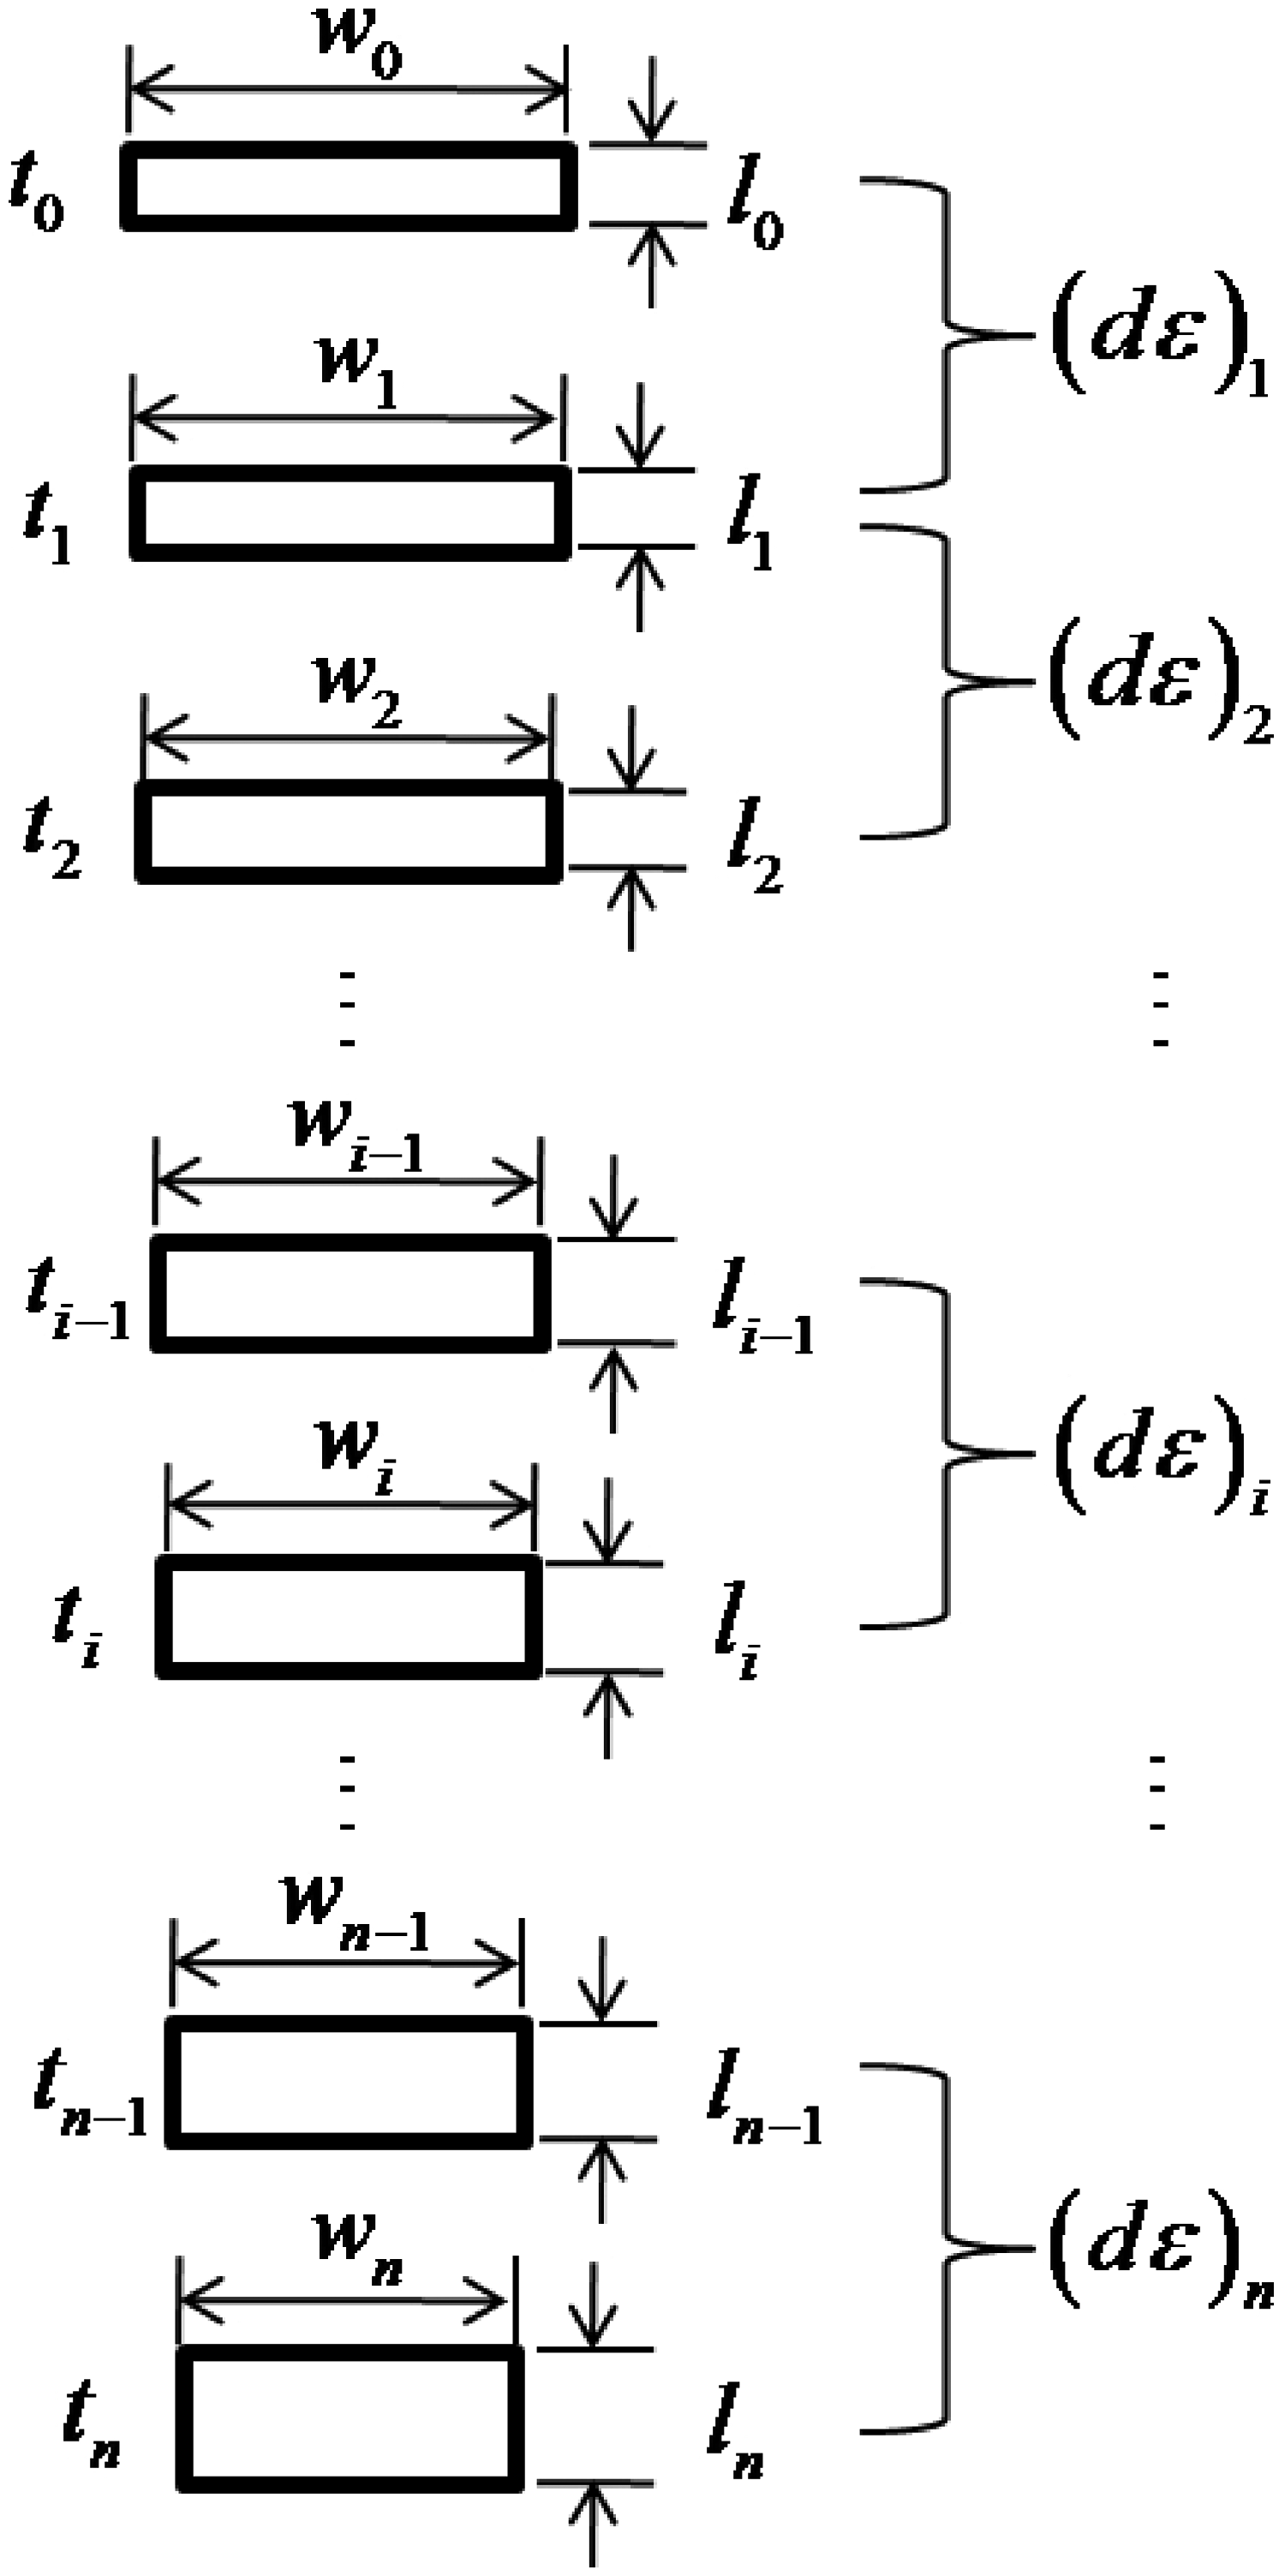
Deformation images obtained by a high-speed camera during a uniaxial tensile test were analyzed to determine the relation between true stress and true strain at each grid element for the specific strain and strain rate. A sequence of deformation of a single grid element is shown in Figure 8 where w, t, and l stand for width, thickness, and length of the single grid element, respectively. The first one is the initial shape of the single grid element, and the second one is the deformed shape after a time increment. Comparing the two grid elements, the strain and the strain rate can be calculated simultaneously. This process is carried out at each time increment as shown for the i-th step until the last n-th time increment. The true strain increment of a single grid element along the axial direction after a constant time increment, dt, can be expressed as
Sequence of deformation of a single grid element.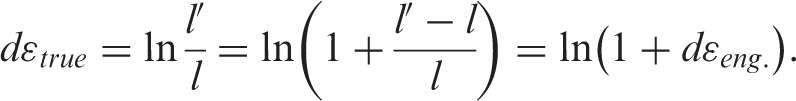
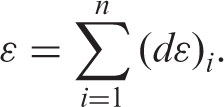
The true strain is calculated from the summation of the true strain increment as
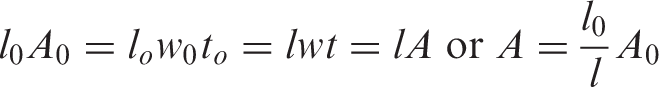
Assuming the incompressible condition of a material, the cross-sectional area can be obtained from the length of the element using the following formula:
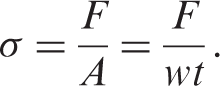
Finally, the true stress can be calculated using the load data at the instant and the cross-sectional area as
In this way, the relation between true stress and true strain at each deformation increment is obtained for designated grid elements in the gage section. To collect different data for true stress–true strain, six elements from three regions which show remarkably different deformation behavior were chosen as shown in Figure 9. Obviously, the true stress–true strain data obtained from the three regions are different from each other in terms of stress, strain, and strain rate.
Three regions that show different deformation behavior.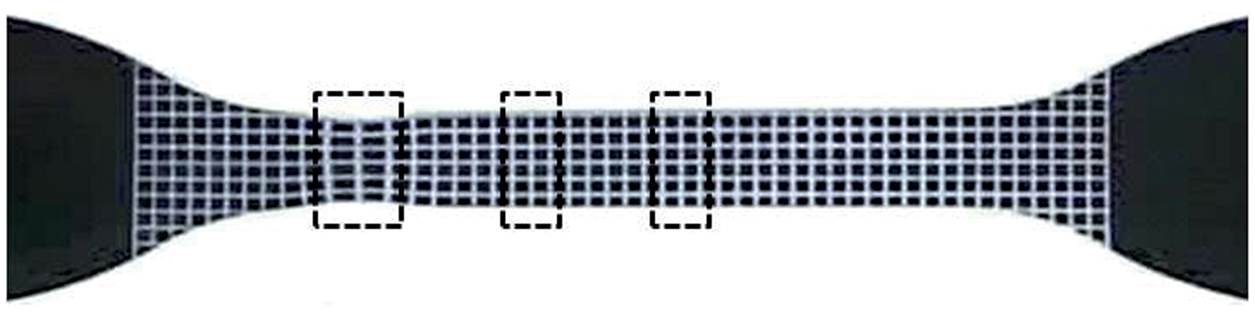
Investigation of actual strain rates
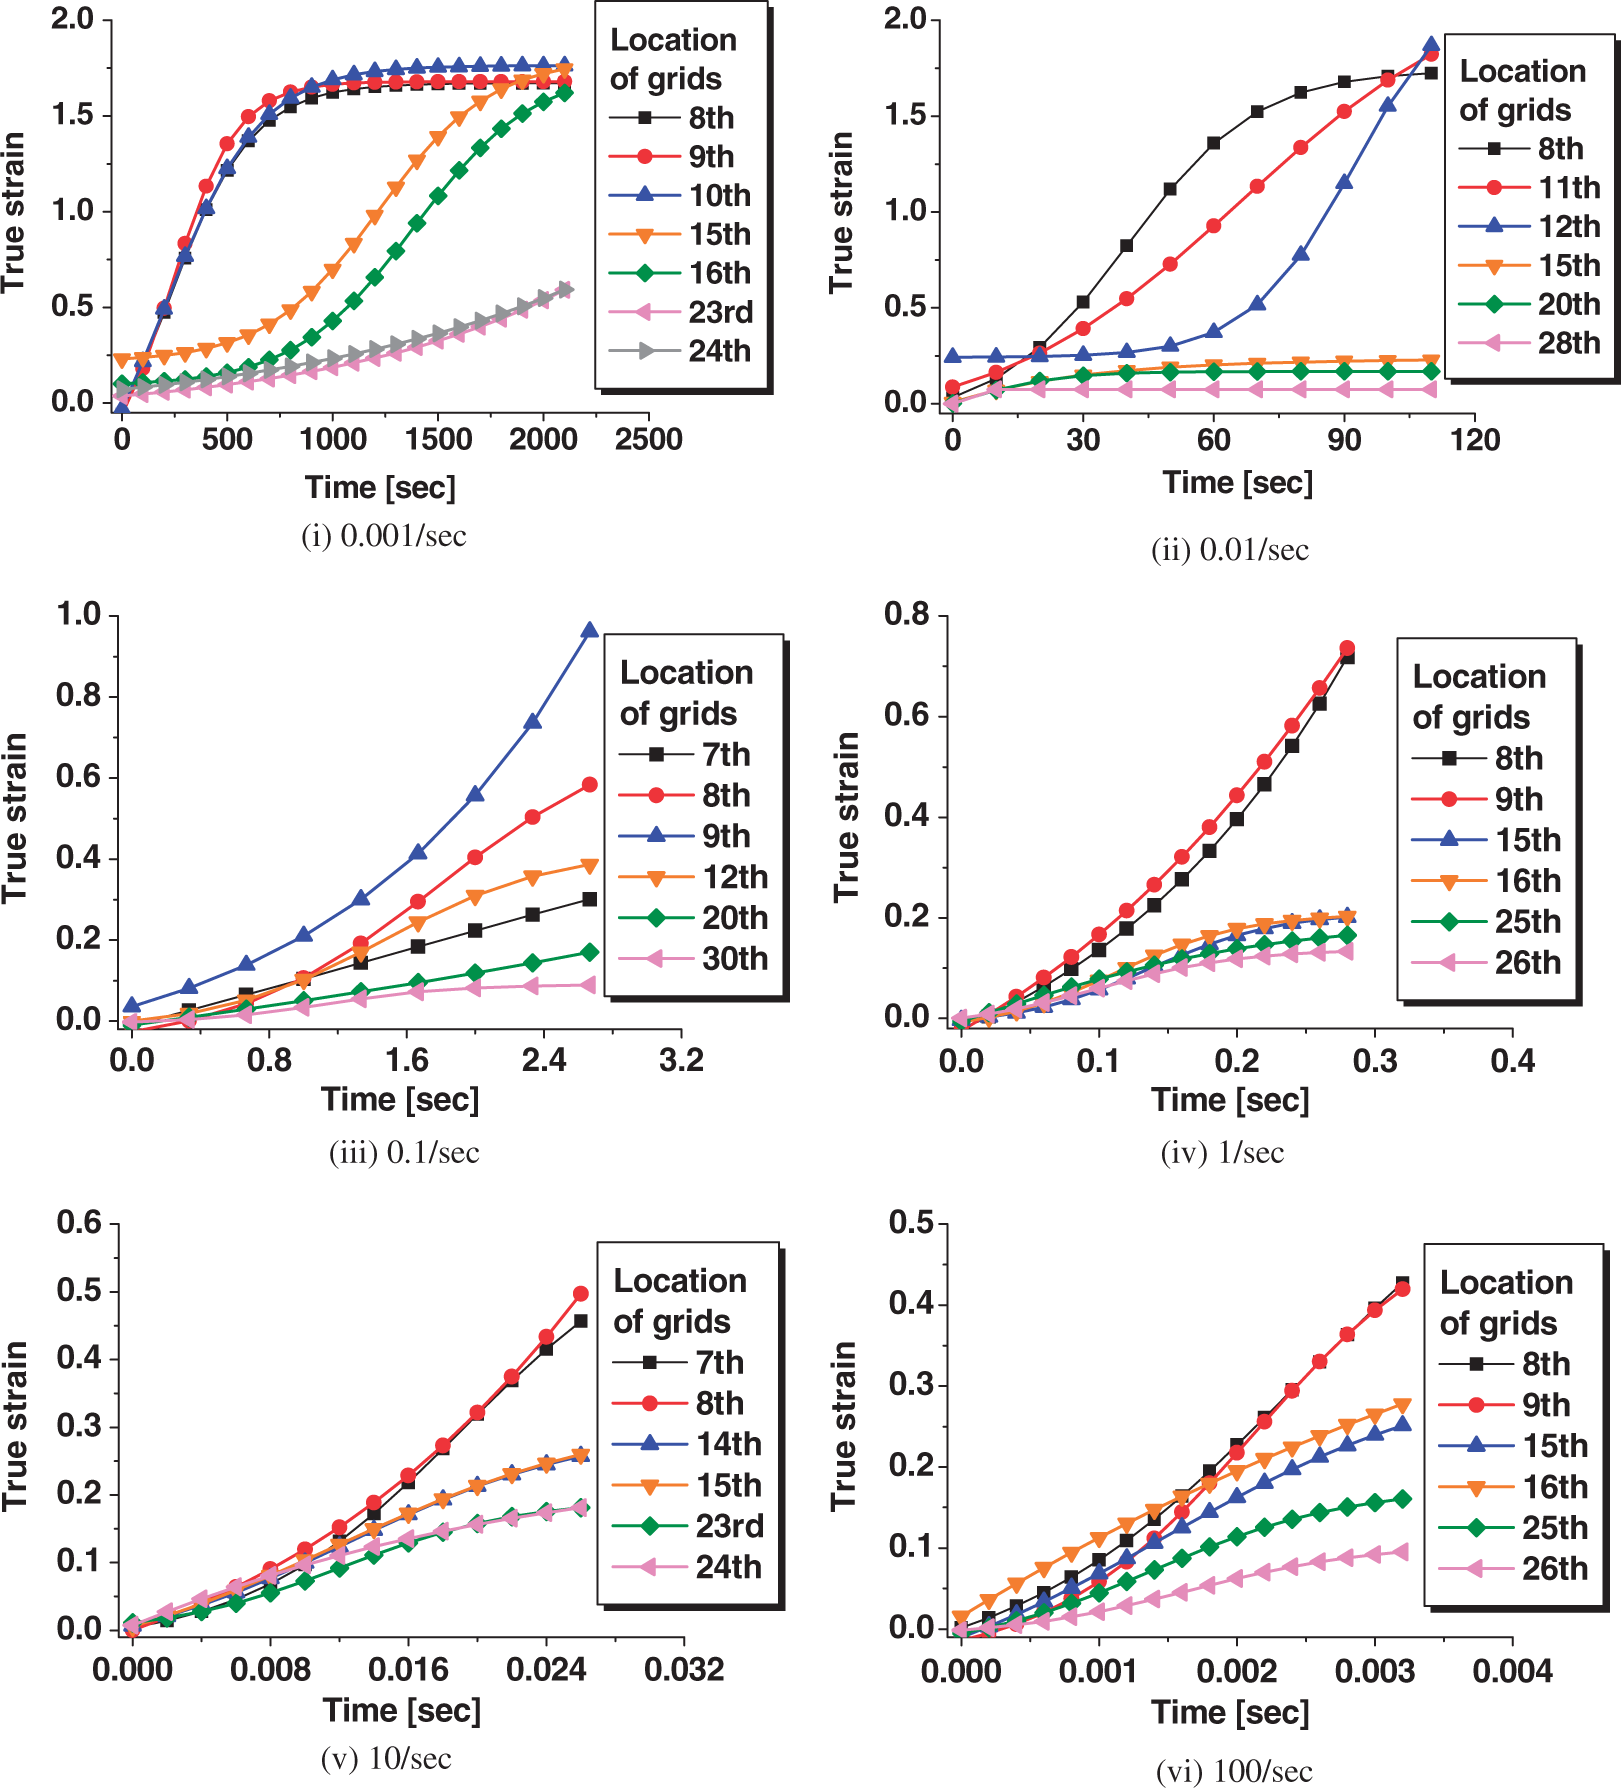
The true strain is measured with respect to time as shown in Figures 10 and 11. The true strain varies in accordance with deformation behavior of each point in a specimen. Even in the same grid element, the true strain varies with respect to time. Since the strain rate of grid elements does not correspond to the desired strain rate of uniaxial tensile tests, a process of calculating the actual strain rate is required through observation of the deformation behavior of grid elements.
Variation of the true strain with respect to time at various desired strain rates for ABS. Variation of the true strain with respect to time at various desired strain rates for PP.
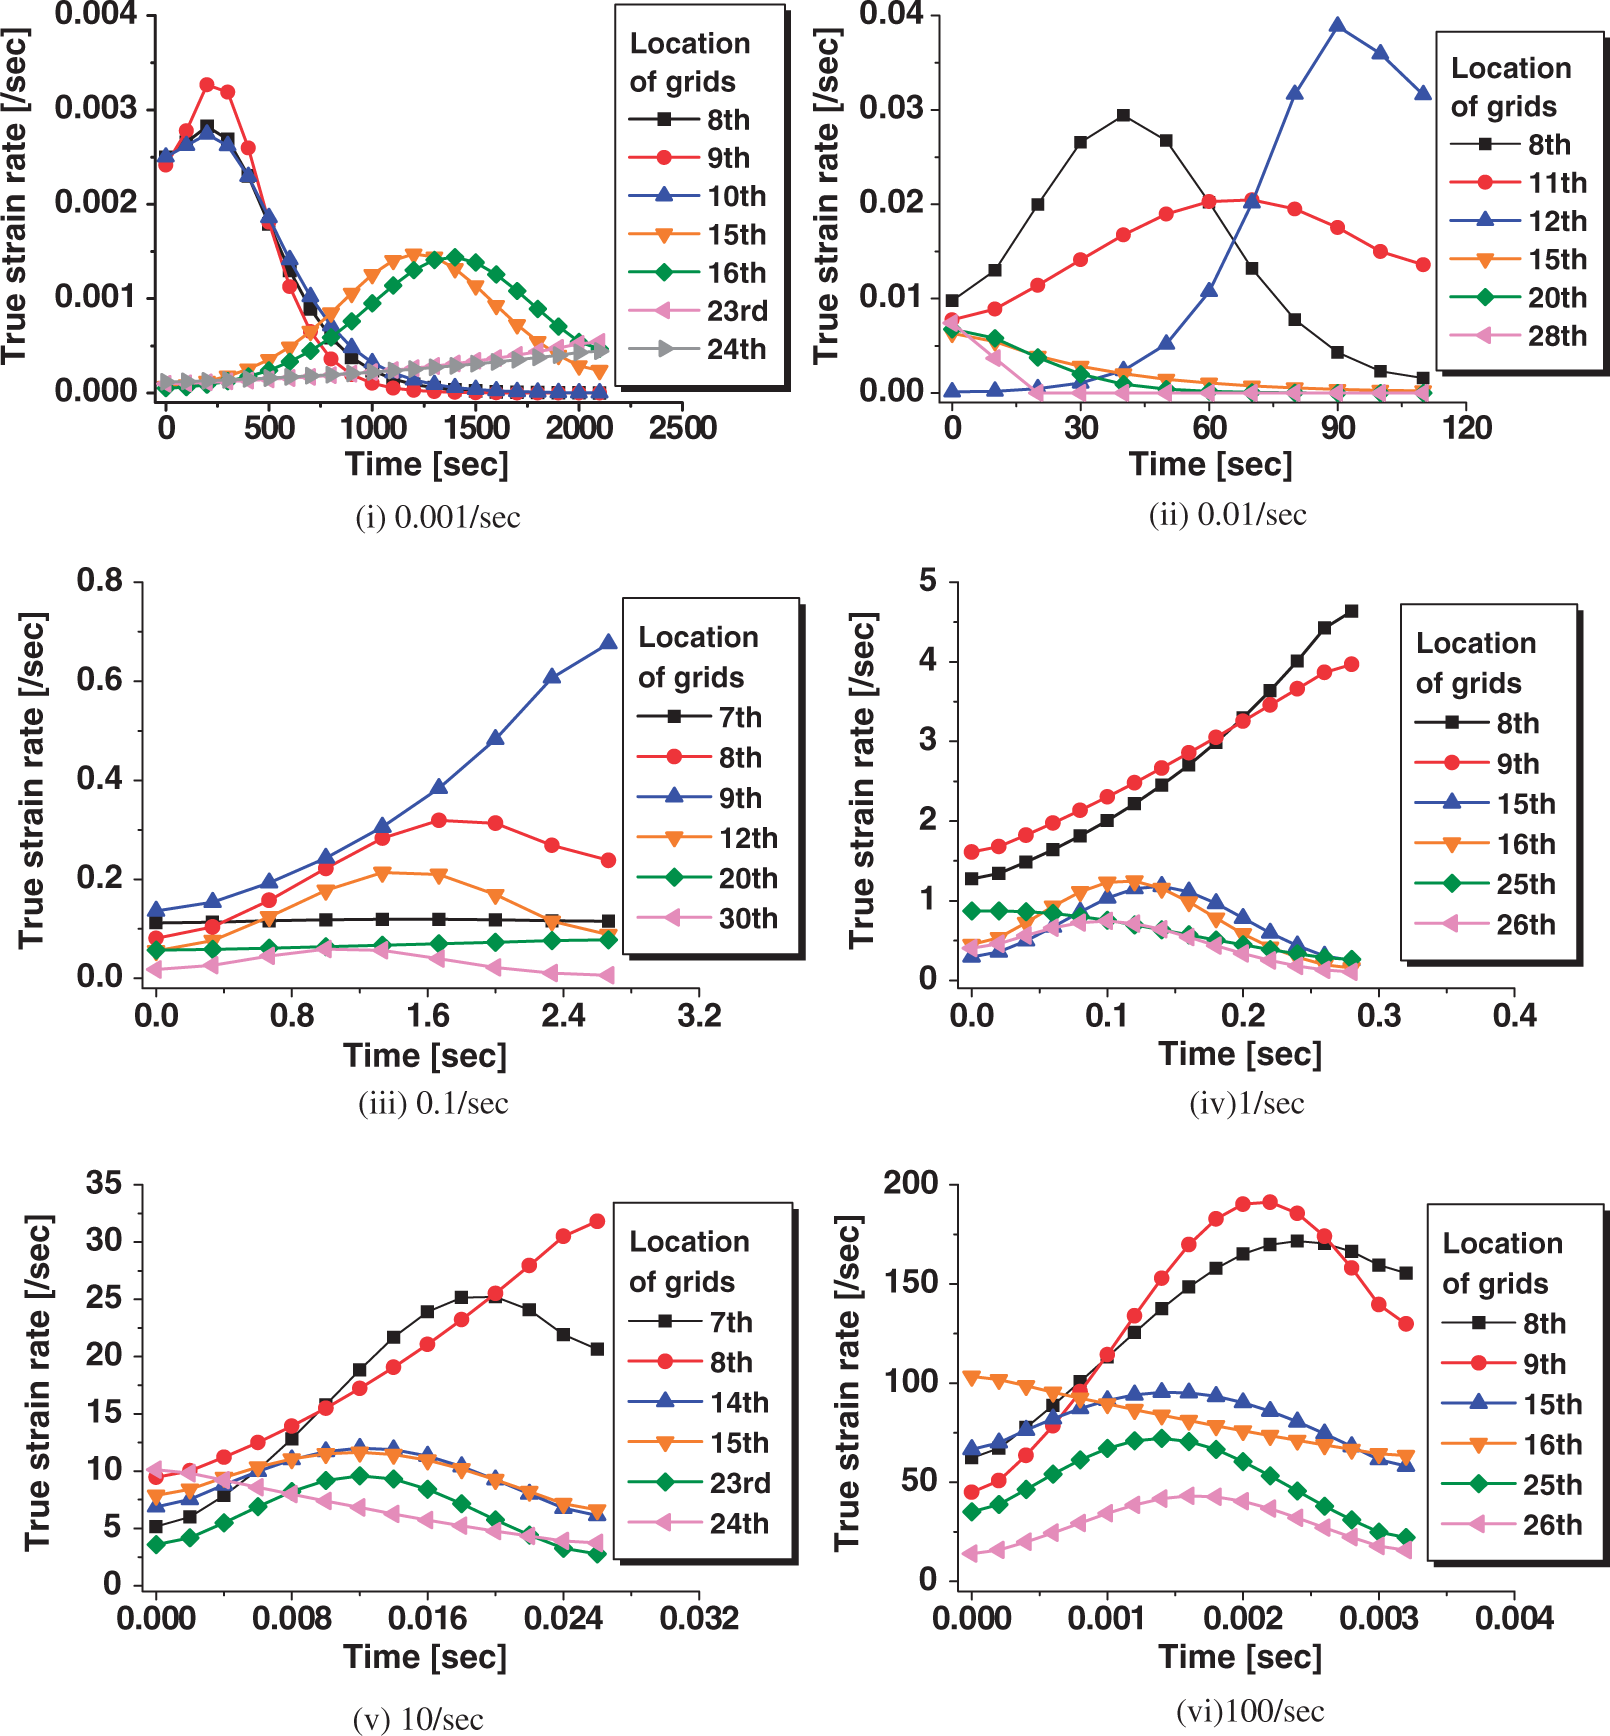
The actual strain rate can be calculated from the true strain with respect to time by first obtaining derivatives of the true strain with respect to time. The actual strain rate obtained at each grid element is shown in Figures 12 and 13. Although the uniaxial tensile tests were conducted at constant speeds, both the true strain and the actual strain rate obtained at each grid element varies in accordance with the deformation behavior of specimens and the time increment. Therefore, the actual strain rate acquired by FEGM should be considered to enhance the accuracy of the tensile properties obtained at various strain rates. Since the relation between the true stress and the true strain calculated in the previous section can be correlated with the actual strain rate acquired by FEGM, it can be obtained at the actual strain rate corresponding to the real deformation behavior.
Variation of the actual strain rate with respect to time at various desired strain rates for ABS. Variation of the actual strain rate with respect to time at various desired strain rates for PP.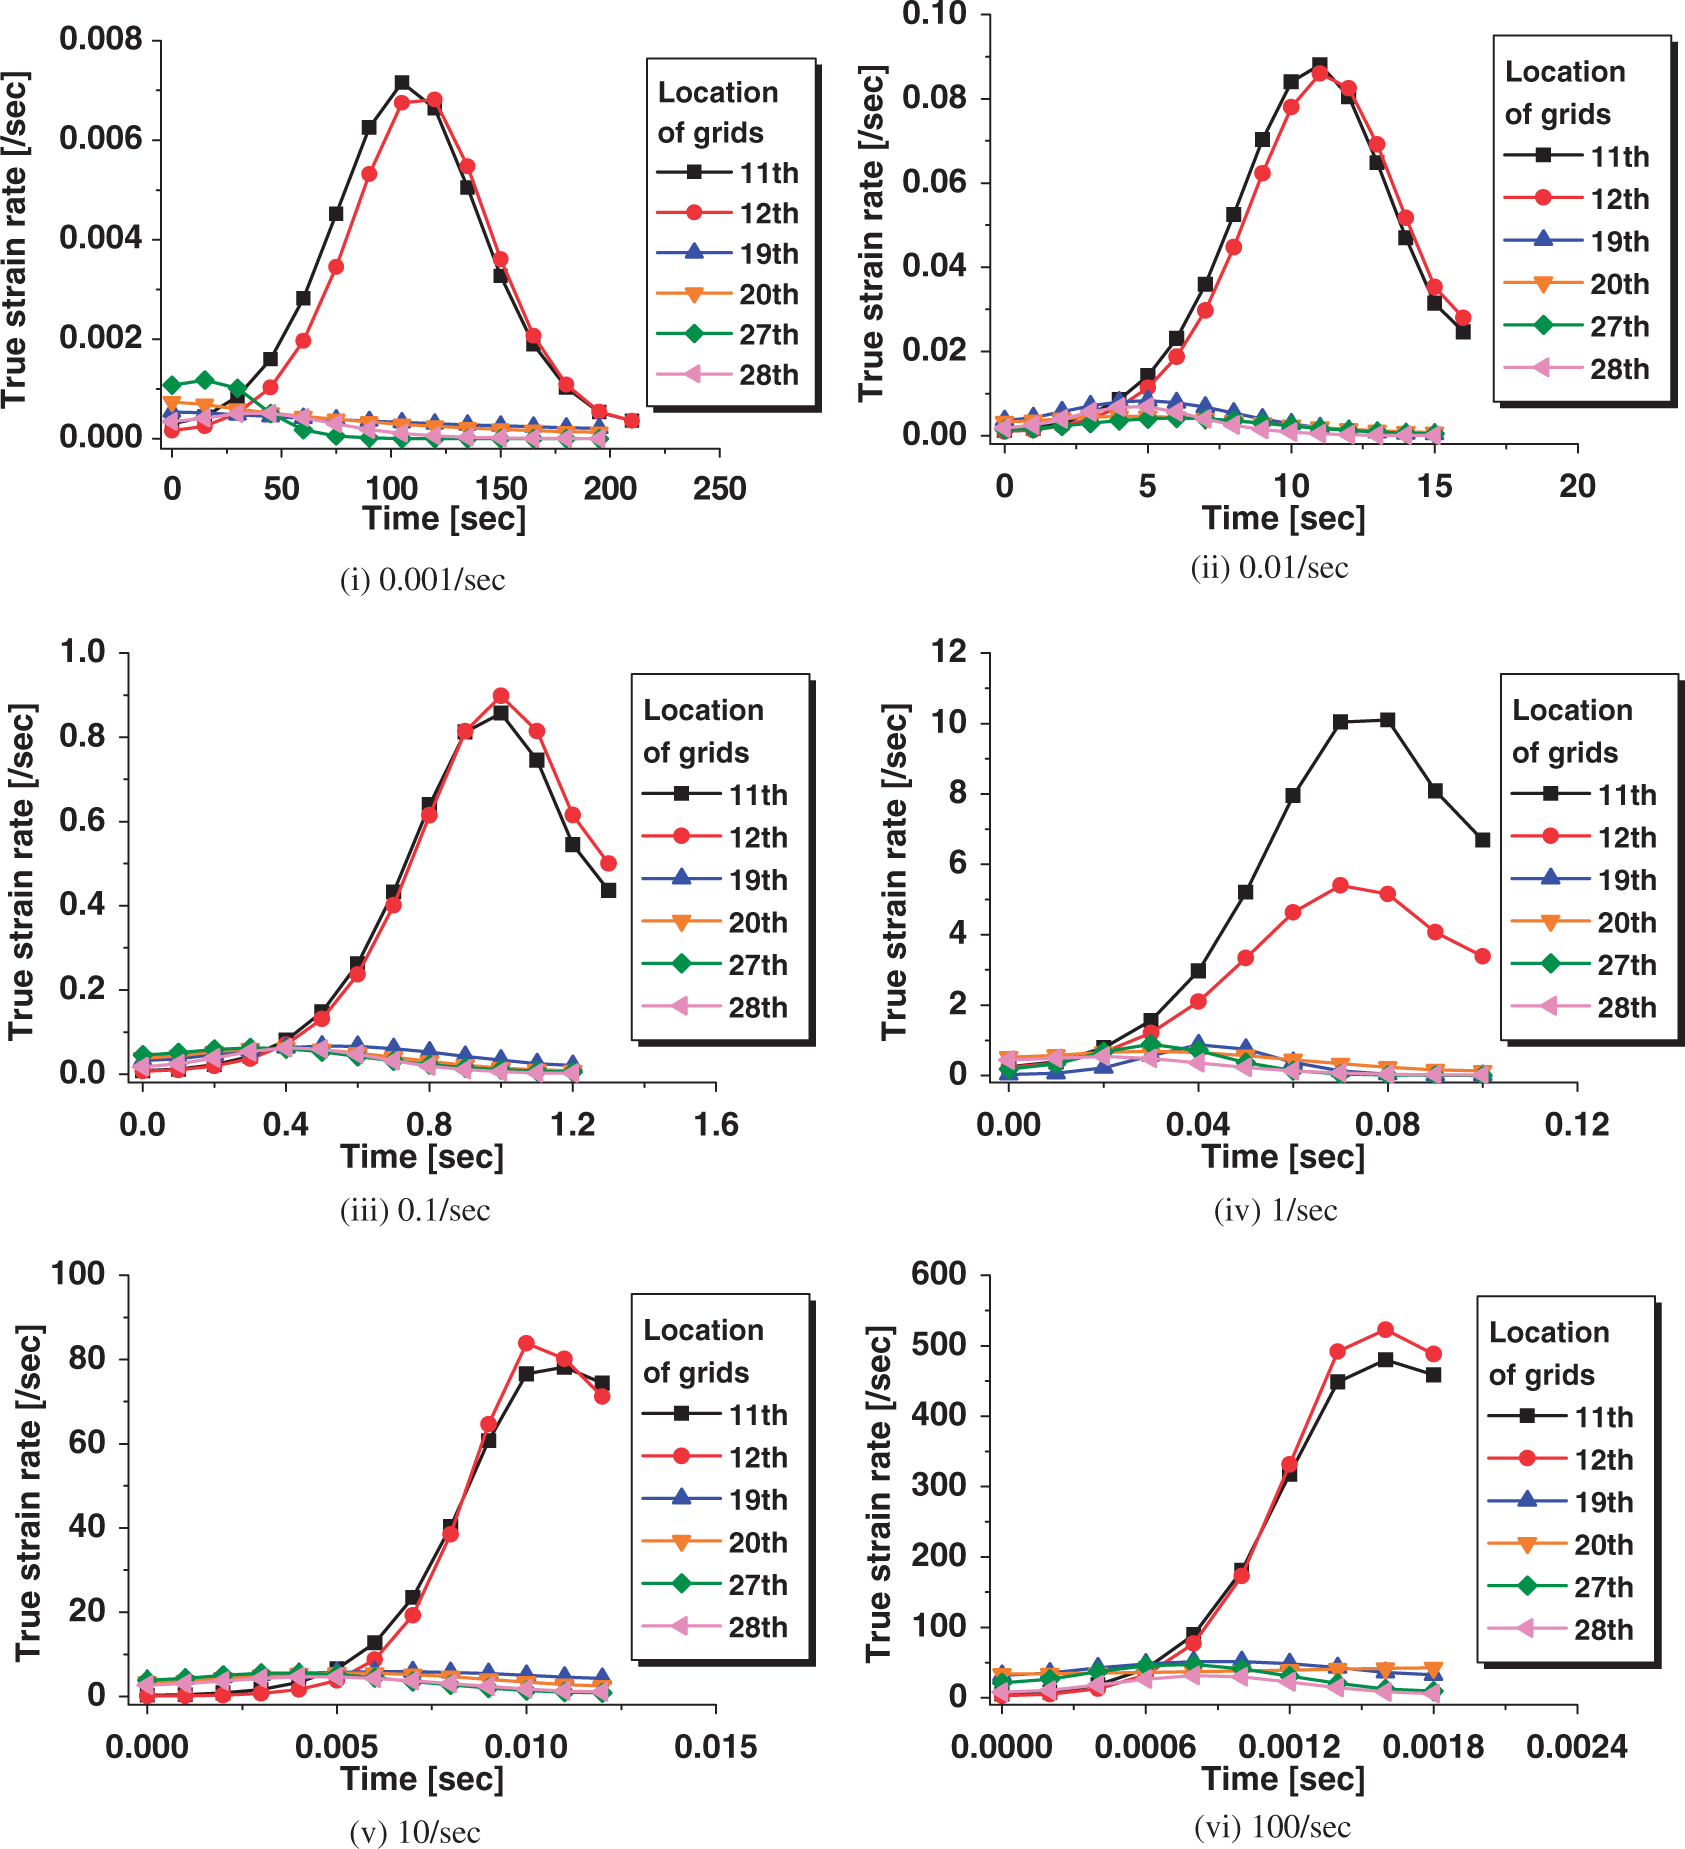
True stress–true strain curves with the variation of the actual strain rate
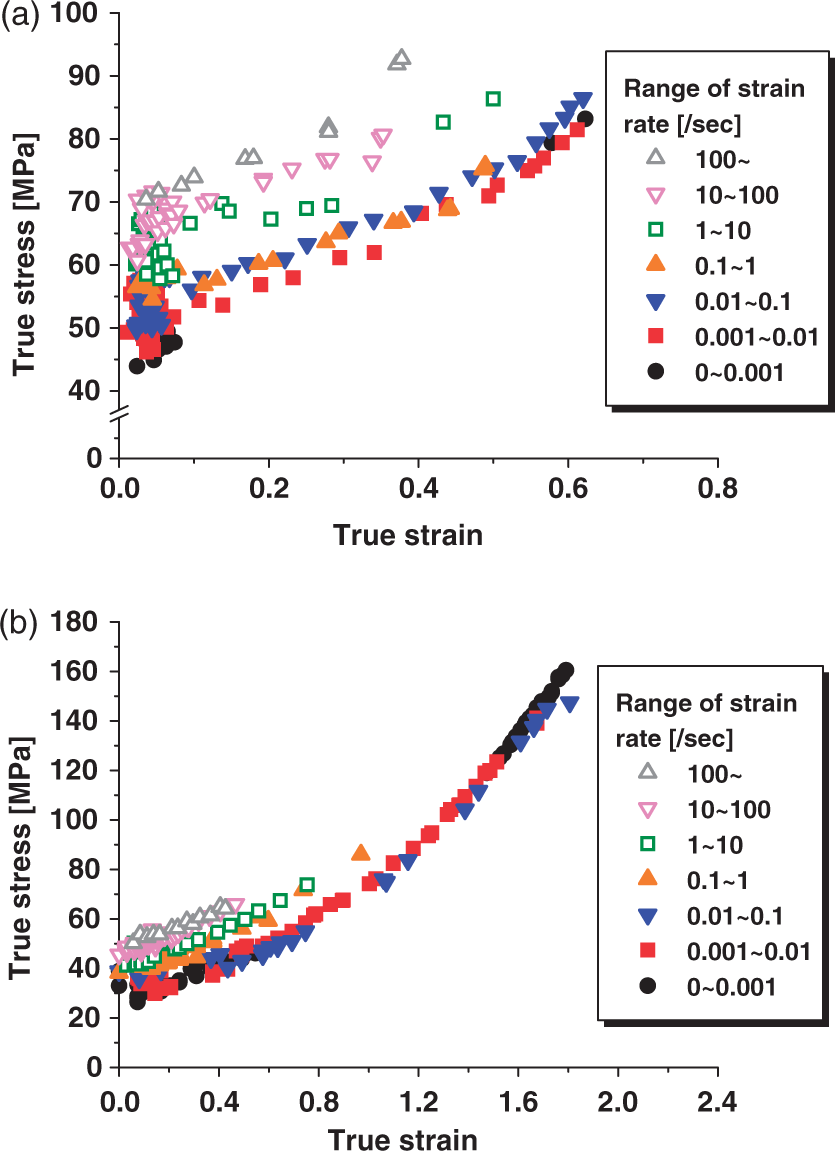
Correlating a true stress and a true strain at the actual strain rate, the relation between true stress and true strain with the variation of the actual strain rate can be extracted to construct a true stress–true strain curve. The relations between true stress and true strain with the variation of the actual strain rate for two polymers are plotted by using the proposed method and are depicted for schematic demonstration in Figure 14. In these figures, groups of points plotted with the same symbol indicate the true stress–true strain relationship within a certain range of the actual strain rate. The ‘range of strain rate’ in the legend of Figure 14 means these certain ranges of the actual strain rate such as 0–0.001 s−1, 0.001–0.01 s−1, 0.01–0.1 s−1, 0.1–1 s−1, 1–10 s−1, 10–100 s−1, and above 100 s−1. Of course, each point has its own strain rate in specific number. Supposing that there are curves which pass through points of adjacent symbols, they indicate a true stress–true strain curve of the material in accordance with a representative strain rate such as 0.001, 0.01, 0.1, 1, 10, or 100 s−1. Those points have to be interpolated with a proper model for true stress–true strain curves. Unfortunately, there is no existing model which could appropriately describe a true stress–true strain curve, although several models have been proposed by Johnson and Cook,
21
Khan and Huang,
22
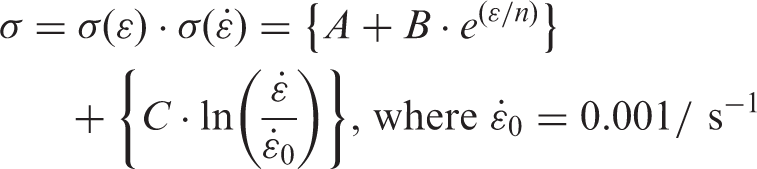
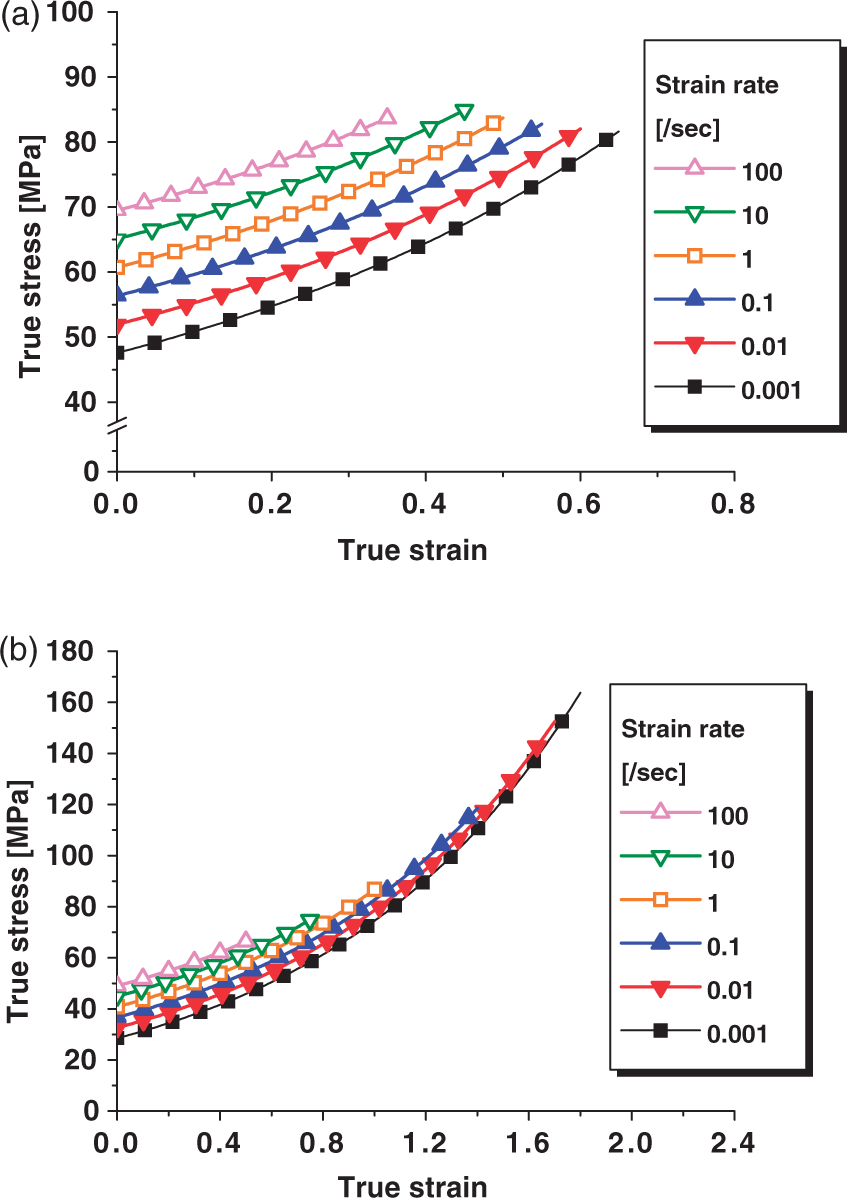
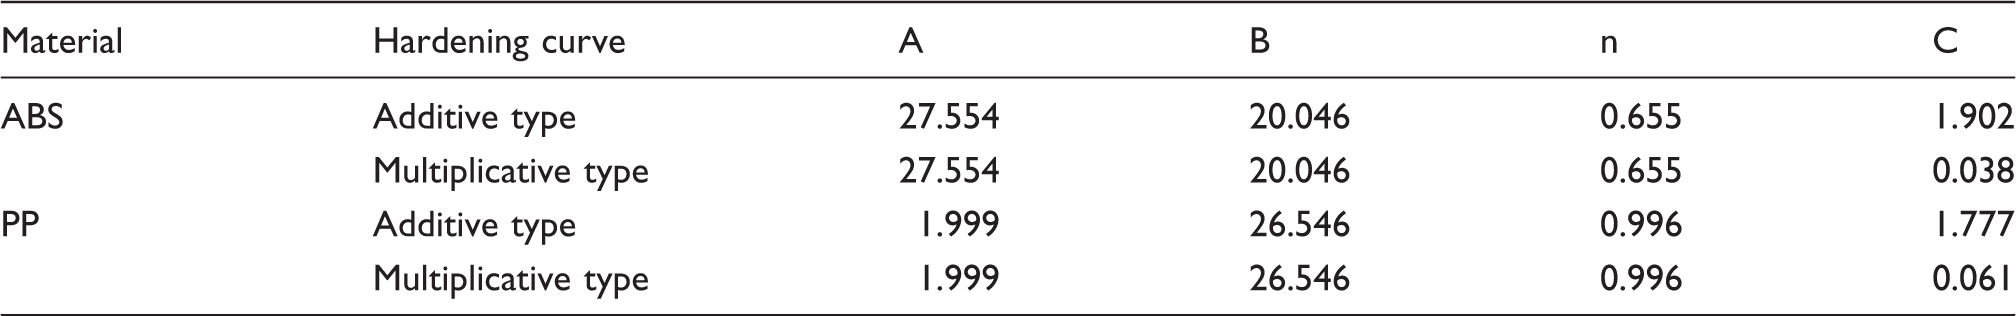
and so on. In order to best curve fit the points obtained, a new model has been proposed with modification of existing models in two ways as follows. These curves are shown in Figure 15. One is expressed as an additive type in which the flow stress increases with an equivalent distance as the strain rate increases. The other is expressed as a multiplicative type in which the flow stress increases with an equivalent ratio as the strain rate increases. The two formulae proposed are expressed below:
Data points to relate true stress to true strain with the variation of the strain rate: (a) ABS and (b) PP. True stress–true strain curves with the variation of the strain rate: (a) ABS and (b) PP.
Numerical verification of FEGM
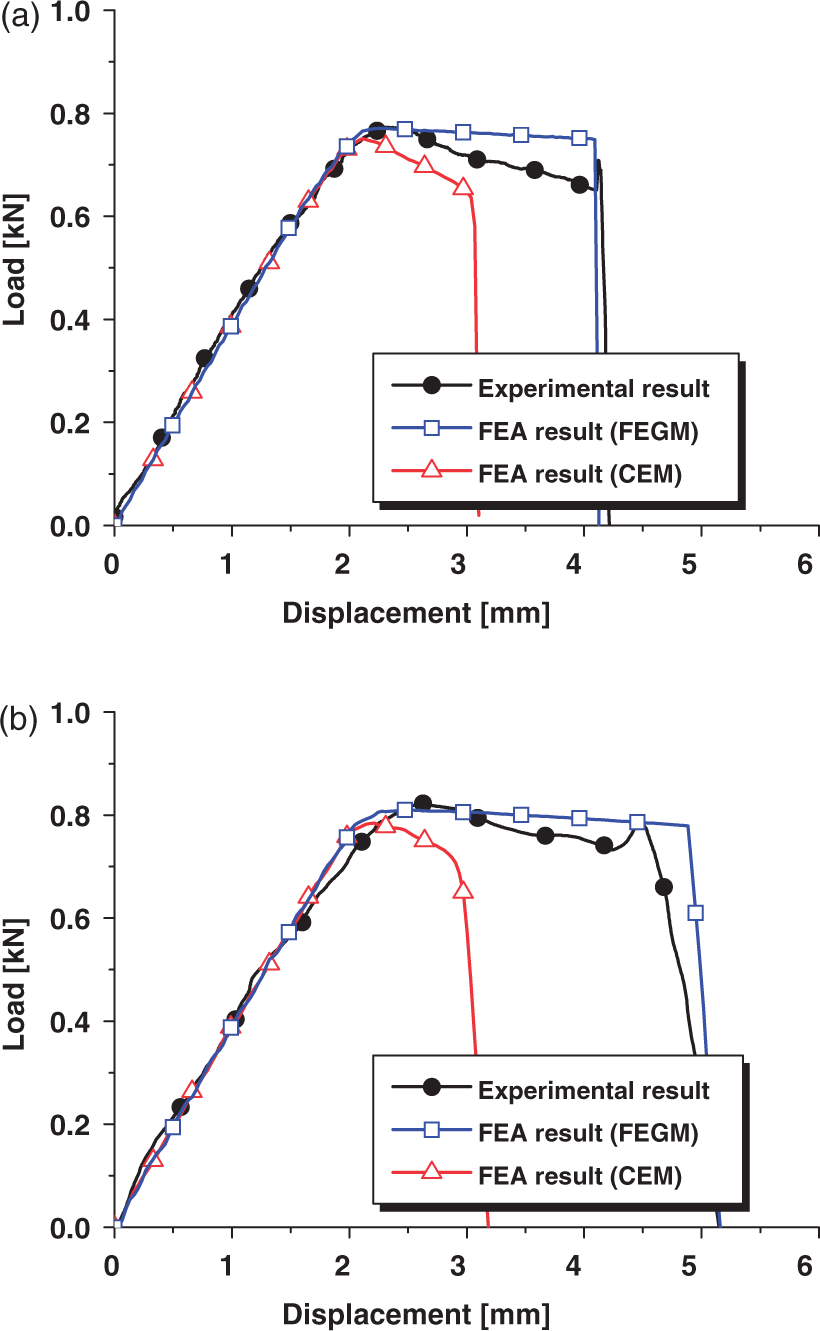
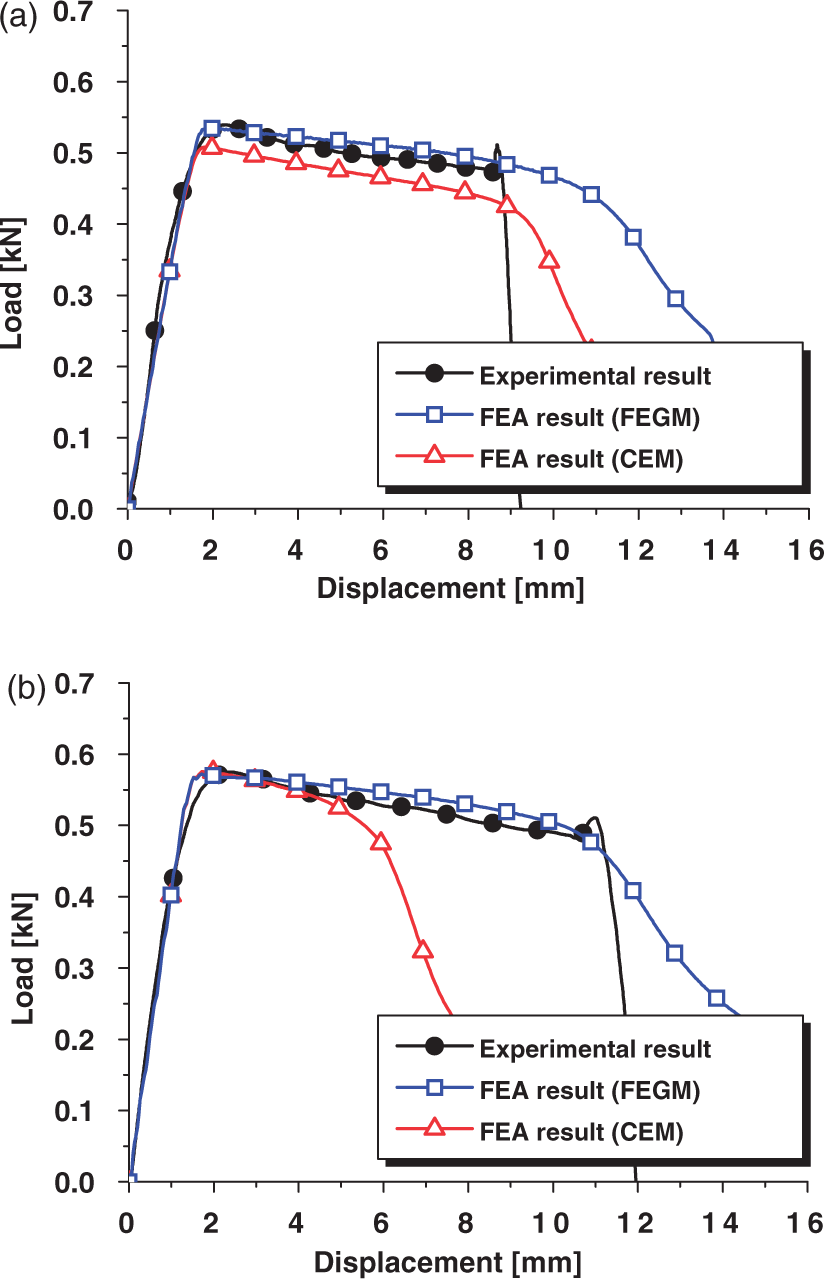
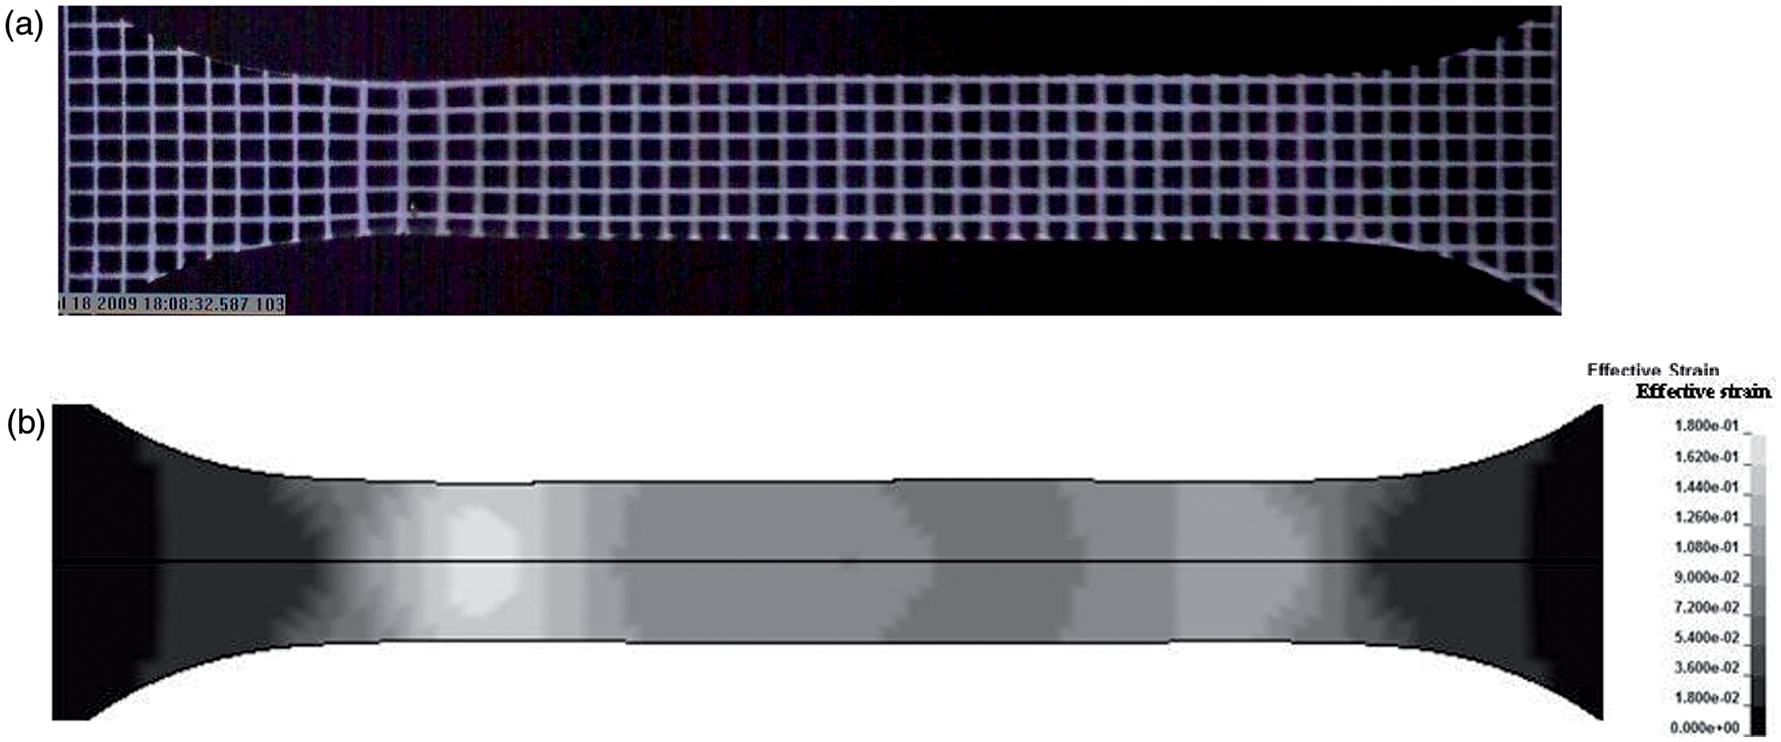
The material properties of the true stress–true strain curve at various strain rates acquired by FEGM were evaluated by finite element analysis of the uniaxial tensile tests. The commercial software, LS-DYNA 3D, v.971, was used for the finite element analysis. Three-dimensional solid elements were adopted, and half of a specimen was modeled for the sake of symmetry of the uniaxial tensile tests. A finite element modeling and boundary conditions are shown in Figure 16. The tensile speeds were chosen to be 0.33 m/s and 3.3 m/s, which correspond to nominal strain rates of 10 s−1 and 100 s−1. A finite element mesh system was constructed with 7488 elements and 9891 nodes. The material properties at various strain rates acquired by FEGM and CEM were applied to finite element analysis as piecewise linear data for comparison and evaluation. The finite element analysis results using the given material properties acquired by FEGM were compared with those acquired by CEM in order to assess the validity of FEGM. Load–displacement graphs obtained by experiments and numerical analyses are shown in Figures 17 and 18. The finite element analysis result with the material properties acquired by FEGM show good agreement with the experimental result, while the result using the material properties acquired by CEM fails to correctly describe the real deformation behavior. The deformation behavior with the material properties acquired by CEM shows the onset of the necking immediately after the maximum tensile load while the other two exhibit a considerable amount of deformation even after the maximum tensile load. Deformed shapes are also shown for the experimental results and finite element analysis results using the material properties acquired by FEGM in Figure 19. In these figures, the finite element analysis result using the material properties acquired by FEGM nicely corresponds to the deformed shape obtained by experiment.
Finite element analysis conditions. Comparison of experimental results with finite element analysis results obtained from the FEGM method and the conventional extensometry method for ABS: (a) 10 s−1 and (b) 100 s−1. Comparison of experimental results with finite element analysis results obtained from the FEGM method and the conventional extensometry method for PP: (a) 10 s−1 and (b) 100 s−1. Final deformed shapes of ABS at the strain rate of 100 s−1 and the stroke of 5.0 mm: (a) experimental result and (b) finite element analysis result with the true stress–true strain curves obtained.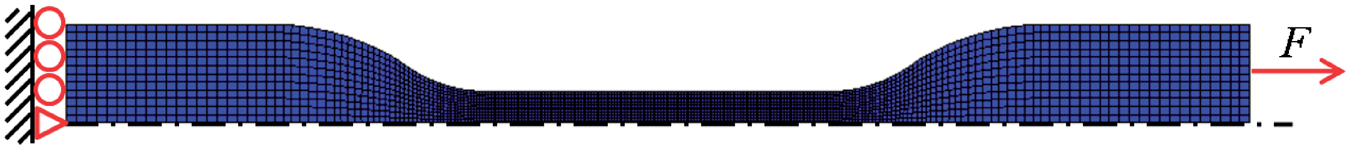
Conclusions
This article newly proposed a force equilibrium grid method for data analysis. This method can convert engineering stress–engineering strain curves to true stress–true strain curves correctly to acquire accurate true stress–true strain curves with the variation of the strain rate for materials that have severe localized deformation. Our experimental results demonstrate that ABS has severe localization of deformation, while most PP-based polymers show relatively uniform and large deformation. The contribution of this article has been summarized below:
Uniaxial tensile tests at quasi-static and intermediate strain rates ranging from 0.001 s−1 to 100 s−1 were conducted for two auto-body polymers. It was noticed that the flow stress increased as the strain rate increased. Using FEGM, the true stress and true strain can be directly calculated at each grid element. FEGM can obtain the actual strain rate which corresponds to the real deformation behavior of a specimen. The true stress–true strain curves at each actual strain rate are acquired by FEGM. The true stress–true strain curves obtained are interpolated as flow stress curves with hardening functions of an additive type and a multiplicative type. Finite element analysis results using the material properties acquired by FEGM demonstrates excellent agreement with experimental results compared to those using the material properties acquired by CEM.
Footnotes
Funding
This research received no specific grant from any funding agency in the public, commercial, or not-for-profit sectors.
Acknowledgement
This research received no specific grant from any funding agency in the public, commercial, or not-for-profit sectors.
Conflict of Interest
None declared.