
Abstract
In this study, the buckling and compressive failure of adhesively-bonded stepped-lap joints (with/without composite patches) composed of pultruded glass fiber-reinforced polymer composite laminates was investigated experimentally and numerically. Two-component epoxy adhesive was used for bonding purposes. Composite patches were woven glass-epoxy layer. They were added onto the conventional stepped-lap joints so that additional load transfer paths were created and localized stress concentrations near joint edge were reduced. The axial compression tests were performed and the results revealed that the buckling and failure load of new stepped lap composite joints with composite patches were significantly higher than the conventional stepped lap joints. The influence of the overlap length was evaluated. For both types of joints, a small increase was observed in failure loads by increase of the overlap length. Numerical results showed a very good agreement with experimental results.
Introduction
The pultrusion process has been very successful in producing low-cost, high-quality structural products. Various cross-sectional shapes with continuous length can be produced in a single step process. Pultruded products, based on relatively inexpensive constituents such as E-glass fibers and polyester resins, were originally used for commercial applications where lifetime cost benefits, lightweight, and corrosion resistance made them attractive over steel or aluminum. 1
Generally, the joining methods of the composite structures are classified into the mechanical joining and adhesive bonding. The adhesive joints do not require holes, and they distribute the load over a larger area than the mechanical joints; however, stress concentration always occurs at the edge of overlap area in adhesively bonded joint. Statistics shows that approximately 70% of the failure of structures is initiated from joints.2–5 Therefore, it is necessary to examine the strength characteristic of adhesive joints precisely. Considerable amount of research has been carried out on the interface stress distributions and strengths of lap,6–10 butt,11–14 and scarf15–18 adhesive joints subjected to static loadings. The stepped-lap joint, a combination of butt joint and single lap joint, can be can be easily manufactured without the high manufacturing cost. Some investigations have been carried out on the stress distributions in stepped-lap adhesive joints under static loadings.19–23 However, the characteristics of stepped-lap adhesive joints under compressive loadings have not yet been fully understood.
Various improving techniques have been adopted by researchers to reduce stress concentrations (shear and peel) at the ends of the overlap region in adhesively bonded joints. These include altering the adherend geometry,24–26 adhesive geometry,27,28 and spew geometry.29–32 Zeng and Sun 33 proposed a novel ‘wavy’ lap joint configuration. They found that the wavy joint could substantially increase the joint strength over the conventional straight lap joint design. However, it is not easy to manufacture such wavy joints. Moreover, the wavy geometry of the adherend may potentially weaken its strength. Another technique is the use of more than one adhesive along the overlap (an adhesive bondline with variable modulus to relieve the high-stress concentrations at the end regions of the overlap) to have a more uniform stress distribution. 34
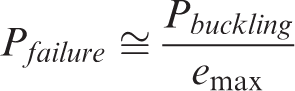
In this article, the buckling and compressive failure of adhesively-bonded stepped-lap joints (with/without composite patches) composed of pultruded glass fiber-reinforced polymer composite laminates was investigated experimentally and numerically. There are no comprehensive studies done in the recent past to assess buckling and compressive failure of stepped-lap joints. Composite patches were added onto the conventional stepped-lap joints so that additional load transfer paths were created and localized stress concentrations near joint edge were reduced. The axial compression tests were performed at ambient environment for both types of joints. The effect of the overlap length on the buckling and compressive failure load was evaluated. A 3D finite element analysis was modeled to compute local 3D stress fields in the most critical region of the joints. In order to predict the location of damage initiation, Tsai–Wu quadratic failure criteria were used for the adherend-adhesive interface and the parabolic criteria was used for the adhesive. The maximum failure indices were used to determine compressive failure load of the joints.
Materials and experimental details
Composite adherends
The material used as adherends in this investigation is E-glass fiber-reinforced polymer matrix (GFRP) pultruded composite. The matrix material was isophthalic polyester. The adherends were manufactured by Pul-Tech FRP in Uş ak, Turkey. The trade name was FRP LM10. The fiber volume fraction of the pultruded GFRP is 60%. The adherends were cut from the pultruded composite sheets of 6 mm thickness, using a water-cooled diamond saw and formed into the desired shape by means of a CNC machine. The mechanical properties of the adherends were obtained in accordance with ASTM standards.35–37 The interlaminar shear strength was calculated as S = 20 ± 1.0 MPa. This value corresponds well to measurements of the interlaminar shear strength on a similar material in Bai et al.
38
and Keller and Vallée,
39
where values between 17.5 and 23.5 MPa were obtained. In order to determine the interlaminar compressive strength, Zc, the composite specimen with dimensions 20 mm length × 20 mm width was prepared. The prepared specimen was placed between two rigid plates and the compressive test was performed on the specimen until failure occurred. Zc was calculated by dividing the failure load to the cross-sectional area of the specimen. The mechanical properties of the adherends were given as follows (1-fibers direction, 2-transverse direction, 3-thickness direction):
• E1 = 12 GPa, E2 = 4 GPa, G12 = 1.2 GPa, v12 = 0.28, Zc = 35 MPa, S = 20 MPa
Adhesive
The adhesive used in this study has two parts (resin and hardener). Resin, EL-2210, and hardener, EH-2910, mainly employed to bond structures bearing both high loads and critical conditions (aggressive environment) were obtained from the RAMPF Group, Inc. (USA). Resin EL-2210 was blended with hardener EH-2910 in the ratio of 100:60 by weight using a mixing machine until they were homogenously mixed and applied to both sides of the adherends with a brush. At room temperature (∼20°C), these adhesives were held seven days to reach full cure as recommended by manufacturer. The mechanical properties of the cured adhesive are adopted as follows
40
• E = 2.3 GPa, v = 0.4, Yt = 34.7 MPa, Yc = 45.1 MPa
Composite patches
Two patches were woven glass-epoxy composite layer (has a weight of 200 g/m2) with the dimensions of 30 mm × 40 mm × 0.125 mm3 (length × width × thickness). The fiber volume fraction of the woven layer was 60%. The mechanical properties of the patches were given as follows
41
• E1 = E2 = 20 GPa, v12 = 0.13, G12 = 2.85 GPa
Surface preparation
Surface preparation of the plates to be bonded is a crucial step because it directly affects the strength of the joints. By preparing correctly, joint strength can be maintained to its full potential, resulting in long-term structural integrity. Improper surface preparation may cause adhesive bond failure and unpredictable failure. The main role of surface preparation is to remove surface contaminants, increase the bonding surface area, and improve surface roughness. In this study, the surface treatment was performed in accordance with ASTM D 2093-97 standard. 42 Firstly, the bonding surface of each adherend was cleaned with acetone in order to remove either weak adhering or contaminated outer layers on adherend’s surface. Secondly, the bonding surfaces of the adherends were sanded with fine grit sandpaper until evidence of fibers become visible. Finally, the sanded surfaces were wiped with a clean dry cloth to remove particles from the sanding, and the surfaces were cleaned with acetone by using a fresh portion of cloth. Different portion of cloths were used for each acetone processes.
Preparation of test joints
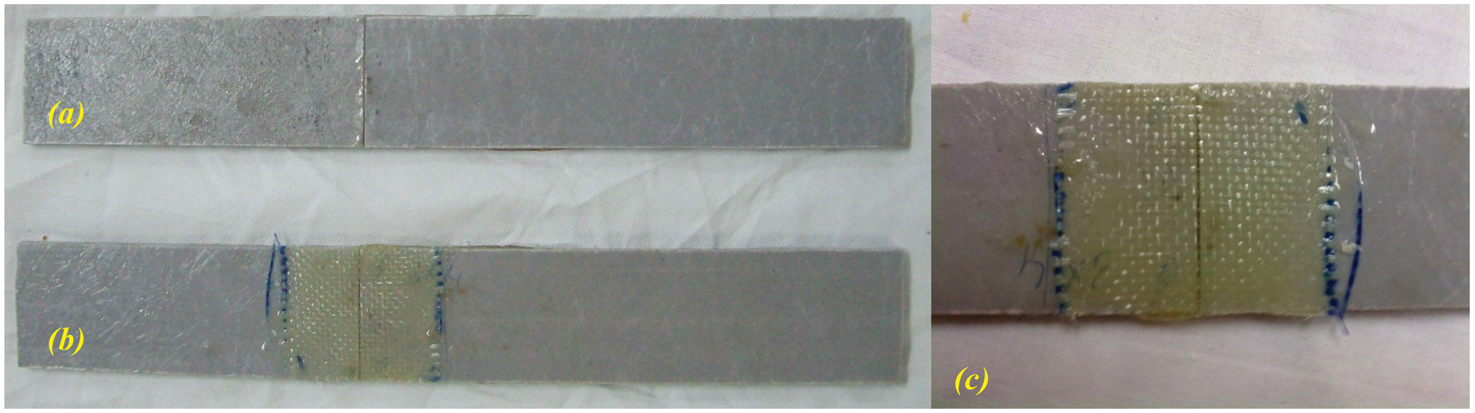
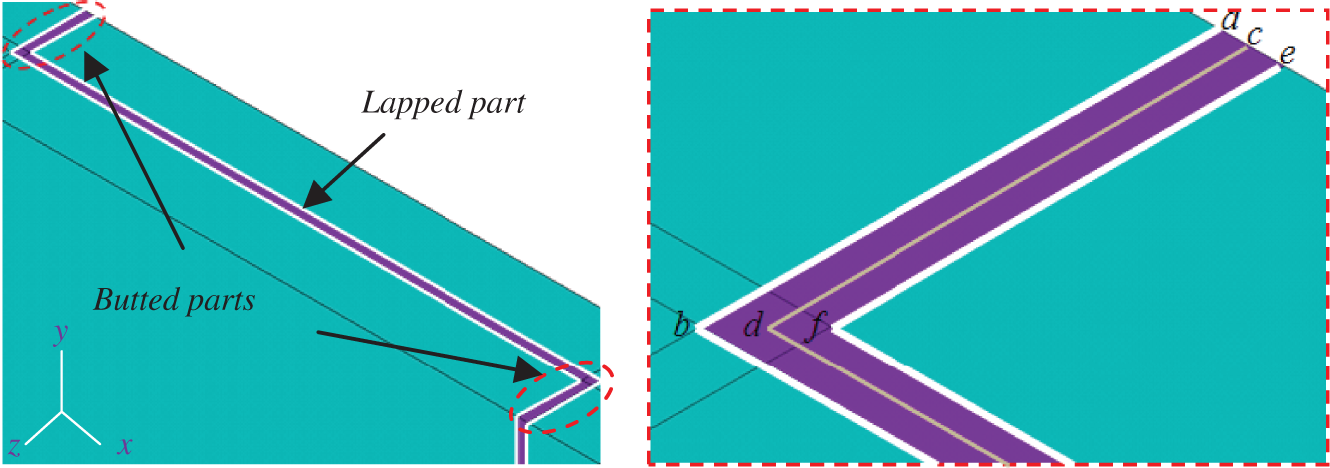
Two types of specimens were investigated: stepped-lap joints (SLJ) and stepped-lap joints repaired with composite patches (R-SLJ) composed of both pultruded GFRP laminates of 150 × 40 × 6 mm3 (length × width × thickness) and a two-component epoxy adhesive. The surface treatment of the adherends was performed by the procedure mentioned above. In order to join the composite adherends, the thickness of the adhesive layer was settled to 0.4 mm by using a 0.4 mm thick chock made of Teflon which placed at the corners of the overlap region and the joint left undisturbed until the adhesive cured sufficiently. Then, the Teflon chock was removed and the prepared adhesive injected into the remaining gaps of the overlap region. The adhesive layer thickness between the fixed patches and the composite adherends was 0.2 mm. To align of the patches correctly, several markings were placed in the composite adherends. The geometric configurations were shown in Figure 1. The overlap length varied as 25, 35, and 45 mm. The required force was obtained by using soft spring clips which allow the adhesive to be squeezed out without losing the correct thickness. In order to calculate the load applied on the specimens from the springs, the end of the clips placed on the tensile testing machine and compressive load was applied until the gaps reached the total overlap region thickness. The applied force on the specimen was approximately 50 N for each clip. Before complete curing, the excess adhesive out of the edges of the overlap area was removed with a razor blade produce the geometry of Figure 1. According to the manufacturing data, after 7 days curing at room temperature, the clips were removed and the bonded joint was ready to be tested. A sample photograph of the two types of specimens was given in Figure 2.
Specimen geometry and dimensions of (a) SLJ; (b) R-SLJ. (Not to scale.). Photograph of the specimens of: (a) stepped-lap joint; (b) stepped-lap joint repaired with composite patches; and (c) zoomed-view of repaired stepped-lap joint.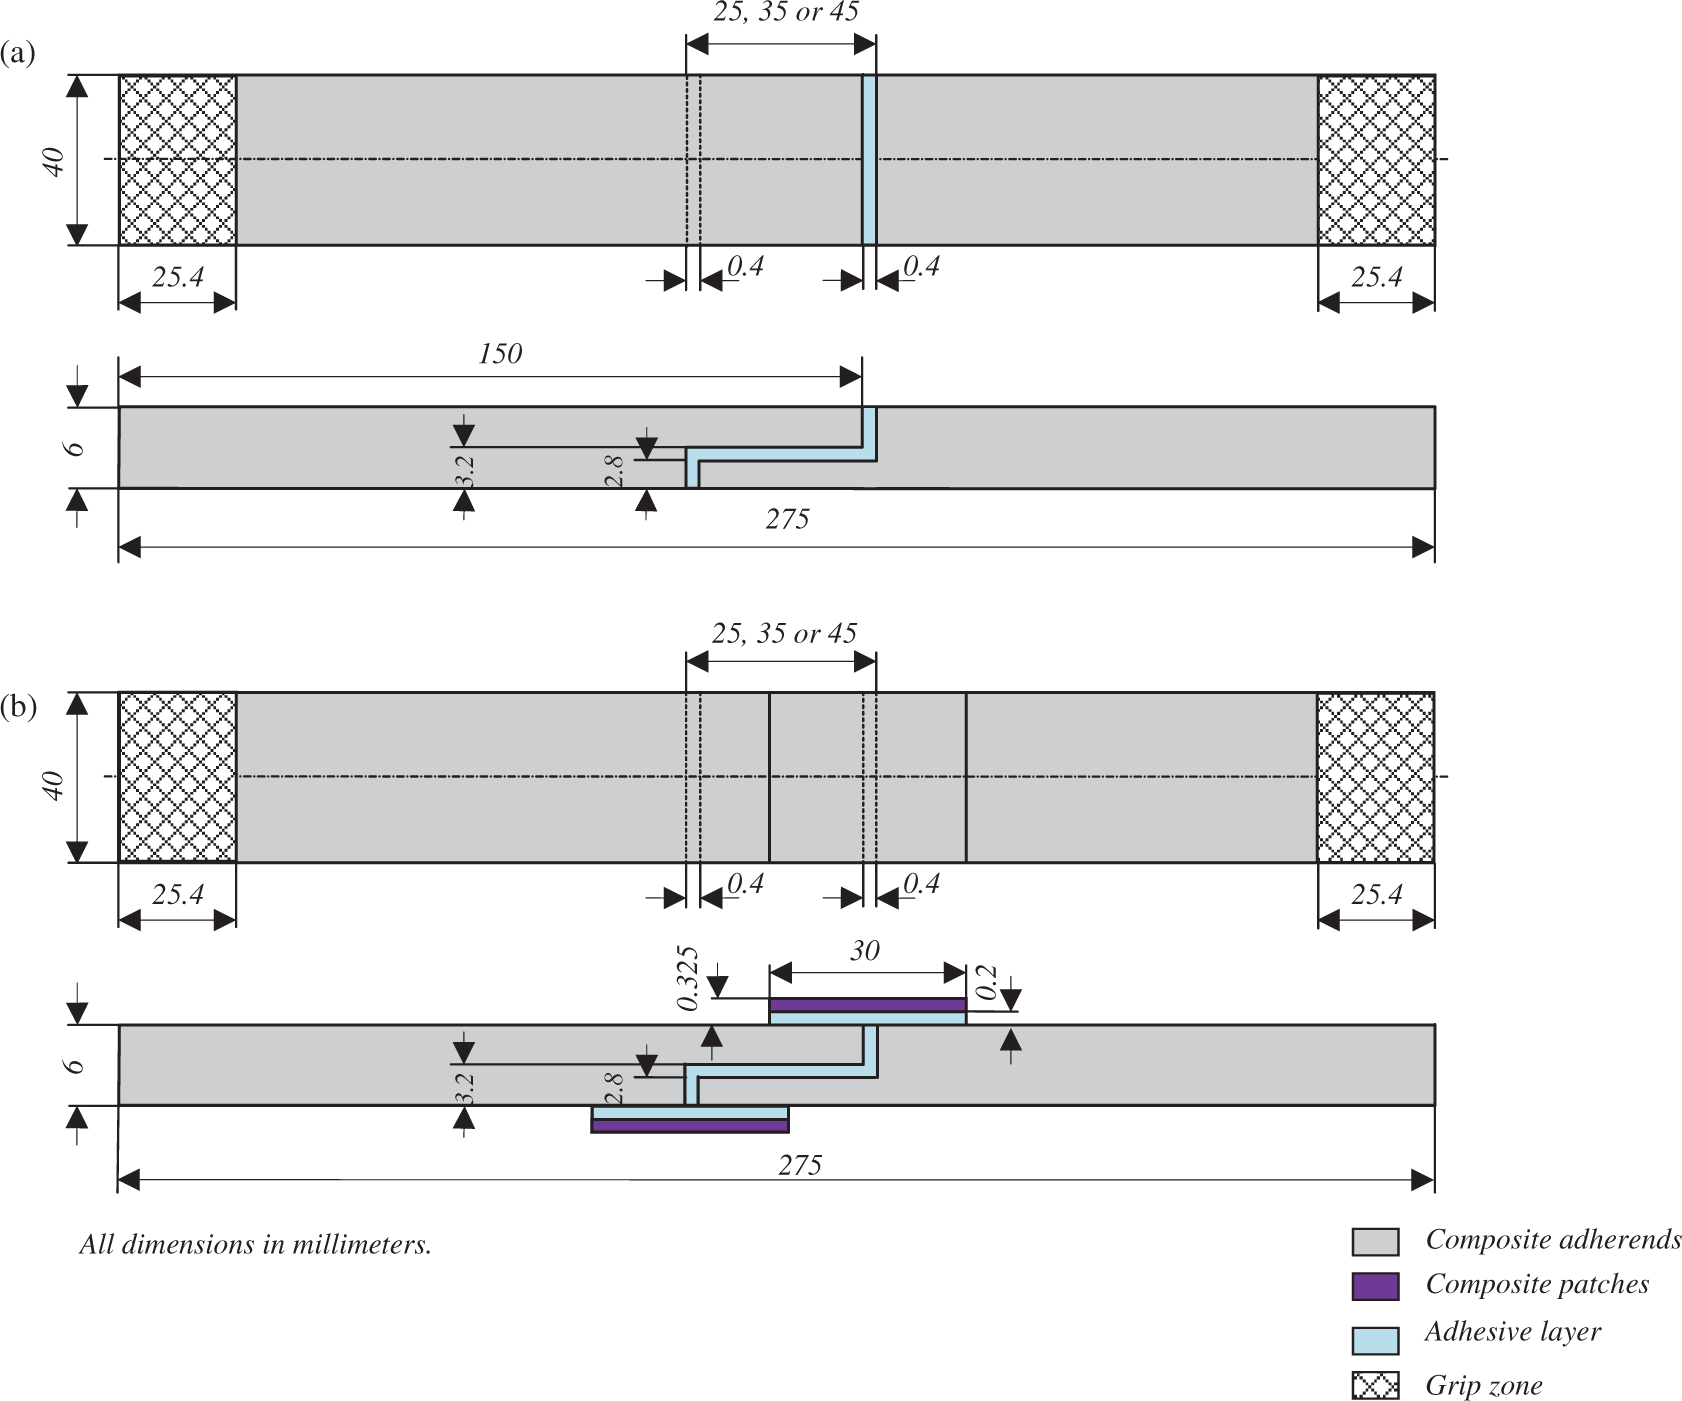
Testing procedure and results
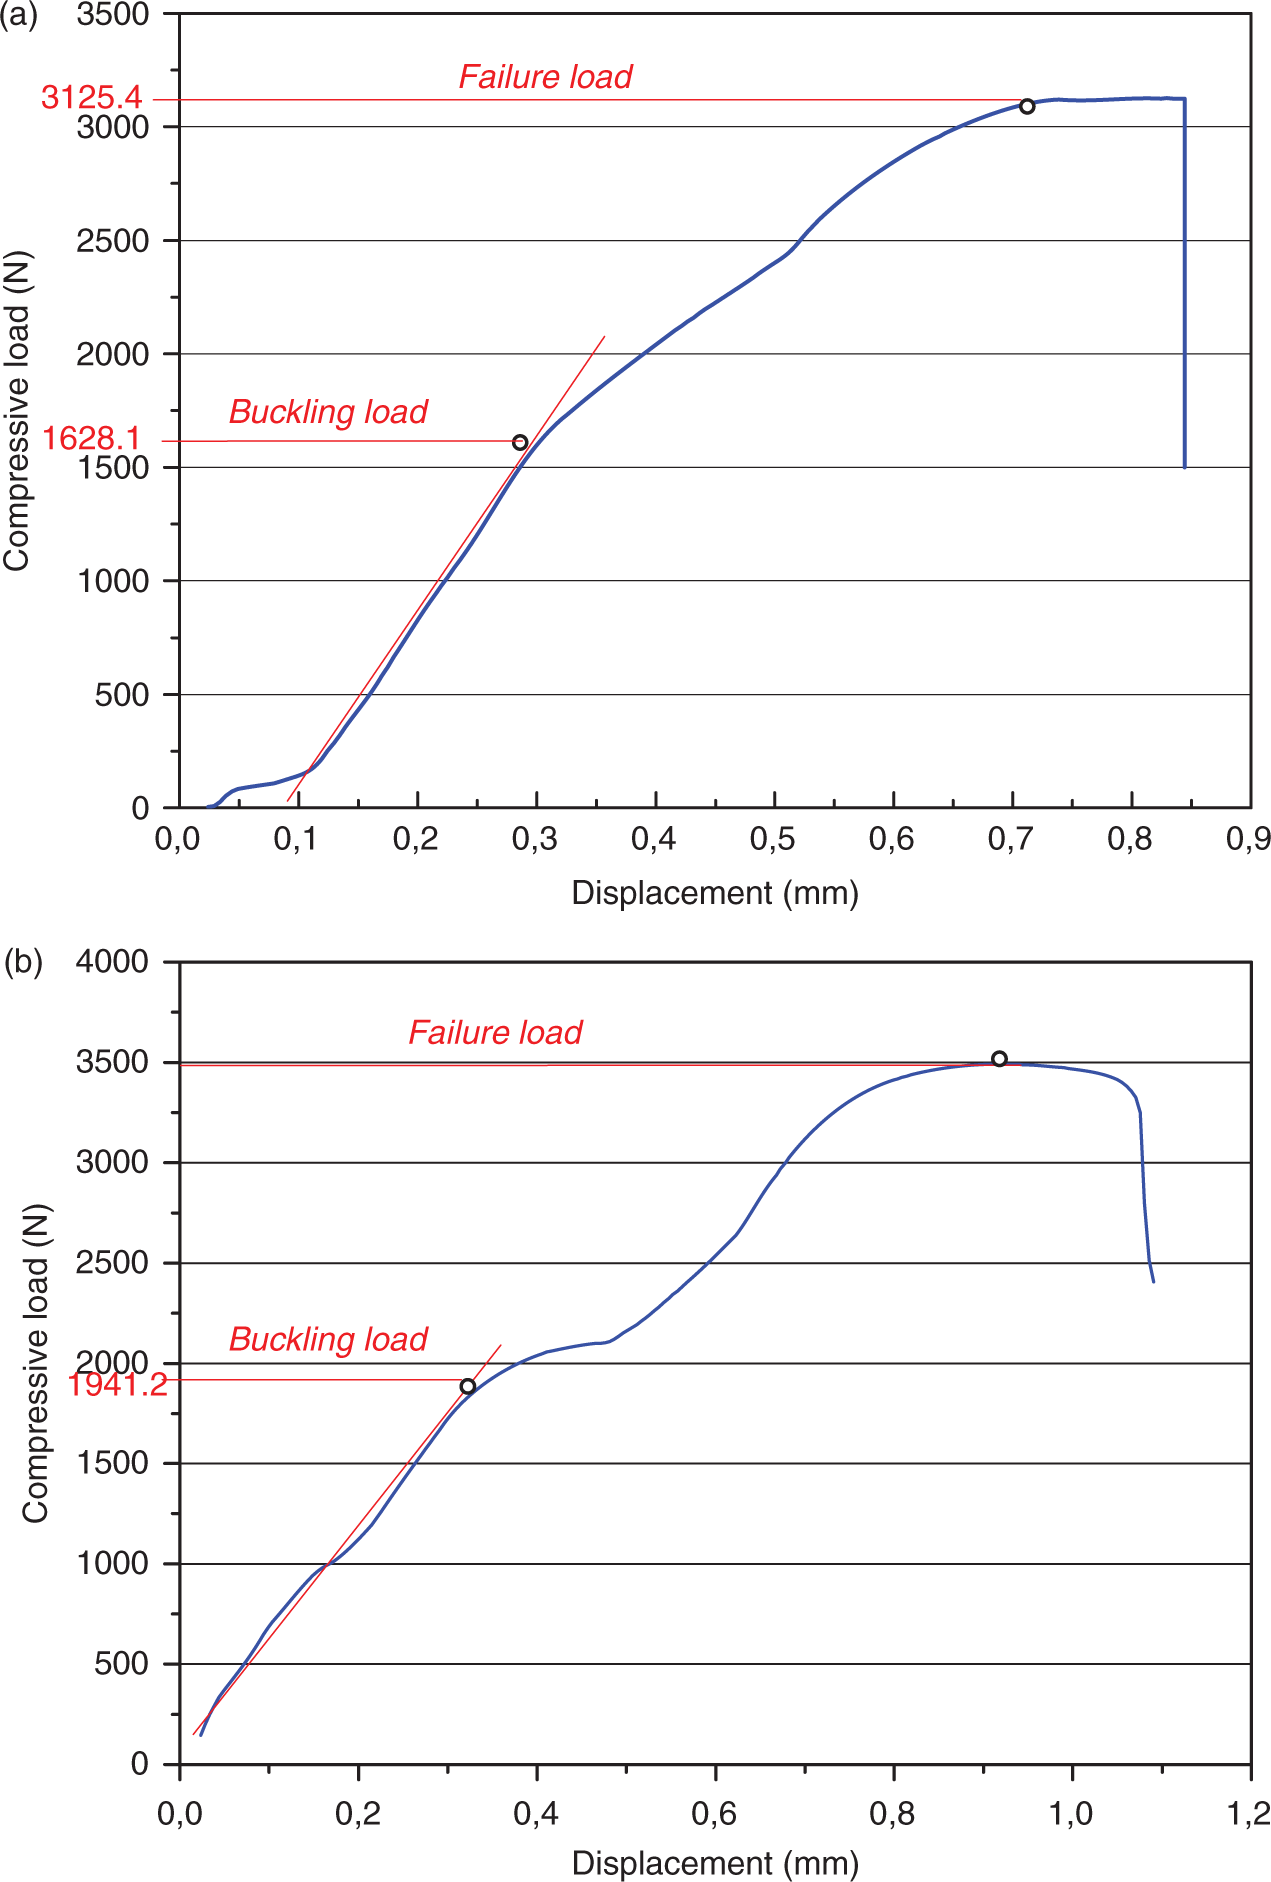
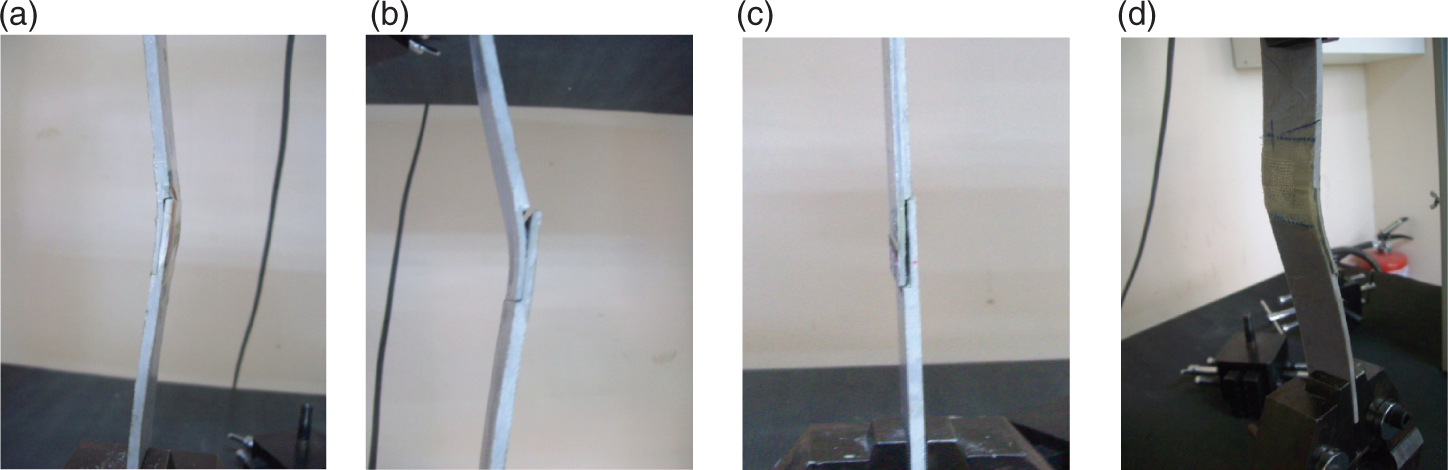
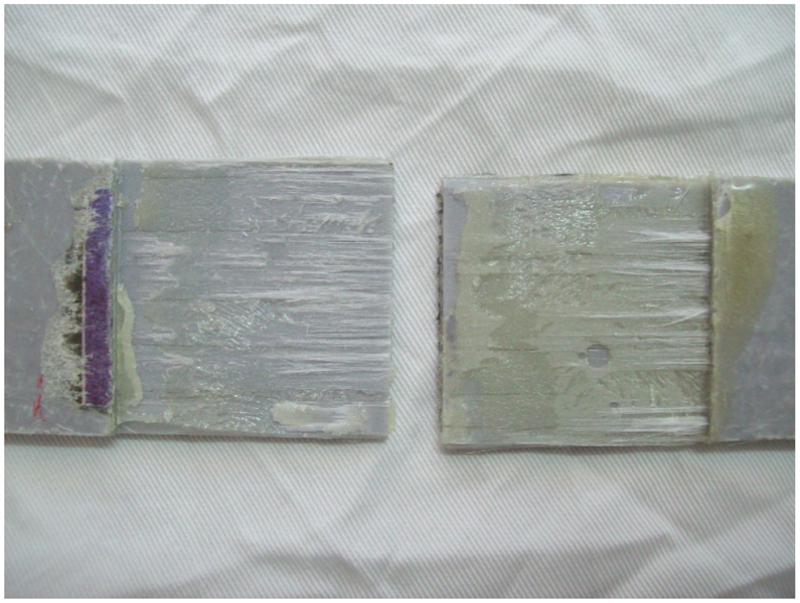
The compressive tests were performed using the Instron universal testing machine at a constant crosshead speed of 1.5 mm/min. For axial loading, the test specimens were placed between the two extremely stiff machine heads, of which the lower one is fixed during the test, whereas the upper head was moved downwards. According to ASTM standards,43,44 the machine grip length on each side of the specimens was taken as 25 mm. Figure 3(a) shows the experimental setup for the buckling tests for the plates with two opposite sides clamped and the others free. During the tests, all specimens were loaded uniaxially up to failure. For all cases studied, buckling occurred before the specimens failed as shown in Figure 3(b). The tests were carried out under displacement control and load–displacement plots were obtained. Three identical specimens for each joint configuration and overlap length were tested to get an average buckling load. Figure 4 shows typical load–displacement responses of SLJ and R-SLJ specimens. In SLJ specimens, it was observed that the load increased in an almost linear manner until fracture. Upon reaching the peak, the load dropped suddenly and the specimens fractured catastrophically. The similar behavior was observed for R-SLJ specimens. The ultimate axial displacements were higher for R-SLJ specimens than for SLJ specimens. Evidently, stepped-lap joint specimens with composite patches can be more damage tolerant than the other, and thus can withstand larger elongation or failure strain. The point of inflection in the load–displacement plot was used to determine the buckling load. After the tests were finished, the specimen dimensions and the failure forces were recorded. The specimens were carefully and closely observed in order to understand the failure mechanism during the compressive tests. Initial cracks initiate at the butt part on the edge of the adhesive layer very close to the adhesive–adherend interface while the lapped parts of the joints still under load and that they propagated with increasing applied load resulting in final failure. The composite patches resist peel stresses and crack propagation thereby enabling the remaining bonded joint region to continue to carry compressive load, after some displacement, failure occurs (Figure 5). The dominant failure mode for both types of joints was a thin-layer cohesive failure (T-CF) in the butted parts of the joints followed by adhesive failure in the lapped parts of the joints. Failure surfaces of a stepped lap bonded specimens were shown in Figure 6.
(a) Experimental test set-up. (b) First buckling mode. Selected load-displacement curve of: (a) SLJ; and (b) R-SLJ (overlap length = 35 mm). (a) Initial cracks initiate at the butt part of the joints; (b) cracks propagate; (c) final failure in SLJ specimens; and (d) final failure in R-SLJ specimens. Failure surfaces of a stepped-lap bonded specimen.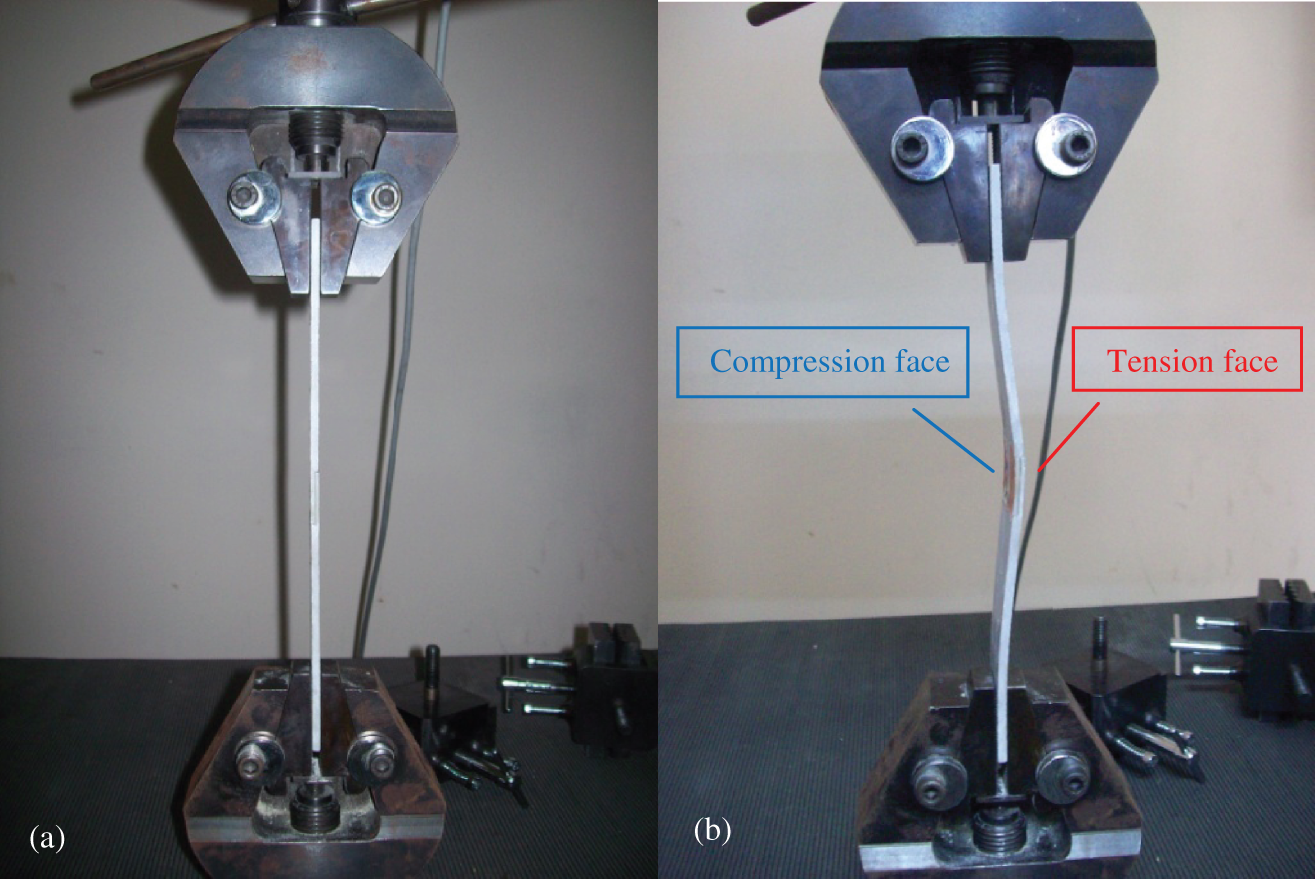
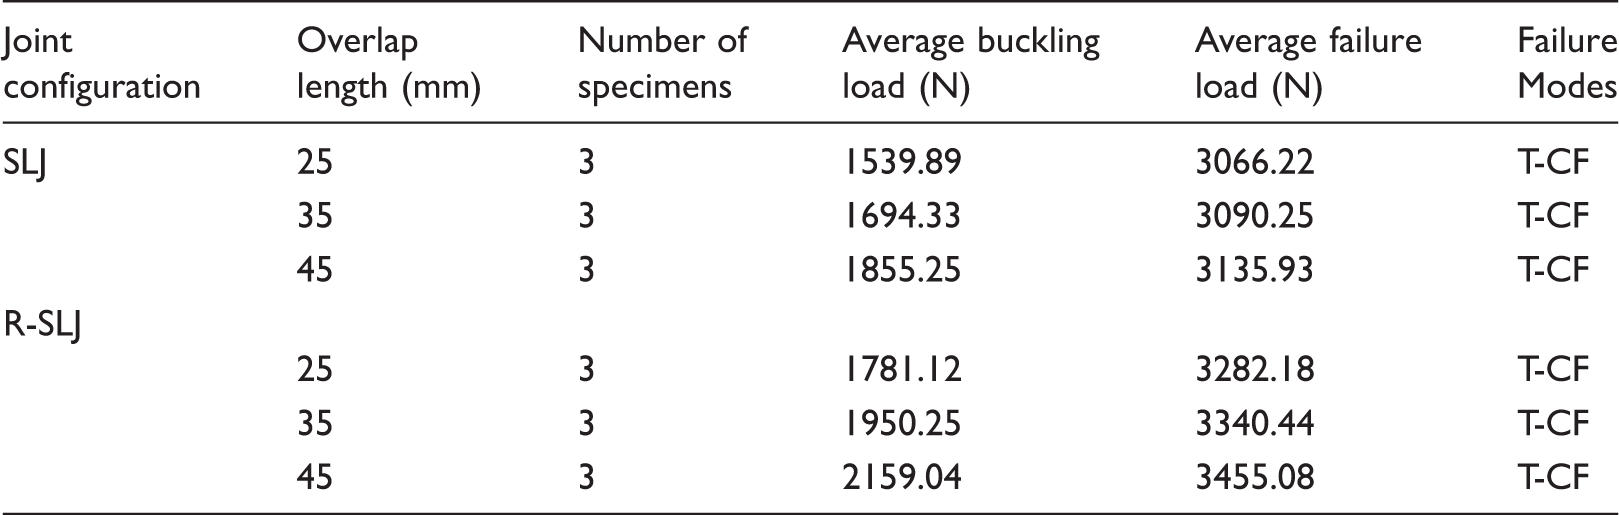
The experimental buckling and failure loads as a function of joint configuration and overlap length
Failure prediction method
The failures in adhesively bonded joints are mainly of two types, adhesive and cohesive; occurring mainly due to interfacial (adhesive) cracking, also called debonding, at geometric boundaries due to stress concentrations, or resulting from faulty joining in fabrication. Well-bonded joints should fail within the adhesive (cohesive) or within the adherends (interlaminar failure) when broken apart. Failure at the adherend–adhesive interface (interfacial failure) generally indicates that the bond is not performed properly. The continuum mechanics approach (stress based) provide a realistic description of the stresses and strains and information on the physical cause for material rupture. 46 There are other approaches such as cohesive zone modeling (CZM), which can be used for predicting debonding and composite failure. Recent work by Tserpes et al. 47 has investigated H-shaped adhesively bonded joints by using this approach. However, the parameters associated to the CZM require previous experimental ‘tuning’ and the user needs to know beforehand where the failure is likely to occur.
Adhesive failure stress criterion
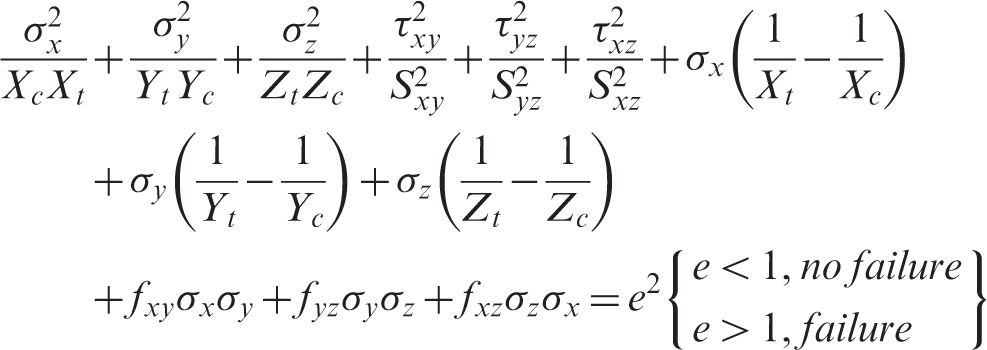
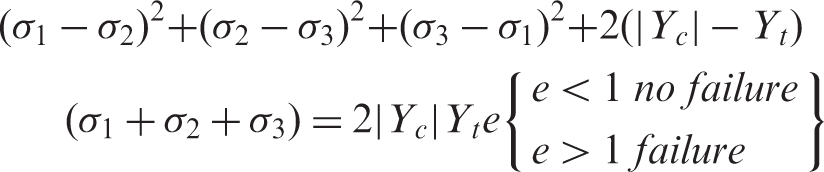
Under the 3D stress states in the overlap region, the failure generally can be evaluated by the Tsai–Wu quadratic failure criterion,
48
which takes into account the interaction of all six stress components as given by
Cohesive failure stress criterion
Cohesive failure is the rupture of an adhesively bonded joint, such that the separation is within the adhesive. Thin-layer cohesive failure, failure similar to cohesive failure, except that the failure is very close to the adhesive–adherend interface, characterized by a ‘light dusting’ of adhesive on one adherend surface and a thick layer of adhesive left of the other. Raghava et al.’s
50
parabolic criterion was used for the isotropic adhesive layer. This criterion is a modified version of the von-Mises yield criterion that takes into account of hydrostatic pressure and can be written as
Finite element modeling
The numerical analysis was performed in three steps. First step consists of computing the critical buckling loads as well as their corresponding buckling modes. In the second step, the calculated buckling load was applied to the model to get stress distributions over the different surfaces in the overlap region of SLJ and R-SLJ configurations. Three surfaces, (i) the bottom adherend–adhesive interface, (ii) the top adherend–adhesive interface (loaded side), and (iii) mid-plane of the adhesive layer were the critical locations of interest of the present study (Figure 7). It was known from the experiments that initial cracks initiate at the butt part on the edge of the adhesive layer; therefore the following paths belongs to the butt part of the joints noted in Figure 7 were under suspicion:
Path #1: Line ‘ab’ which belongs to the interface between bottom adherend and adhesive interface. Path #2: Line ‘cd ’ which belongs to middle of the adhesive layer. Path #3: Line ‘ef ’ which belongs to the interface between top adherend and adhesive interface. Critical locations of the SLJ and R-SLJ joints.
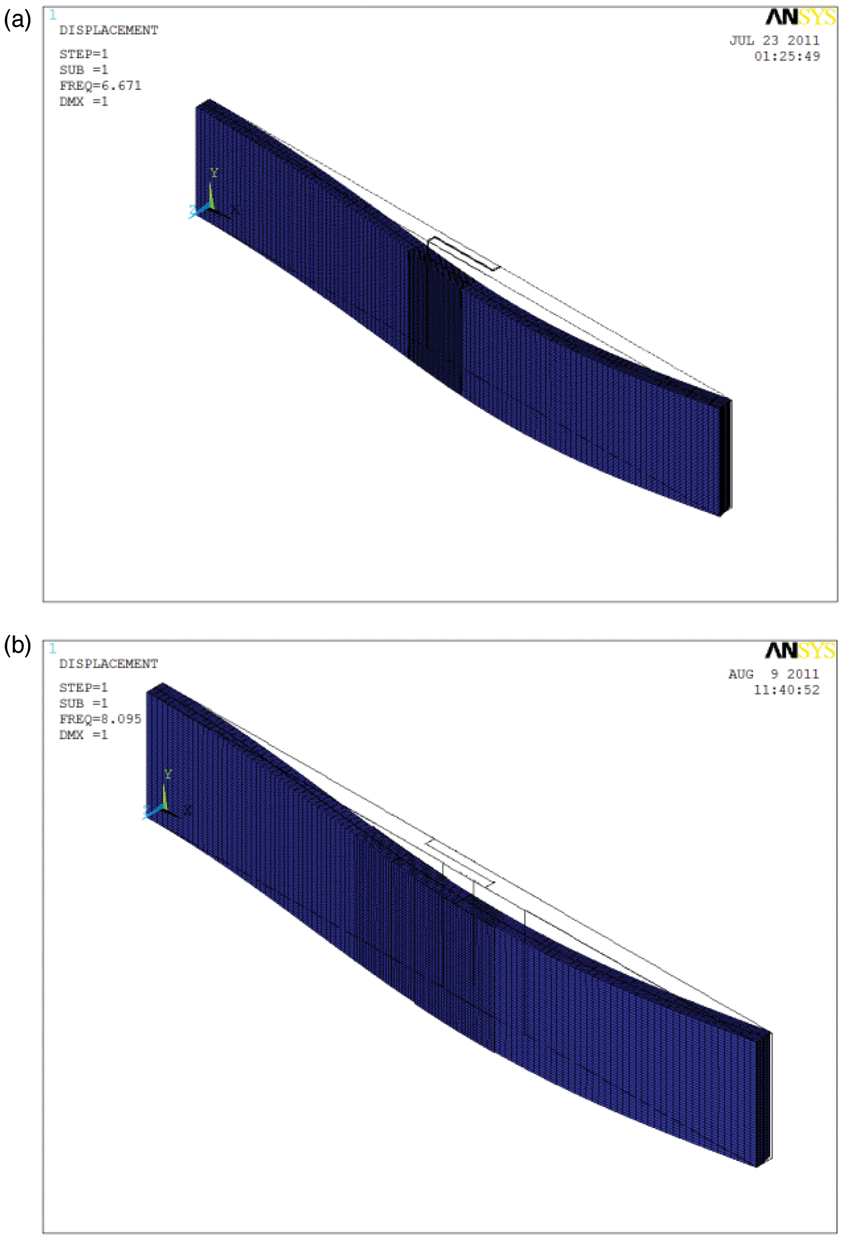
The interfaces between the adhesive and the composite patches were not considered in this study. In the third step, after knowing the stresses in the global Cartesian coordinates, the normal and shear stresses in the critical paths, which are responsible for the damages in the overlap region in SLJ and R-SLJ joints, were used to compute failure index (e) values. The behavior of all the members was assumed to be linear elastic. It was assumed that the medium was continuous and perfectly defect-free. All dimensions were similar to the experimental joints in order to provide acceptable comparison. The SOLID 46 elements were used for meshing of the composite adherends and the patches and the SOLID 45 elements were used for the adhesive layer. A very fine mesh was adopted to take care of high stress gradients at the edges of the overlap portion of the joints. In order to achieve convergence, the element size reduced gradually in the overlap region until the reasonable results were obtained. The adhesive layer divided into eight elements in the thickness direction to increase computation accuracy. More specifically, 119,952 nodes and 109,500 elements used for the SLJ modeling. 114,540 nodes and 104,625 elements used for the R-SLJ modeling. To simulate clamped loaded edges, the displacements UX, UY, UZ and the rotations ROTX, ROTY, ROTZ of all nodes at edges were set equal to zero and the other end was constrained from y and z displacements and the rotations ROTX, ROTY, ROTZ. In order to calculate the buckling factor of the joints, unit pressure load was applied to this end in the x direction (Figure 8). Buckling factor obtained by the analysis was multiplied by the cross section area to get the buckling load (e.g. 6.671 N/mm2 × 240 mm2 = 1601.04 N).The first buckling mode shape of both type of joints were shown in Figure 9.
Boundary and loading conditions for: (a) SLJ; (b) R-SLJ. First buckling mode shape for: (a) SLJ; (b) R-SLJ.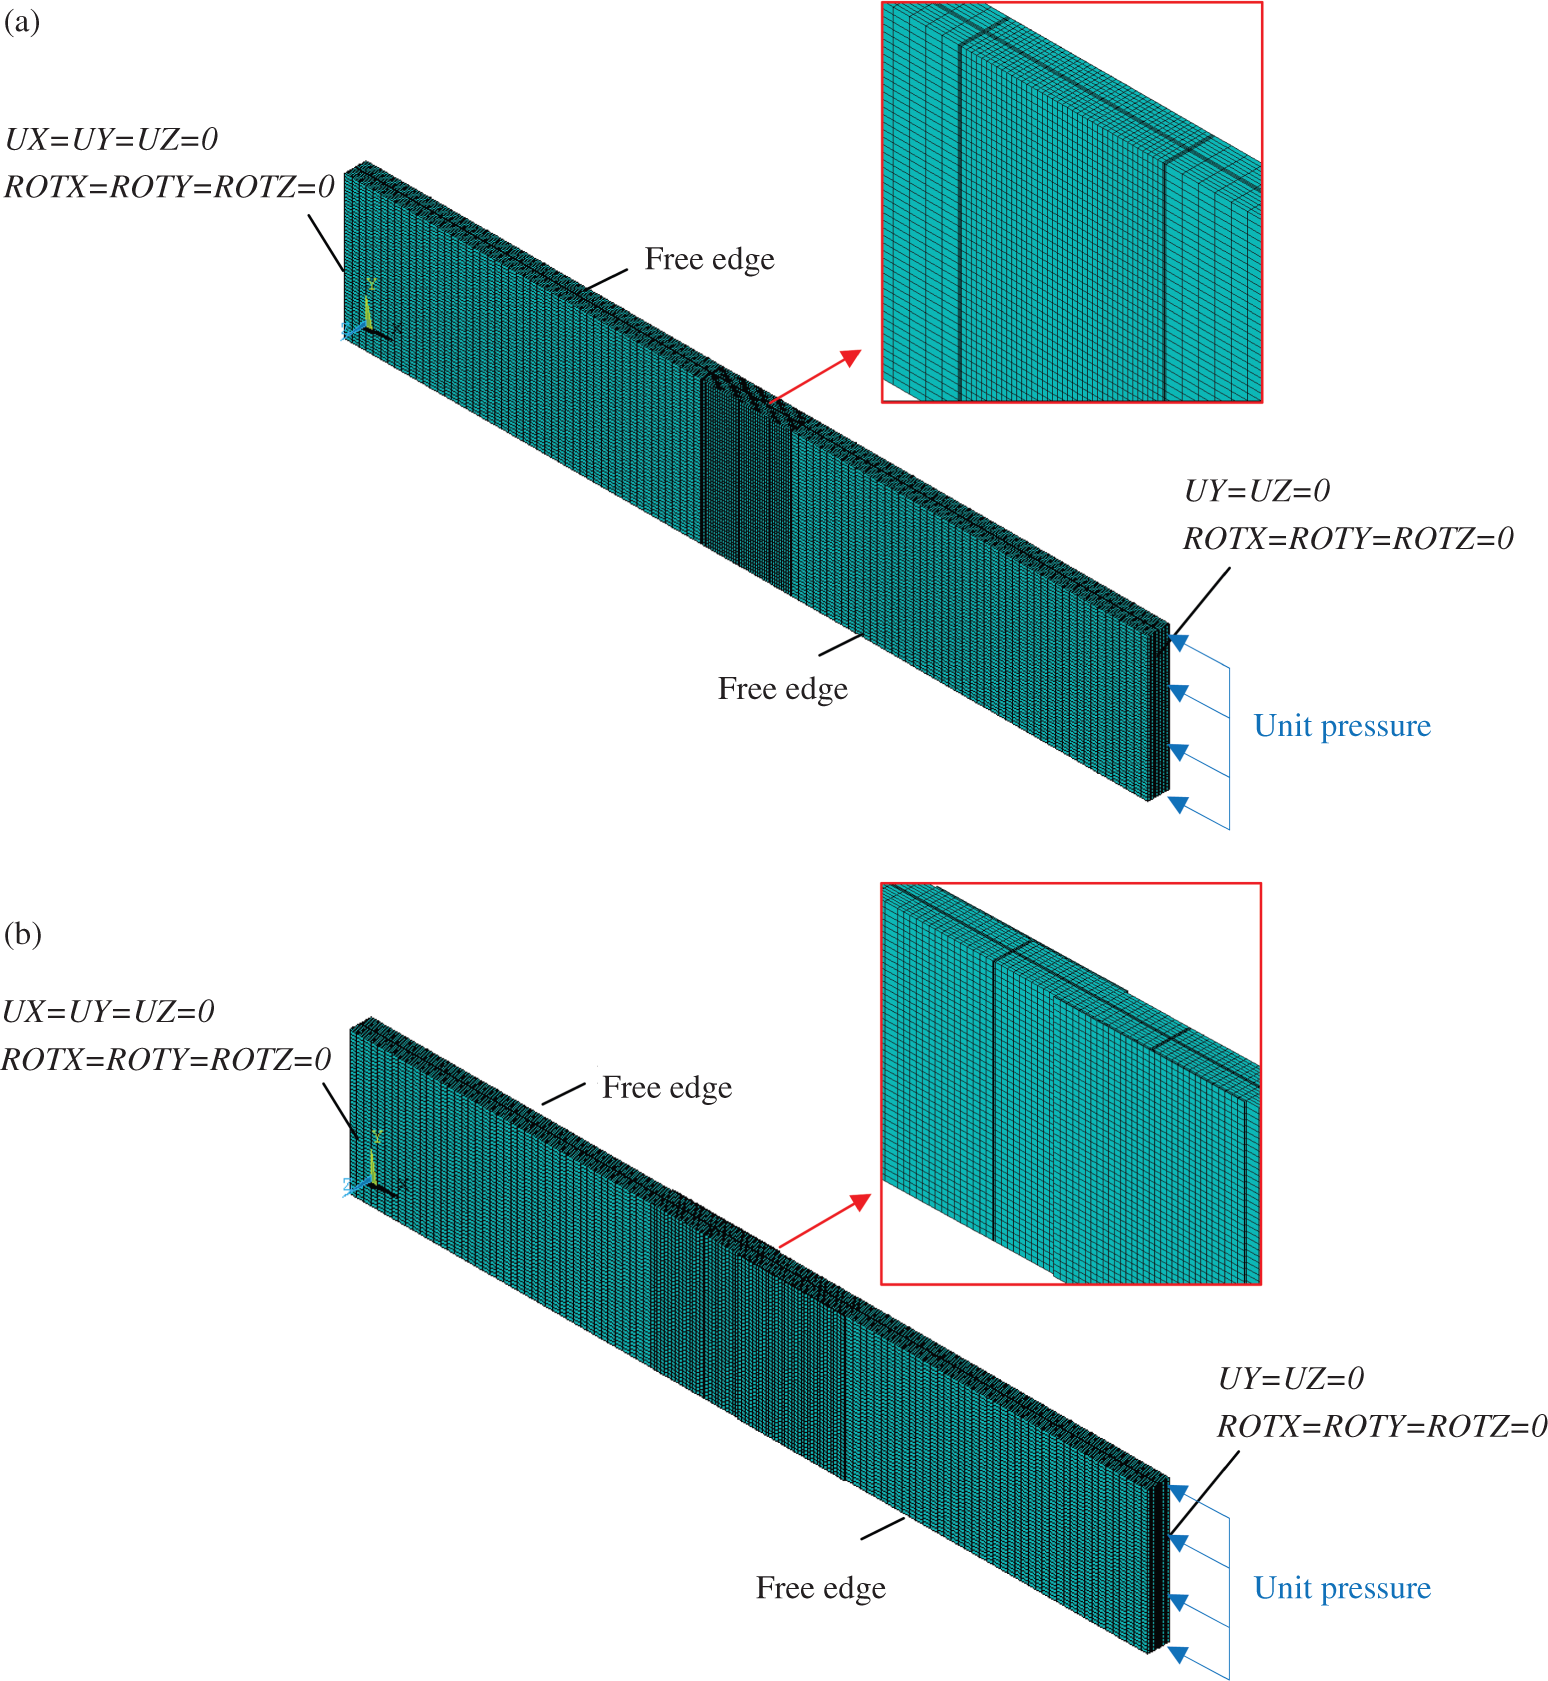
Numerical results
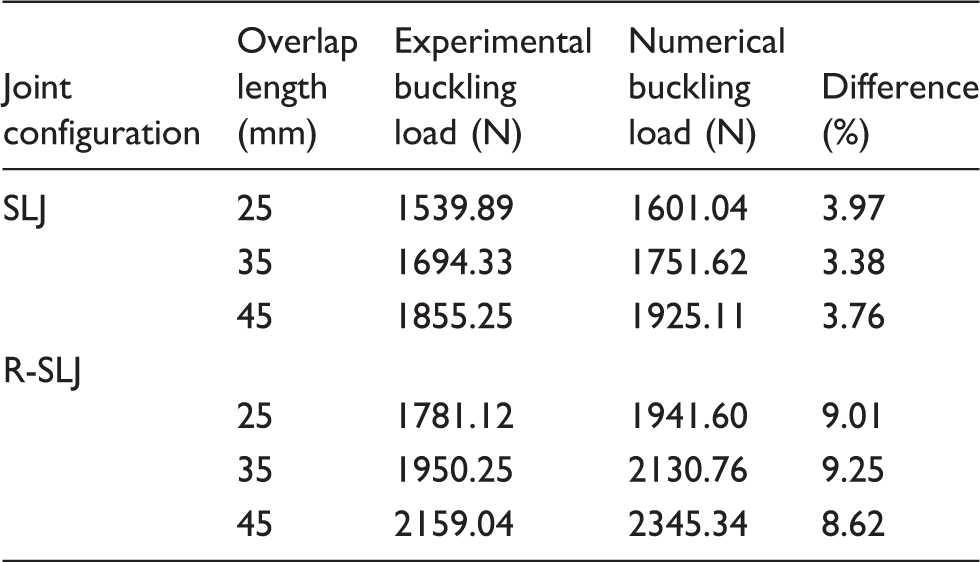
The comparison of the buckling loads from experiments and FEA for all scenarios
Conventional stepped-lap joints
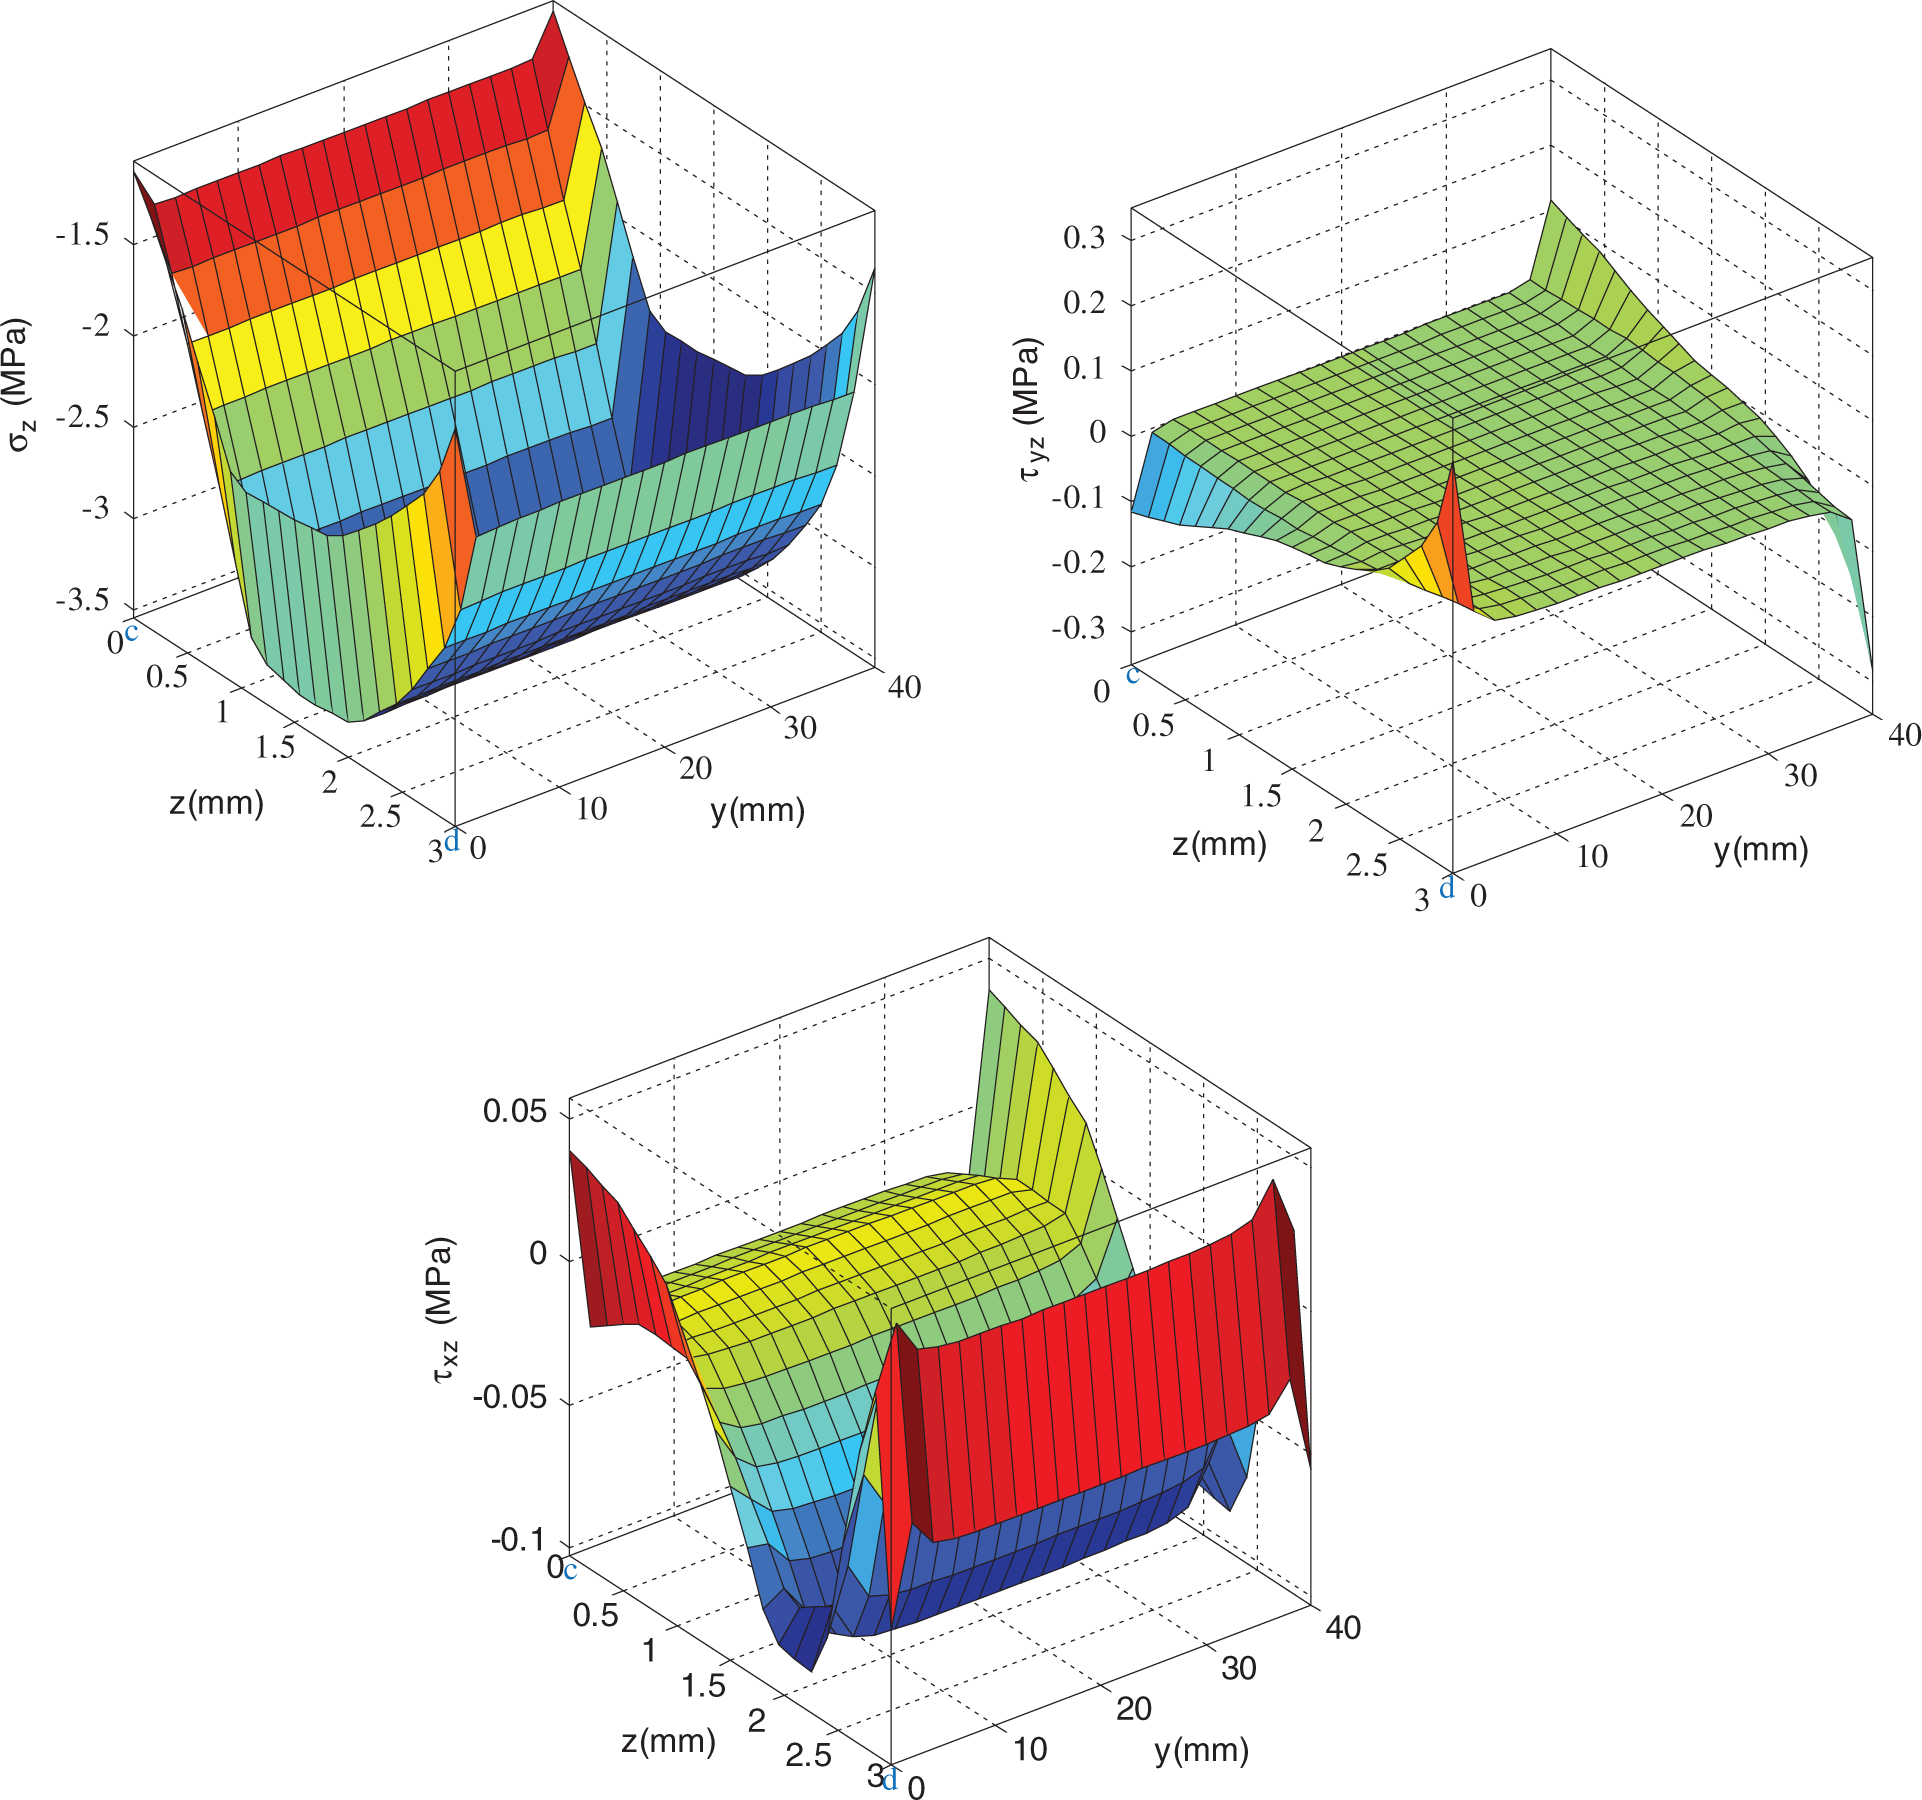
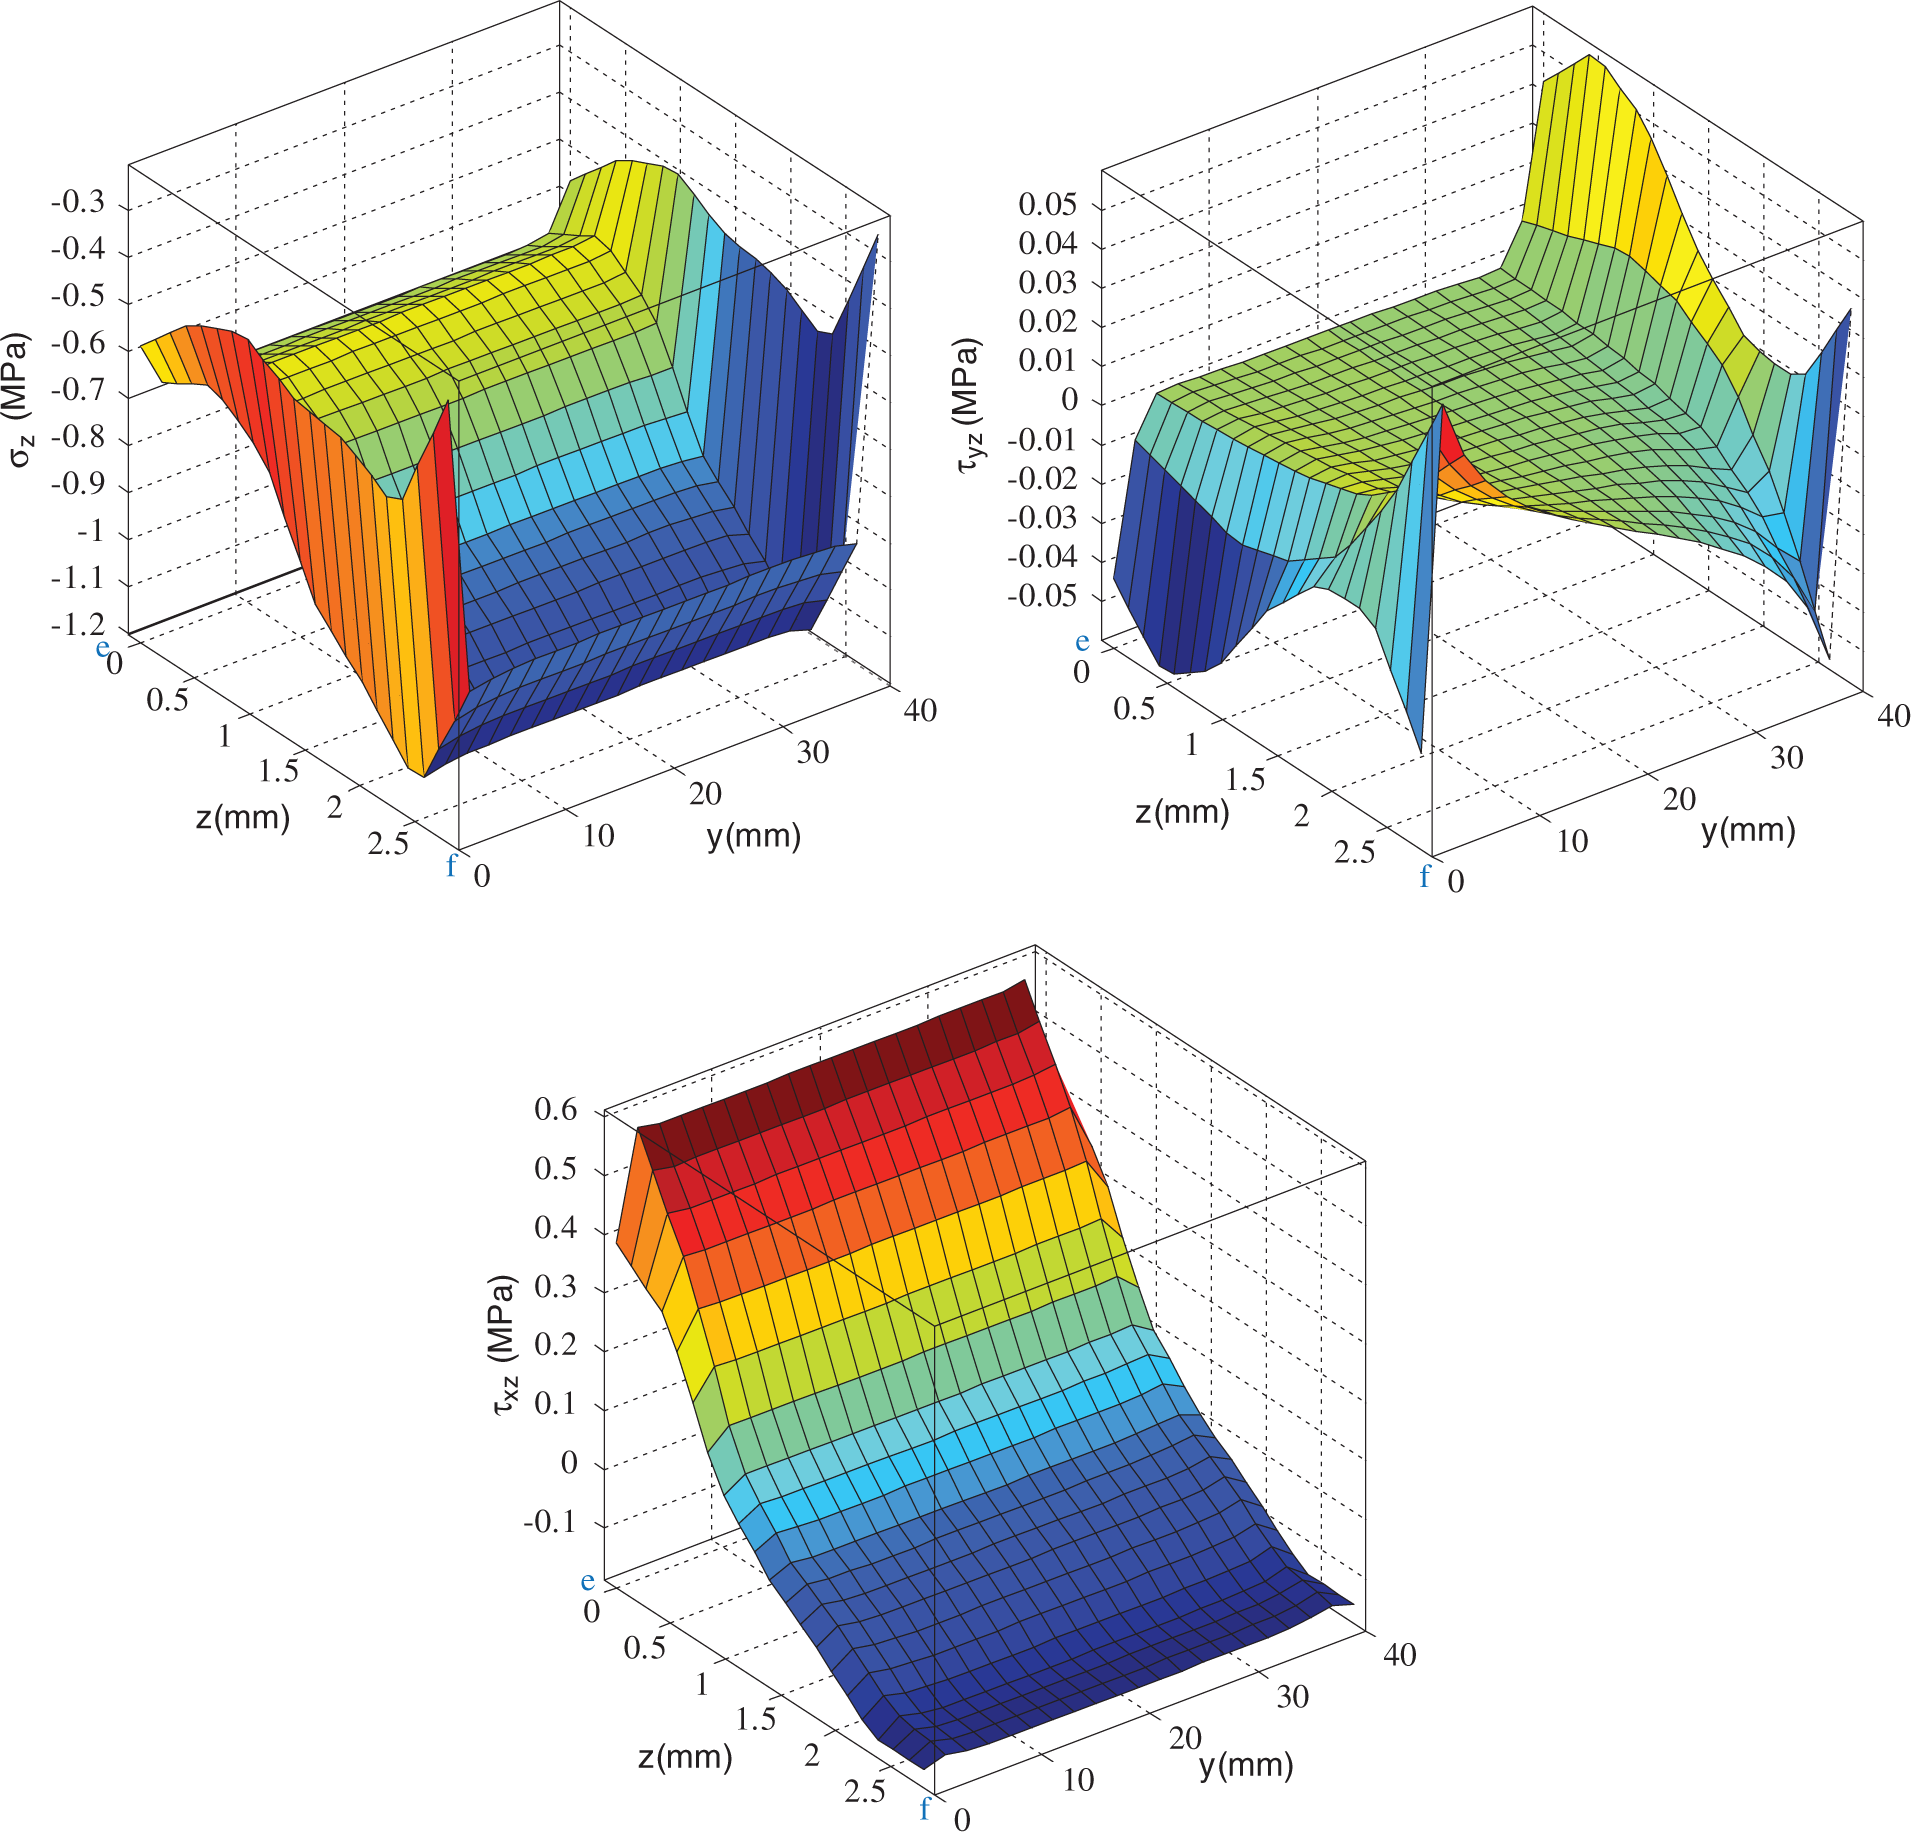
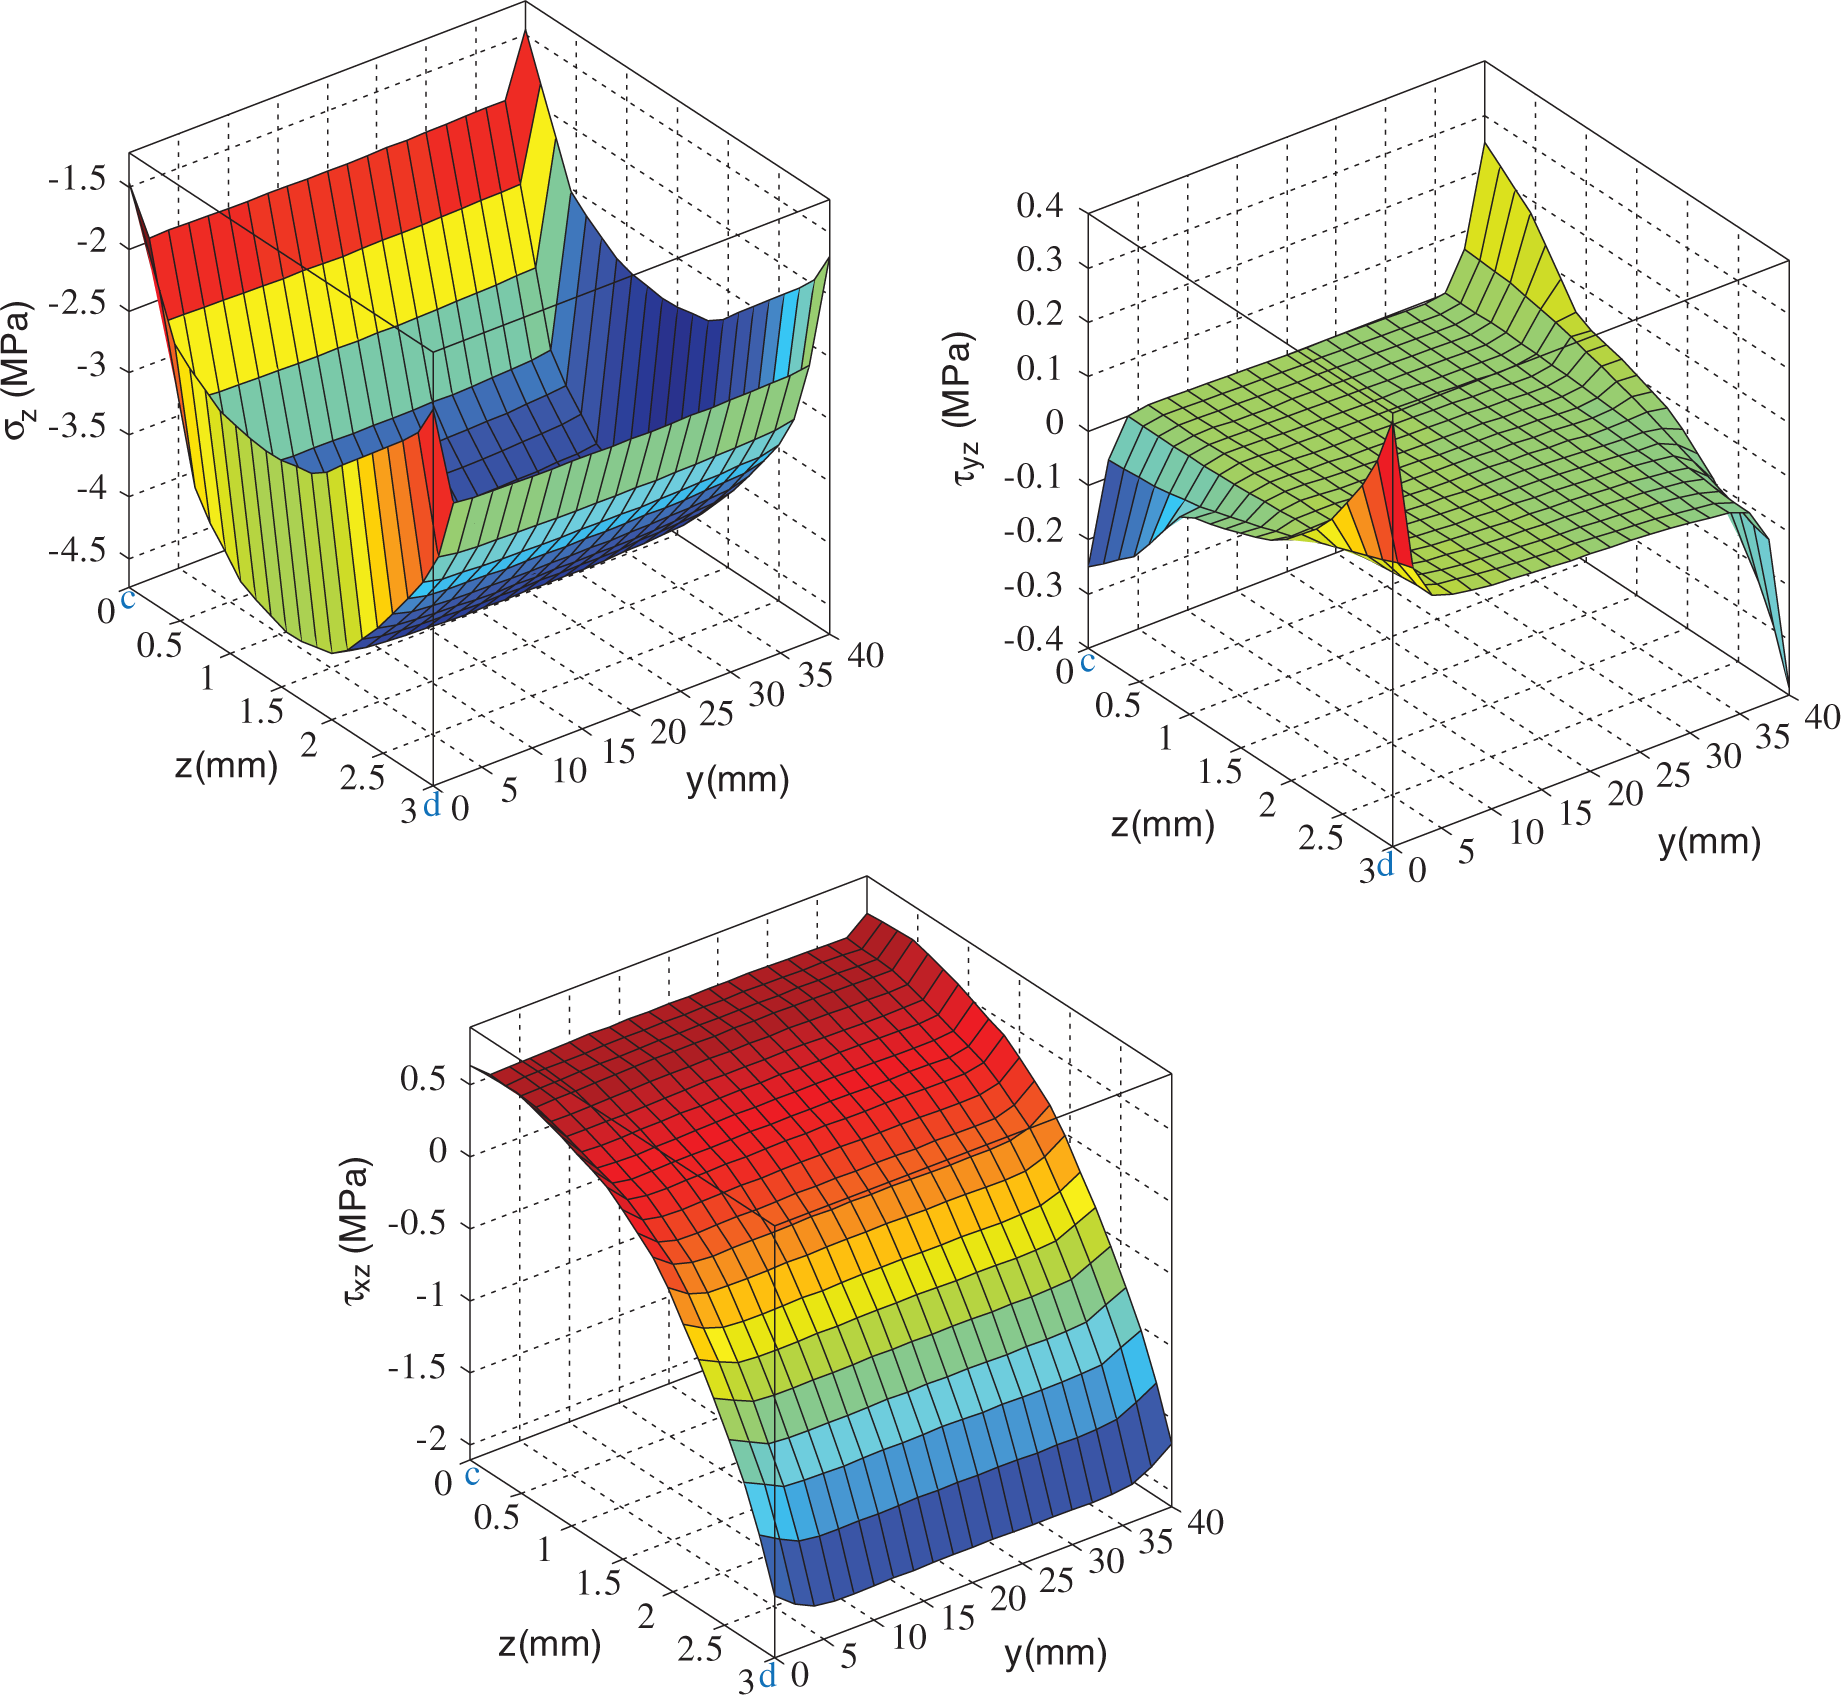
The 3D FEM calculations were carried out in the elastic deformation range. At the edge of interfaces between dissimilar elastic bodies, it was known that a singular stress occurs. The thin-layer cohesive failure is closely related to the peel failure. Peel stresses are extensional stresses in the through-thickness direction of the bond. The peeling effect is crucial to the failure behavior of adhesively bonded joints. Figures 10 and 11 shows the out-plane stress distribution at the butted adherend–adhesive interfaces. The overlap length was 25 mm. The peel stress (σz) was compressive and higher at the bottom adherend–adhesive interface than the top adherend–adhesive interface. The peel stresses took its maximum value between the corners of the paths mentioned before. Three-dimensional effects can be observed. The out-of-plane shear stress (τxz) was simply reversed and there was no such characteristic for the τyz component. The out-of-plane shear stress (τxz) was less sensitive to 3D effect. Out-of-plane stress distribution along the mid-surface of the adhesive layer was shown in Figure 12. It is interesting to note that the peel stress in the adhesive layer was maximum compared to adhesive–adherend interfaces. It was seen that the peak stresses were located close to the ends of the overlap. In Figures 10 and 12, it can be observed that interlaminar stresses (planes) are lower than those in the adhesive (interfacial and mid plane). Depending on the respective strengths, an interlaminar, cohesive, or adhesive failure may occur. For similar strengths, it can be noted that an interlaminar failure has minor chances of occurring. This can be explained by the lower stiffness of the adherends, which caused to higher rotation at the overlap region and increases the risk of interlaminar failure. Similar stress distribution was observed for the other overlap length values. Stress distribution in the lapped part of the joints was similar to the previous work done by the authors
51
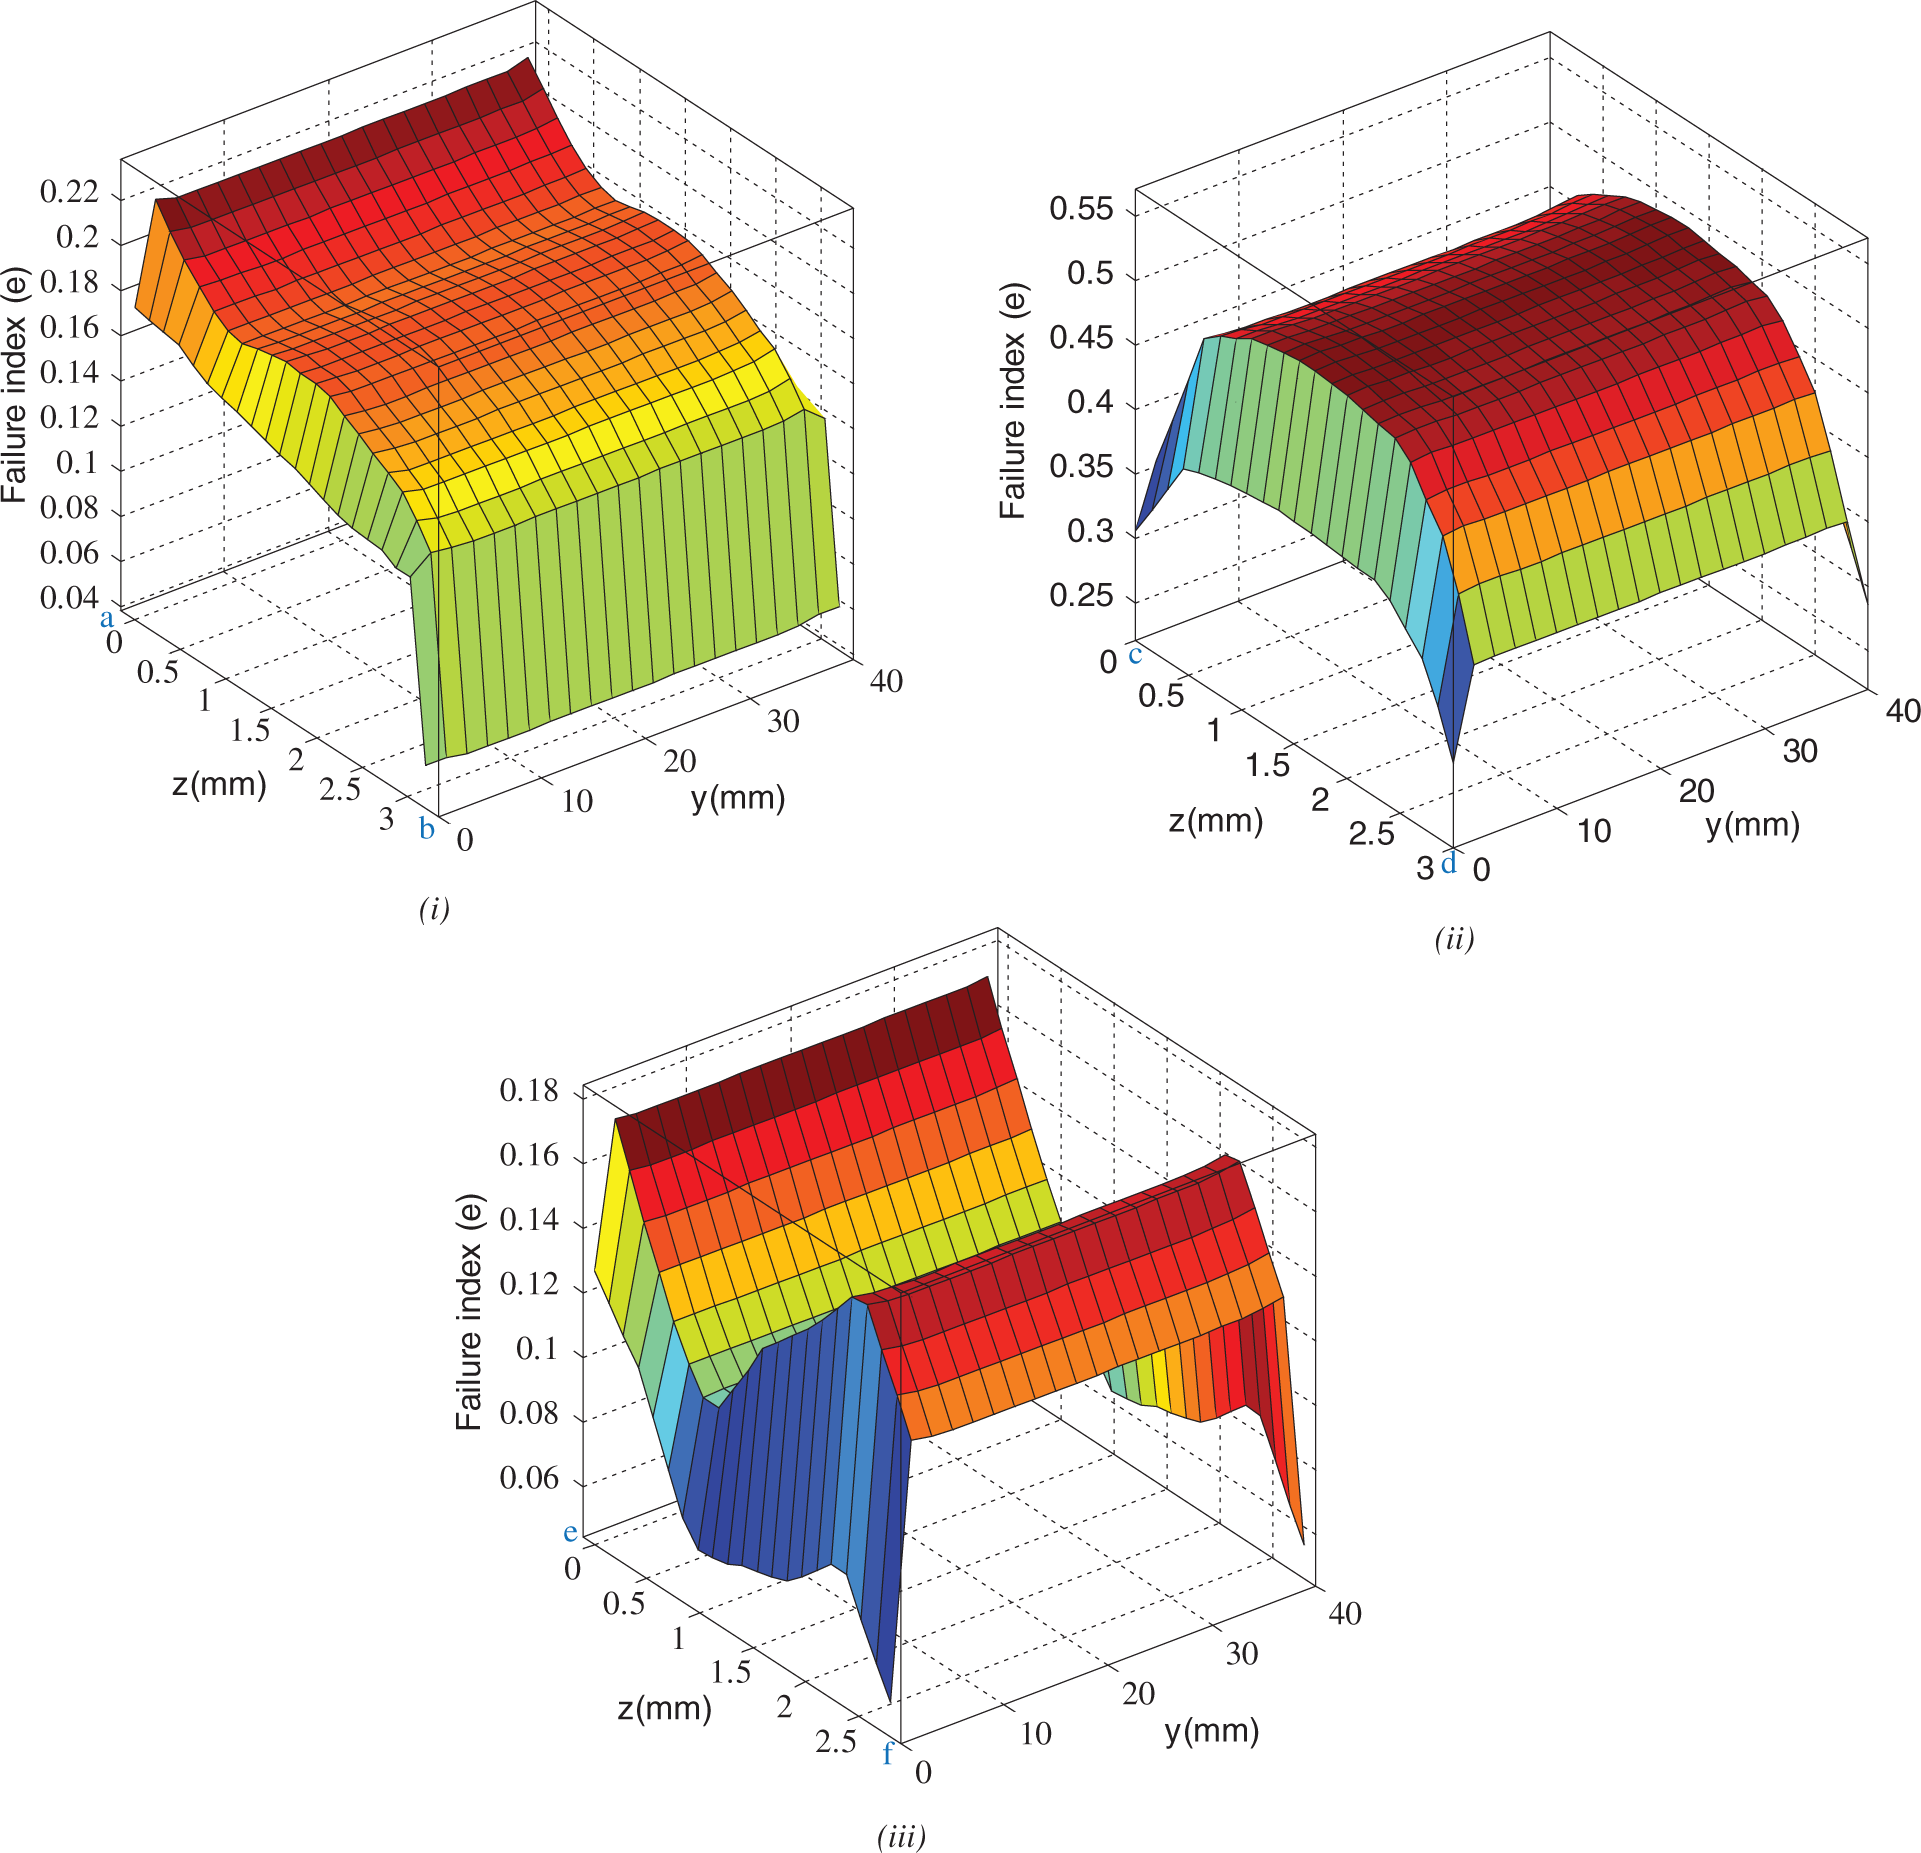
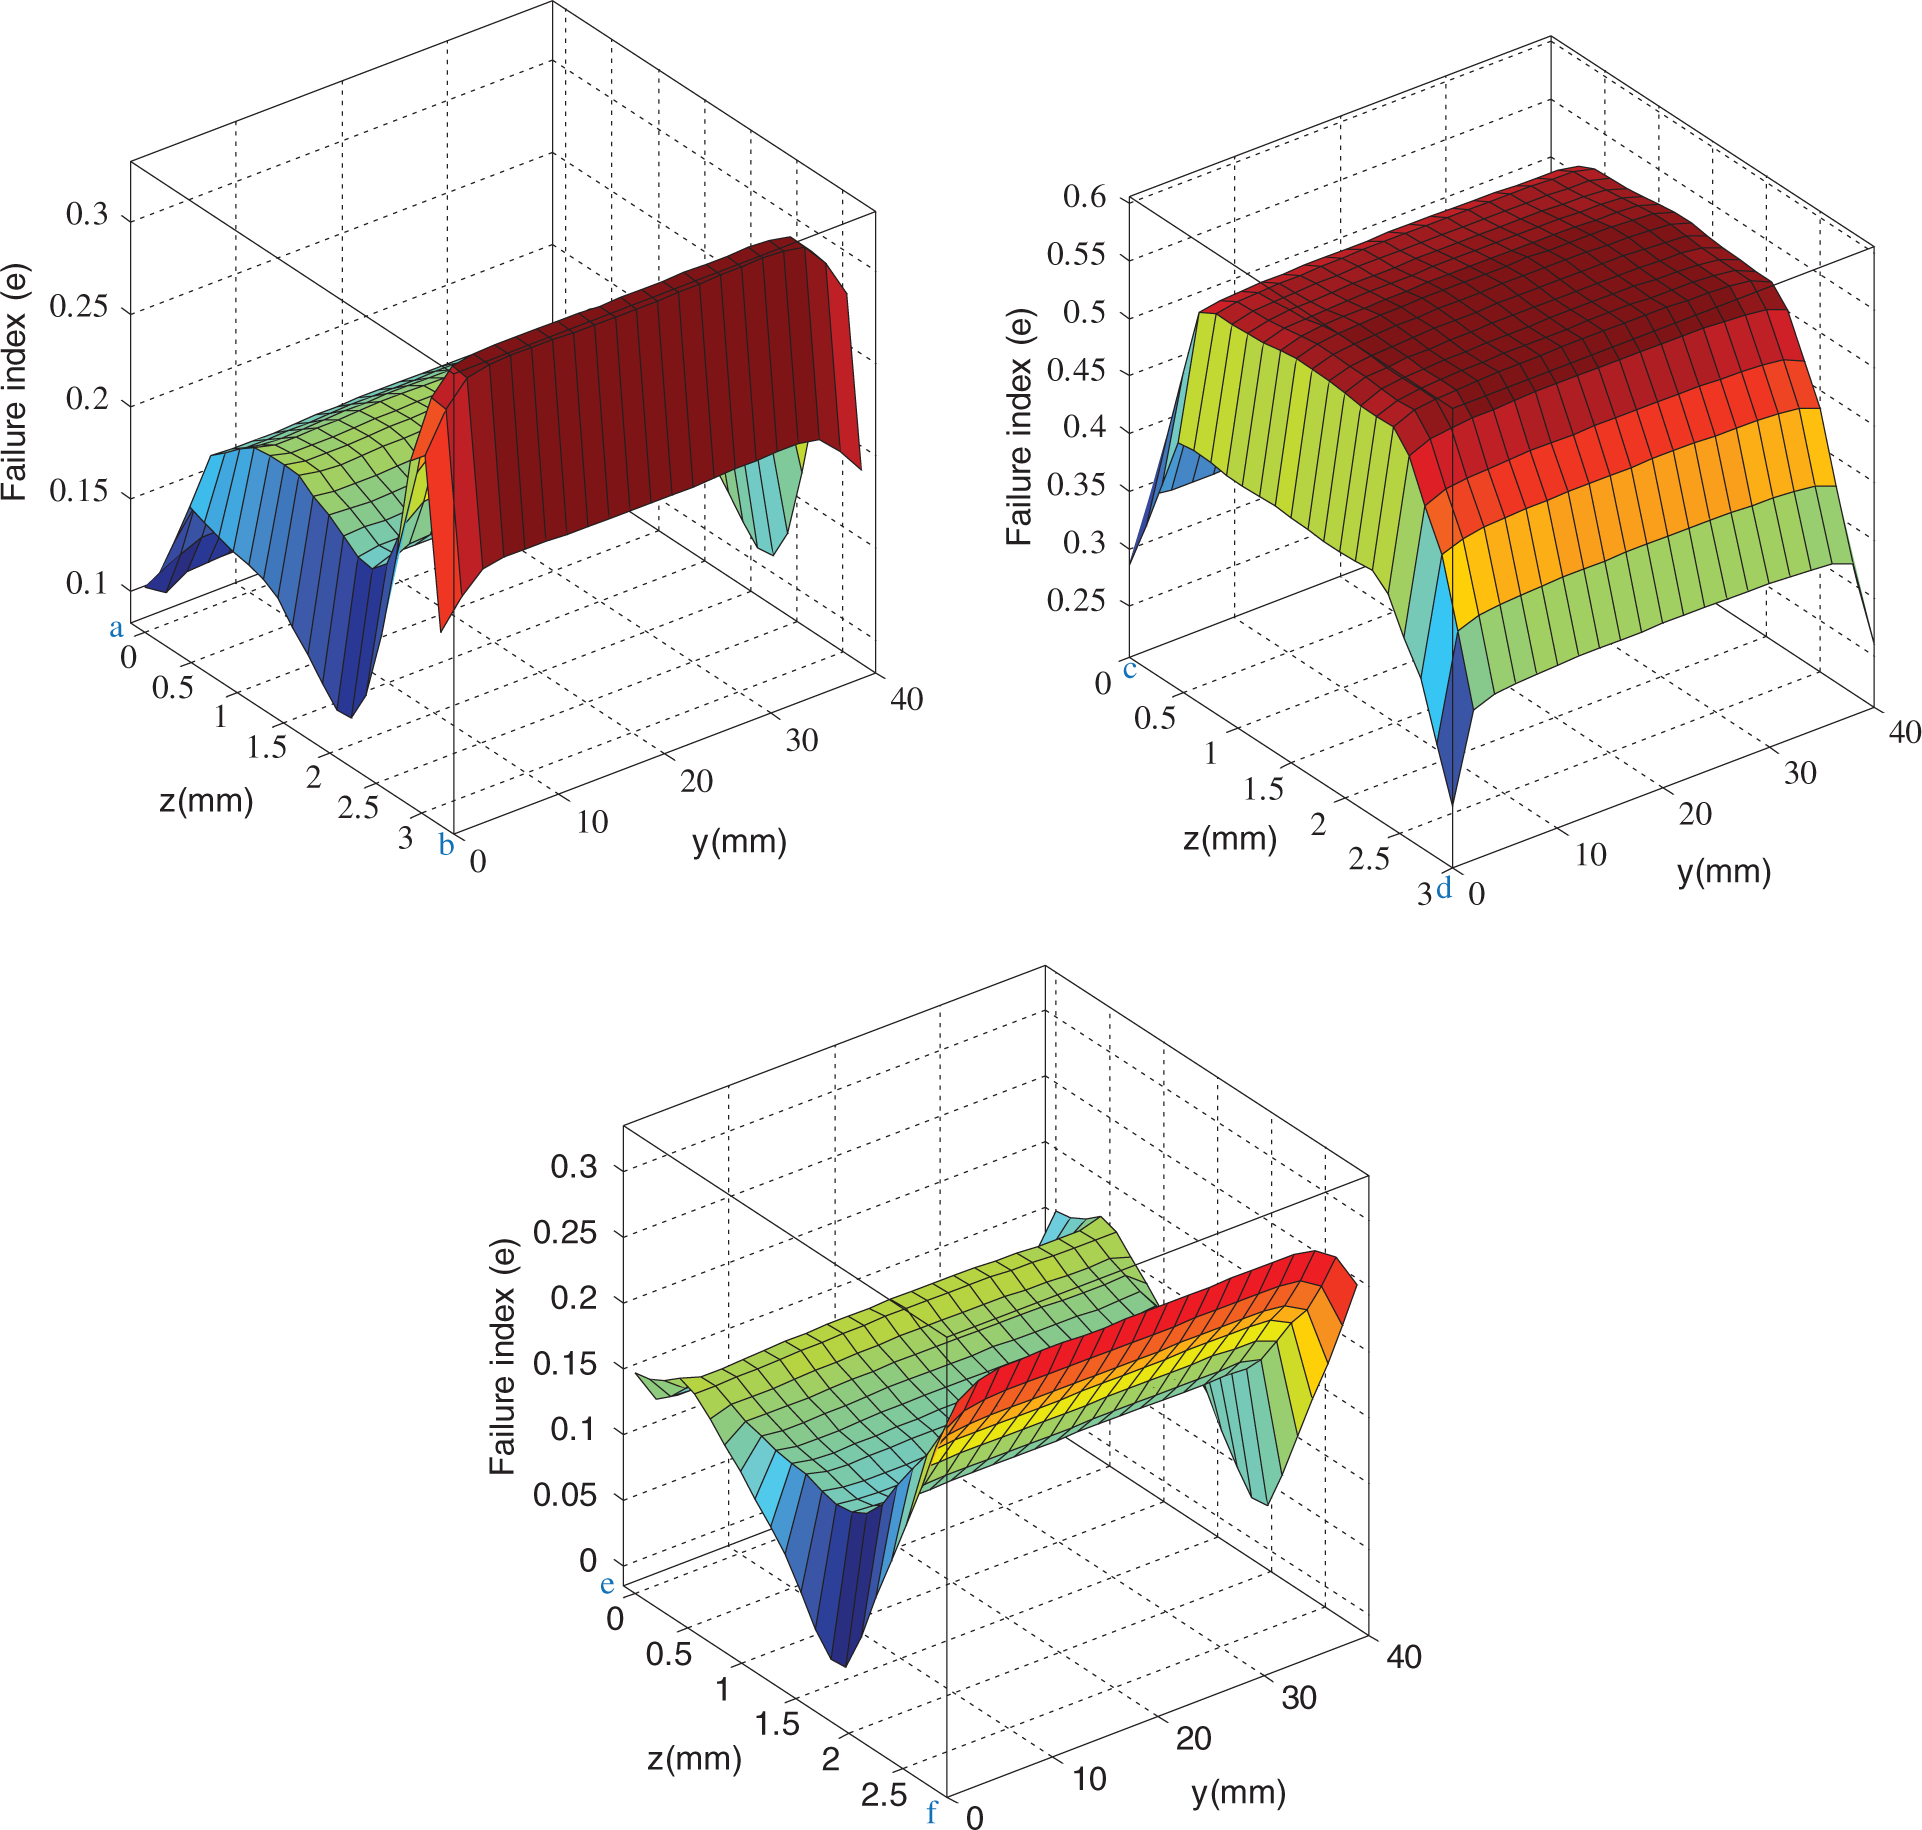
for the single-lap joints. In the other butted part of the joints which was much closer to the loaded end the stress distribution was simply reversed; therefore it will not be shown in here. The shear stress and normal stress in the adhesive layer are responsible for the initiation of the failure of the joints. Using equations (1) and (2), failure index (e) was calculated for the adherend–adhesive interface surface and adhesive layer, respectively. It was defined as the parameter to predict the strength of the joint. The distributions of failure index over the critical surfaces were shown in Figure 13. The possibility of failure initiation would be from the adhesive layer between the critical points ‘c’ and ‘d ’, because the value of failure index (e) was the highest compared to the other locations.
Out-of-plane stress distribution along the interface of bottom adherend and adhesive layer. Out-of-plane stress distribution along the interface of top adherend and adhesive layer. Out-of-plane stress distribution along the mid-plane of the adhesive layer. Distribution of failure indices: (i) at the interface of bottom adherend and adhesive; (ii) in the mid-plane of adhesive layer; and (iii) at the interface of top adherend and adhesive.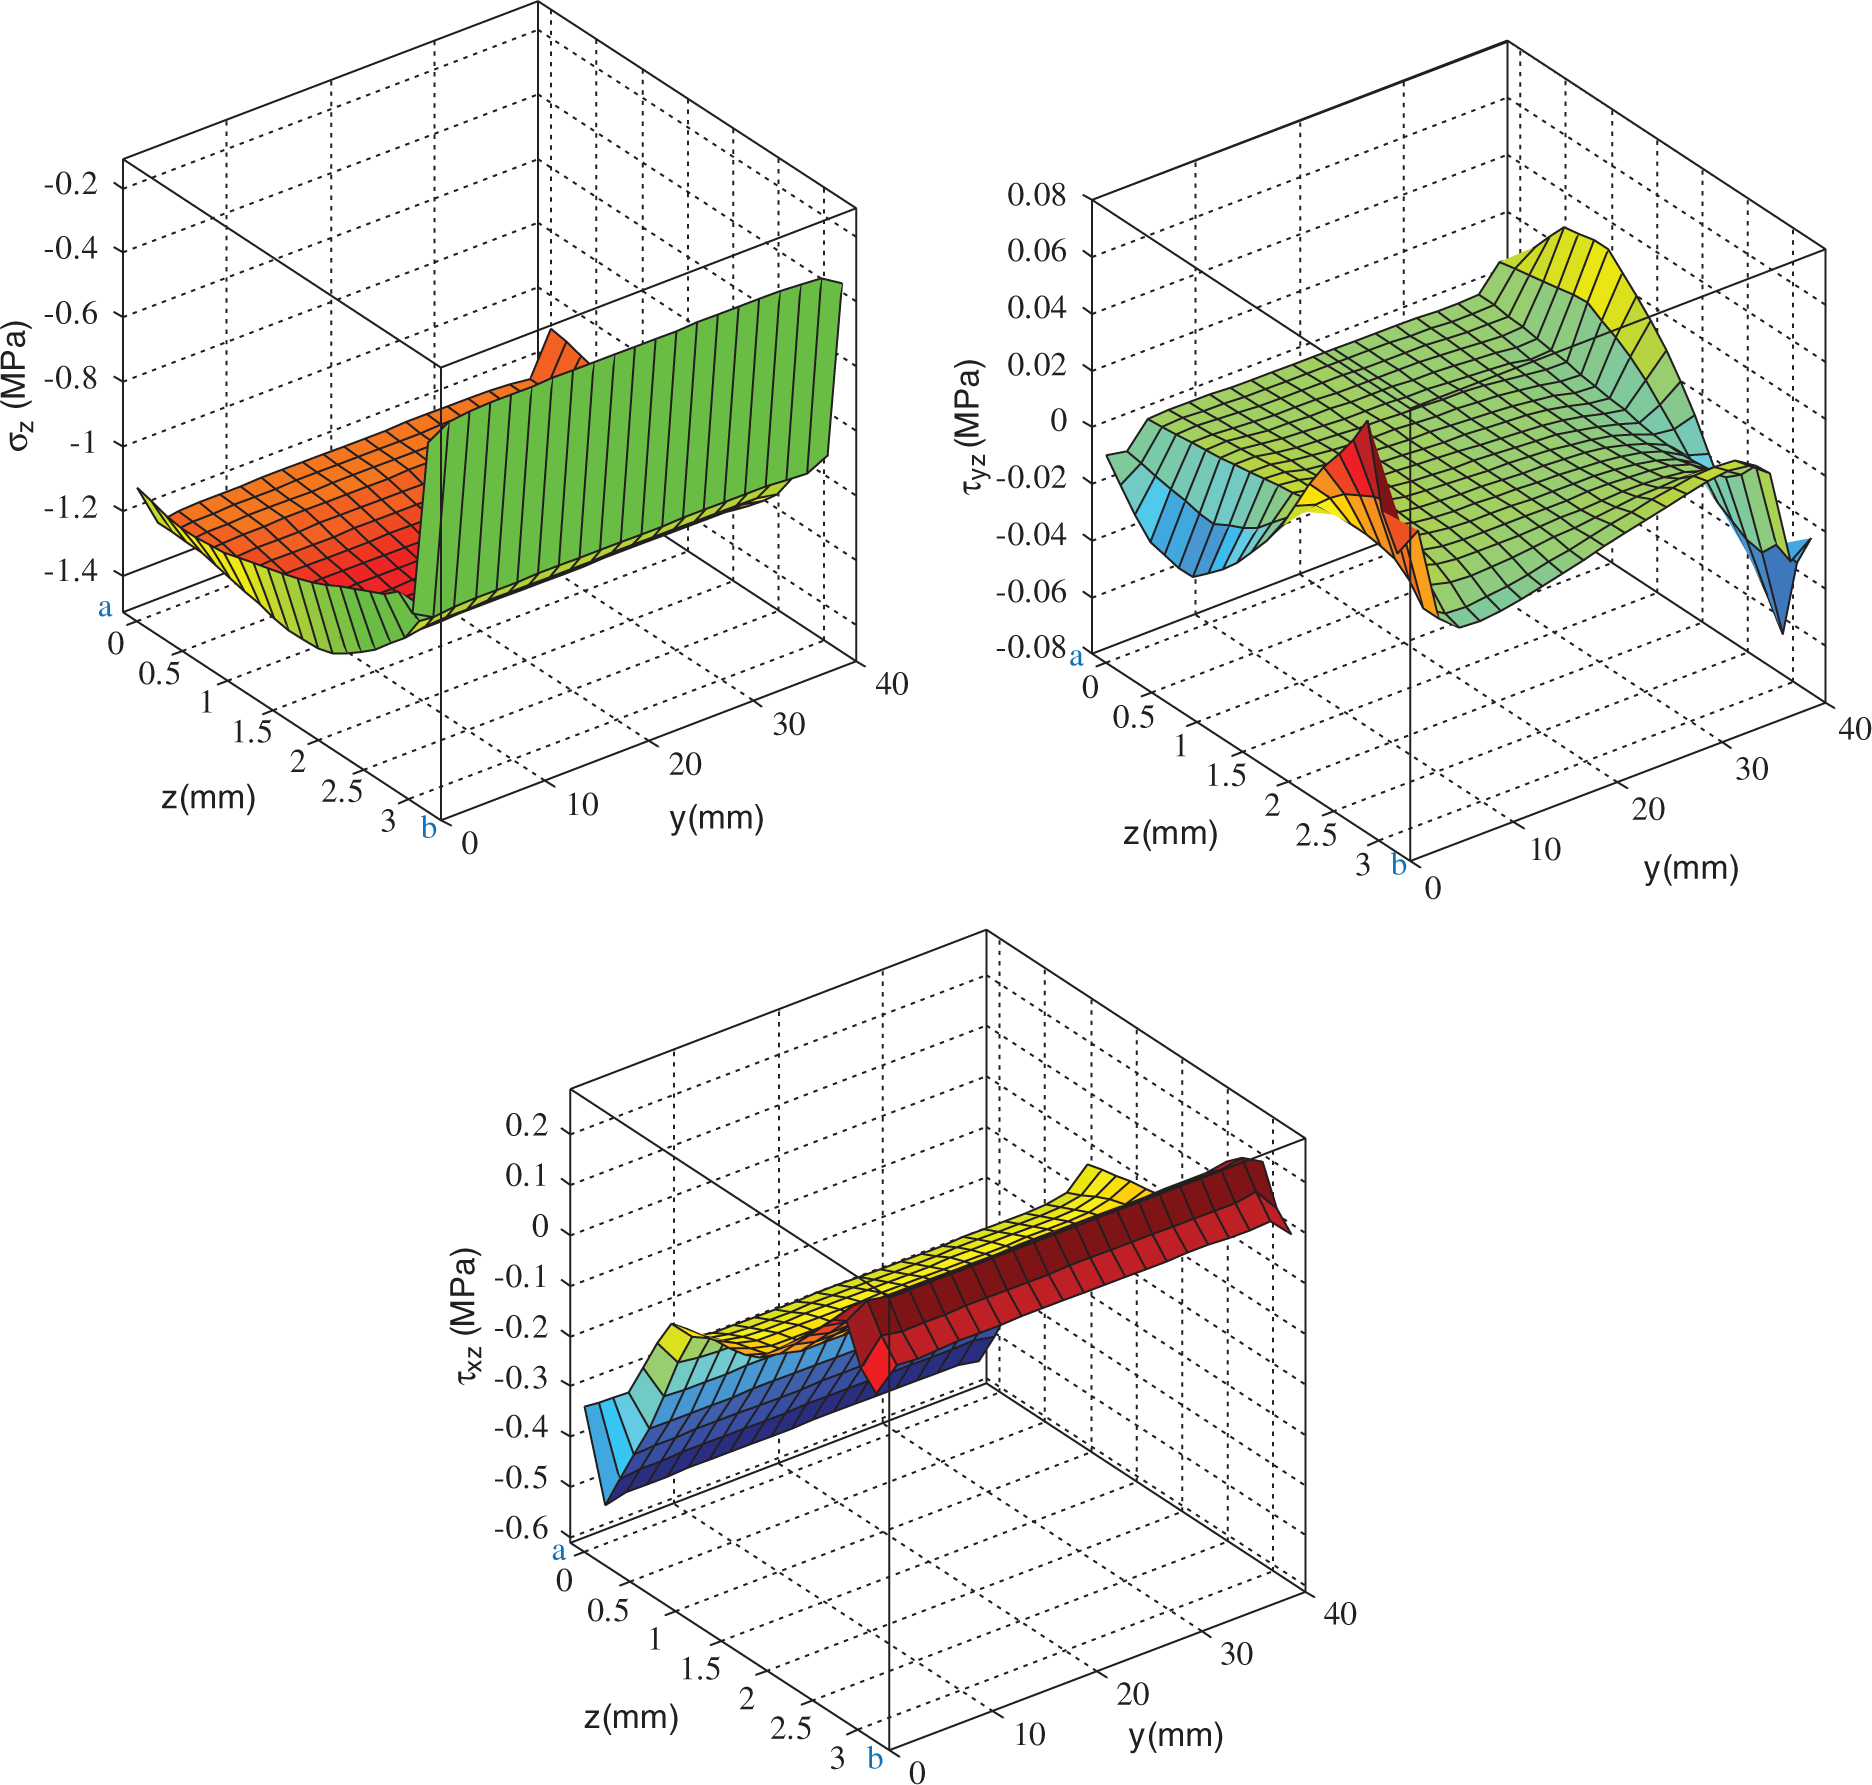
Stepped-lap joints repaired with composite patches
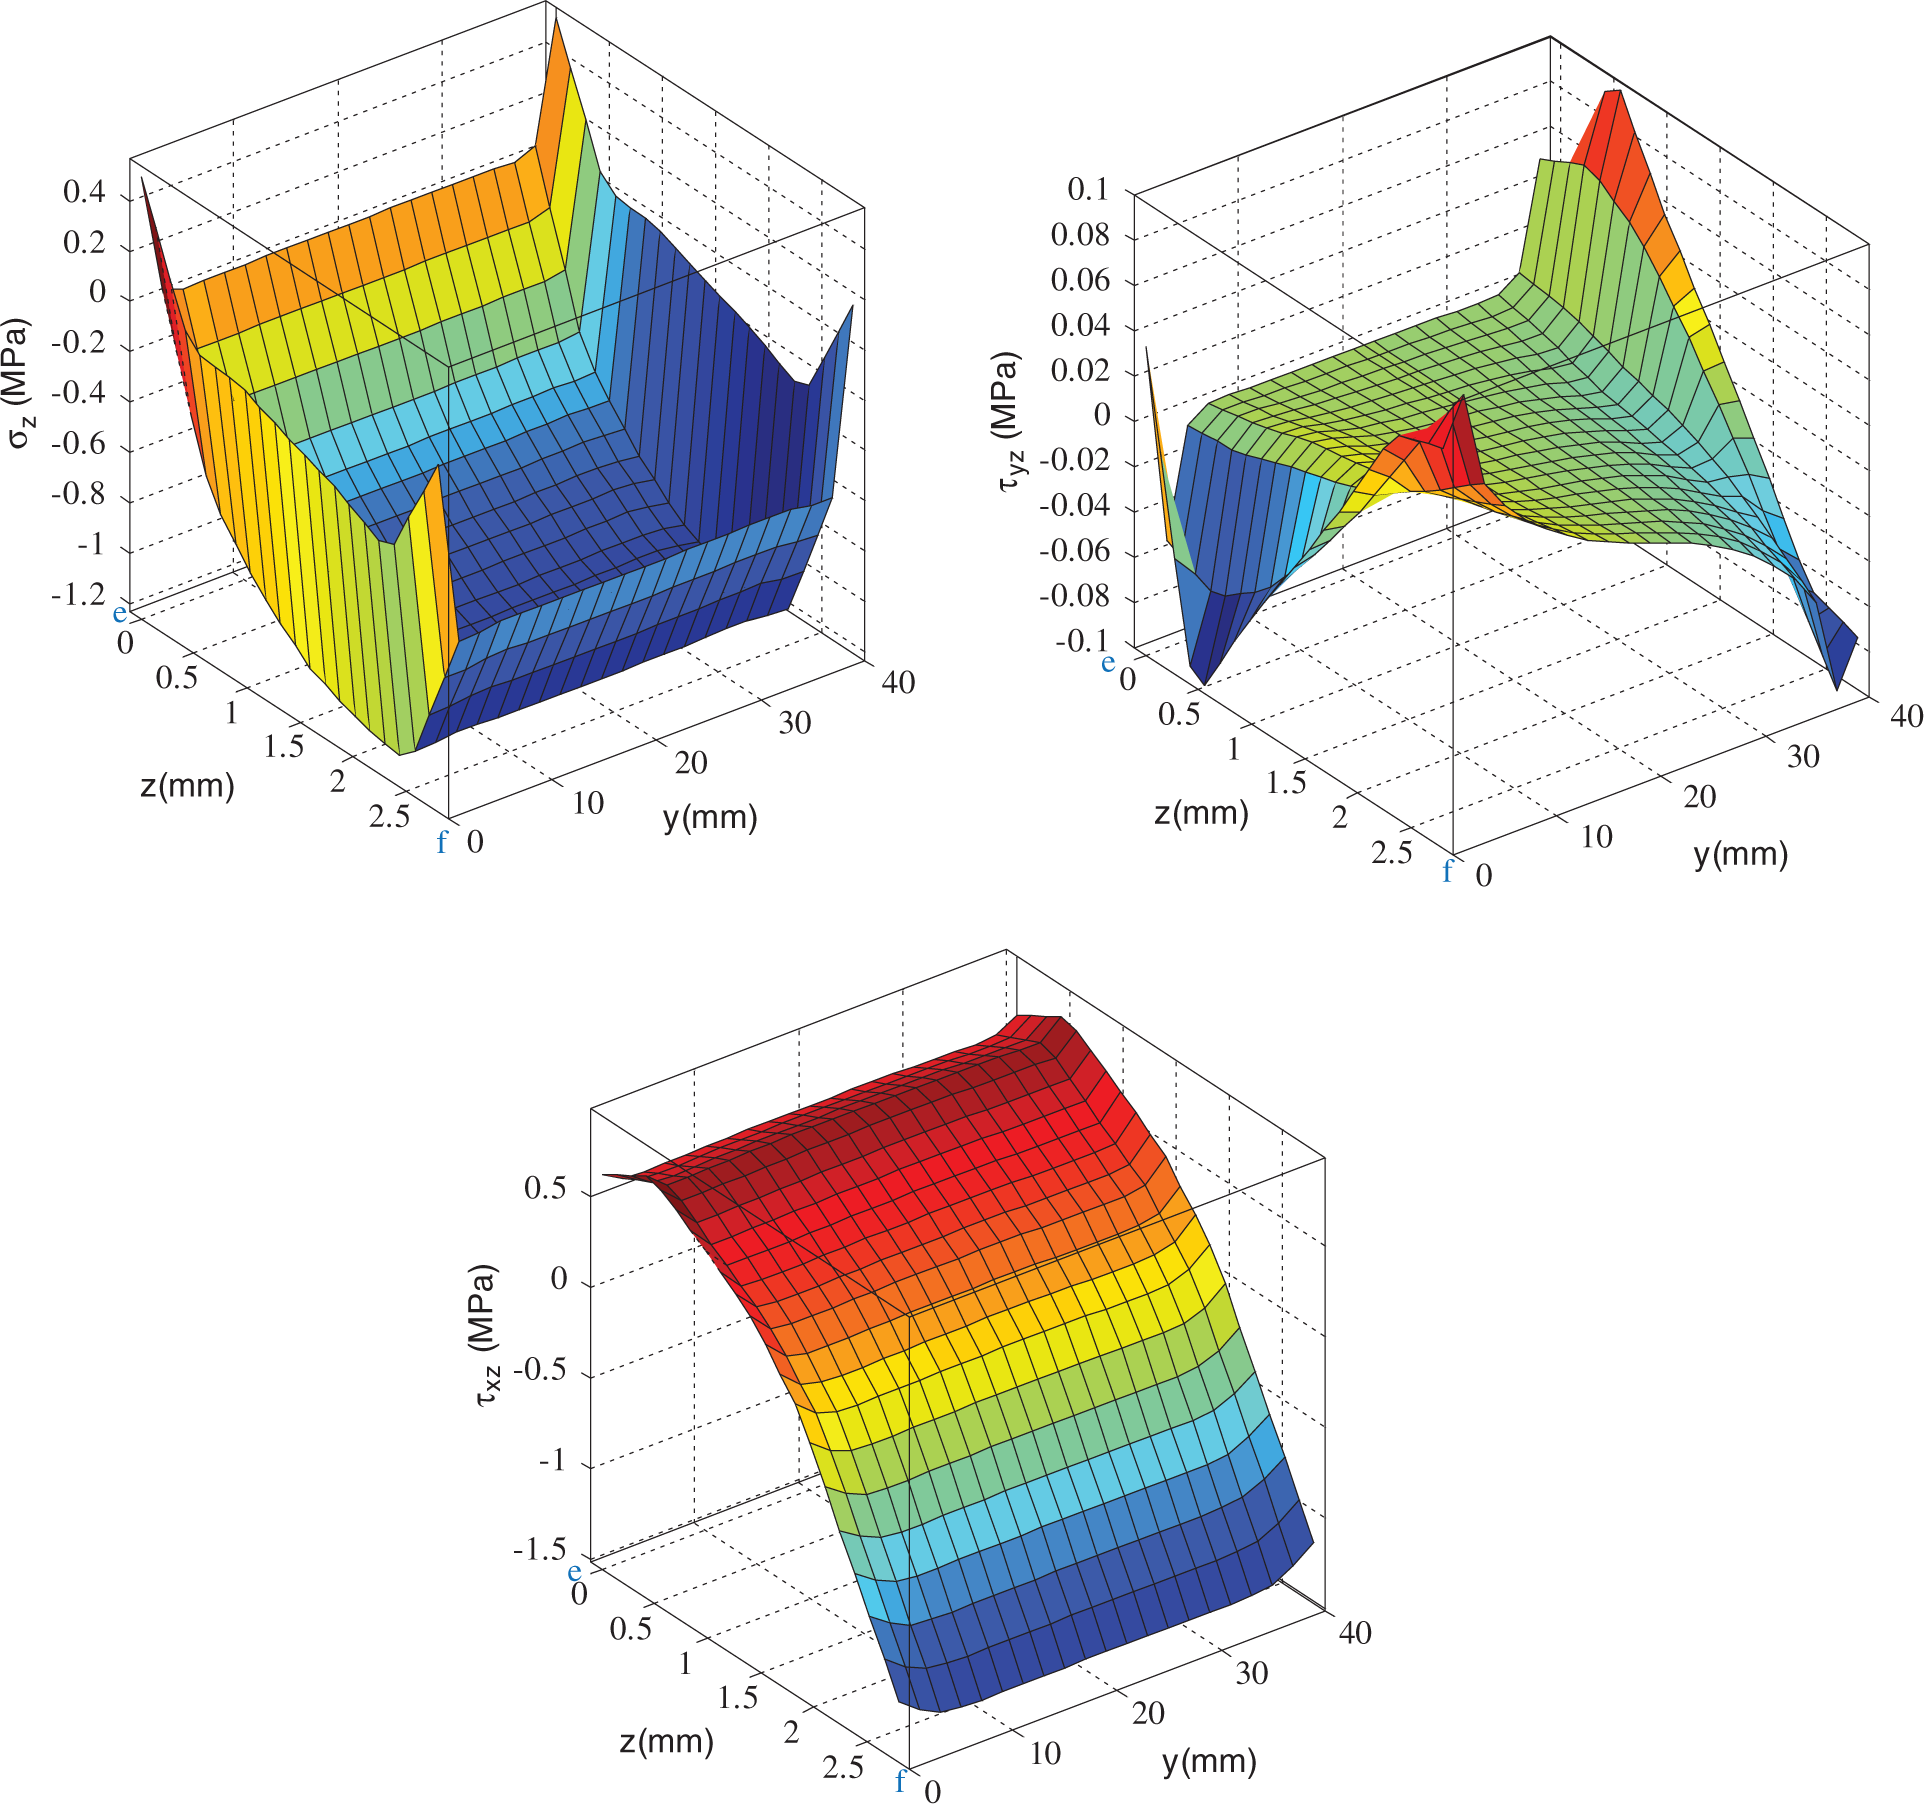
Figures 14 to 16 show the out-of-plane normal and shear stress distribution over three critical surfaces in R-SLJ. It is obvious from the figures that stress distributions were similar to the SLJ. The out-of plane normal and shear stress values were higher than the SLJ configurations this is because the applied compressive load (buckling load) was increased in order to calculate failure index which are shown hereafter. However, the same loading conditions, the out-of plane stress values would decrease over the critical surfaces compared to stepped-lap joints. The distributions of failure index over the critical surfaces were shown in Figure 17. The possibility of failure initiation would be from the adhesive layer between the critical points ‘c’ and ‘d ’ as in SLJ, because the value of e were the highest here compared to any other locations.
Out-of-plane stress distribution along the interface of bottom adherend and adhesive layer in R-SLJ. Out-of-plane stress distribution along the mid-plane of the adhesive layer in R-SLJ. Out-of-plane stress distribution along the interface of top adherend and adhesive layer in R-SLJ. Distribution of failure indices in R-SLJ: (i) at the interface of bottom adherend and adhesive; (ii) in the mid-plane of adhesive layer; and (iii) at the interface of top adherend and adhesive.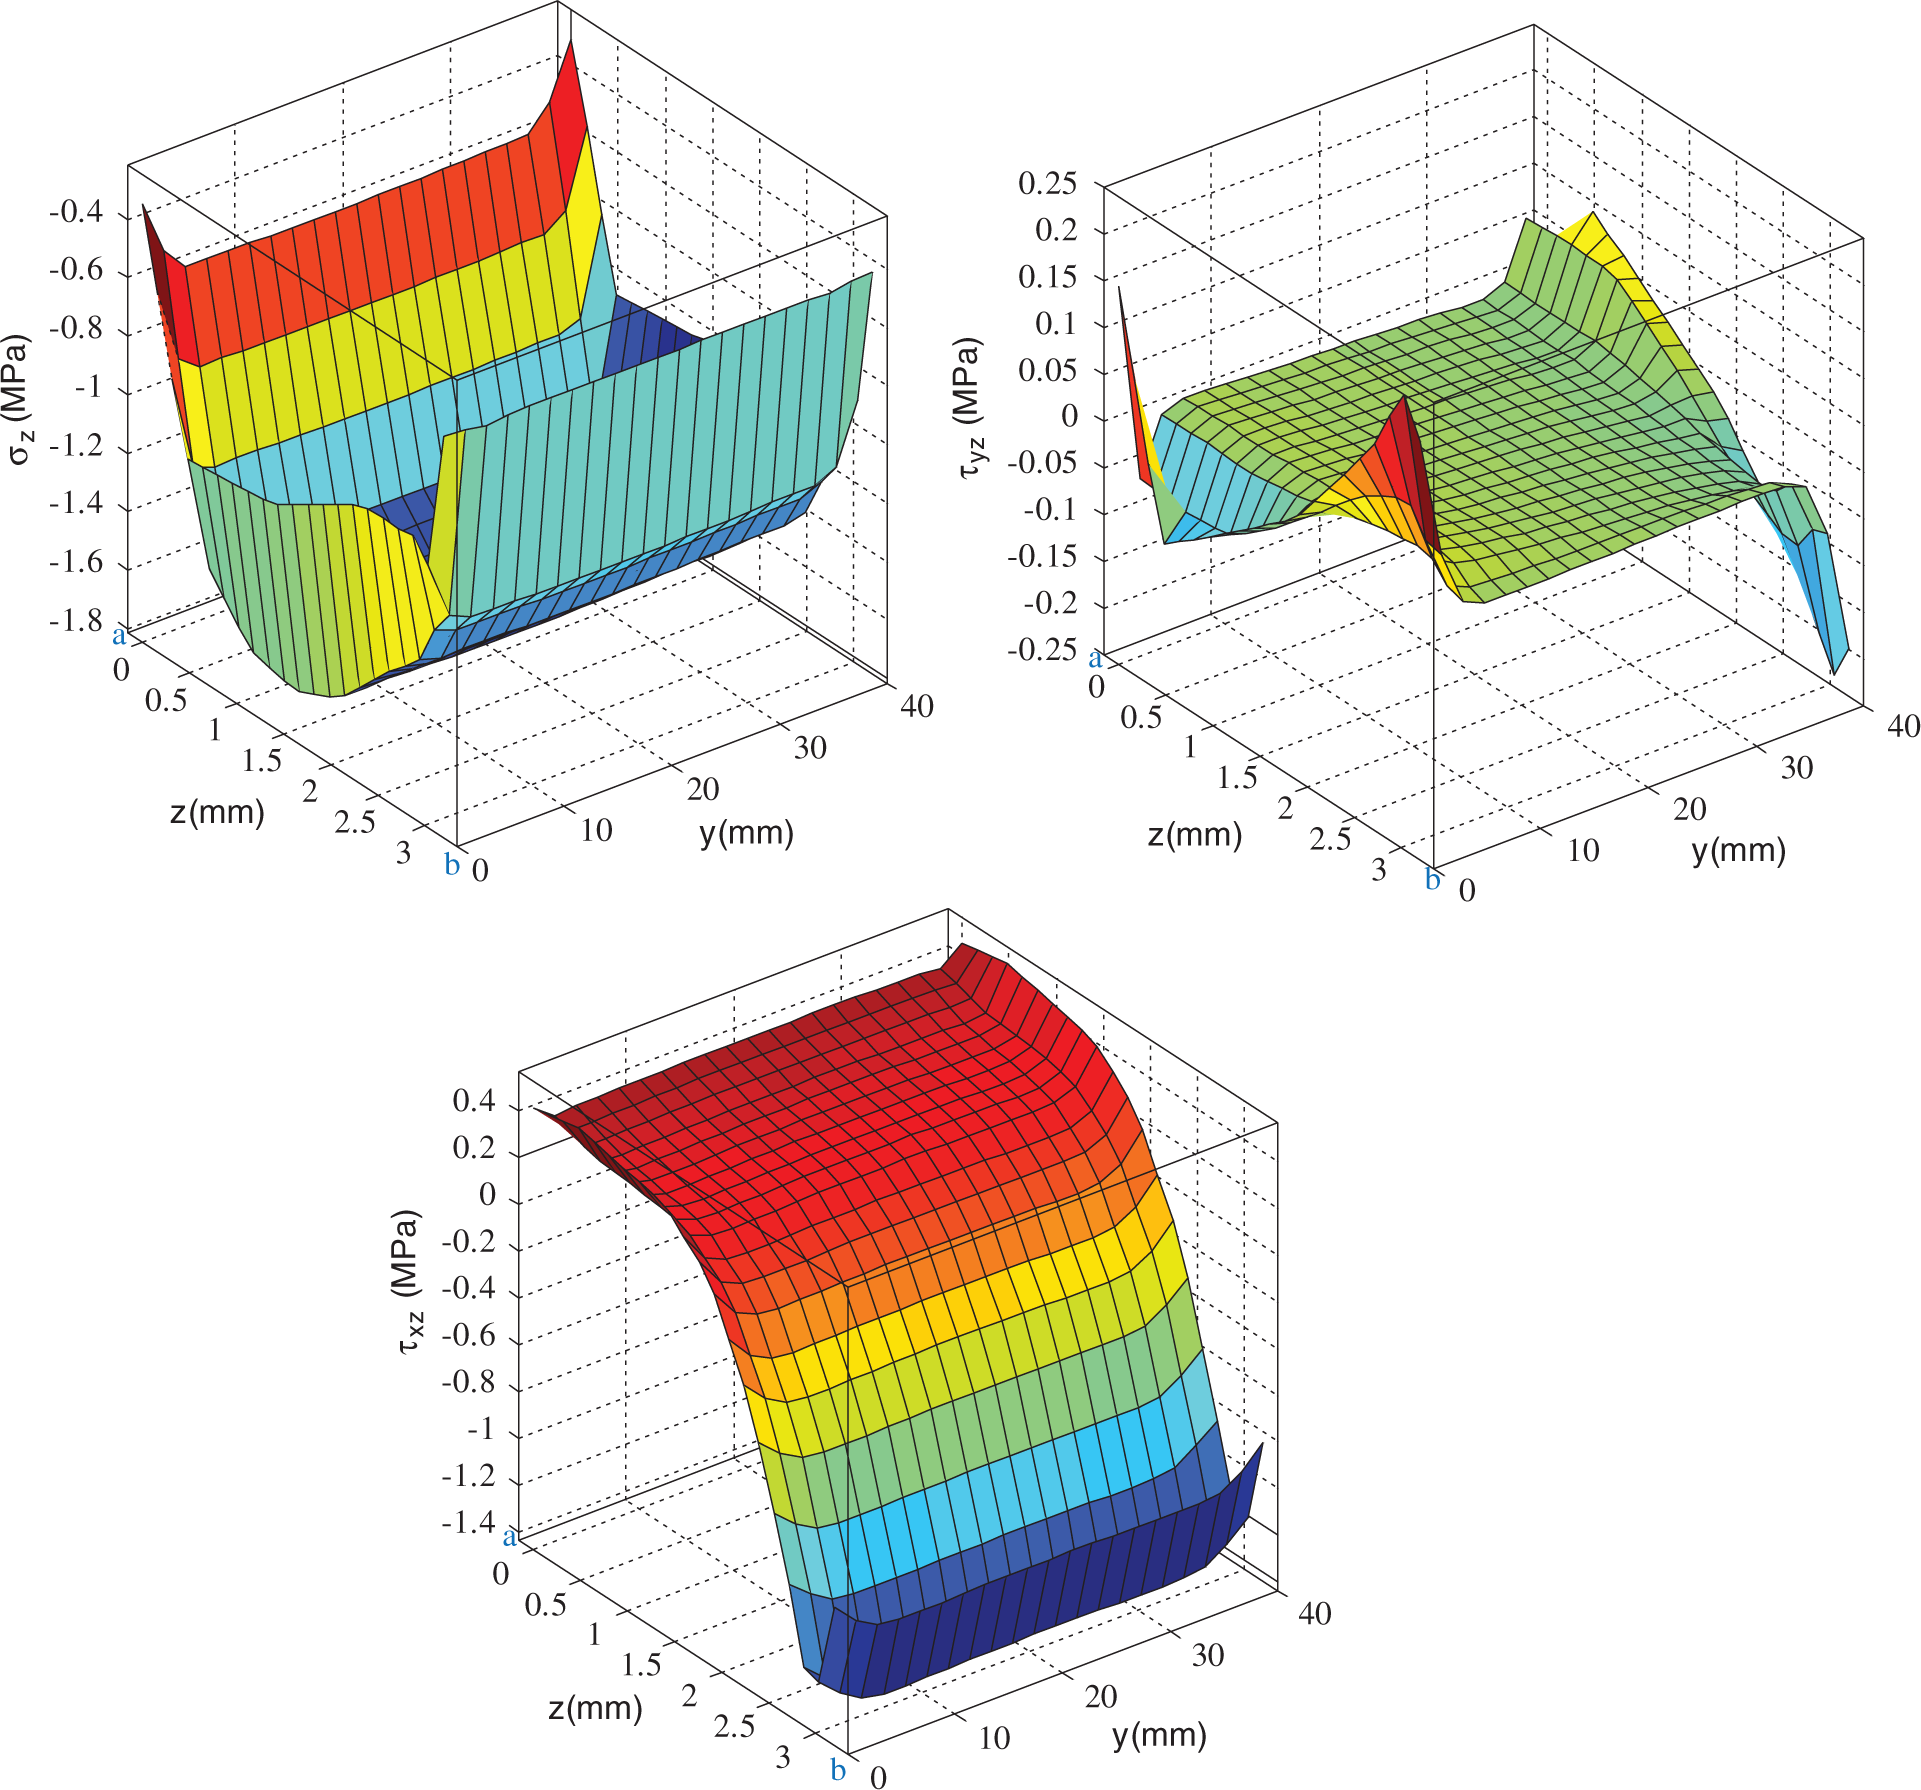
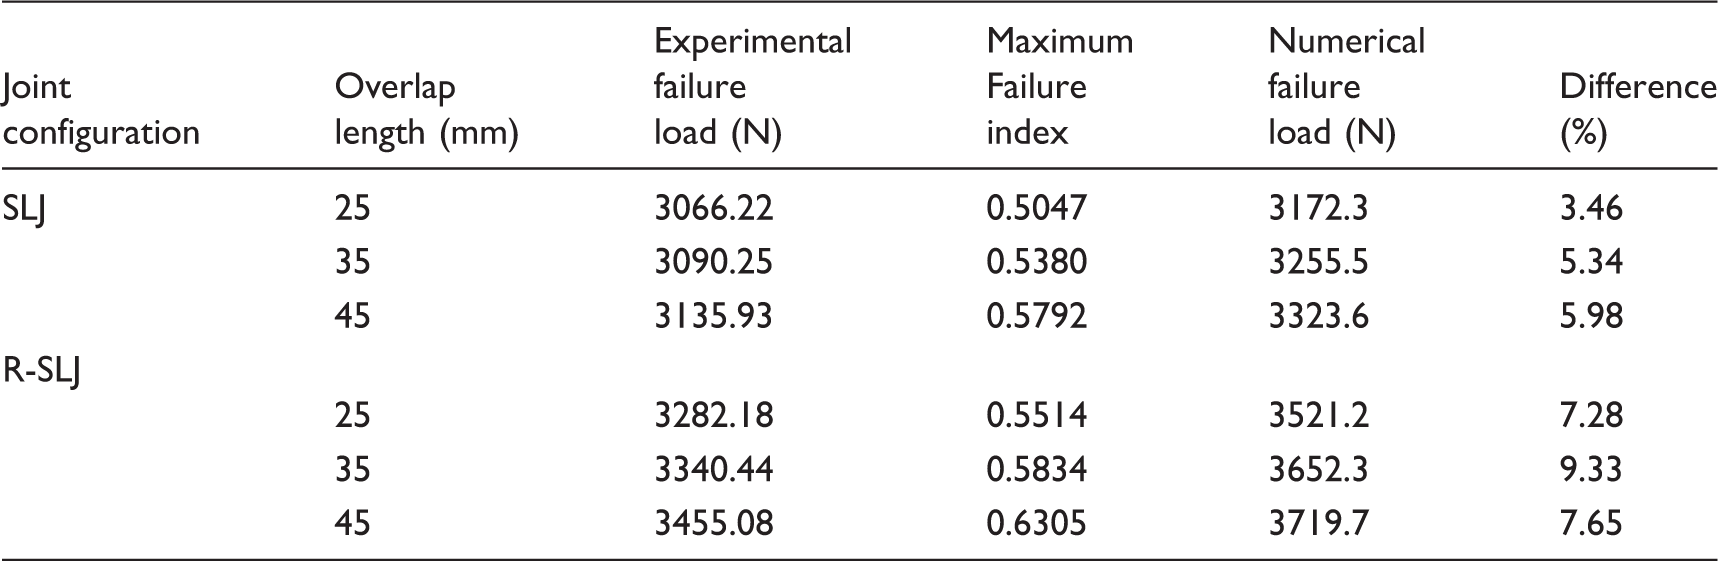
Comparisons between computed and experimental failure loads
The comparison of the failure loads from experiments and FEA for all scenarios
Concluding remarks
In this study, the buckling and compressive failure of adhesively-bonded stepped-lap joints (with/without composite patches) composed of pultruded glass fiber-reinforced polymer composite laminates was investigated experimentally and numerically. A single woven-epoxy layer was used to reinforce the compressive strength of the traditional stepped lap joints. The experimental results showed that the buckling and failure load of new stepped lap composite joints with composite patches were significantly higher than the conventional stepped lap joints. The positive effect of the composite patches on the buckling and compressive failure loads of conventional stepped lap joint (approx. 10%) could be increased by using more than one layer in the overlap region. The influence of the overlap length was evaluated. For both types of joints, a small increase was observed in failure loads by increase of the overlap length. 3D-FEM calculations were carried out to enlighten the stress characteristics of stepped-lap joints under compressive loadings. The numerical results showed good agreement with experimental data for both types of joints. As a result, it can be said that the proposed method is more practical and lower cost than current improving techniques. Additionally, it is noted that the finite element method can be a valuable predictive tool and an option for the reduction of costs due to experimentation.
Footnotes
Funding
This research received no specific grant from any funding agency in the public, commercial, or not-for-profit sectors.
Conflict of Interest
None declared.