
Abstract
The AC electrical conduction and thermal conductivity of casted thin films of poly (ethylene oxide)/carbon black composites were investigated as a function of applied frequency in the range from 100 Hz to 5 MHz, temperature and carbon black concentrations 0, 1, 2, 4, 6, 8 and 10% by weight. The average films thickness was about 90 µm. The AC conductivity and dielectric properties were determined from impedance measurements. The study showed that the thermoelectrical properties are affected by adding carbon black filler into the poly (ethylene oxide) polymer matrix. The study observed that the dielectric constant and dielectric loss decrease with frequency, and increase with temperature, and carbon content. The AC-conductivity increases with increasing frequency, temperature and carbon black content. The observed percolation threshold of the AC-conductivity occurs at about 2 wt% carbon black concentration. The thermal conductivity of the prepared films was studied as a function of temperature and CB concentration. It was found that the thermal conductivity is enhanced by addition of the carbon black content and increasing temperature. In case of raising the temperature, the phonons are activated and electrons hopping to higher energy states, thus enhancement in the thermal conductivity is produced.
Keywords
Introduction
Conductive polymer composites have been studied extensively because of their numerous high technological and electronic applications such as sensors, heating elements, switching devices and electromagnetic interference shielding. Many types of conductive fillers have been embedded in insulating polymers such as carbon black (CB), carbon fibers and metallic powders. CB is a material that has found widespread use in a number of applications. The purpose of adding CB filler into polymeric materials is to improve the physical properties of polymers, since it has a high ability to form continuous network in the polymer matrix and hence lead to higher electrical and thermal conductions. CB was also used as a shielding material of high voltage cables. Traditionally, it is used as a pigment in black ink, as well as for toners in copy machines and printers. Further more, CB has also been added to rubber to improve its wear characteristics.1–4
Poly (ethylene oxide) (PEO) polymer is the most popular polymer used due to its high solving power with metal ions, good processability and outstanding mechanical properties. Due to its low cost and easy production, it is often used for commercial purposes. PEO has a property to form molecular complexes which enhances the electrical conductivity. It has a low melting point (Tm = 60℃) and glass transition temperature (Tg = −57℃).5,6
There are many studies in literature which concern the dielectric and electric behavior of the CB/polymer composites above room temperature; the general result of these studies is that the composites exhibit a positive temperature coefficient (PTC) of resistivity.6–9 For example, Makadsi et al., 9 Bigg 10 and Modine et al. 11 studied the electrical properties of polymer/CB composites under different conditions. All these studies concluded that the composites behave electrically as semiconducting materials above room temperature.
An interest of research continuity concerns the effects of addition of different fillers into several of polymers. As far as we know, there are few studies in literature that deal with the thermal conductivity behavior with a mixture of PEO and CB above room temperature.2,12 In this paper, we report a study on the thermoelectrical properties and percolation behaviors of PEO doped with CB. The AC electrical and thermal properties of the prepared thin films were investigated as a function of CB concentration, temperature and applied field frequency using the powerful impedance technique. The electric pulse method was used in thermal conductivity measurement. 13
Experimental work
Composites films preparation
PEO powder (average molecular weight is 300,000 g/mol) was dissolved in methanol as a suitable solvent. The electric conductive CB (Printex XE2) consists of spherical nanoparticles with a primary particle size of 35 nm, average surface area 950 m2/g and density 1.8 g/cm3, provided by MARBO ITALIA (spa)-Milano. The solution was then stirred by a rotary magnet at room temperature for one day, and then CB particles were added to the solution. Stirring process was carried out until the mixture reached a homogeneous viscous molten state and immediately was casted to thin film on a glass plate. The methanol was allowed to evaporate completely at room temperature and under atmospheric pressure for few days. The composite films were dried in an oven at 40℃ for one day. The films obtained contain different CB concentrations 0, 1, 2, 4, 6, 8 and10% by weight and have average thickness about 90 µm. Thickness measurements were done on few locations on the films using bolded-end micrometer. Values of the measured thickness are included in Table 2.
Impedance measurements
Impedance measurements were measured in the frequency range of 100 Hz to 5 MHz using HP 4192 A LF impedance analyzer (5 Hz–13 MHz) and the test potential of AC-field signal of 40 mVrms and measured in the temperature range of 15℃ to 55℃. No higher temperature measurements were done since the melting point for PEO is about 60℃. Ring disc specimens were cut and connected to a two-electrode shielded cell. The electrodes are made of copper, and the test composite specimen was inserted between the top and bottom electrodes. The surfaces of the specimens were gently rubbed to remove the resin-rich top insulating layer to display the filler area beneath to ensure the electrical conduction. The impedance analyzer reads impedance and phase angle values of the specimen by varying the applied field frequency; and temperatures were read in a thermal steady state through a thermocouple connected on the test specimen surface.
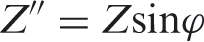
Measurements for the AC-quantities of the prepared composites were done by using a low-frequency impedance analyzer. The real and imaginary Z′ and Z″ components of the complex impedance Z are given as:

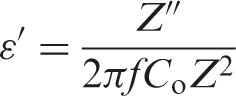
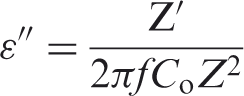

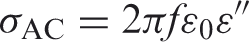
ɛ0 ≈ 8.854 × 10⁻¹² (F m−1). The AC conductivity (σAC) of the composite samples measured at a frequency ( f) is given:
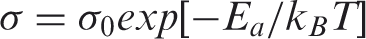
The activation energy (E
a
) of the electrical conduction in a thermal process was determined from the Arrhenius type equation:
Thermal conductivity measurements
Experimental determination of the thermal conductivity of polymeric materials is very difficult since its value is very small and ranged from 0.2 to 0.3 W/m.K. Measurements of thermal conductivity of the prepared PEO/CB films were done through sending electrical pulse which transmits heat across double-disc specimens separated by a current coil; all are placed in a sample holder connected to thermocouples for temperature readings. The apparatus is surrounded by insulating jacket to minimize the heat loss. The procedure of measuring the thermal conductivity was reported in Katsure and Kamal 13 and Elimat et al. 14 Disks specimens of 5 cm in diameter were cut from the films. The applied voltage and current are taken during the electrical pulse in a time interval under steady-state conditions. The temperature readings were taken every half hour to reach the steady state of thermal equilibrium. The following are the measuring components: Thermocouple Amplifier (model A D 594 instrumentation amplifier); calibrated as (10 mV/C). Sample holder, which consists of two small disks samples. Each sample is sandwiched between a hot plate and a cold plate. Heater: sandwiched between two insulators. This heater is made of chrome and has a power of 100 W. Two sheets of mica are used as insulators. Thermocouples: there are four thermocouples; each sample has two (upper and lower). There is an additional thermocouple to the whole system, Teflon taps and aluminum plates. The Oven: sealed up 200℃, power supply, multimeters and stop watch.
Results and discussion
Electrical results
Figure 1 shows the dependence of the complex impedance on the applied frequency and CB concentration. The impedance values are high at low-frequency range and decrease with increasing the applied frequency due to electrode/interfacial polarization effect. Also, it can be seen that the impedance decreases as the CB filler concentration increases. This may be related to a possible increase in the number of conduction paths created between the CB particles aggregates in the PEO films.12,15
Variation of impedance with frequency.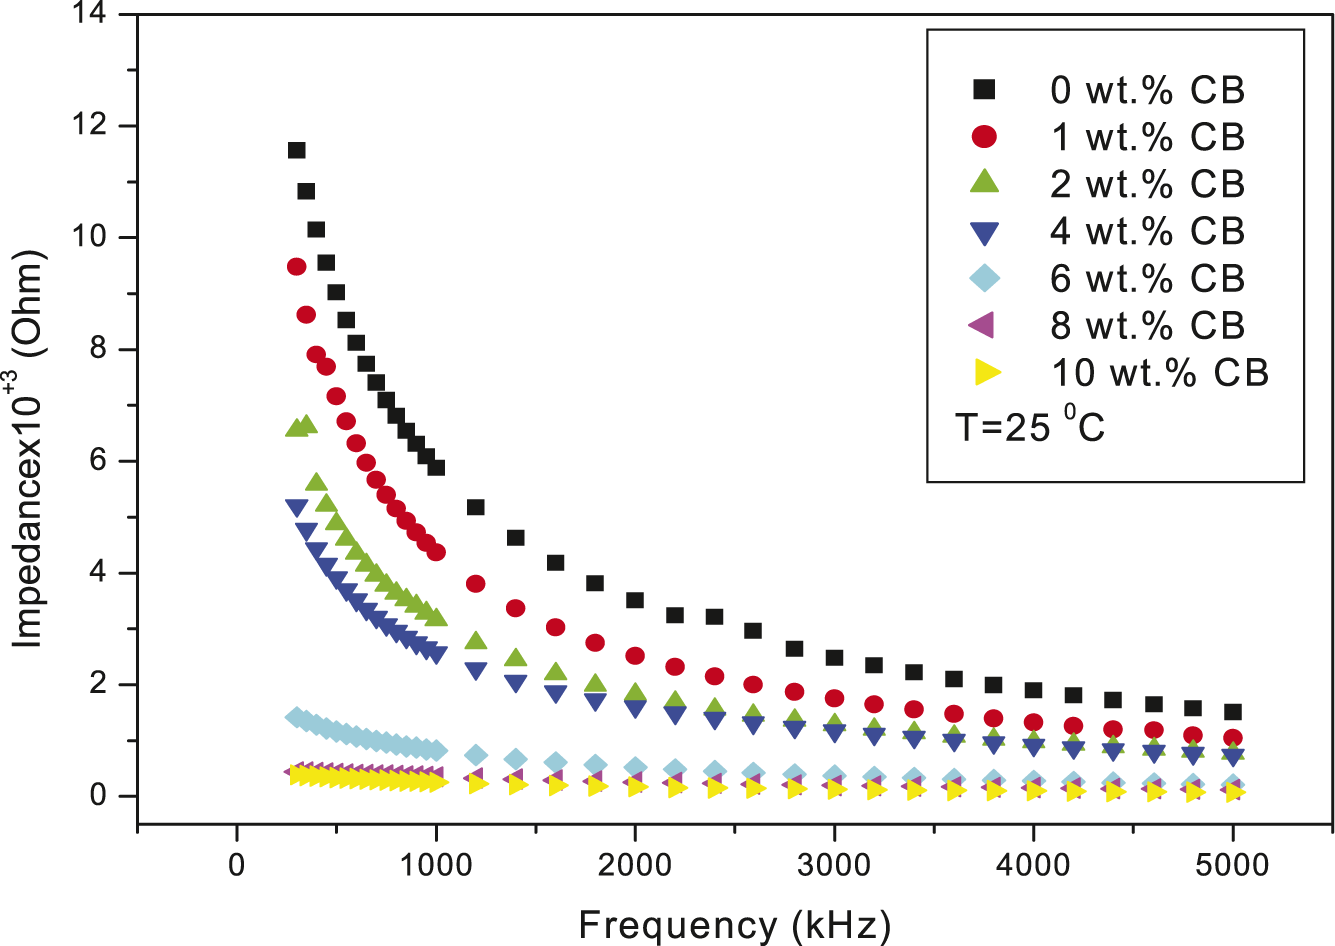
The Cole–Cole plots between Z′ and Z″ for all PEO/CB films are shown in Figure 2. The Cole–Cole constructions yield slightly inclined and distorted semicircles. The geometrical shapes of the plots indicate that the composite materials are electrically equivalent to Resistor-Capacitor (RC) Networks. The distance of the extrapolated intersection with the x-axis away from the origin represents the bulk resistance. The bulk resistance decreases as the CB filler concentration increases, which corresponds to an increase in the electrical conductivity. This may be related to more charge carriers being able to transport within the PEO matrix, resulting in the decrease in a bulk resistance.12,15
The Cole–Cole plots.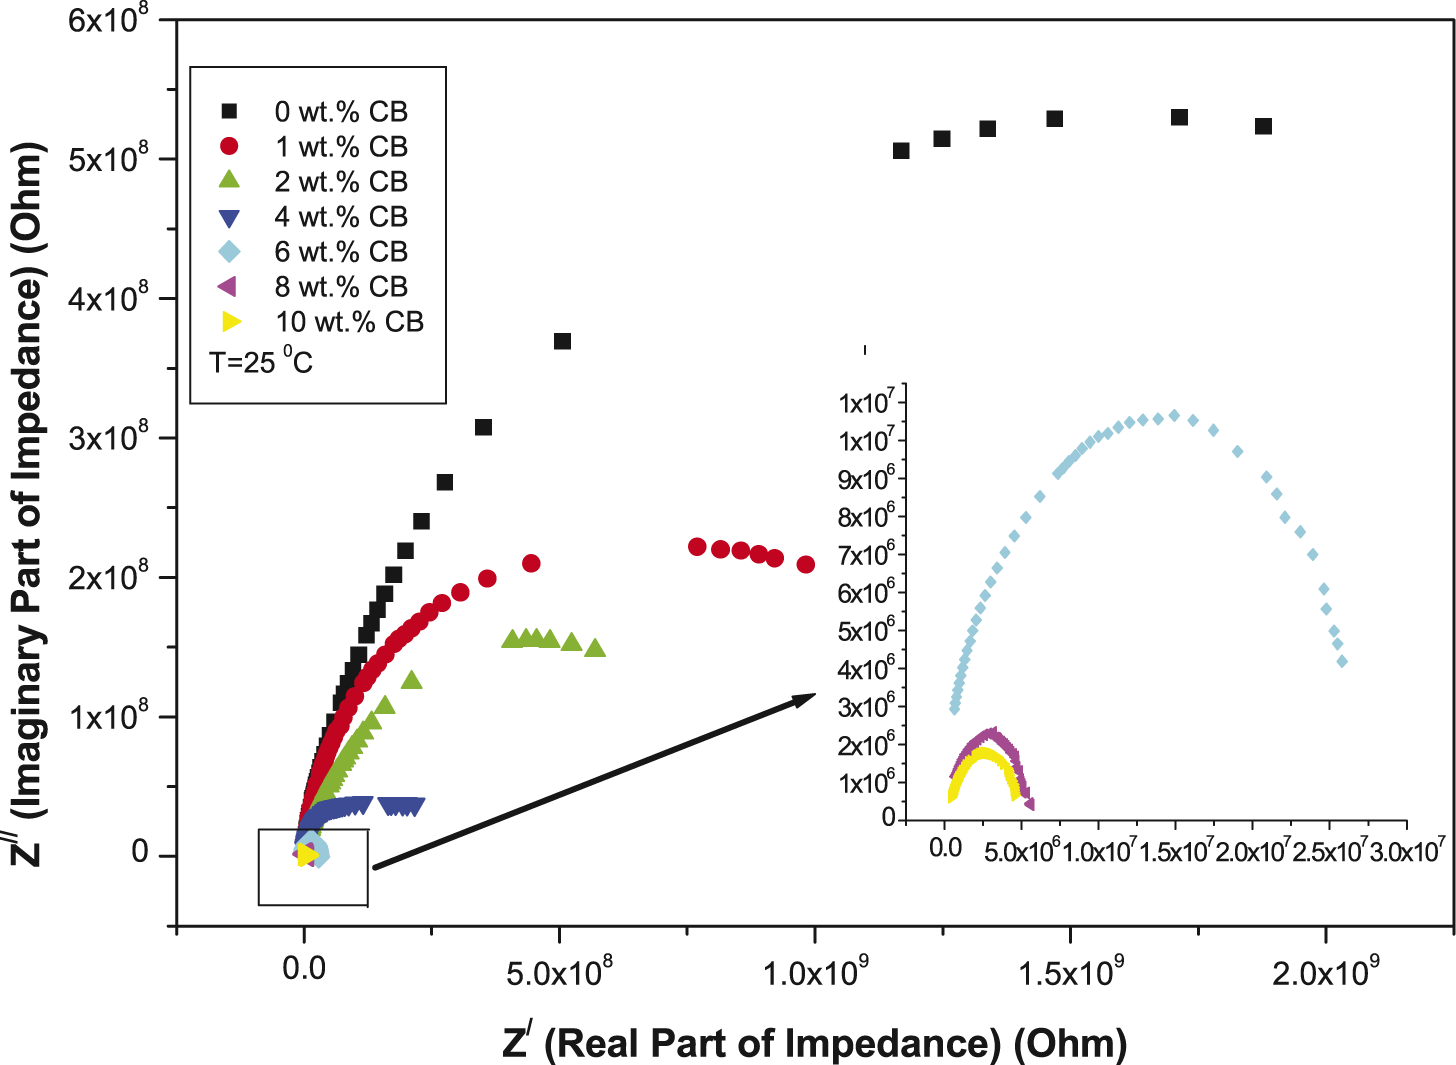
Figure 3 shows the dependence of the dielectric constant on the applied frequency for all PEO/CB films at T = 25℃. It can be noted that the dielectric constant values (ɛ′) decrease with increasing the applied frequency. The slow decrease is related to the space charge polarization which enhances ɛ′ slightly and compensates for the decrease caused by the orientation polarization. At low frequencies, the dielectric constant has high values; this can be attributed to the Maxwell–Wagner mechanism (interfacial space charge)
16
and to the electrode/interface polarization effect. Figure 4 shows the dependence of the dielectric loss on the applied frequency. It can be seen that ɛ″ decreases with increasing the applied frequency. At low frequencies, ɛ″ has a high value and then it starts to decrease at higher frequencies. This is because the induced charges cannot follow the reversing electric field when the frequency is high, causing a reduction in electronic oscillations as frequency increases. The low-frequency dispersion in ɛ′ is attributed to the interfacial polarization effect and also to the aggregated CB particles which lead to large losses at low frequency.
17
Variation of dielectric constant with frequency. Variation of dielectric loss with frequency.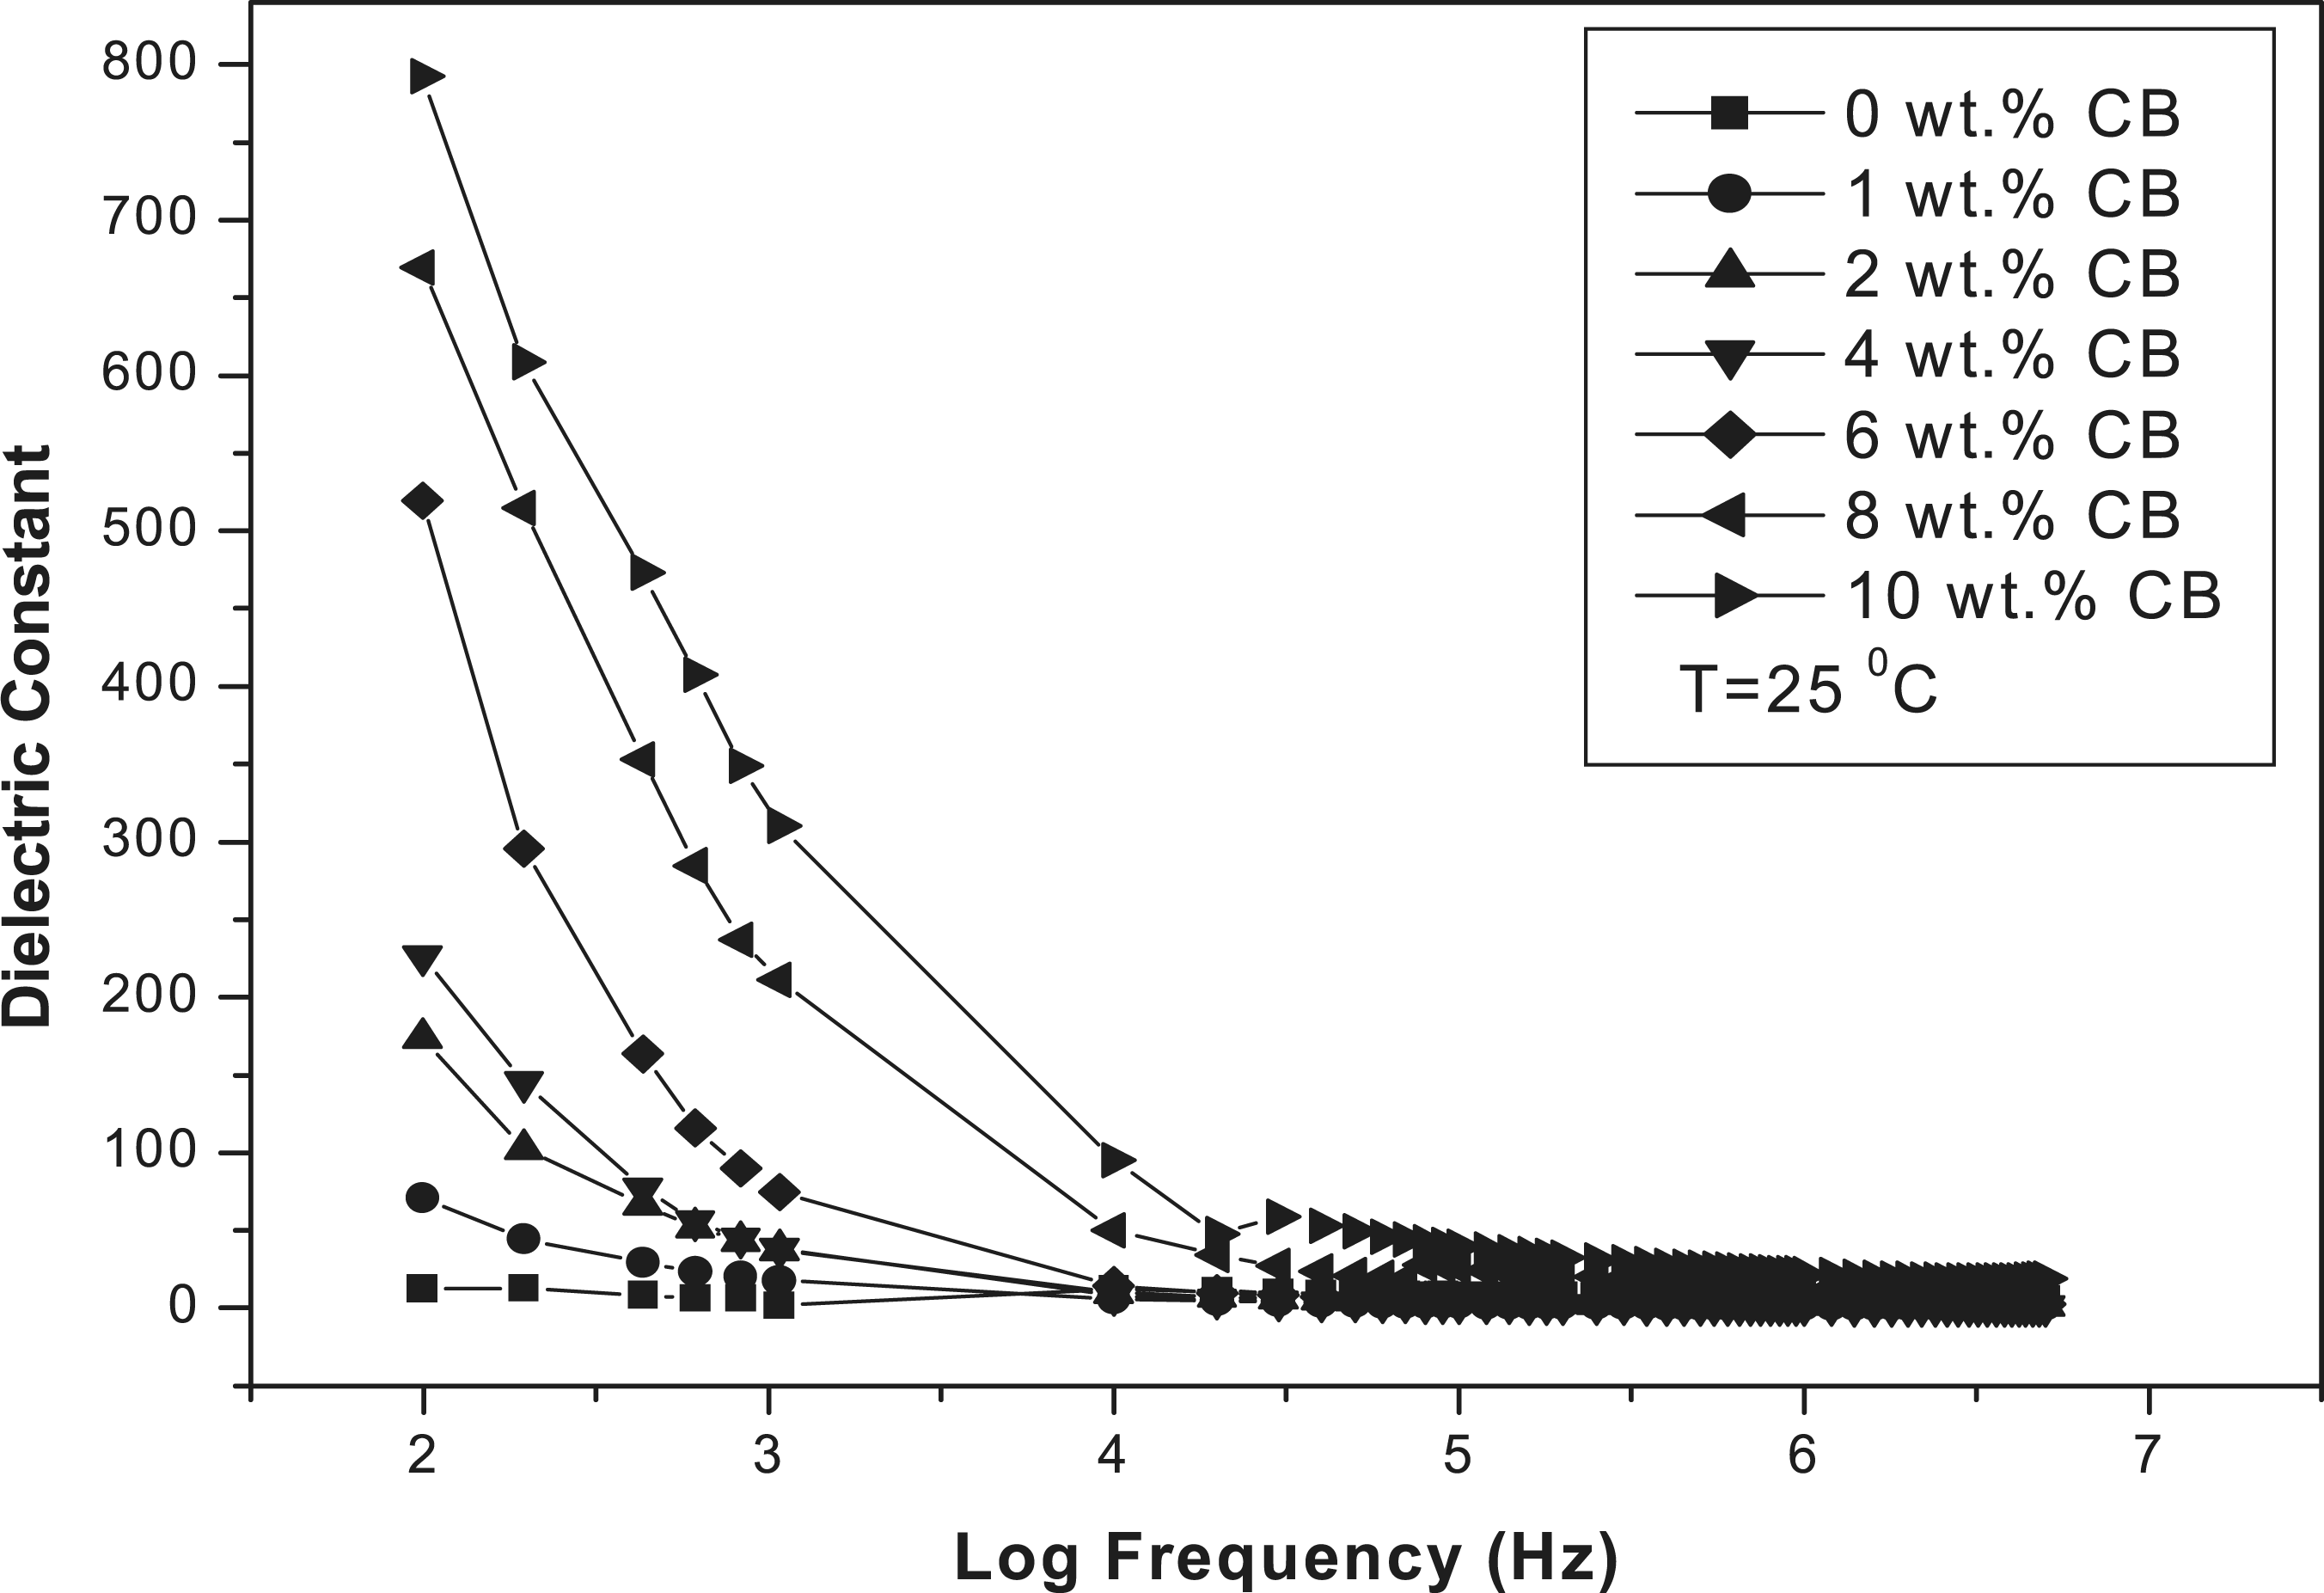
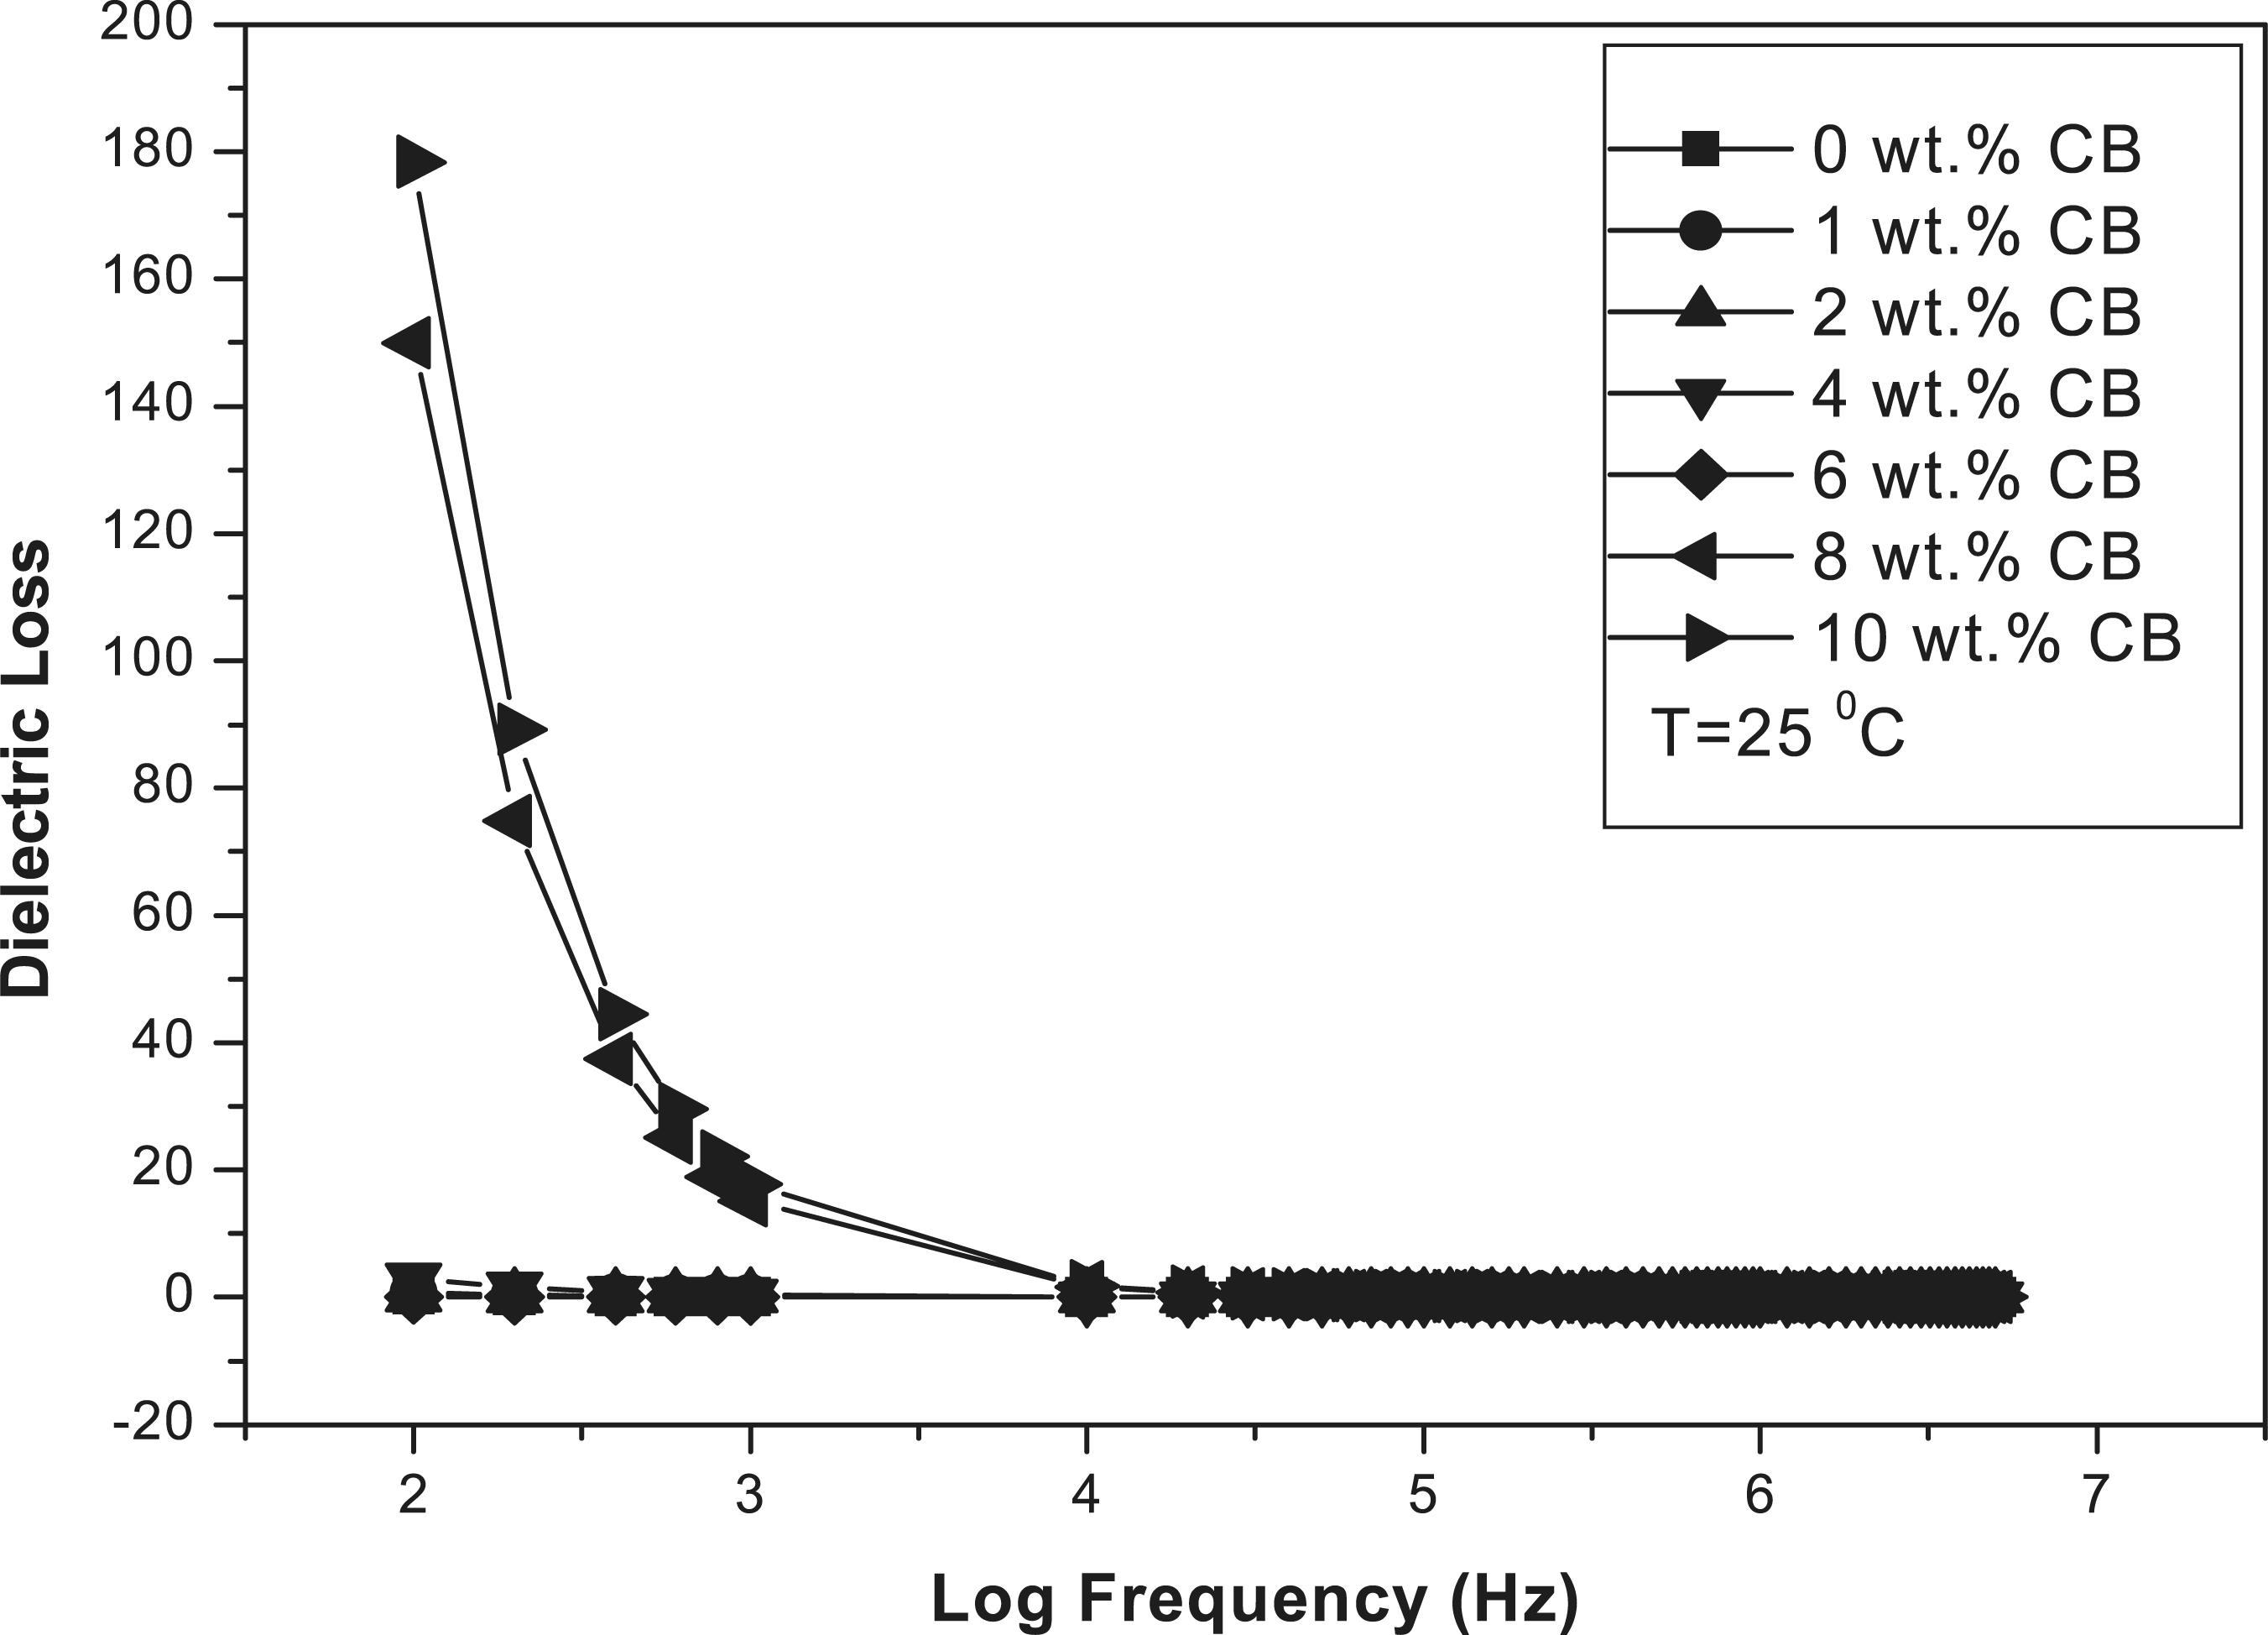
The CB concentration effect on the dielectric constant and dielectric loss is shown in Figures 3 and 4, where ɛ′ and ɛ″ are increasing with the CB content. The enhancement in the values of the dielectric constant with the CB content can be related to creation of conductive paths and networks, which make the composites more conductive, and have higher dielectric values. It can be seen that both the dielectric constant and dielectric loss are increased with both the filler content and temperature. This behavior may be attributed to reduction in the interfacial and orientation polarization effects that take place in such heterogeneous system. The increase in dielectric loss with increase in the CB content is considered to enhance electrical conductivity and less polarization effect takes place in the composites. 18 It can be seen that the dielectric constant increases with increasing temperature, which caused a decrease in the space charge (interfacial) polarization and increase the contributions from electrons and impurities in the film. 19
Figure 5 shows the variations of the Ln(AC conductivity) with Ln(f). It can be seen that the AC conductivity increases as the frequency increases. The increase in AC conductivity with increasing CB content can be explained through the electrical conduction path theory. At low frequencies, there is a slow increase in the AC conductivity, but it rapidly increases at high frequencies. This rapid increase in (σAC) at high frequencies is expected since at higher applied field more electrons can move, resulting in enhancement of the electrical conduction process. The observed induced conductivity at high frequencies locates the prepared composite in the semiconducting level of the electronic materials.18–22
Variation of Ln(AC-conductivity) with Ln(frequency).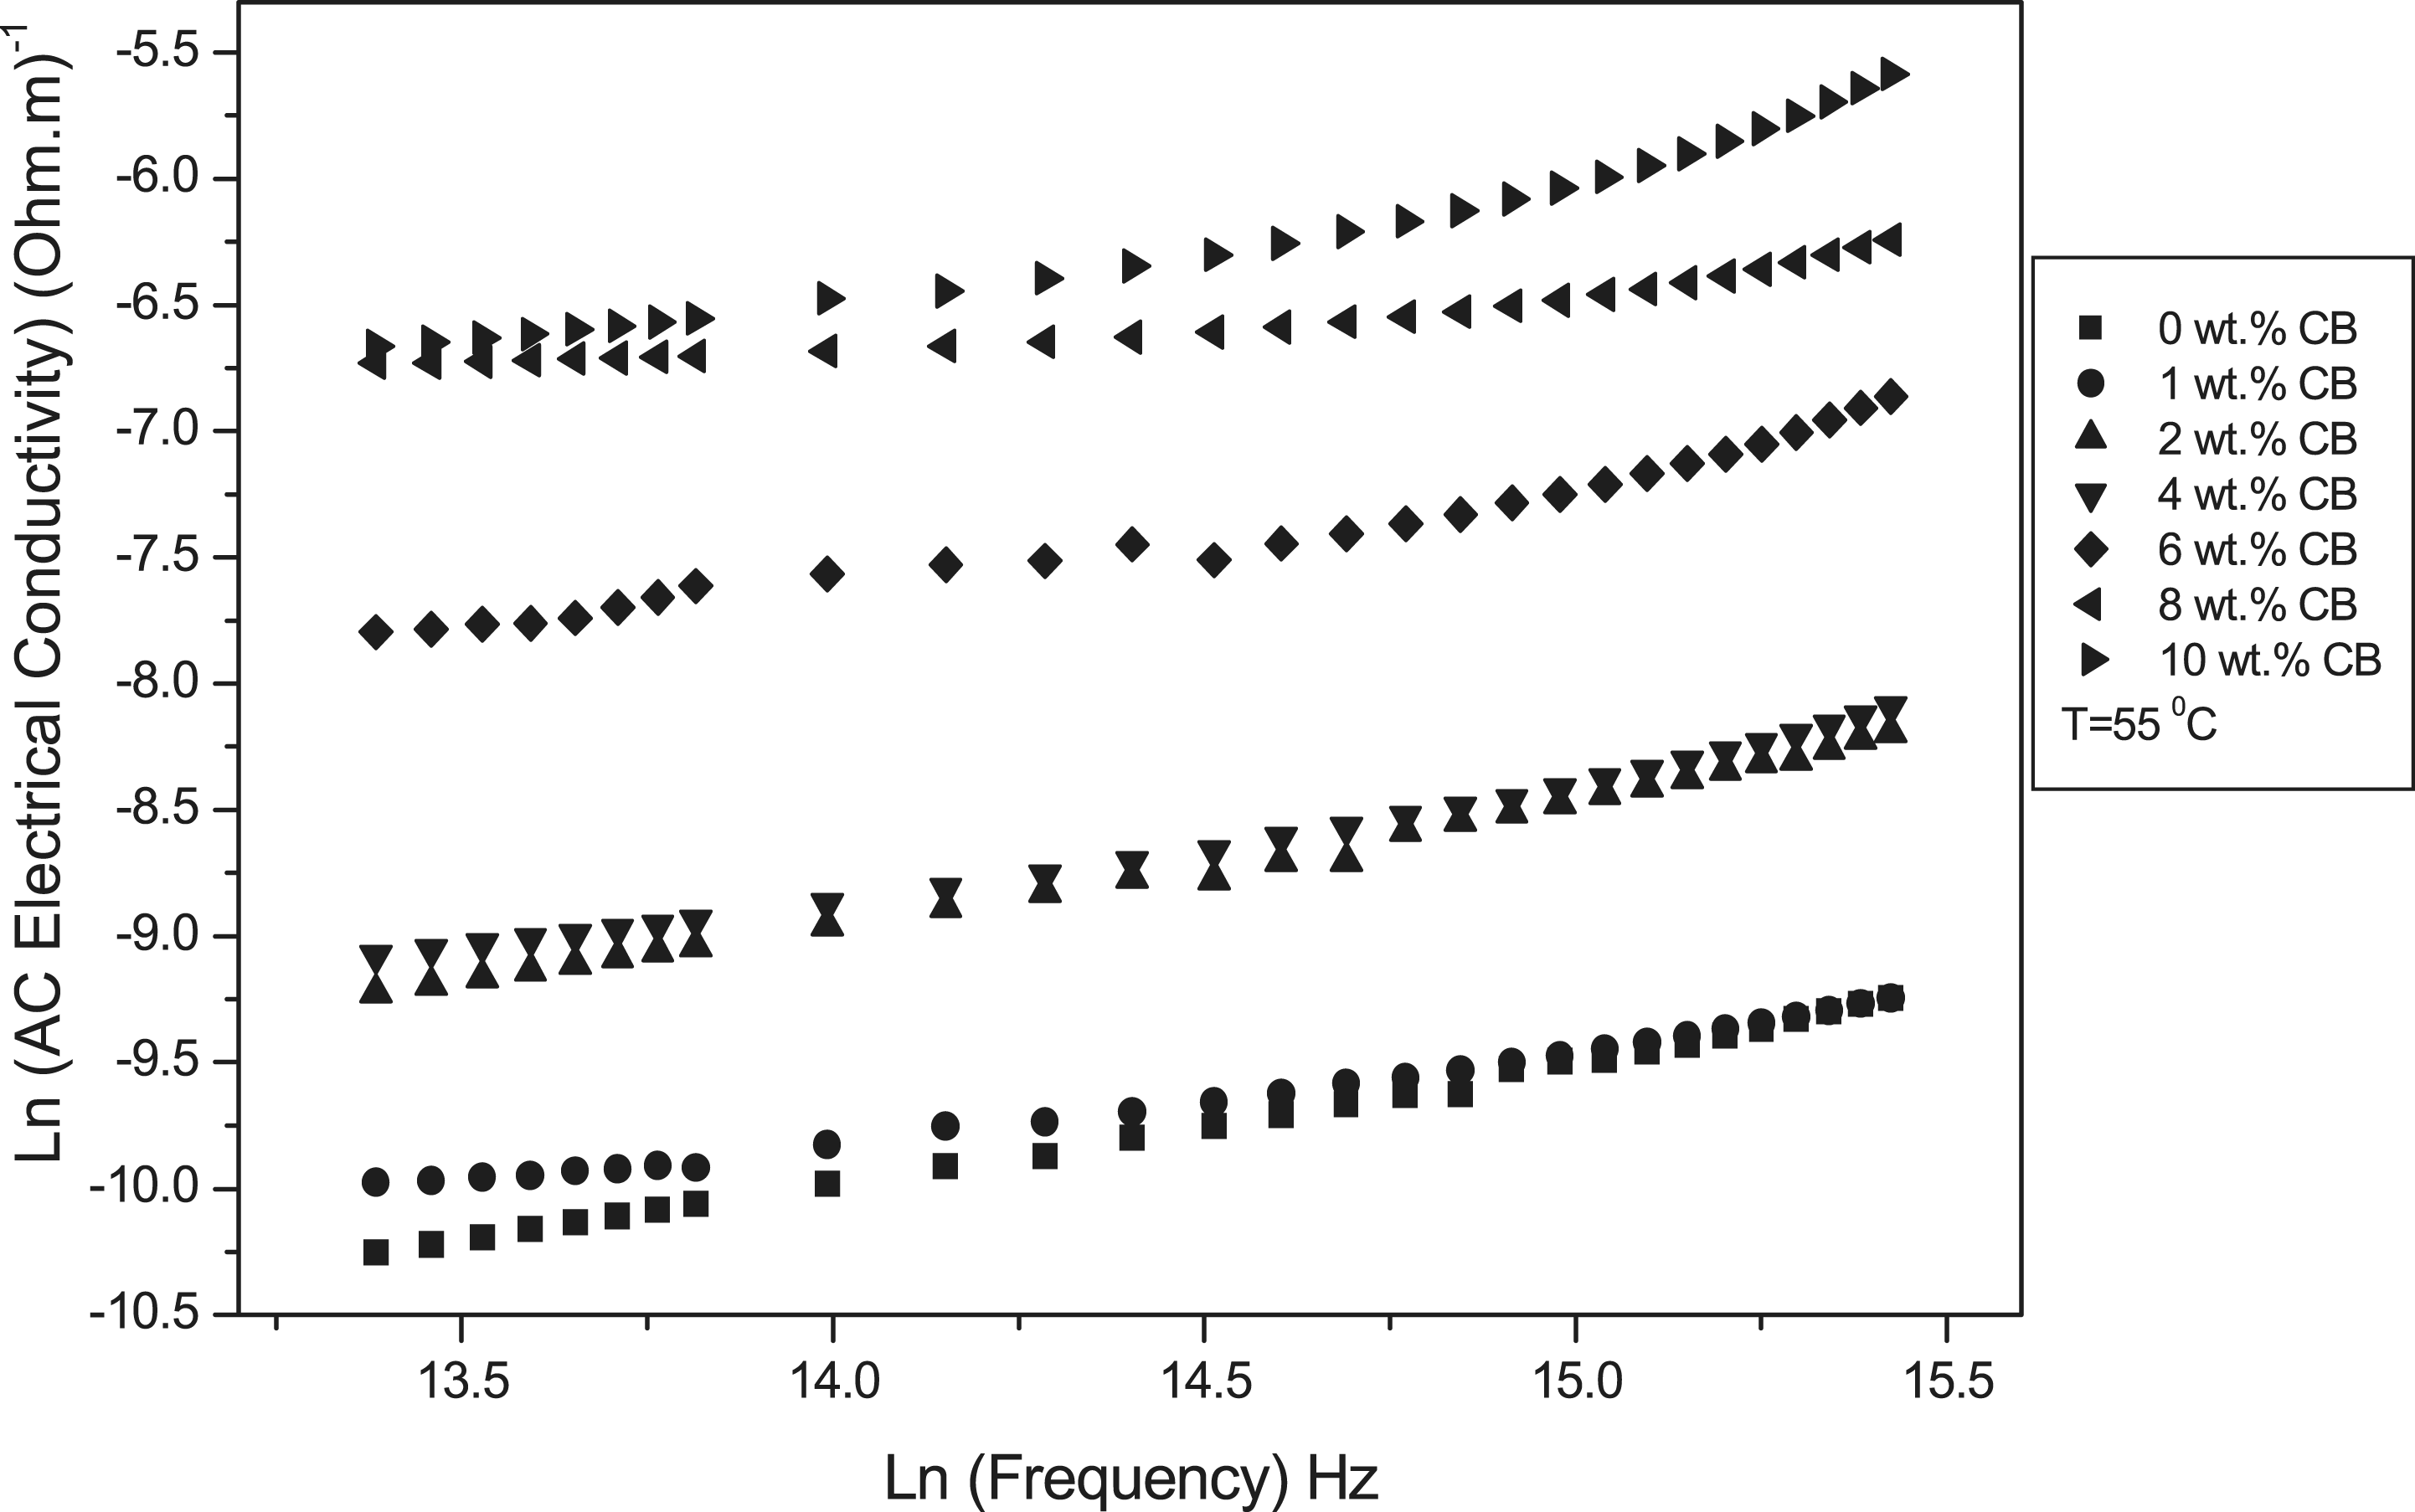
Table 1 includes values of the activation energy (Ea) calculated from the approximated straight lines of Figure 6, by using Arrhenius type equation (7). From this table, it can be noted that for both temperature interval regions as shown in Table 1, the Ea decreases with increasing frequency which reflects the observed enhancement in the electrical conductivity of the composite. The appearance of the two linear portions with two activation energy is attributed to some structural changes and to rearrangements to the filling particles positions leading to the changes in the conductive paths of electrical transport. From Figure 6, the negative temperature coefficient of resistivity (NTCR) is observed since the conductivity is increased as the temperature increases. Furthermore, during heating time the PEO matrix expands and the diffusion of CB particles through the matrix increases leading the CB particles to form conductive paths for electrons to transport more rapidly with raising temperature.
23
Ln AC conductivity versus (1000/T) at different frequencies for 10 wt% carbon black (CB). The activation energy for 10 wt% carbon black (CB) film at different frequencies The thermal conductivity, resistivity and resistance at T = 25℃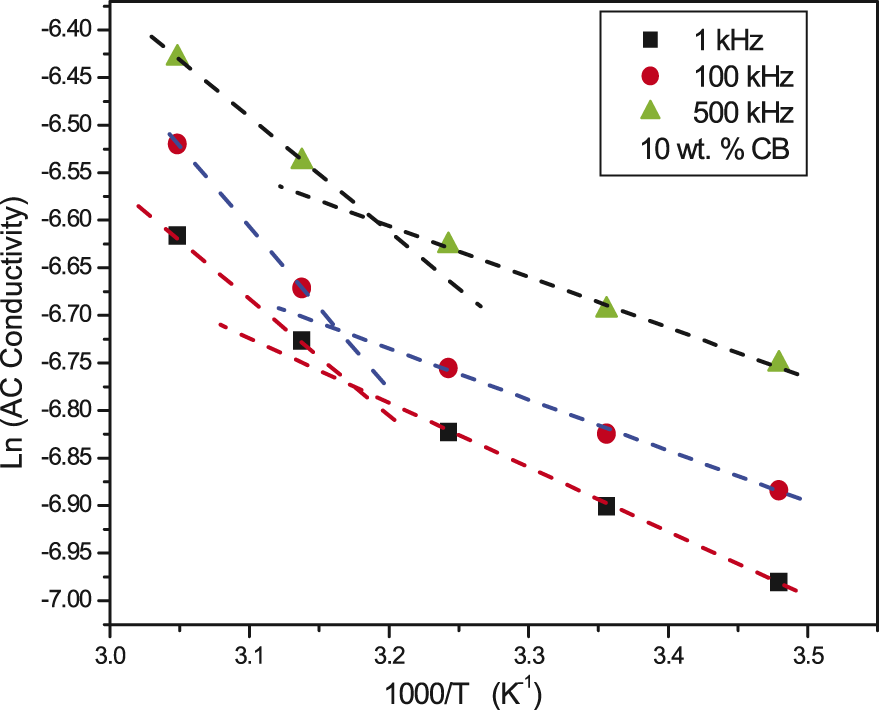

Figure 7 shows the relationship between Log AC conductivity and CB concentration at different frequencies and T = 25℃. The percolation theory gives a suitable explanation, with experimental results of the studied samples.
16
Generally, the conductivity increases slowly at low loading level of the CB fillers. A dramatic increase in the electric conductivity at the CB content approximately to 2 wt% can be seen. This CB concentration corresponds to the percolative threshold value above it as the conducting pathways throughout the polymer are being established.
24
It can be seen that the AC conductivity increases rapidly above the percolation threshold value where the composite transferred from insulator to conductive or semiconducting material.
25
The percolation threshold is a critical character determining the insulator to conductor or semiconductor transition to a composite film.
20
Upon an increase of the filler content, a critical value is reached above which the conductivity of the composite rapidly increases a case called percolation phenomenon. Below the percolative value, the CB particles are separately dispersed within the PEO matrix. At percolation threshold, the CB particles become interconnected and produce infinite continuous paths through the insulating polymer matrix, which allows a current to flow through the composite film. Adding more CB content results in an increasing number of conductive paths, and conductive chains are formed.
26
The increase in the AC electrical conductivity at low CB content, below threshold value, results from electrons tunneling between isolated CB particles aggregates without diminishing separation distances. By increasing the CB particles content, the conductive paths become larger and the space between adjacent clusters is diminishing.
20
Variation of log (AC-conductivity) versus carbon black (CB) concentration.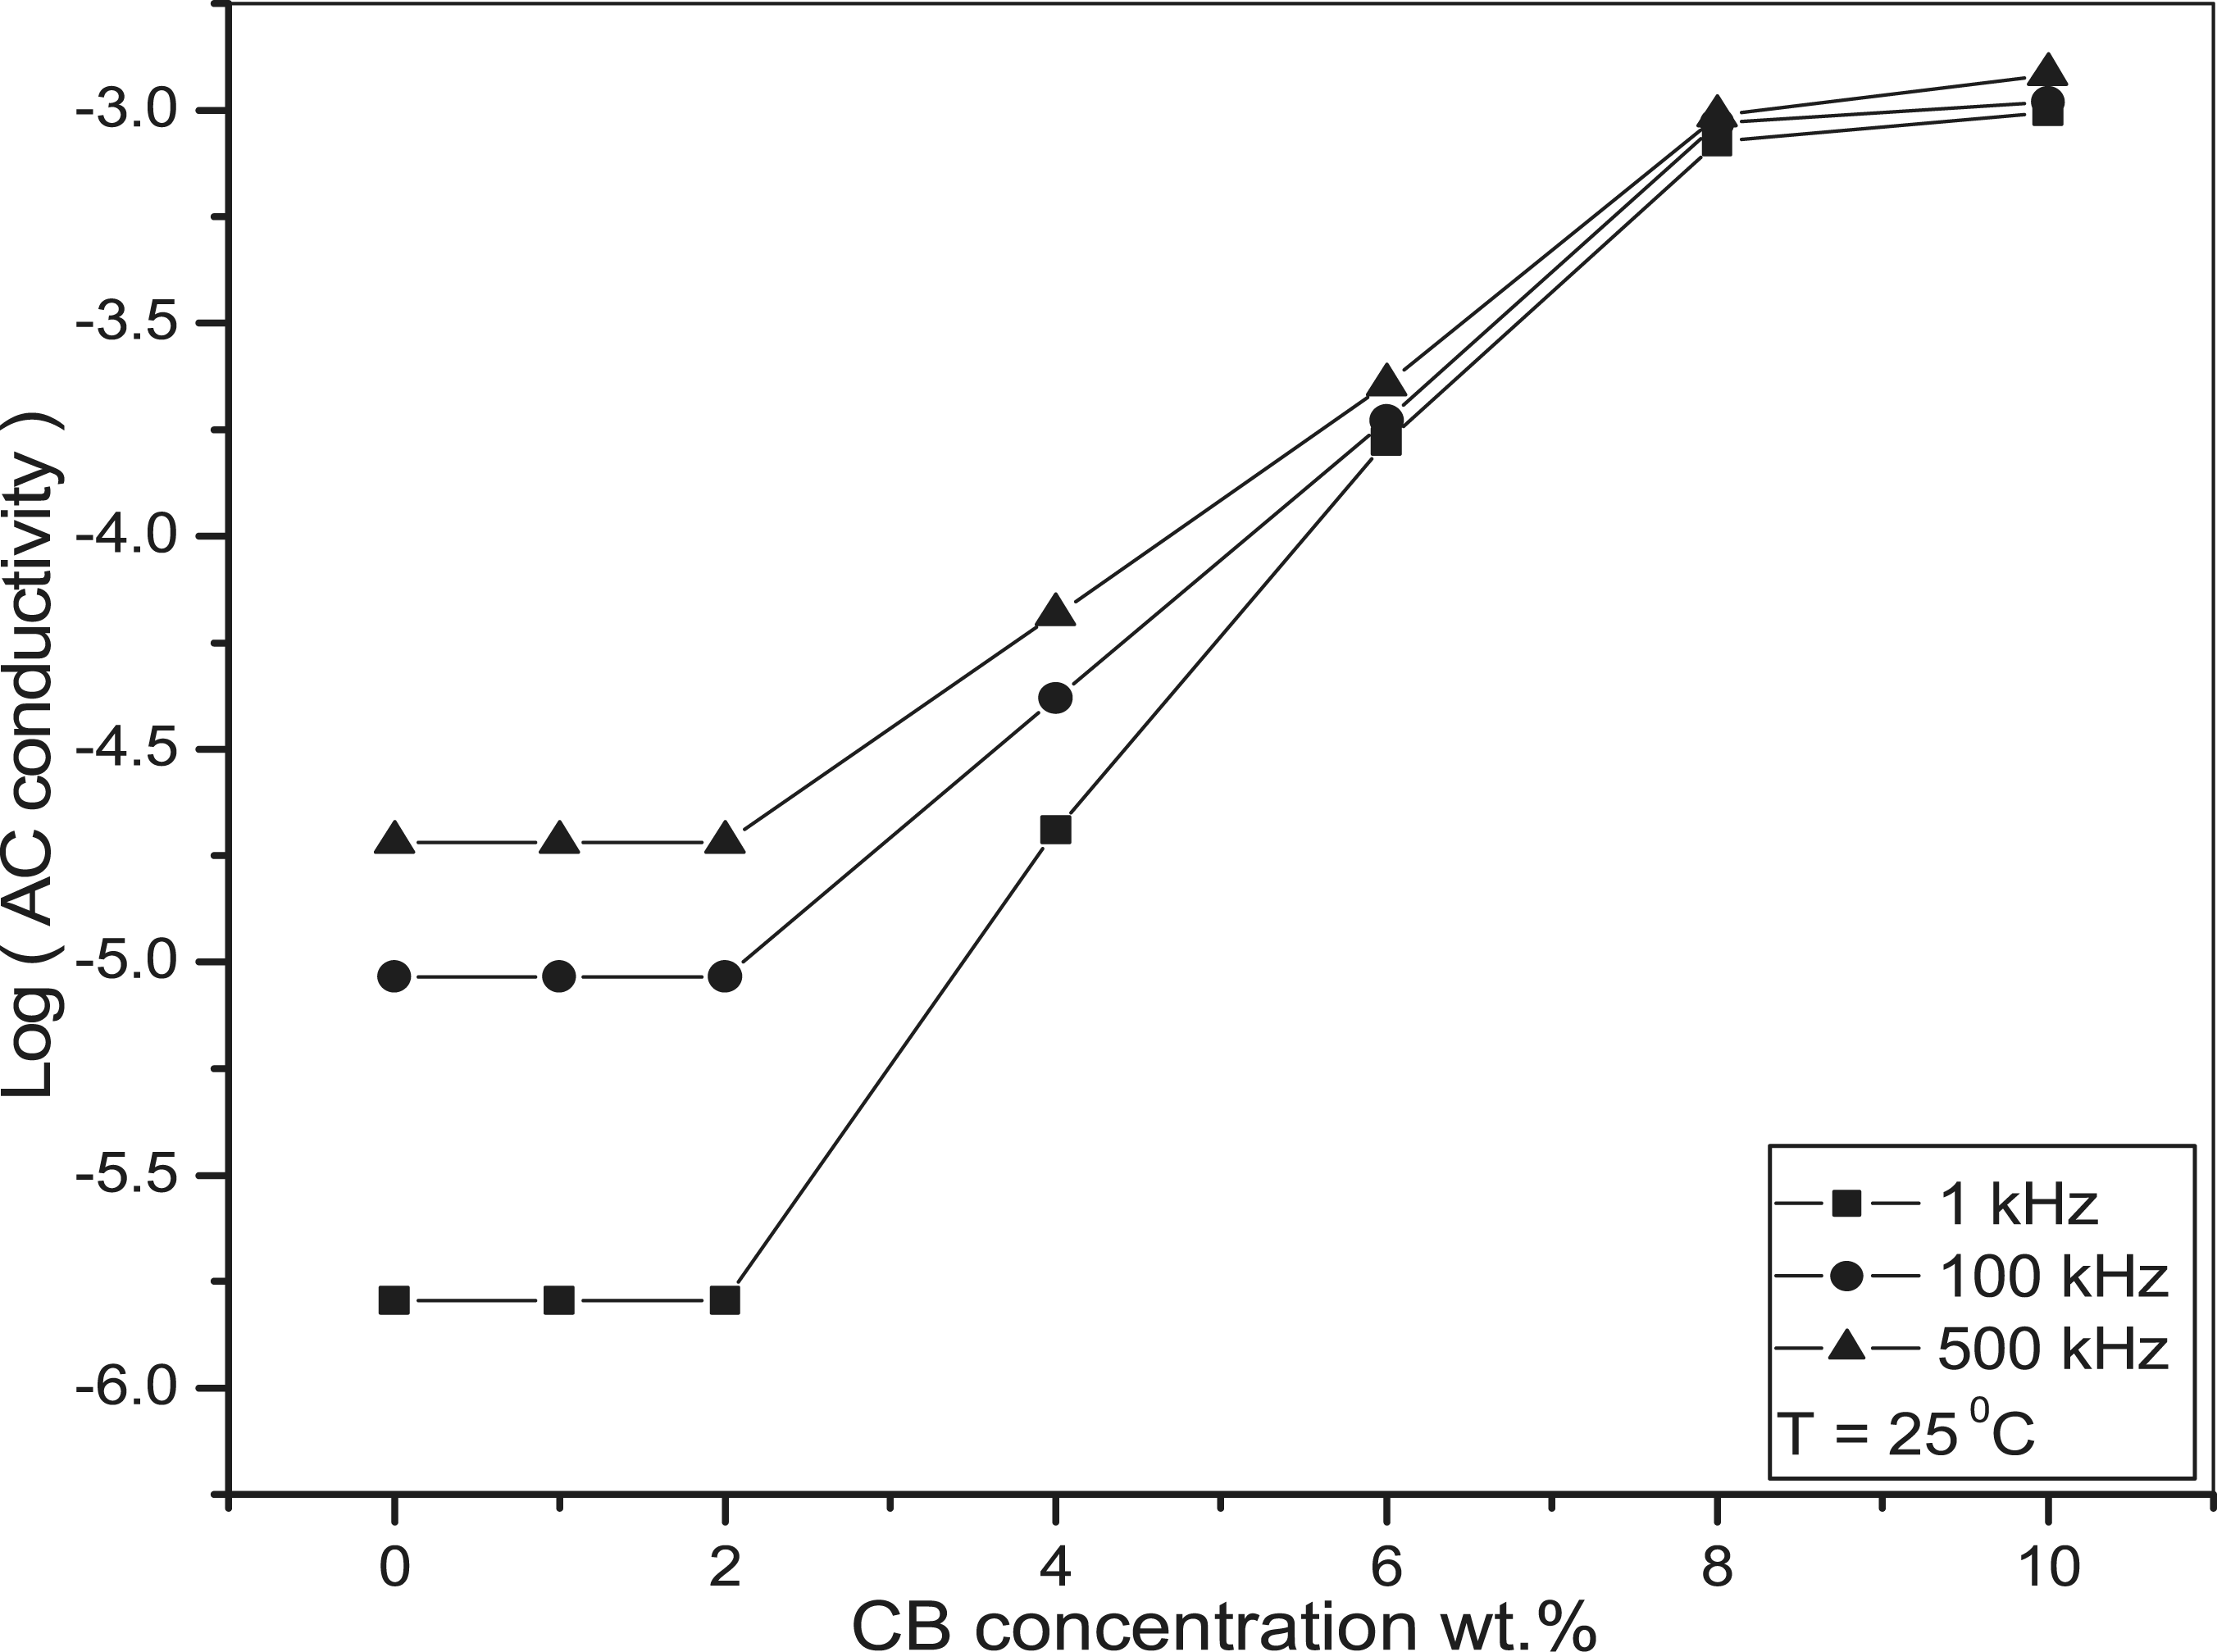
Thermal conductivity results
Thermal conduction in semiconducting materials as conductive polymer composites takes place by phonons propagation and electrons hopping in a thermal process. The thermal conductivity (k) for the prepared conductive PEO films containing different CB concentrations was measured by heat pulse methods in a temperature range from 15 to 55℃ and calculated from the equation
27
:

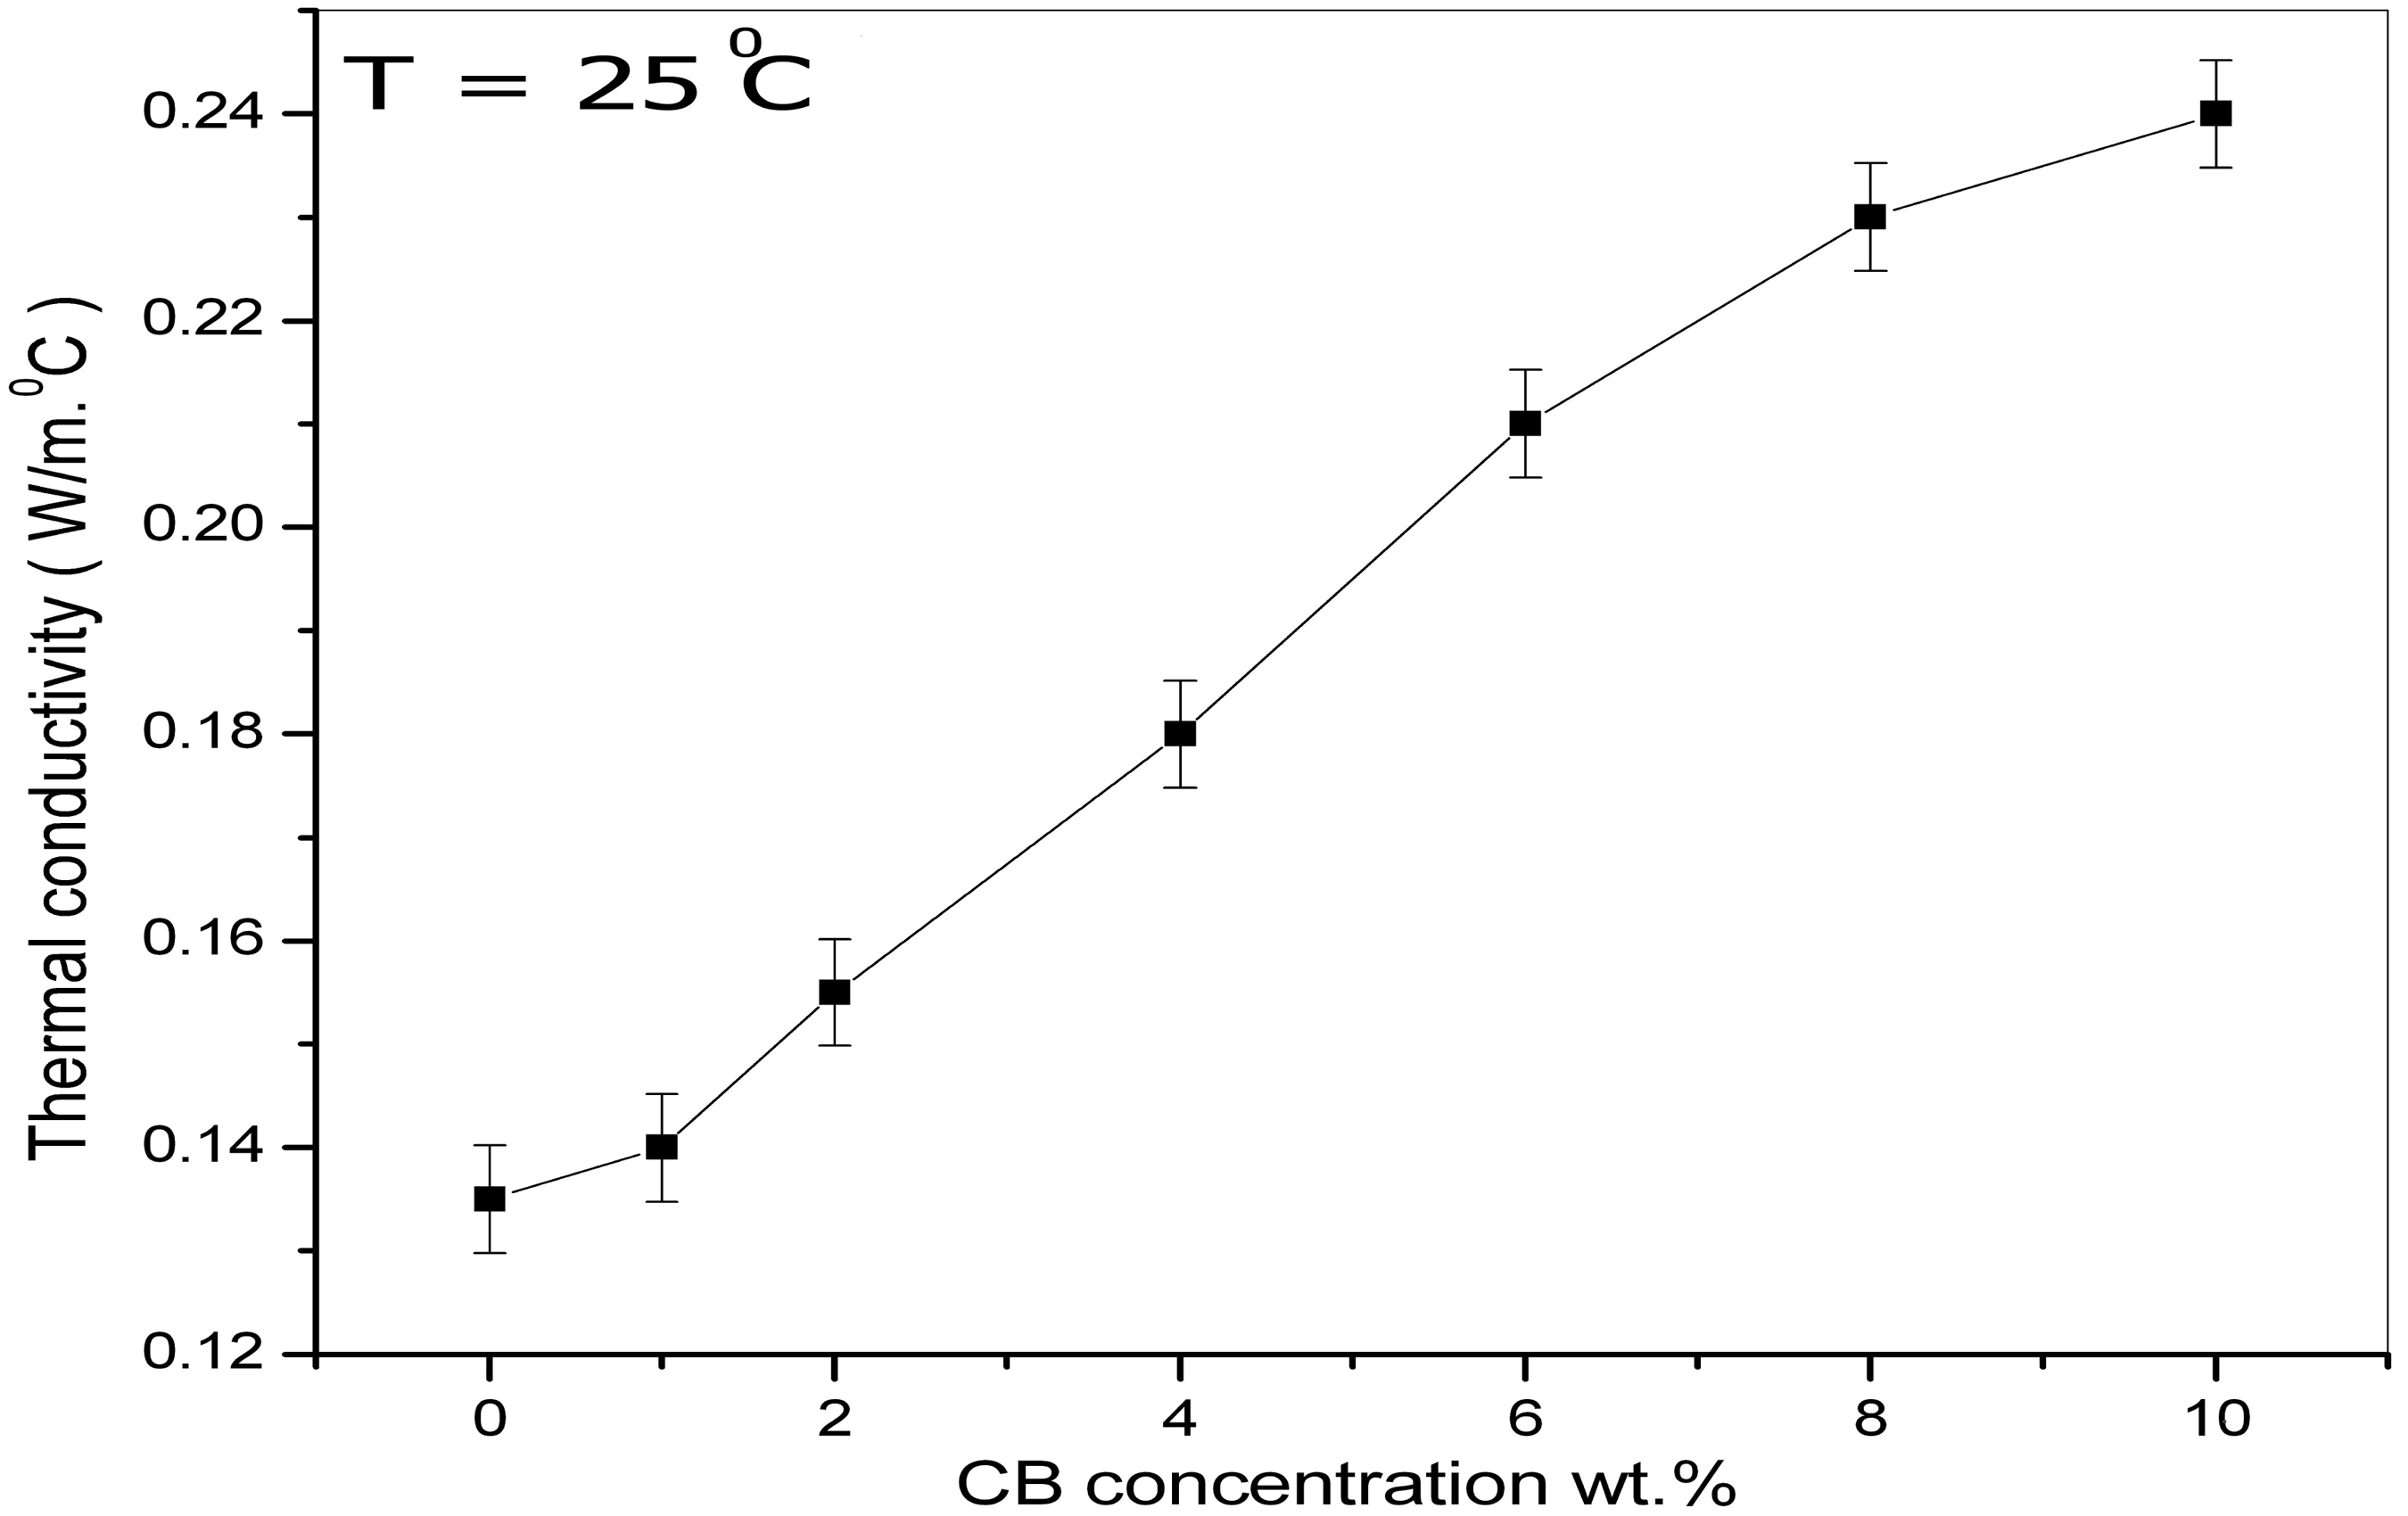
Figures 8 and 9 show the variations of the thermal conductivity with temperature and CB content, respectively, for all prepared films. It can be seen that the thermal conductivity increases with increasing temperature and CB content. In case of raising the temperature, the phonons, ions, electrons and impurities are activated and thus enhancement in the thermal conductivity is produced. At higher filler content, the CB particles tend to form conductive CB aggregates and networks resulting in a rapid increase in thermal conductivity.
28
Thermal conduction mechanisms in PEO polymer matrix filled with highly conductive CB particles vary with the content of CB particles in which conductive networks and paths are formed.
29
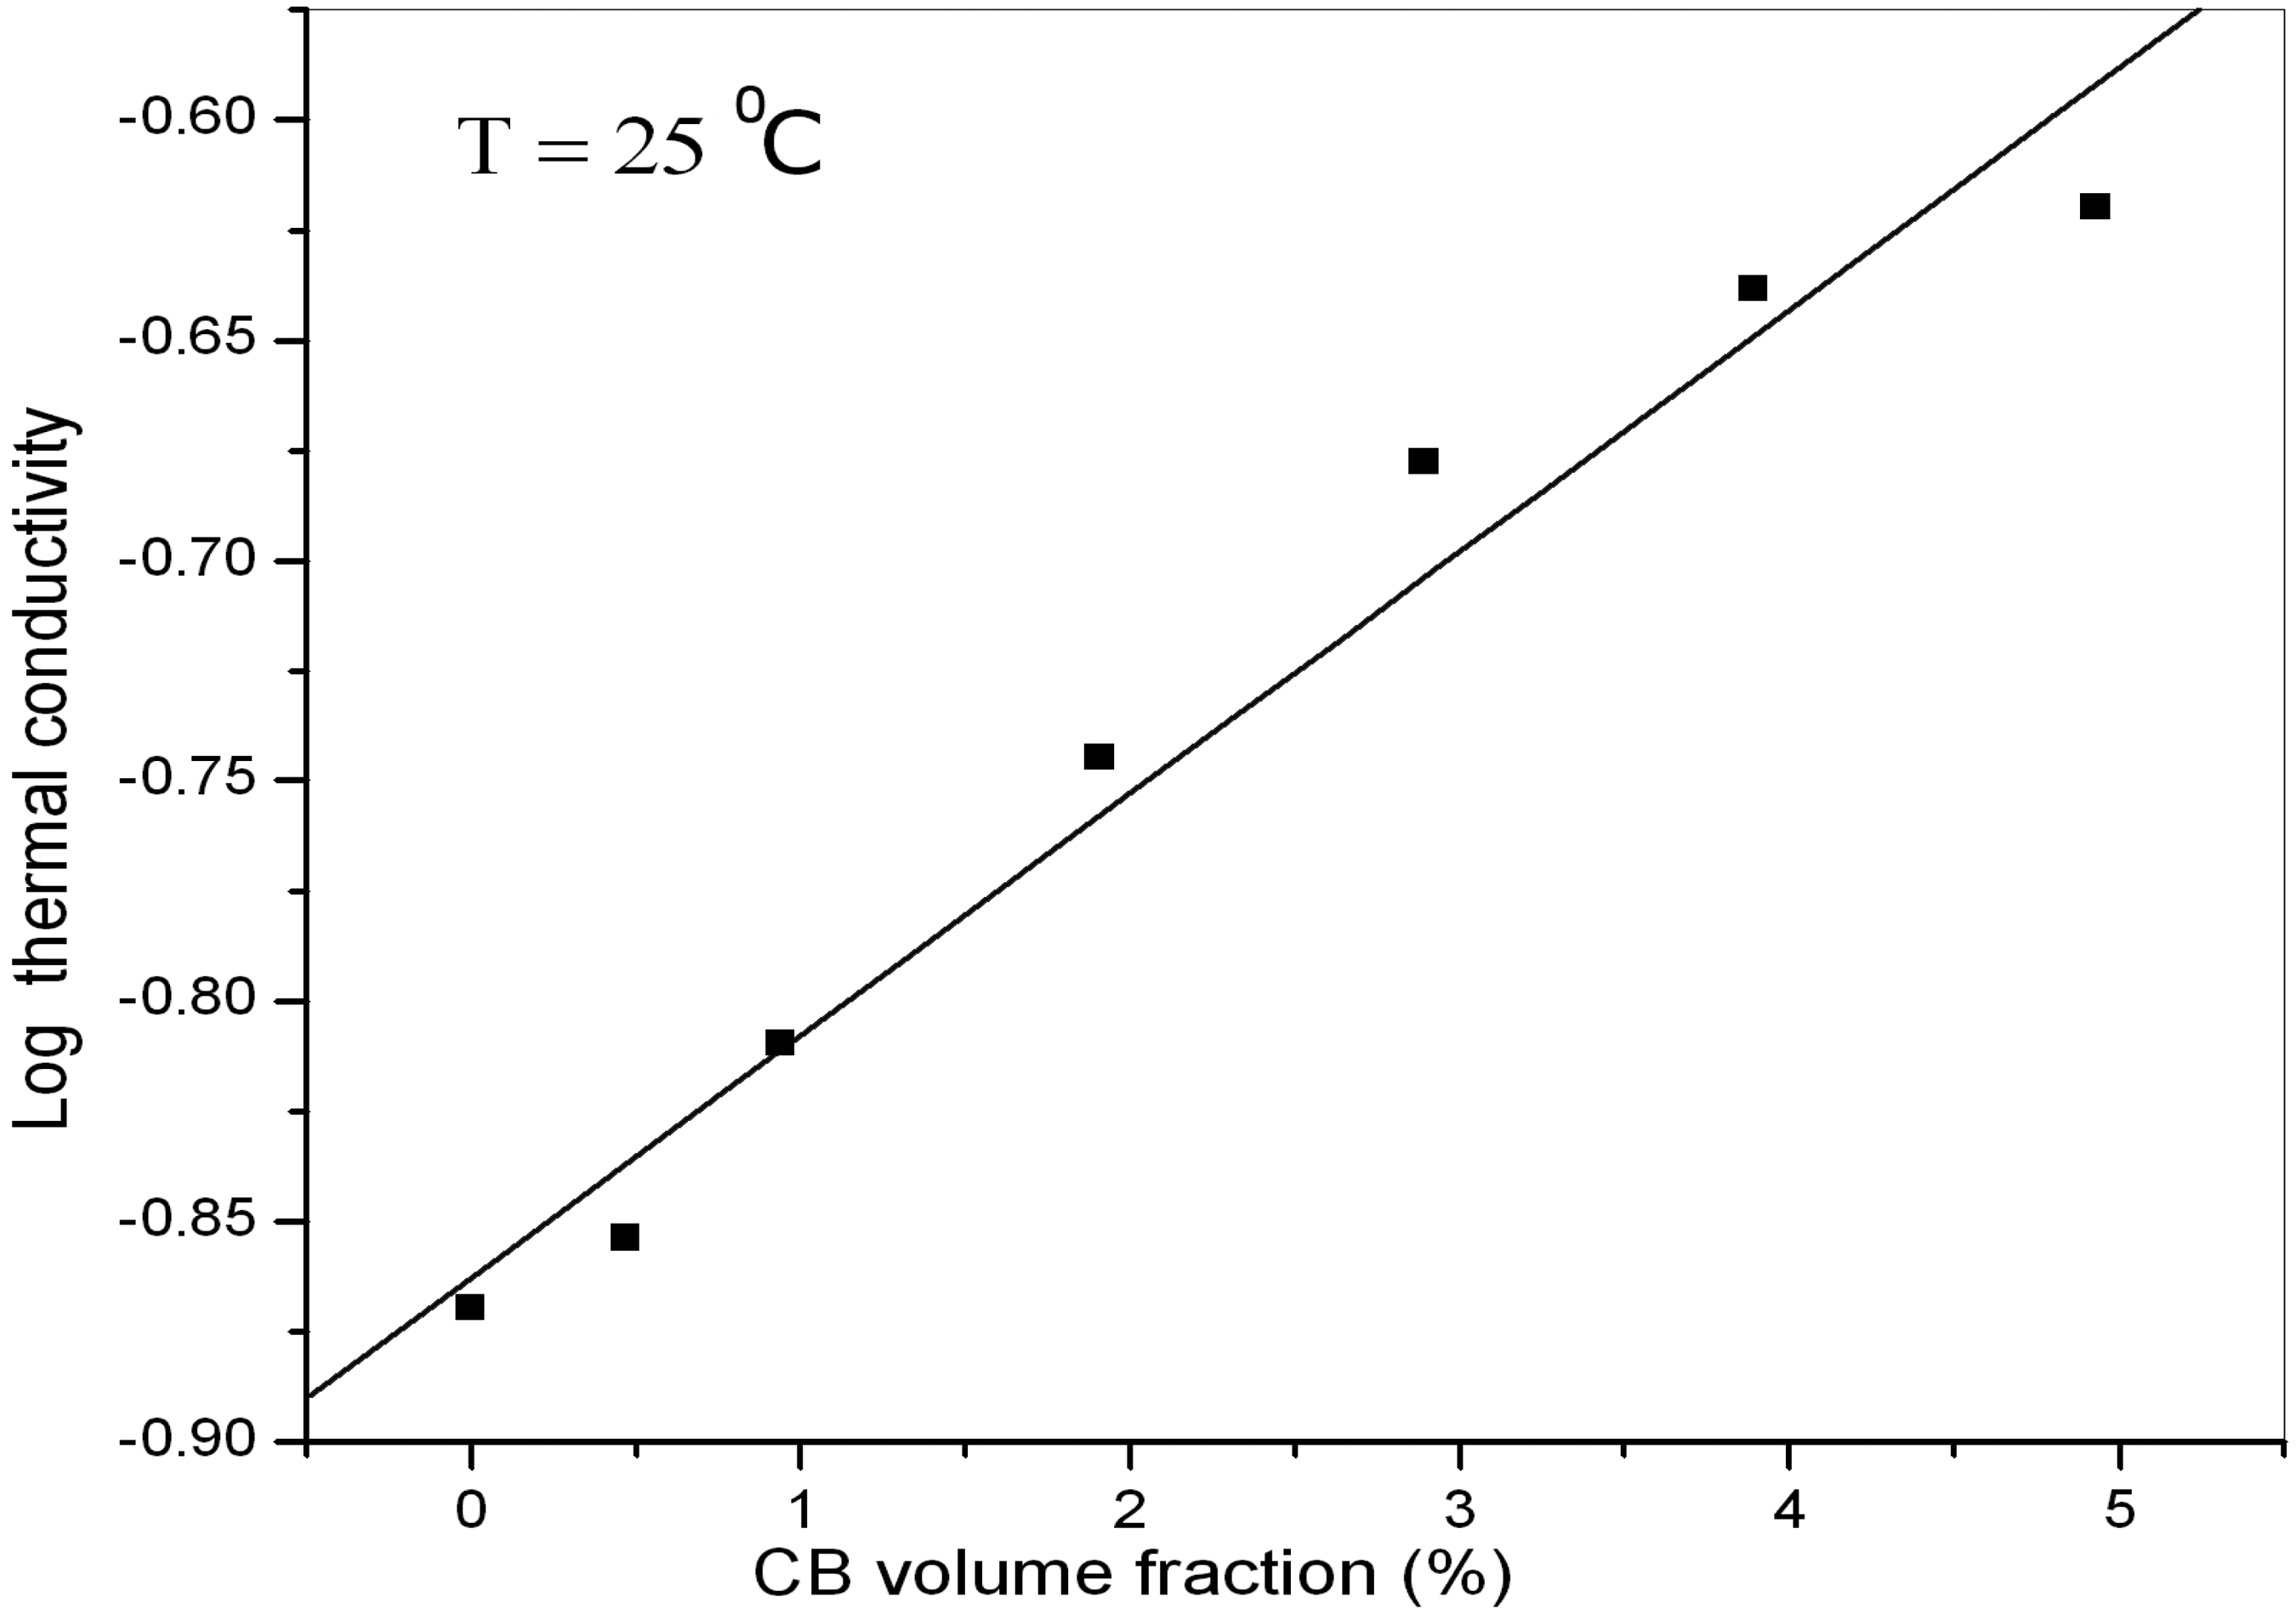
The thermal conductivity changes according to the rearrangement of CB particles in the polymer matrix. When the concentration of CB varies, the thermal conductivity due to electrons varies in direct proportions to the electrical conductivity, whereas the thermal conductivity due to vibrations of atoms remain partially constant. Furthermore, the PEO polymer tends to form some conducting complexes which also contribute in thermal conduction enhancement. Table 2 includes measured values of k, the thermal resistivity (r = 1/k) in (m.℃/W)−1 and the thermal resistance (R = L/k) in (m2.℃/W) for the prepared films. It can be noted that r and R are decreasing as the CB concentration increases, this means that the addition of CB particles to PEO matrix enhances the transfer of heat and electricity by means of multiple process as: paths transport, phonons thermal waves, electrons hopping and charged impurities, and thus leading to increased k and decreased r or R. Fitting the logarithm of observed thermal conductivity of the doped PEO films with CB volume fraction (shown in Figure 10) exhibits an approximate linear dependence which is in agreement with study of Agrawal et al. on measurements on thermal conductivity of styrene-butadiene composites.
30
Variation of thermal conductivity with temperature. Variation of thermal conductivity with carbon black (CB) concentration. Agrawal model of thermal conductivity versus carbon black (CB) volume fraction.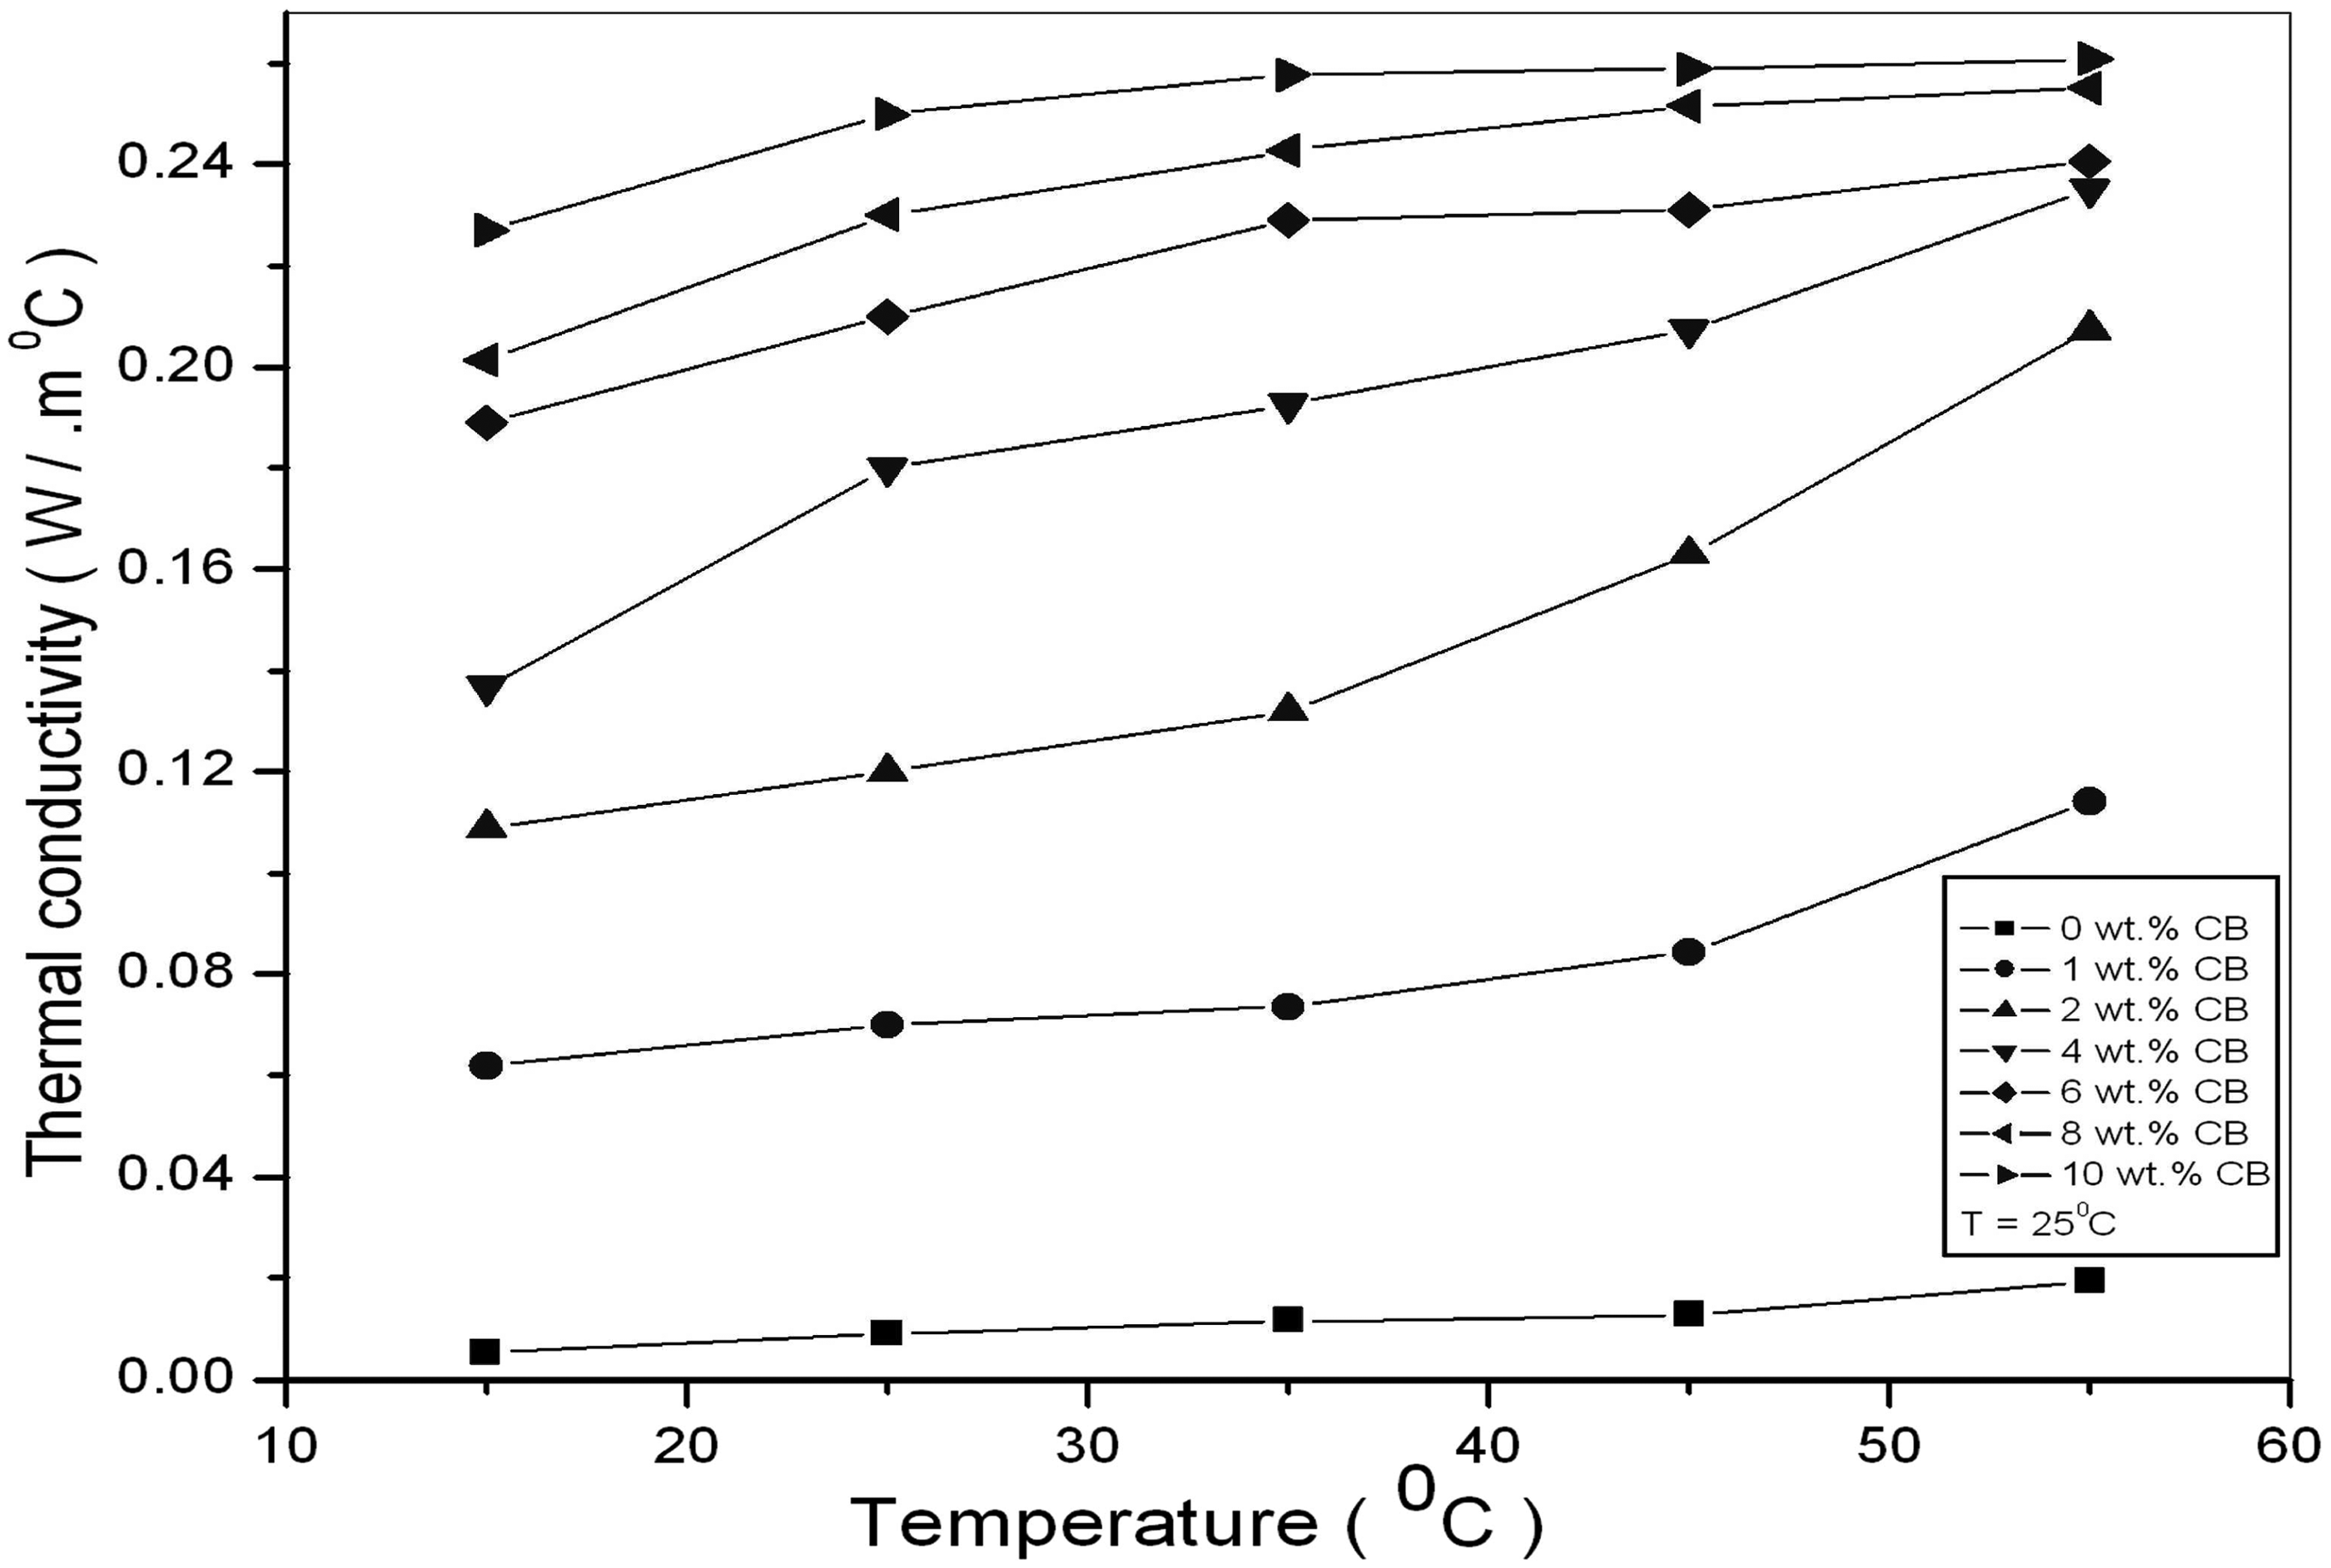
Conclusion
In conclusion, a study of the effect of CB on the thermoelectrical properties of PEO composites was carried out in different measuring conditions of frequency, temperature and CB concentrations. It was found that the AC-quantities of PEO/CB films is temperature, frequency and CB concentration dependent. The AC conduction mechanism can be explained by the creation of the network and paths connecting the CB aggregates in the polymeric matrix. The percolation threshold value occurs at about 2 wt.% CB concentration. It was found that calculated activation energy of the electrical conduction decreases with increasing the CB content. The thermal conductivity was measured by the heat pulse method. The observed thermal conductivity increases with both CB concentration and temperature. The thermal conductivity values fits linearly with the CB concentration as Agrawal’s model predicts.
Footnotes
Funding
This research received no specific grant from any funding agency in the public, commercial, or not-for-profit sectors.
Conflict of Interest
None declared.