
Abstract
663-tin bronze, Ni, W, nano-Al2O3 and Ni-coated graphite mixed as the fundamental alloy powder was added in concentrations of 5 vol.%, 7 vol.%, 9 vol.%, 11 vol.% and 13 vol.% NH4HCO3 respectively to prepare composite powders. Powder metallurgy method was applied to prepare porous materials with these composite powders. Polytetrafluoroethylene was hot-dipped into the pores of the materials to prepare novel polytetrafluoroethylene/copper-matrix self-lubricating composite materials. It was observed that the mechanical properties of the porous materials first increase and then decline with the increase of the added volume fraction of the pore-forming material (NH4HCO3) from 5% to 13%. When the added volume fraction of NH4HCO3 was 9%, the mechanical properties of the sample reached the maximum: its density was – 5.52 g/cm3, hardness – 35.5 HV and crushing strength – 148 MPa. The samples containing 9% (volume fraction) NH4HCO3 were hot-dipped with polytetrafluoroethylene in the water bath at 50℃, 60℃, 70℃, 80℃ and 90℃ respectively for 1.5 h, as a result of which the content of polytetrafluoroethylene in the samples first increased and then declined with the rise of temperature. When the temperature was 60℃, the content of polytetrafluoroethylene in the sample reached the maximum, indicating that the frictional performance obviously improved by the polytetrafluoroethylene: the wear loss was 6 mg and friction coefficient was 0.08, which proved that the novel polytetrafluoroethylene/copper-matrix composite material had excellent self-lubricating properties.
Introduction
Copper matrix material is one of the metal matrix self-lubricating composite materials that are widely used in preparing frictional parts of sewing machinery and food machinery.1,2 Tin bronze with excellent tribological properties, oxidation resistance and corrosion resistance is commonly used in sliding bearing. However, the powder metallurgy tin bronze/copper-matrix self-lubricating composite material is similar, as for as its properties are concerned, to ordinary sintered materials, which have low strength and poor toughness: when temperature is higher than 300℃, its matrix strength and wear resistance decline correspondingly. When it is used as self-lubricating composite materials, strengthening of metal matrix and matching the solid lubricating phase to form the copper-matrix self-lubricating composite materials with high strength and high wear resistance are necessary. For example, it can be used in the oil-free lubricating working condition of high-speed sewing machinery frictional parts. 3
As we all know, the main alloy elements in tin bronze are Sn and Zn, which are soluble in the lattice of Cu where the strengthening effect of the solid solution is remarkable. In order to further improve the mechanical performance and the frictional performance of tin bronze materials, on one hand, Ni-, W-, nano-Al2O3- and Cu-coated carbon fiber are added to the matrix materials to reinforce the matrix and improve the mechanical properties of materials;4–7 on the other hand, graphite, Cu-coated graphite, MoS2 and other solid lubricants are added to the matrix materials to improve the frictional properties and self-lubricating performance of the materials.3,8–10 In addition, filling polymer materials in the porous metal matrix to make use of the good antiwear performance of polymer materials (PTFE) has become a hot topic in the study of the self-lubricating materials.11,12
So far, powder metallurgical technology is one of the principal methods of preparing porous metal materials. But the copper-matrix frictional composite materials prepared with powder metallurgical technology contain pores, and this facilitates the addition of other lubricating phase in the pores. The porous copper alloy materials prepared with powder metallurgy have been extensively studied, which shows that they have many advantages such as high strength and narrow distribution pore. Zhang and Wang13,14 used copper powder whose particle size was 5 µm and 45 µm and methyl methacrylate (PMMA) as the pore-forming material to prepare porous copper in which the porosity is low and the size and shape of the pores can be controlled was also used.
Polytetrafluoroethylene (PTFE) as a common self-lubricating material, easily slide along the sliding direction and also easily transfer, because its molecules are combined only by van der Waals force. That is, it is easy for PTFE to develop consecutive transfer film on the surface of dual face. Therefore, when the PTFE friction braze/rub with metal, the friction coefficient is very low, which indicates that the material has good self-lubricating performance.11,12,15,16 As a lubricant, its friction coefficient is the lowest in all materials and its chemical stability is the highest in all plastic materials. In the process of friction, there is no adherence and agglutination between the friction surfaces, that is, PTFE has self-lubrication and antiwear performance. Its performance does not change in a wide range of temperature, even in vacuum. However, its wear resistance is poor, and it is easy to be worn off under high load, so PTFE is generally used together with hard metal to make use of its self-lubrication and antiwear performance, and to improve the wear resistance performance as well. At present, there are fewer studies about secondary composite PTFE in the porous copper alloy materials which are used to form composite materials. In order to have the self-lubricating performance of copper-matrix composite materials further improved on the basis of previous studies,2,3 in this study, we hot-dipped the PTFE in the pores of the samples pore-formed by NH4HCO3 to prepare novel PTFE/copper-matrix self-lubricating composite materials so as to improve the self-lubricating performance of the samples.
Experimental methods
Experimental materials
The components of the powder (wt%).

The experimental process and technique
The mixing process includes the following four steps. (1) Having 50% of nano-Al2O3 and 50% 663-tin bronze humid mixed for 4–8 h to form the master alloy; (2) Having W and 663-tin bronze dry mixed for 6–8 h at a ratio of 1 : 1; (3) Taking certain amounts of the mixed powder produced in the first two steps and adding the rest of the powder to have it dry mixed for 6–8 h according to the formula as shown in Table 1. They are mixed uniformly to form the composite alloy powder and pressed to make samples. (4) Taking the mixed powder made in the third step and then using the electric blender to mix them for 8 h.
The pressing process includes weighing of materials, filling die, pressing and demolding. The samples were pressed two-directionally with the hydraulic press with the pressing force being 560 MPa. It was ensured during the pressing process that the pressure was exerted and released uniformly and slowly. When the expected pressure was reached, the pressure was maintained for 1 min for the gas to exhaust successfully and to ensure that the cavity was filled with sufficient powder. The pressed samples were sintered in the tubular furnace under the atmospheric hydrogen. The sintering temperature was 940℃ and it was maintained for 4 h. The samples were taken out of the furnace after it cooled to 175℃.
The process of PTFE hot dipping is as follows: taking 5 samples with 9% (volume fraction) NH4HCO3, and putting them in a dry furnace to prevent the water in the pores from influencing the hot dipping of PTFE; putting the samples in a water bath to hot dip PTFE for 1.5 h under 50℃, 60℃, 70℃, 80℃ and 90℃, respectively. The samples of the hot-dipped PTFE were taken out and then put in a dry furnace for drying them under 120℃.
Analysis method
The microstructure and energy-dispersive X-ray spectroscopy (EDS) spectrum of the samples were analyzed by optical microscopy (OLYMPUS GX71) and scanning electron microscopy (SEM, SSX-550). The phase structure of the samples’ surface was analyzed by the X-ray diffraction (XRD, PW3040/60). The density of the samples was measured according to GB5123-1985. The hardness was measured with a 450 SVD Vickers hardness tester with a load of 50 N and a holding time of 10 s. Radial compression strength of the samples was measured with a LJ-3000A mechanical tensile testing machine according to GB6804 and ISO2739. The wear and friction properties were tested with a wear testing machine.
3
The couple parts were GCr15 steel friction disc, and its hardness was HRC60. Under the load of 40 N, the samples were made to slide for 20 min at the rotating speed of 250 r/min. By measuring the density and porosity of the samples, we can infer the physical properties approximately, and because of the irregular contraction or expansion of samples, the density and porosity were investigated with drainage. According to national standards of China GB5123-1985, equations (1) and (2) were used to calculate the density and porosity

Results and analysis
The analysis of the metallographic morphology of porous copper-matrix composite materials
Figure 1 shows the metallographic photos of the sintered samples with different volume fraction of NH4HCO3. This figure shows that the pores in Figure 1(a) is the least and the combination of the matrix is the most dense. It also shows that most pores exist among particles, and their sizes and shapes are different. There are various shapes, most of which are disk shaped. In order to explain more effectively the discretion of the porosity of these samples, the mechanical performance of these samples was tested.
The metallographic photos of the sintered samples prepared by different volume fraction of NH4HCO3: (a) 5%; (b) 7%; (c) 9%; (d) 11%; (e) 13%.
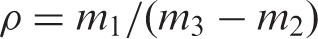
Figure 2 shows the SEM image of the sintered sample with 9 vol.% NH4HCO3 This figure shows that pores exist among particles and they take various shapes, such as circle, triangle, branch, etc. Their sizes are also different, and the average size is about 10–15 µm or so. The distribution of pores is uniform. Pore A as shown in Figure 2 is a typical pore in the samples.
The scanning electron microscopy image of the sintered sample with 9 vol.% NH4HCO3.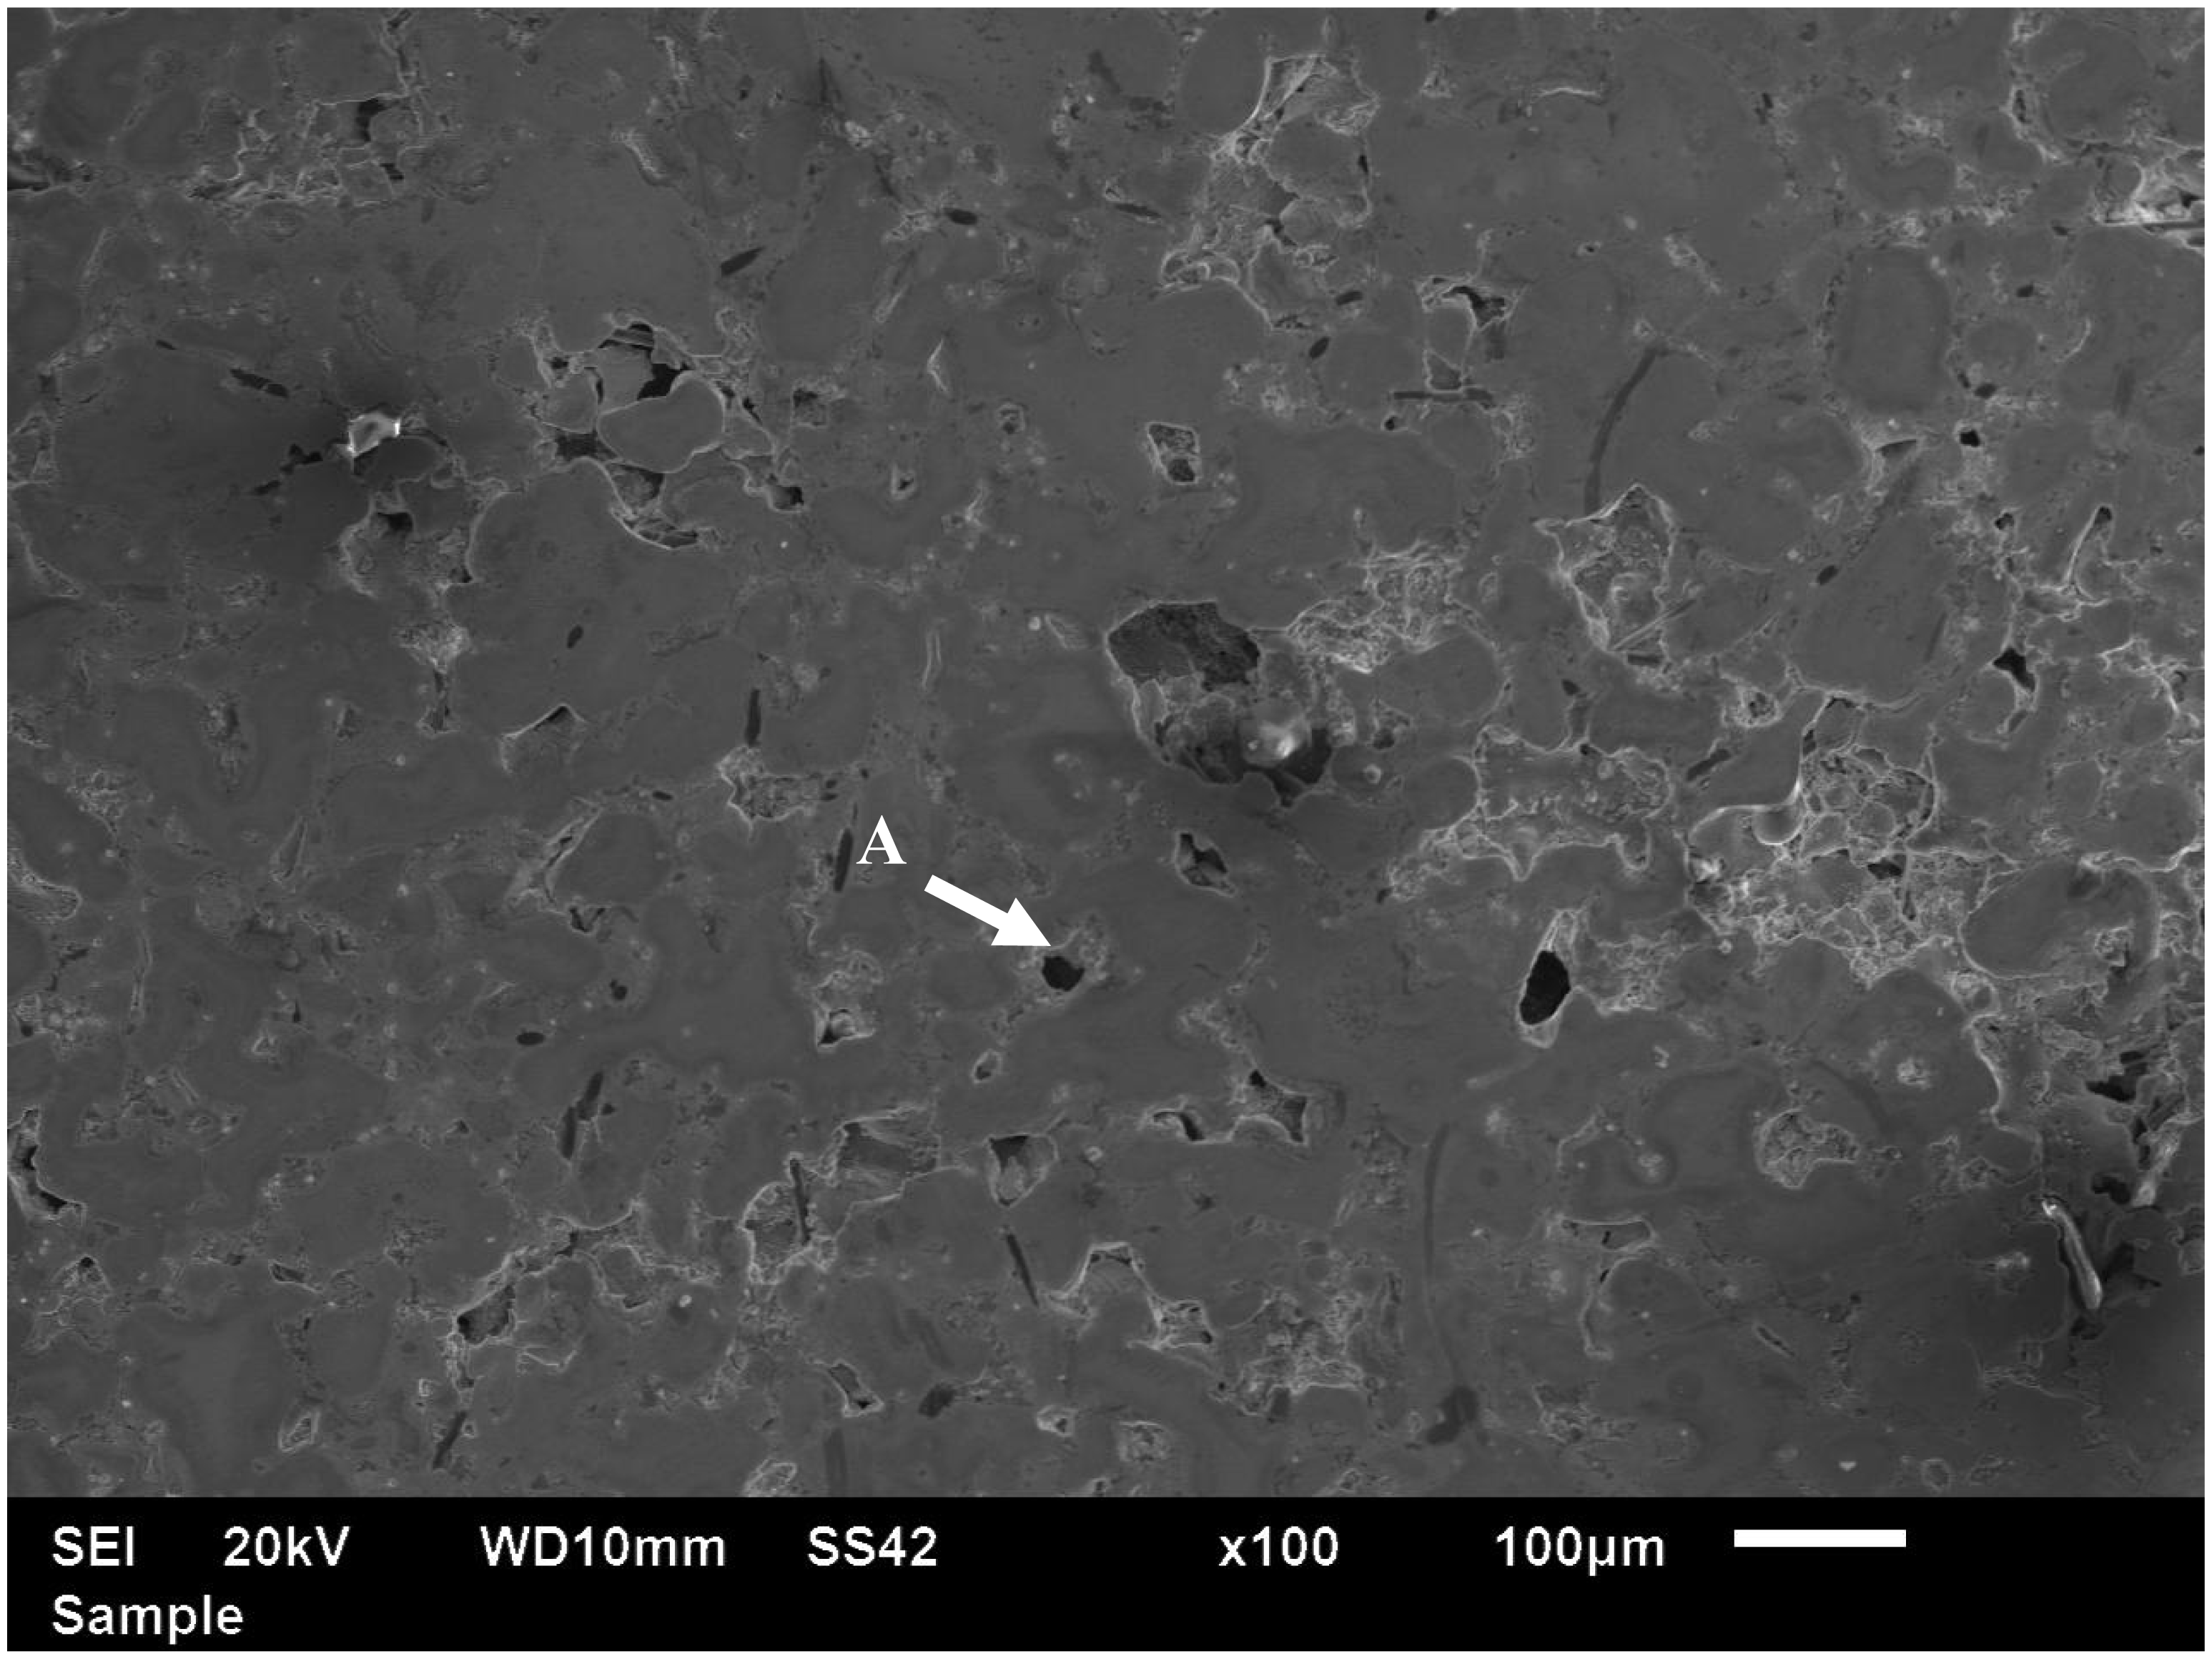
Figure 3 shows the profile and EDS spectrum of the pore A in Figure 2. It shows that the content of Cu and other elements in the matrix on the two sides of pore A is high and stable. But the content of Cu in pore A drop sharply to a very low value and there are little other elements existing in pore A, that is, there is almost no other elements except a little Cu in pore A. This indicates that spot A is really a pore. It can be seen in the scanning morphology that there are many pores like pore A in the sintered samples which is not filled with lubricating and reinforced phase, and that the pores are formed after the thermal decomposition of pore-forming materials.
The profile and EDS spectrum of pore A in Figure 2.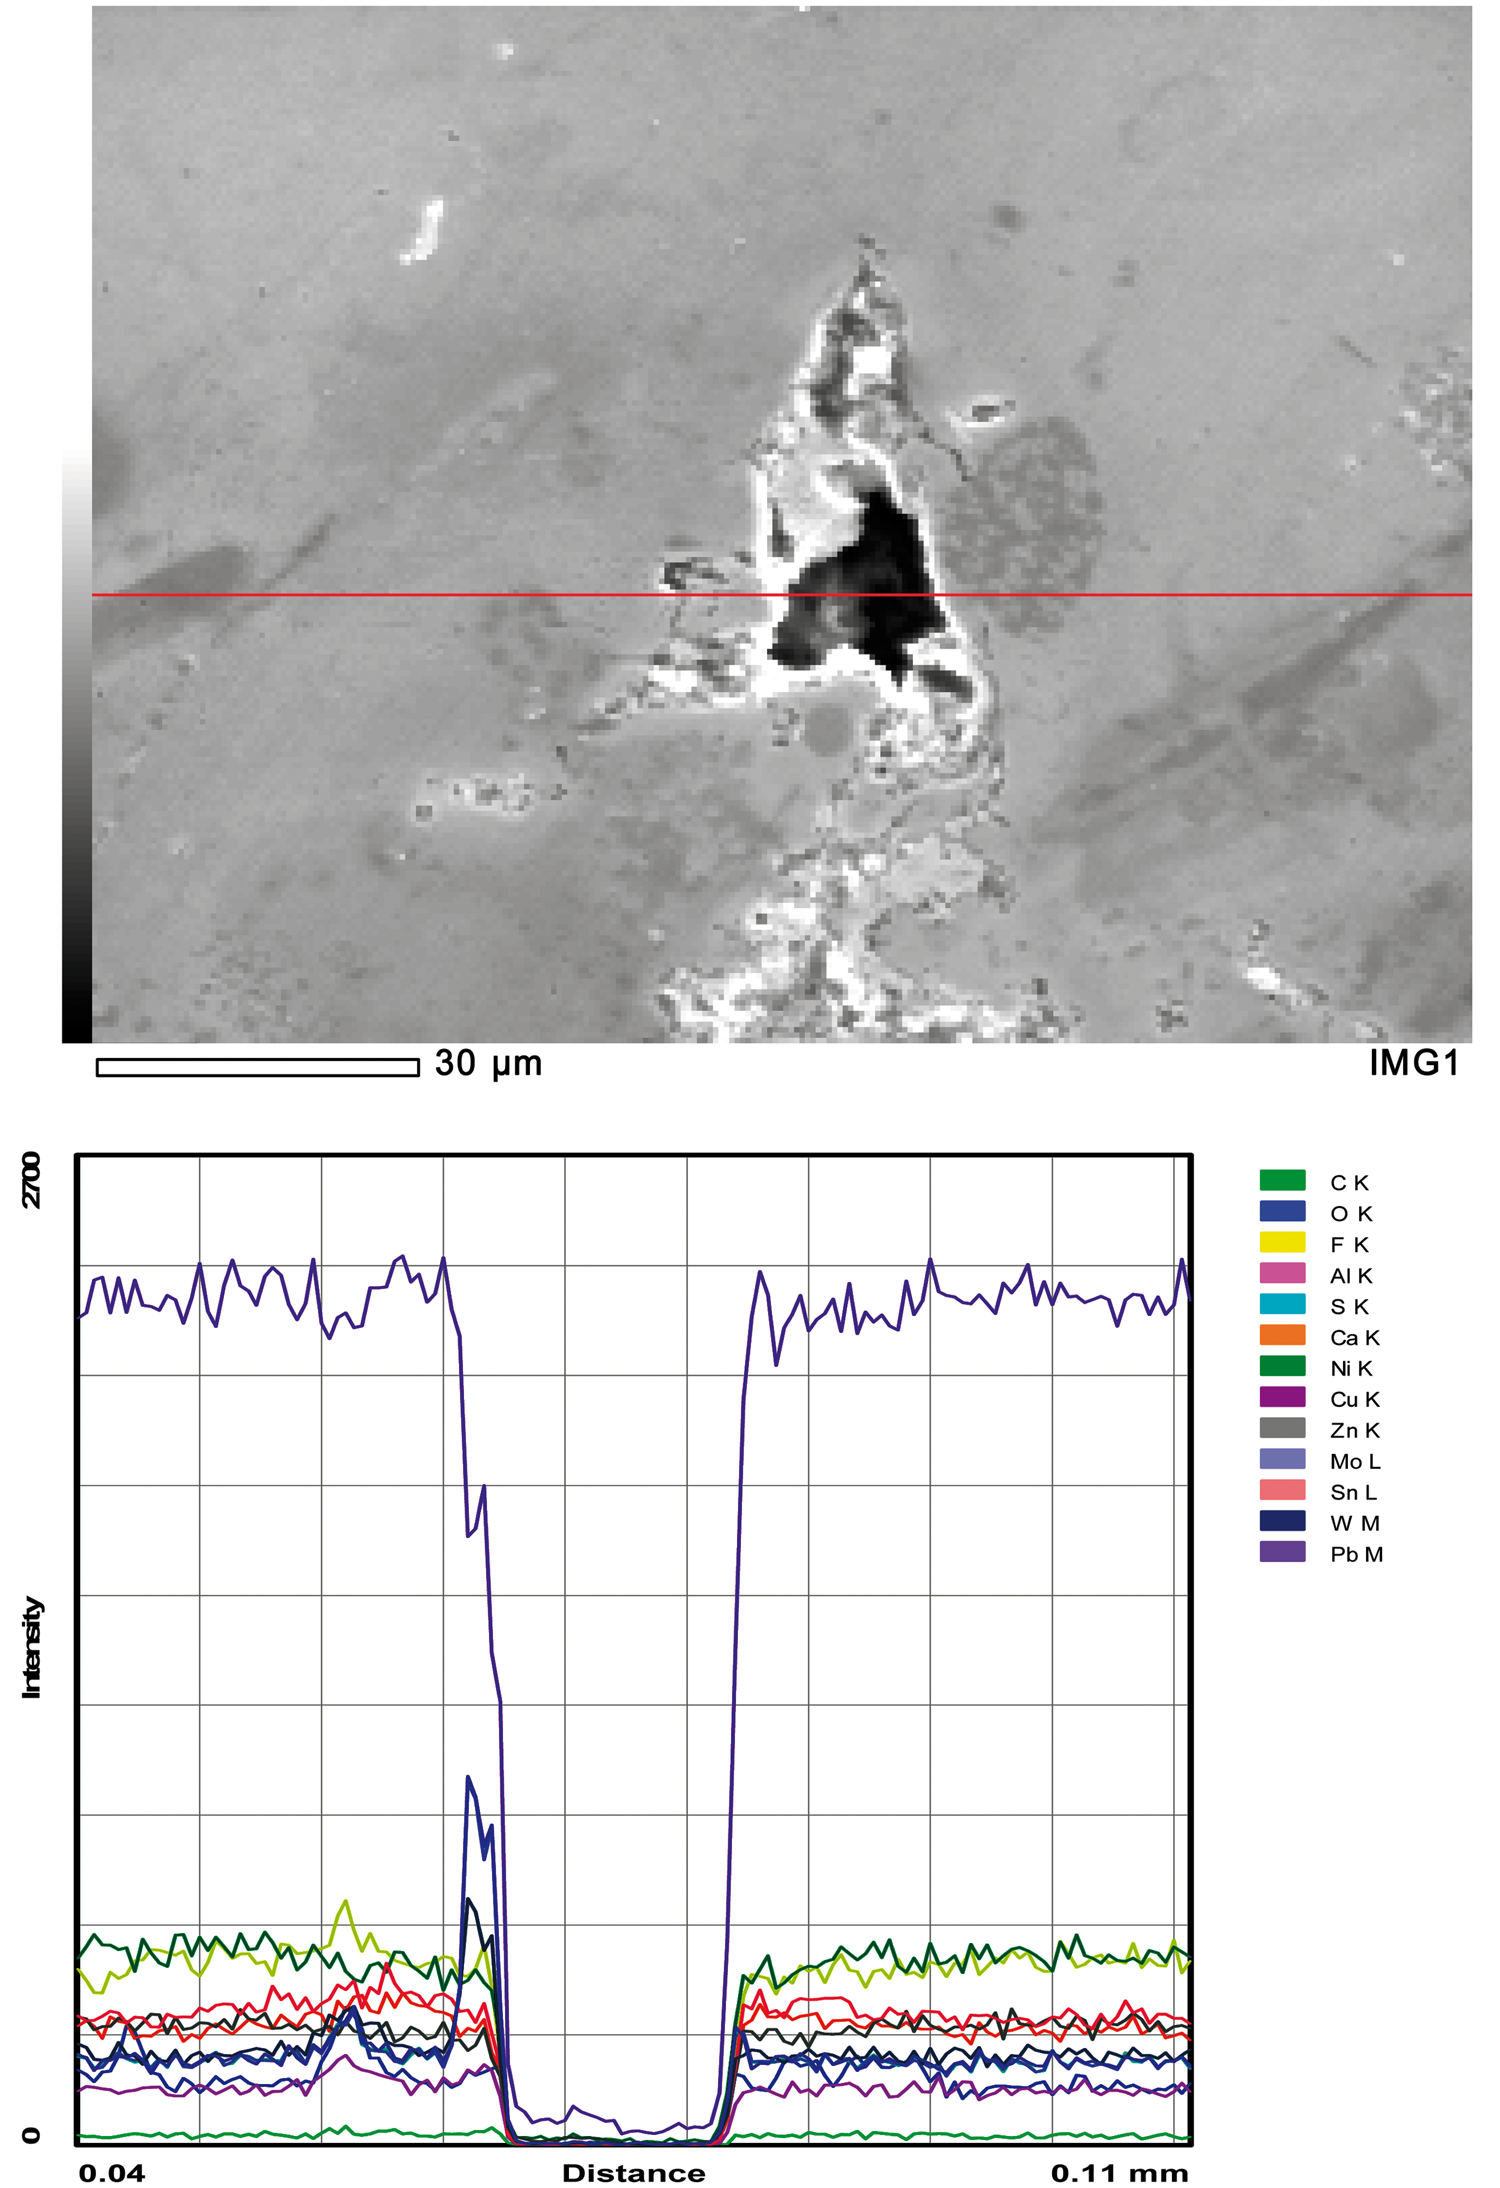
Analysis of the mechanical properties of the porous copper-matrix composite materials
The mechanical and physical properties of the composite materials with different volume percentage of NH4HCO3.
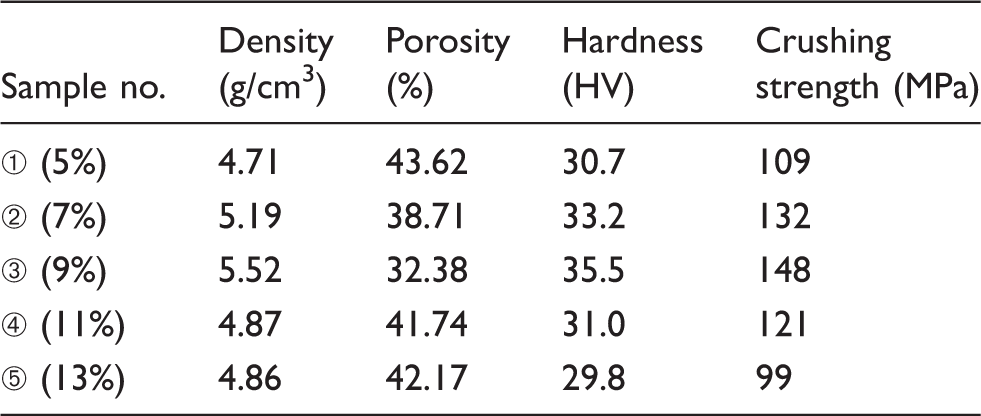
Figure 4 shows the curve of the effect of NH4HCO3 on the mechanical properties of the composite materials. Figure 4(a) shows the curve of the effect of NH4HCO3 on the hardness of the composite materials, and Figure 4(b) shows the curve of the effect of NH4HCO3 on the crushing strength of the composite materials. Figure 4(a) and (b) shows that the hardness and crushing strength of the materials first increase and then decline with the increase in the volume fraction of pore-forming materials from 5% to 13%. When NH4HCO3 addition is 9 vol.%, the hardness and crushing strength of the samples reach the maximum, the values being 35.5 HV and 148 MPa, respectively. Obviously, this sample has the best comprehensive performance.
The curve of the effect of NH4HCO3 on the mechanical properties of the composite materials: (a) hardness; (b) crushing strength.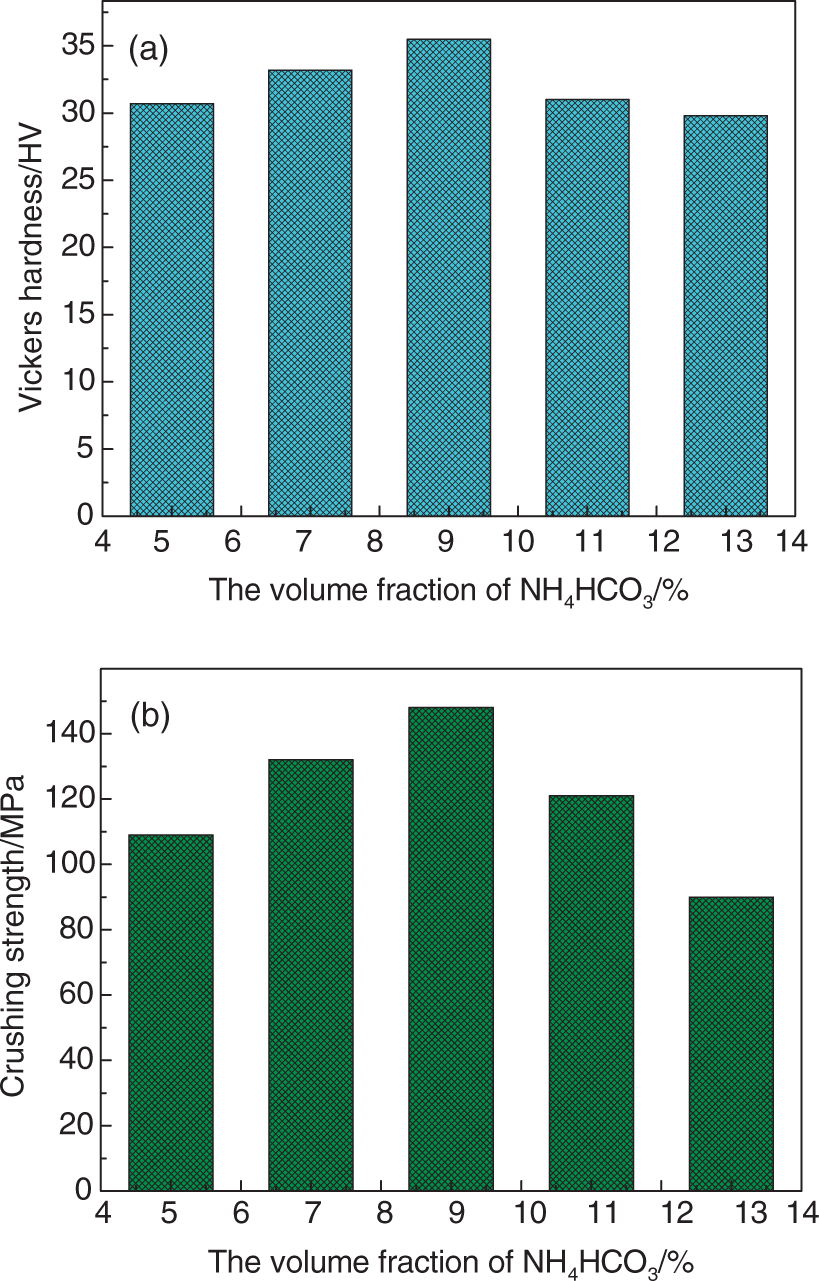
The structure and the morphology feature of the PTFE/copper-matrix composite materials
Figure 5 shows the metallographic photos of the samples hot-dipped PTFE under different temperature. As the arrow shows, the areas showing black in the pores and the interface between particles are PTFE hot-dipped into the samples. Obviously, when the temperature is 60℃, the amount of PTFE hot-dipped into the samples is the maximum. In the process of hot-dipping, when the temperature is 80℃, it is observed that concretion of PTFE appears on the surface layer of PTFE suspension and the wall of beaker, and a few dregs appear in the PTFE suspension. When the temperature is 90℃, the concretion and turbidity phenomena aggravate. When the temperature is extremely high, PTFE particles gather together because of the evaporation of water in the PTFE suspension, so it is difficult for PTFE to be hot-dipped into the pore of the samples. That is the reason for the amounts of PTFE to be less as seen in Figure 5(d) and (e). Therefore, hot-dipping temperature must be moderate, because high temperature will cause the solidification of PTFE, and low temperature declines the hot-dipping power.
The metallographic photos of the samples hot-dipped PTFE under different temperature: (a) 50℃; (b) 60℃; (c) 70℃; (d) 80℃; (e) 90℃.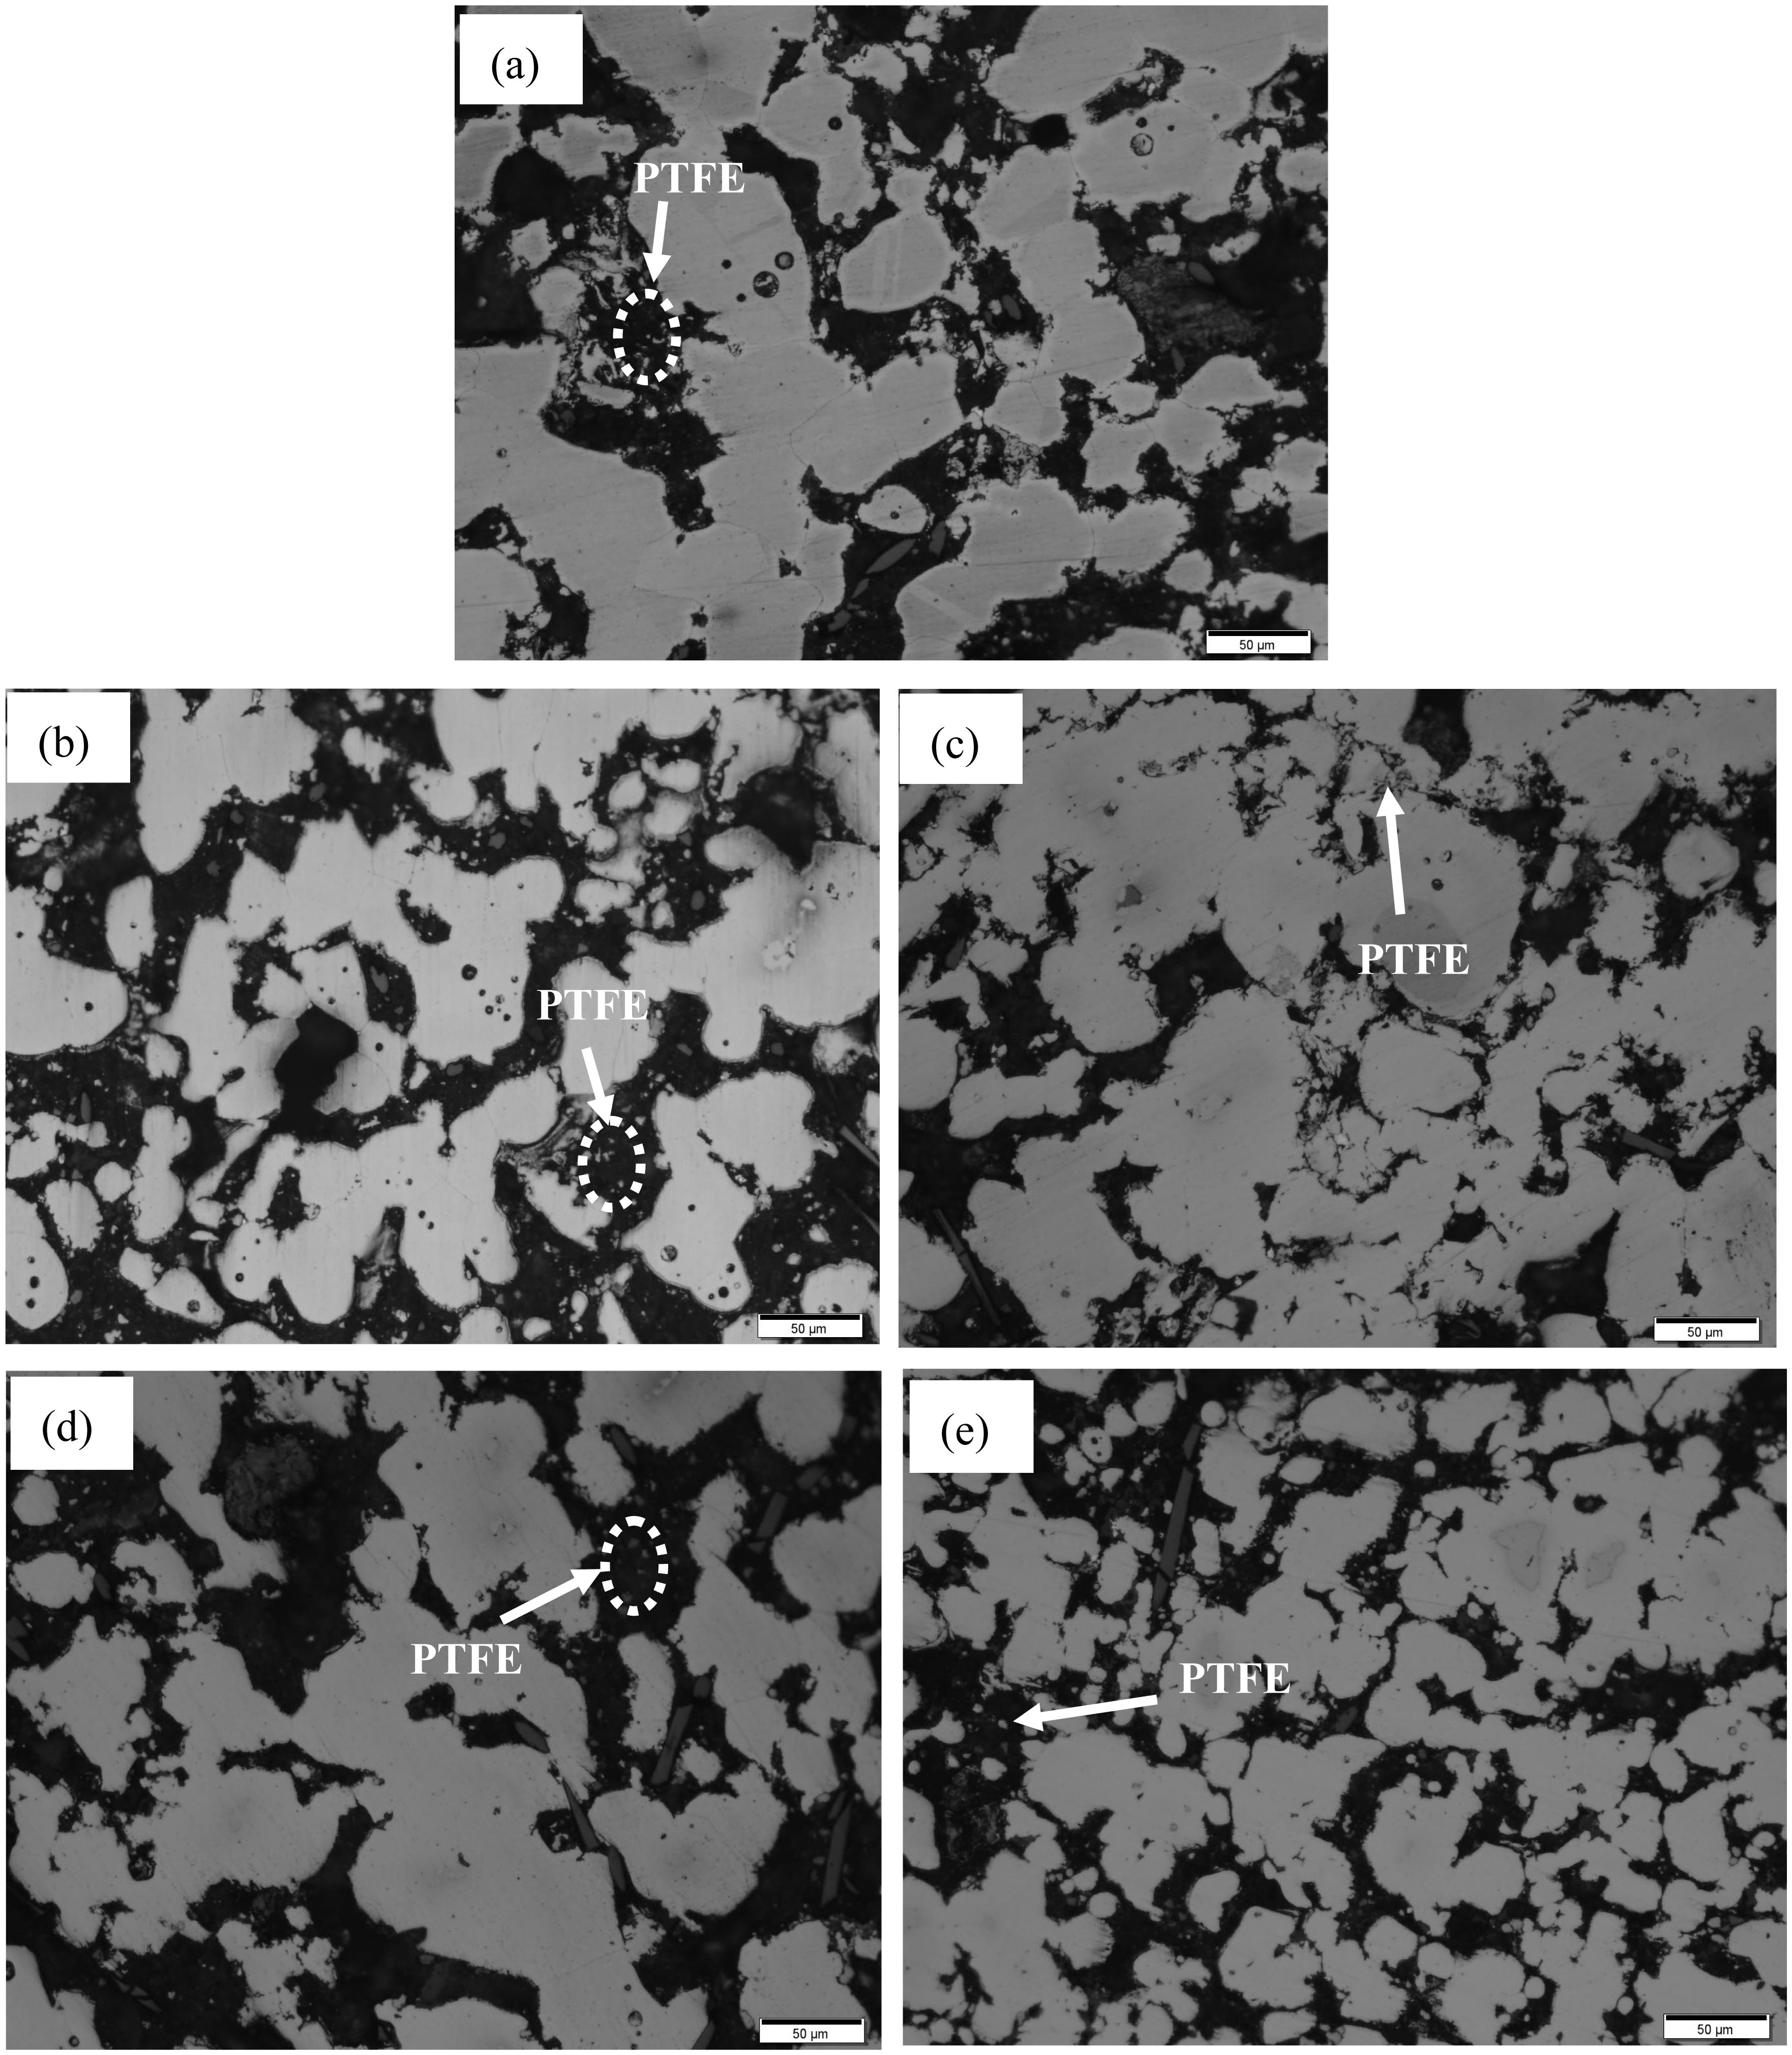
Figure 6 reveals the SEM images of samples hot-dipped PTFE under different temperatures. As shown in this figure, white PTFE exist in the pores and the interface among copper alloy particles. When the hot-dipping temperature is different, the amount of PTFE hot-dipped into the samples will be different. When the temperature is 60℃, the PTFE hot-dipped into the samples reaches the maximum, and when temperature is 80℃ and 90℃, the PTFE hot-dipped into the samples is less. That is to say, 60℃ is the most appropriate hot-dipping temperature.
The scanning electron microscopy images of the samples hot-dipped PTFE under different temperatures: (a) 50℃; (b) 60℃; (c) 70℃; (d) 80℃; (e) 90℃.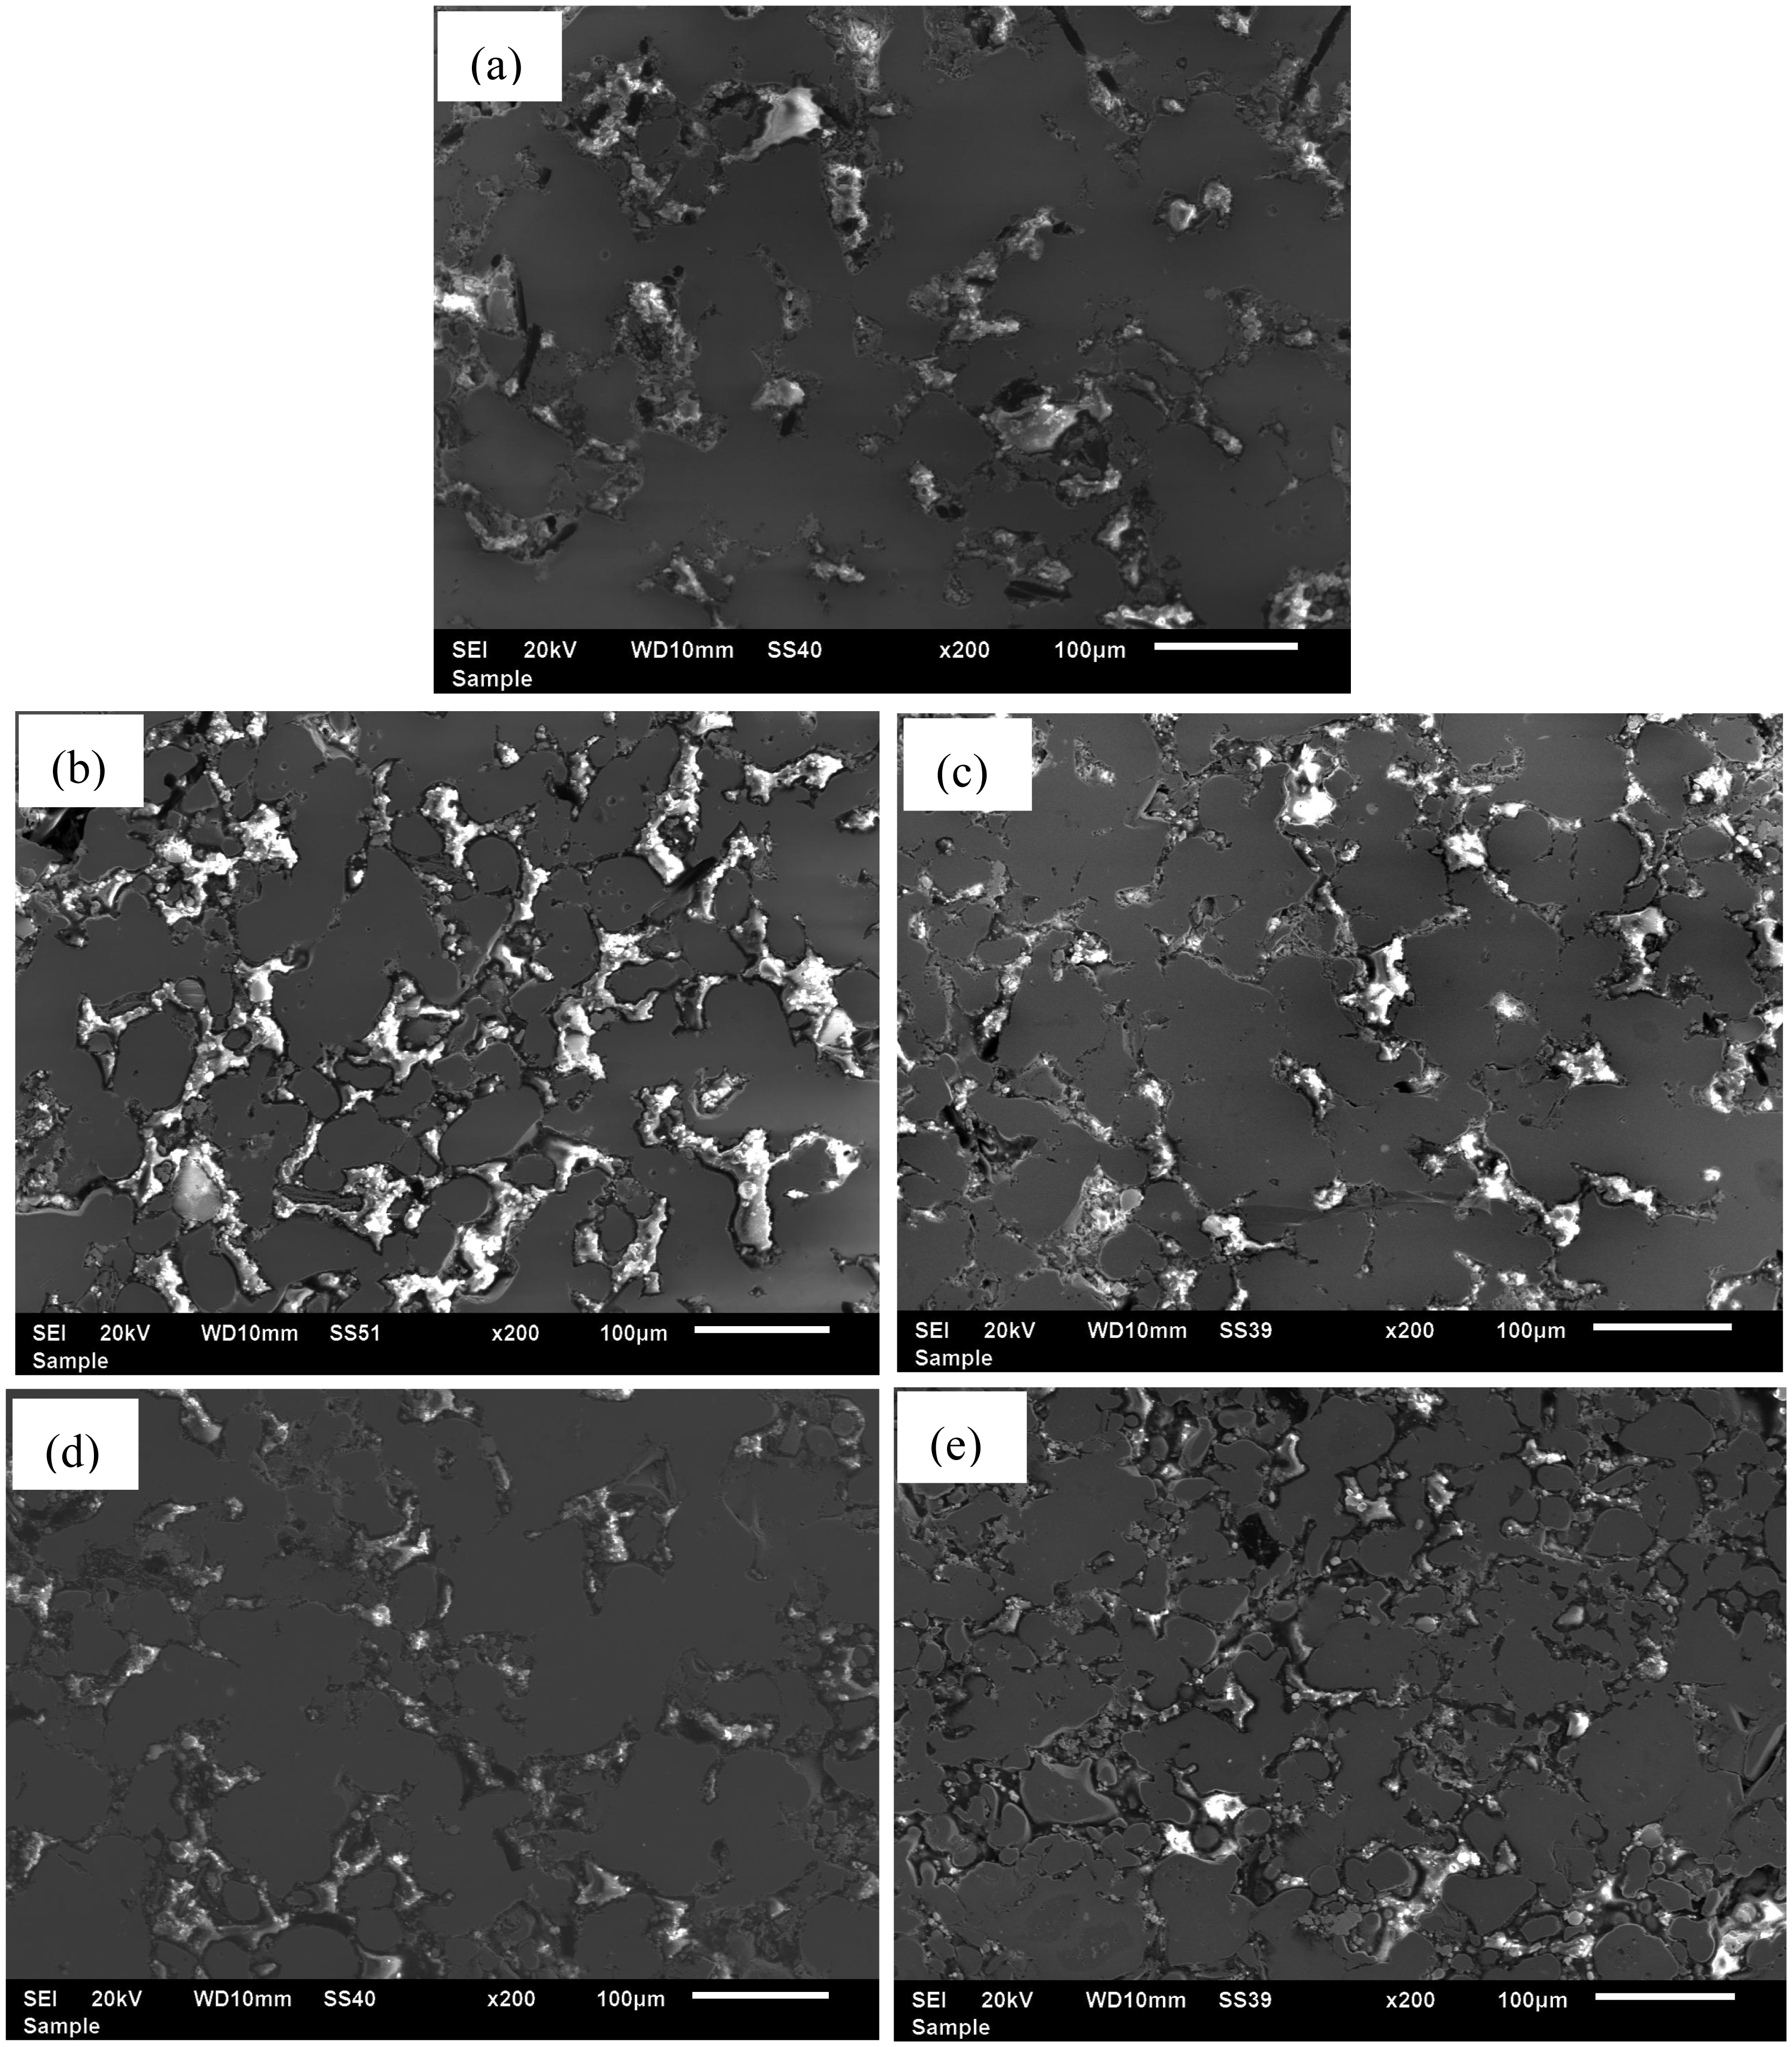
Figure 7 shows SEM image and profile of the PTFE in the pore. The peak of F and C suddenly appears on the line going through the area where the white material is filled in the pore, which indicates that the content of F and C increased dramatically. This proves that the white material is indeed the PTFE hot-dipped into the samples.
The scanning electron microscopy image and EDS spectrum of the PTFE in pore.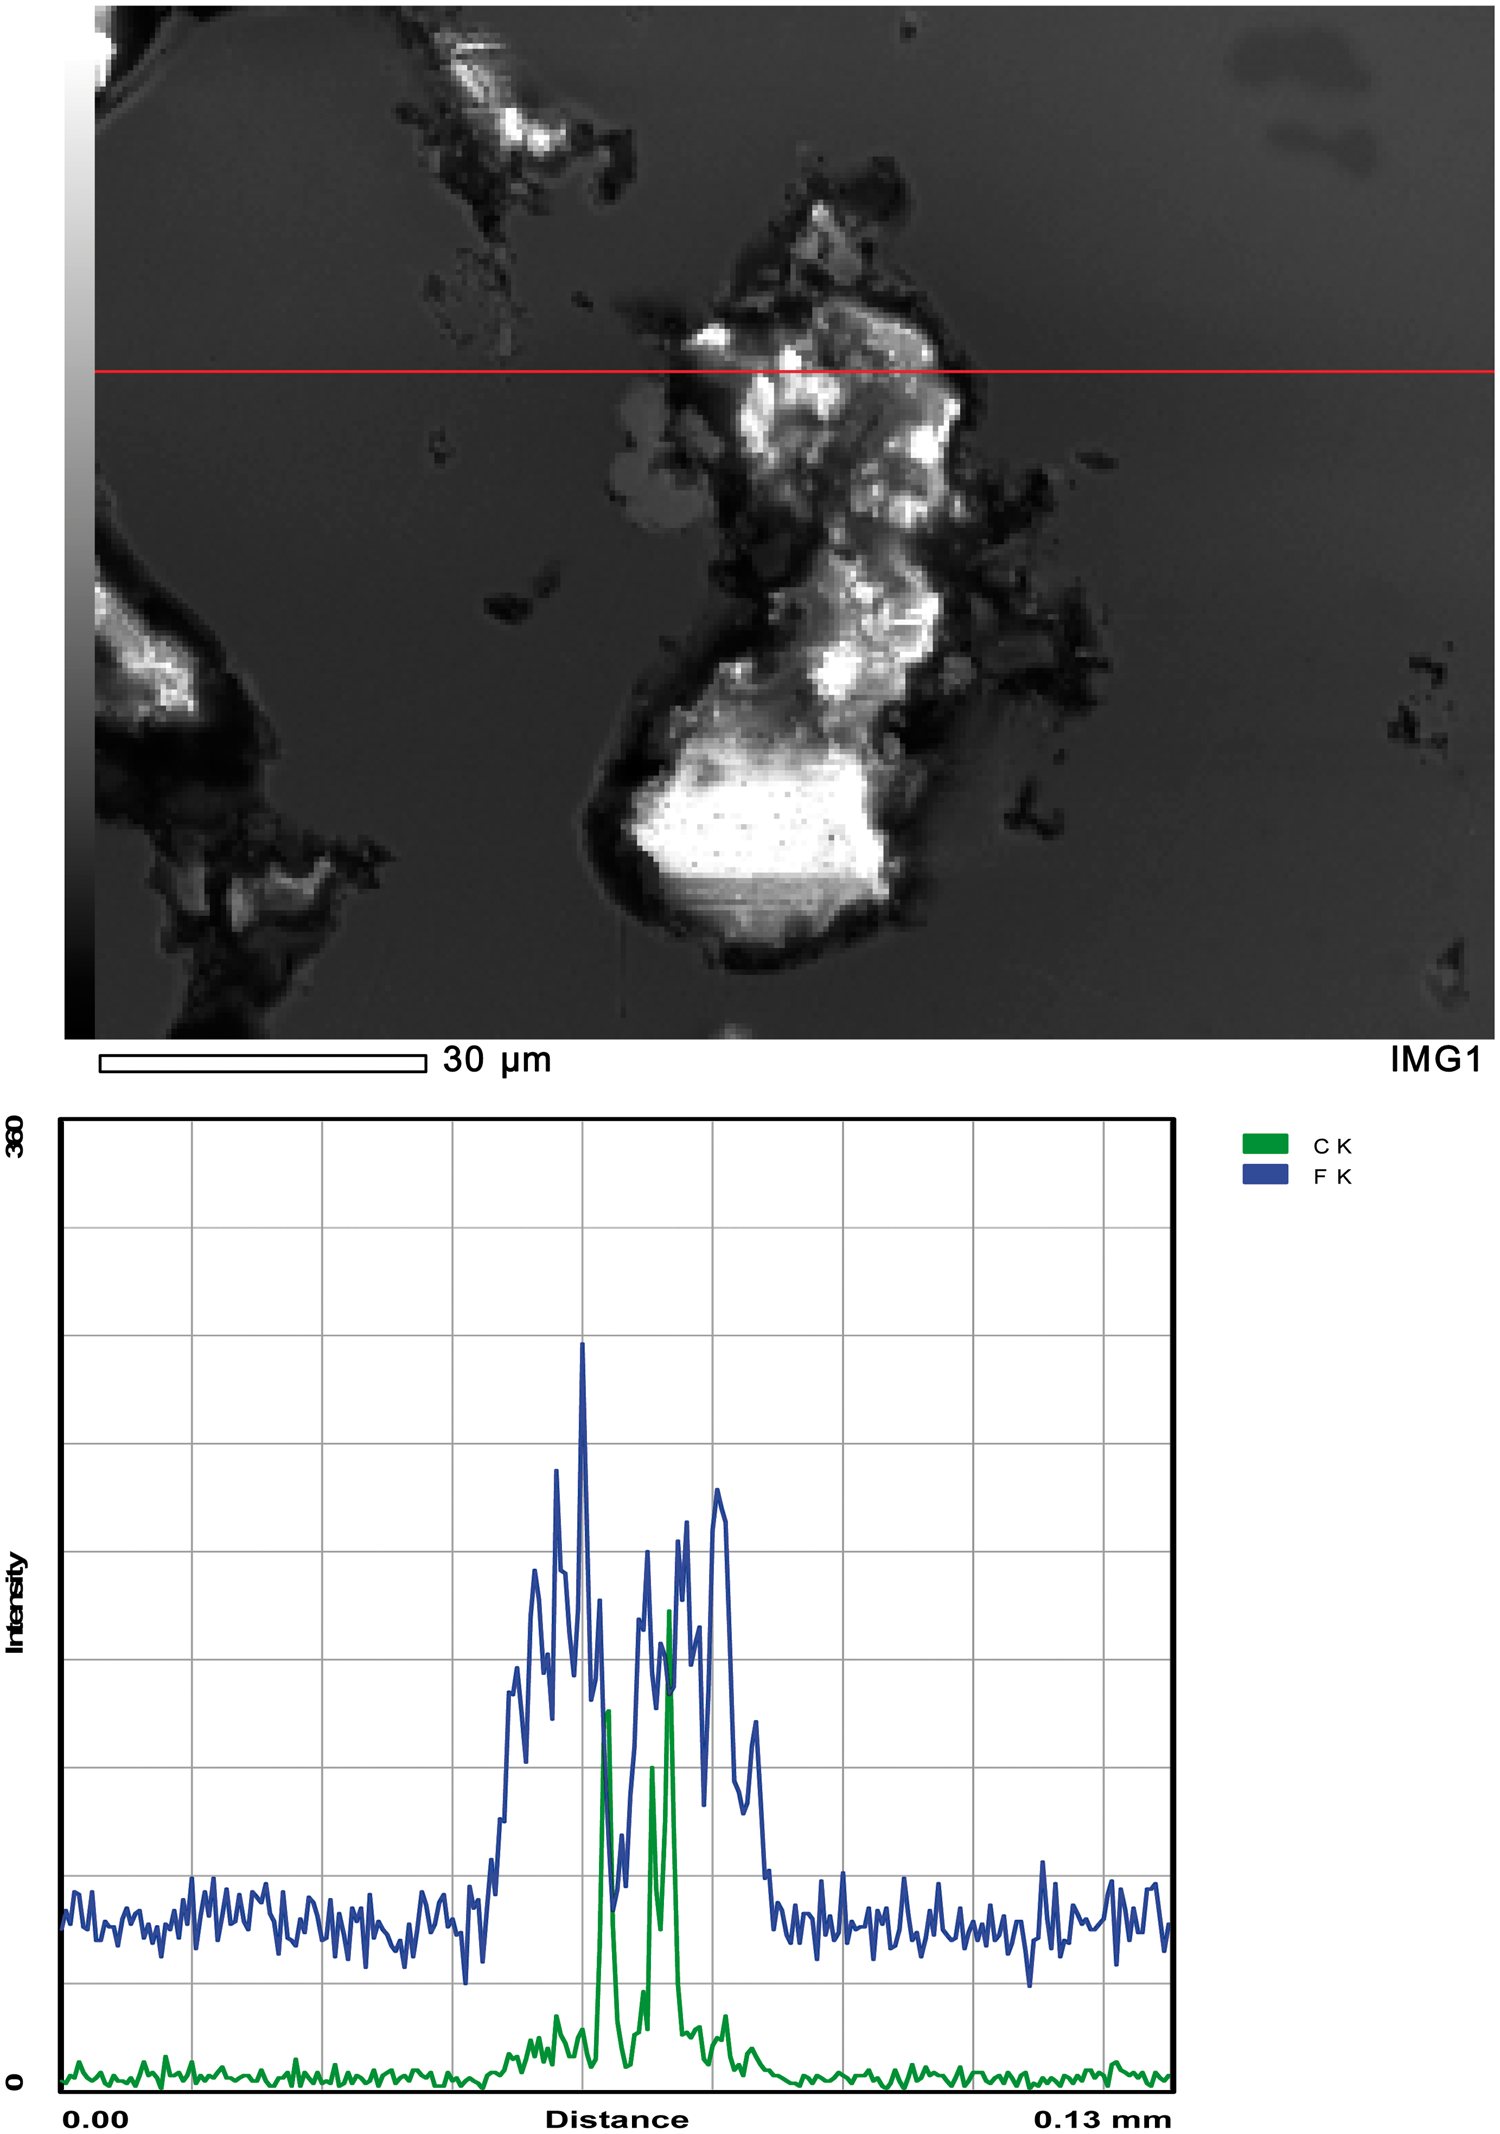
Figure 8 reveals SEM image and EDS spectrum of the samples hot-dipped PTFE at 60℃. It shows that the peak of F and C appears in almost all the pores that were line scanned, and the greater the pore, the higher the peak. This indicates that PTFE was hot-dipped into almost all the pores, and the macroscopic performance of the soft phase PTFE is dispersed on to composite in the copper alloy samples, which is favorable for the improvement of the lubricating performance of the composite materials. But there were also a few pores which were not filled with PTFE, they were close instead of being open to their neighboring pores, so PTFE could not be hot-dipped into them.
The scanning electron microscopy image and EDS spectrum of the sample hot-dipped PTFE at 60℃.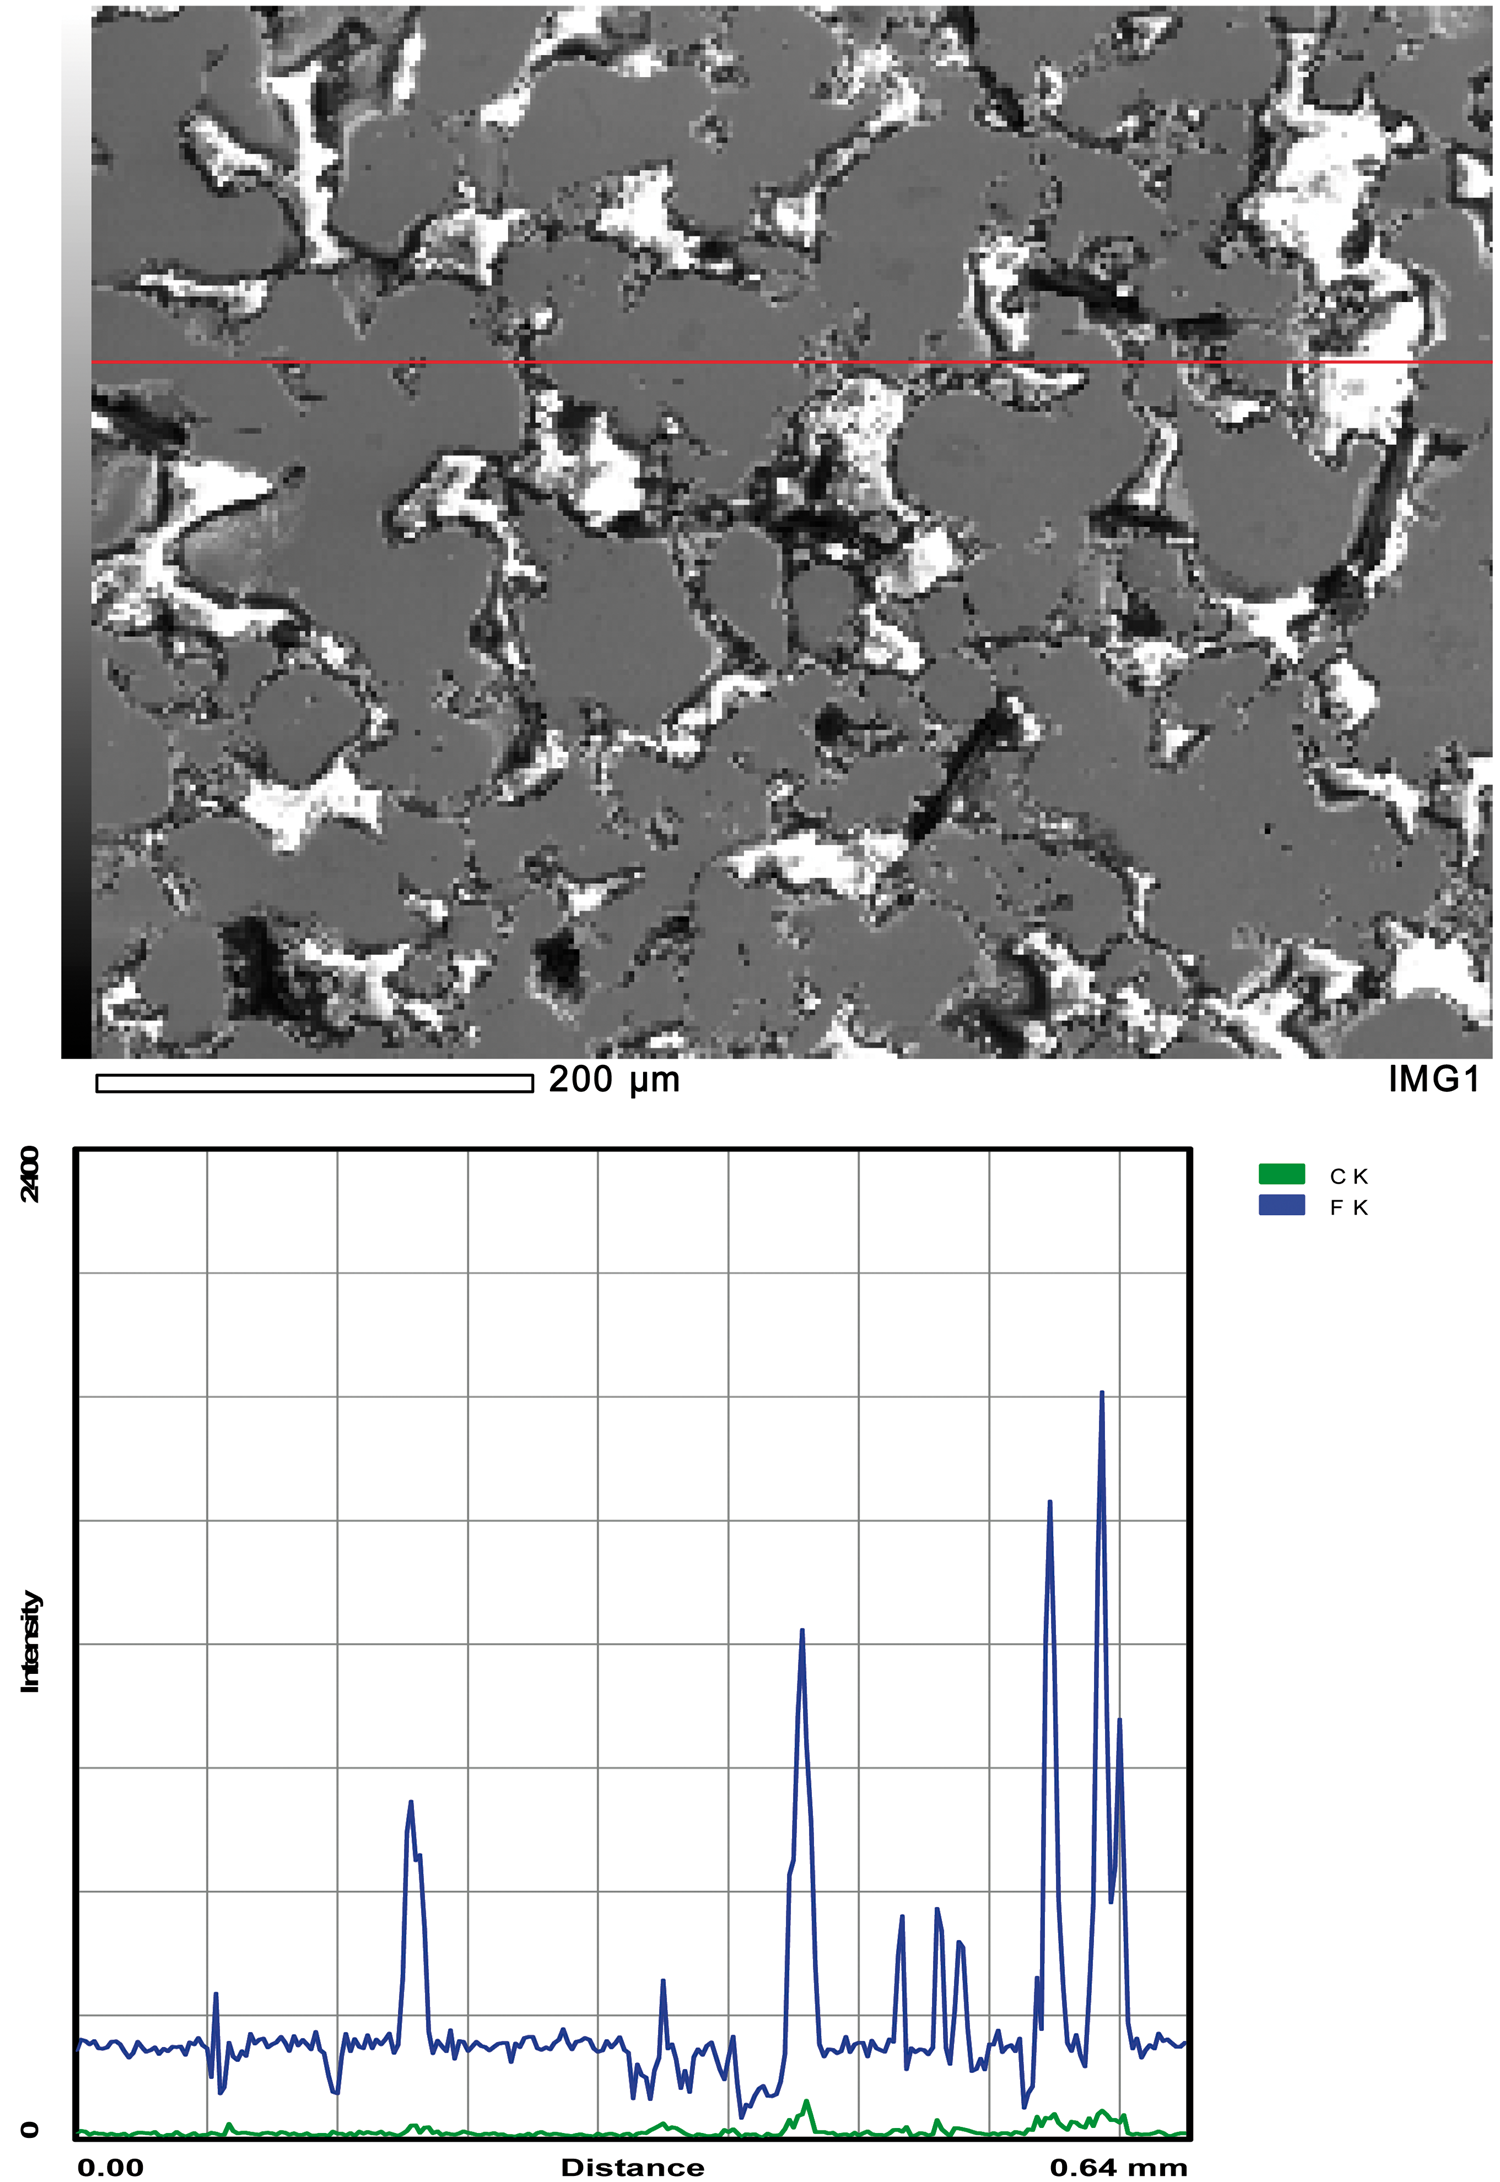
Area-scanning of the five samples with hot-dipped PTFE was carried out to quantitatively analyze the amount of PTFE which was hot-dipped into the samples under different temperatures. Three similar positions 1, 2 and 3 of the five samples were selected to analyze. The SEM image of the samples with hot-dipped PTFE at 60℃ is shown in Figure 9.
The scanning electron microscopy image of the samples with hot-dipped PTFE at 60℃.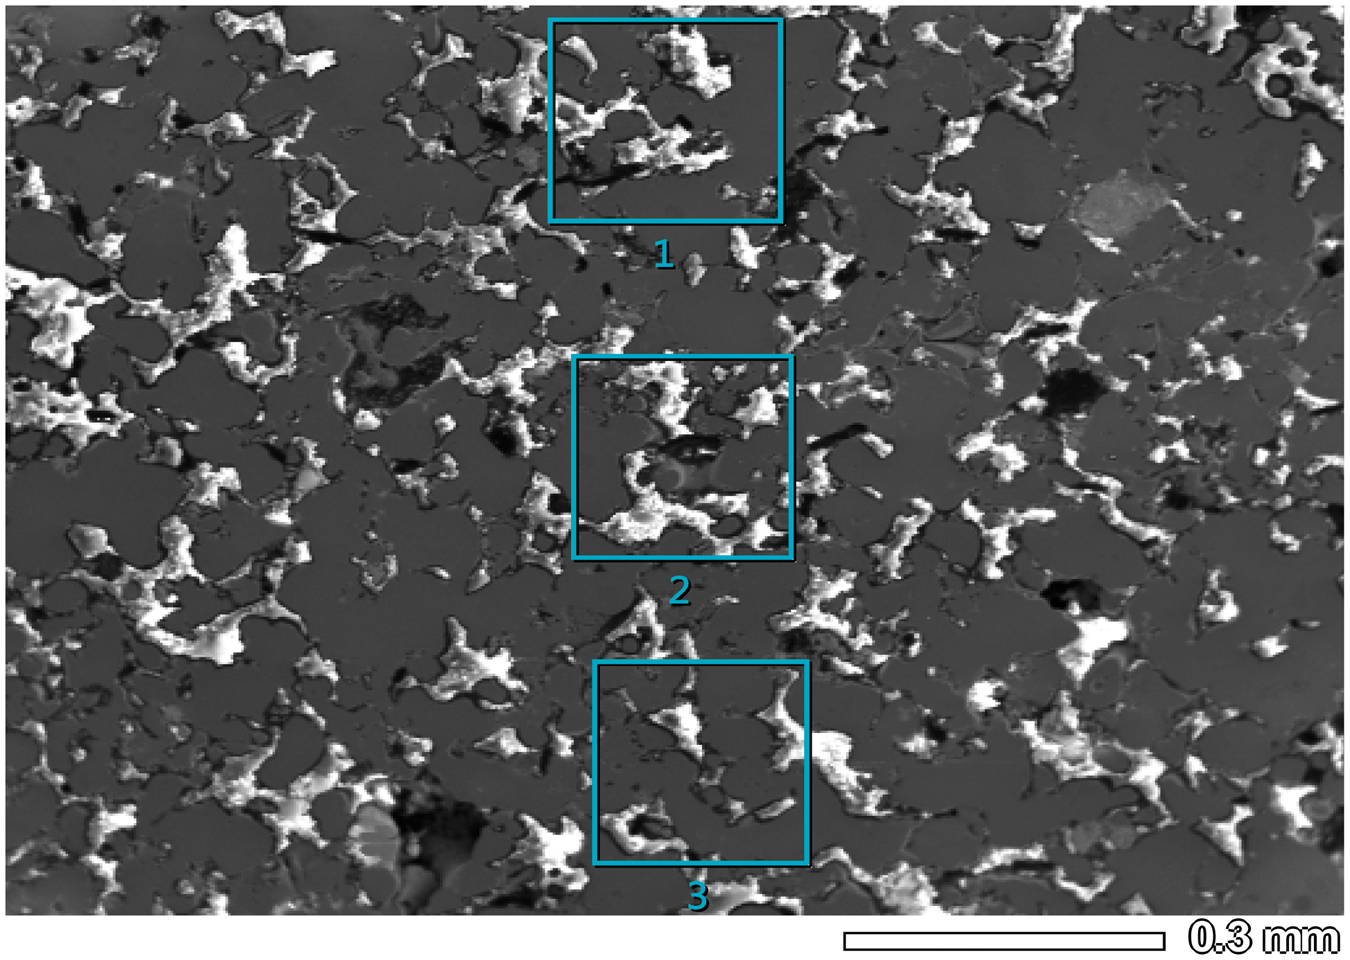
The atomic percentage of F in the samples hot-dipped PTFE (at.%).
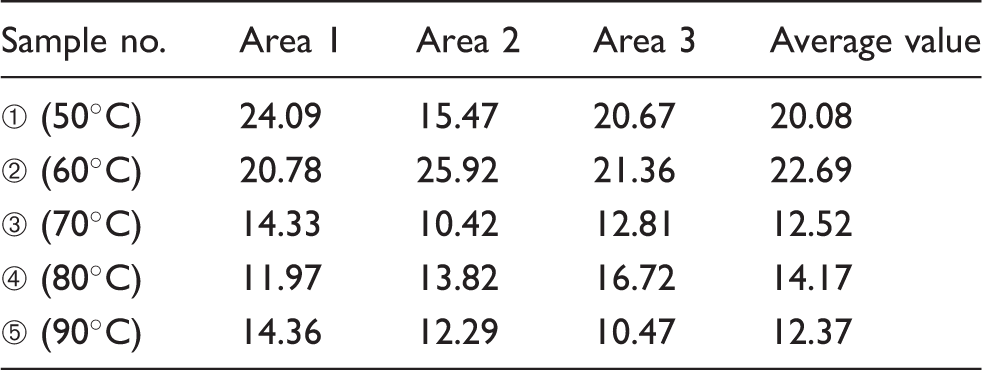
Figure 10 shows the XRD pattern of the sample hot-dipped PTFE at 60℃. As shown in this figure, the matrix of the sample is mainly composed of copper particles, (Cu, Zn) solid solution, (Cu, Sn) solid solution, Cu3.8Ni, W, and small amount of Sm2O3. The diffraction peak of (C2F4)n is detected in the samples revealing that the material is PTFE, which proves that the PTFE material was hot-dipped into the samples. In addition, Pb2O3 is also detected in the samples, which suggests that Pb reacted with O and generated Pb2O3 in the sintering process. Pb2O3 is a kind of high temperature lubricating material, which can improve the lubricating performance of the materials in high temperature environment.
The XRD pattern of the sample hot-dipped PTFE at 60℃.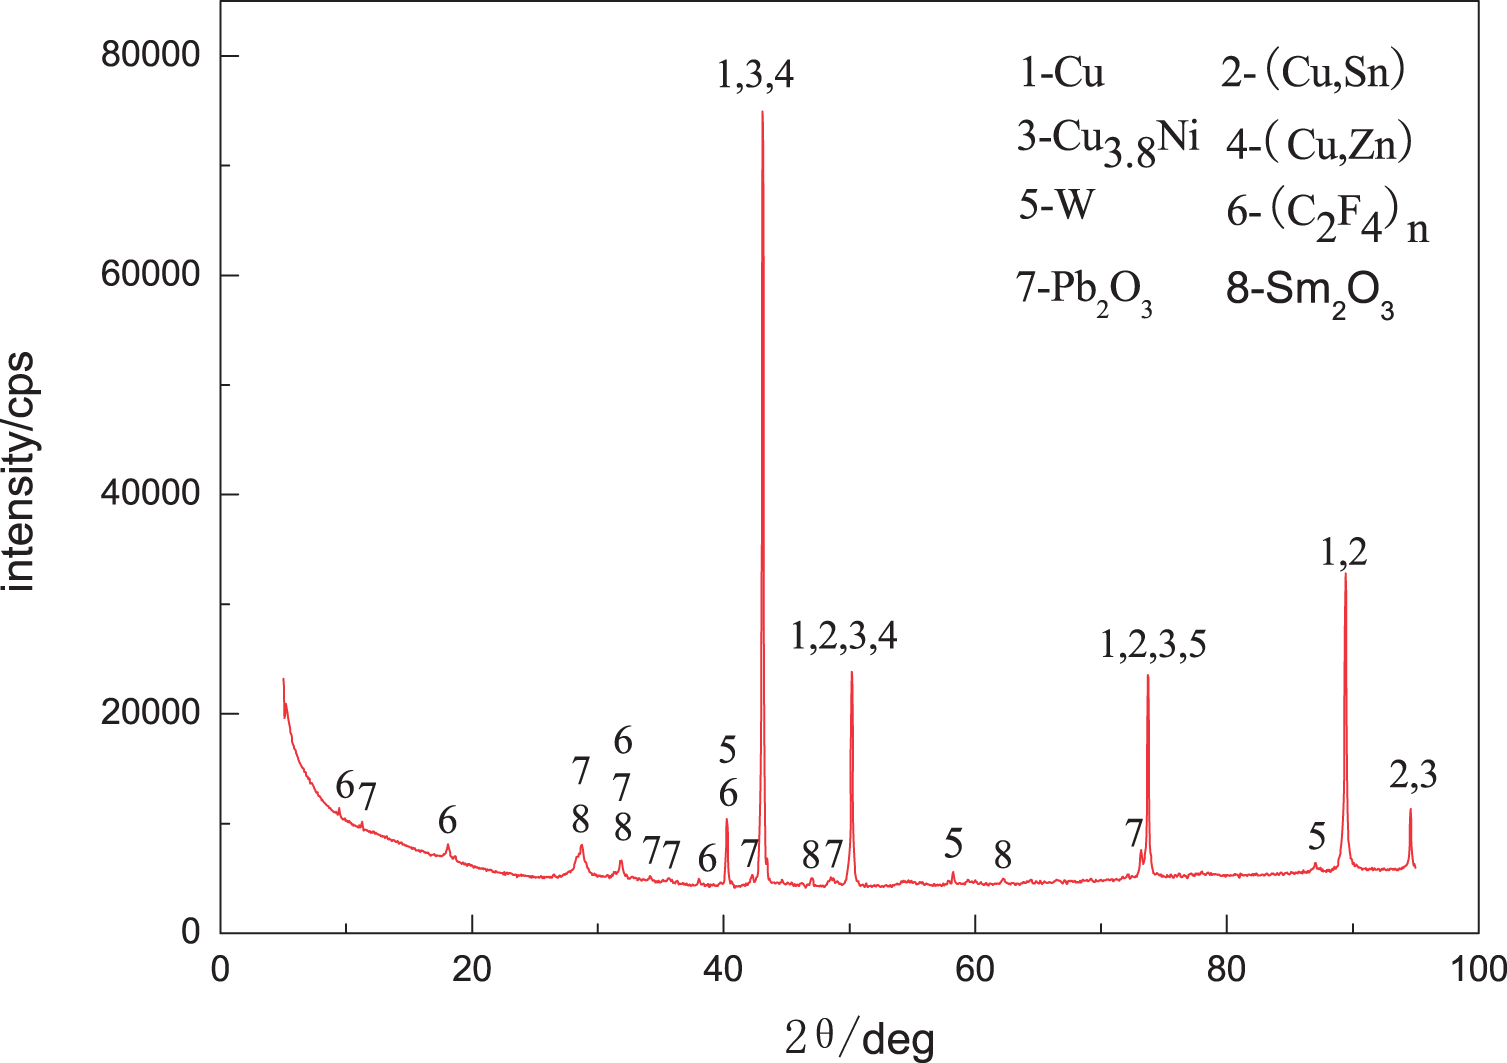
Analysis of the frictional properties and the mechanism of the PTFE/copper-matrix composite materials
The sample which was hot-dipped PTFE at 60℃ was selected to test the frictional properties. Comparing the sample with hot-dipped PTFE and the sample without being hot-dipped PTFE, we can see that the wear loss of the sample without being hot-dipped PTFE is 21 mg, whereas the wear loss of the sample with hot-dipped PTFE is only 6 mg, which indicates that the lubricating properties of PTFE is very good. Figure 11 shows the relationship between the friction coefficient and the wear time of the samples with and without hot-dipped PTFE. It is obvious that the friction coefficient of the sample with PTFE is far less than that of the sample without PTFE, the friction coefficient of the sample with PTFE is 0.08, but the friction coefficient of the sample without PTFE is 0.26. The reason why the self-lubricating property of the sample with PTFE is better is that the PTFE had been hot-dipped into almost all the pores formed with pore-forming materials. And this sample is the one hot-dipped PTFE at 60℃, the content of PTFE of which is the maximum. In the process of friction, the PTFE hot-dipped into pores is gradually squeezed out and a continuous and complete PTFE and graphite solid self-lubricating film is formed. The frictional property of the material is, therefore, obviously improved.
Relation between the friction coefficient and wear time of the samples with and without PTFE.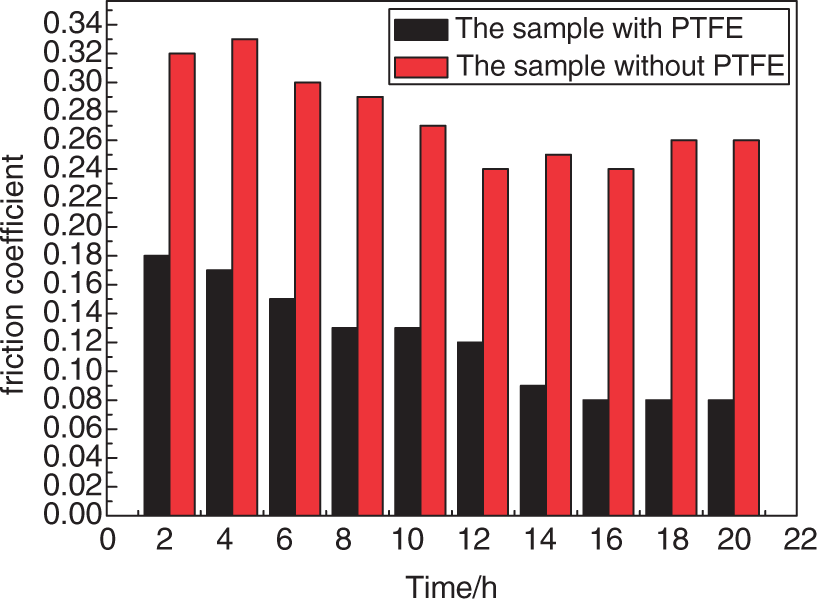
Figure 11 shows that the change of friction coefficient along with the change of the time can be divided into three stages. When the friction pairs begin to run, the friction coefficient is high and unstable, which indicates that a stable lubricating and friction-reducing film is not yet formed on the surface of the friction pairs. After running for a period of time, the friction coefficient of the friction pairs gradually decreases and becomes stable. This indicates that a stable, lubricating and friction-reducing film is developed on the surface of the friction pairs. During the friction process, the solid lubricating phase is squeezed out of the copper alloy matrix because of the deformation of composite materials. The solid lubricating film that plays the role of self-lubrication is gradually formed on the surface of the grinding crack/pores. In the friction process of the relative motion, due to friction extrusion and heat effect, the solid lubricants in the material form a layer of stable lubricating film on the relatively sliding surface, this PTFE self-lubricating film formation phenomena is also found and proved by Escobar et al. 11 However, the lubricating film will rupture and shed constantly, at this time, the PTFE and other lubricating materials such as graphite will be extruded onto the surface continuously from the subsurface of the sample to supply or replenish solid lubricants to repair the tear or scratch of the lubricating film so as to achieve lubricating and friction-reducing effect and make the solid lubricating film in dynamic equilibrium.
Figure 12 shows the worn micrographs of the samples with PTFE and without PTFE at 60℃. Figure 12(a) depicts the worn micrograph of the samples with PTFE, and Figure 12(b) shows the worn micrograph of the samples without PTFE. As shown in Figure 12(b), there are many wear debris and pits in the sample without PTFE, and also the lubricating film has been ruptured. As shown in Figure 12(a), the worn surface is covered with plenty of white material which is the PTFE lubricating film formed in the process of friction. The lubricating film can prevent the two friction surfaces from having direct contact with each other. Therefore, friction and wear mainly occur in the surface layer of the lubricating film, where the effect of antifriction and wear resistance is remarkable, i.e. the friction coefficient reduces, and the wear is stable. The furrows on the worn surface are not obvious and little wear debris can be seen. This indicates that abrasive wear of the sample hot-dipped PTFE occurs only to a very small degree in the process of friction. But the microcracks vertical to the gliding direction in Figure 12(a) indicate that the wear of the sample with hot-dipped PTFE is mainly fatigue wear as far as its mechanism is concerned.
The worn micrographs of the samples: (a) with hot-dipped PTFE; (b) without hot-dipped PTFE.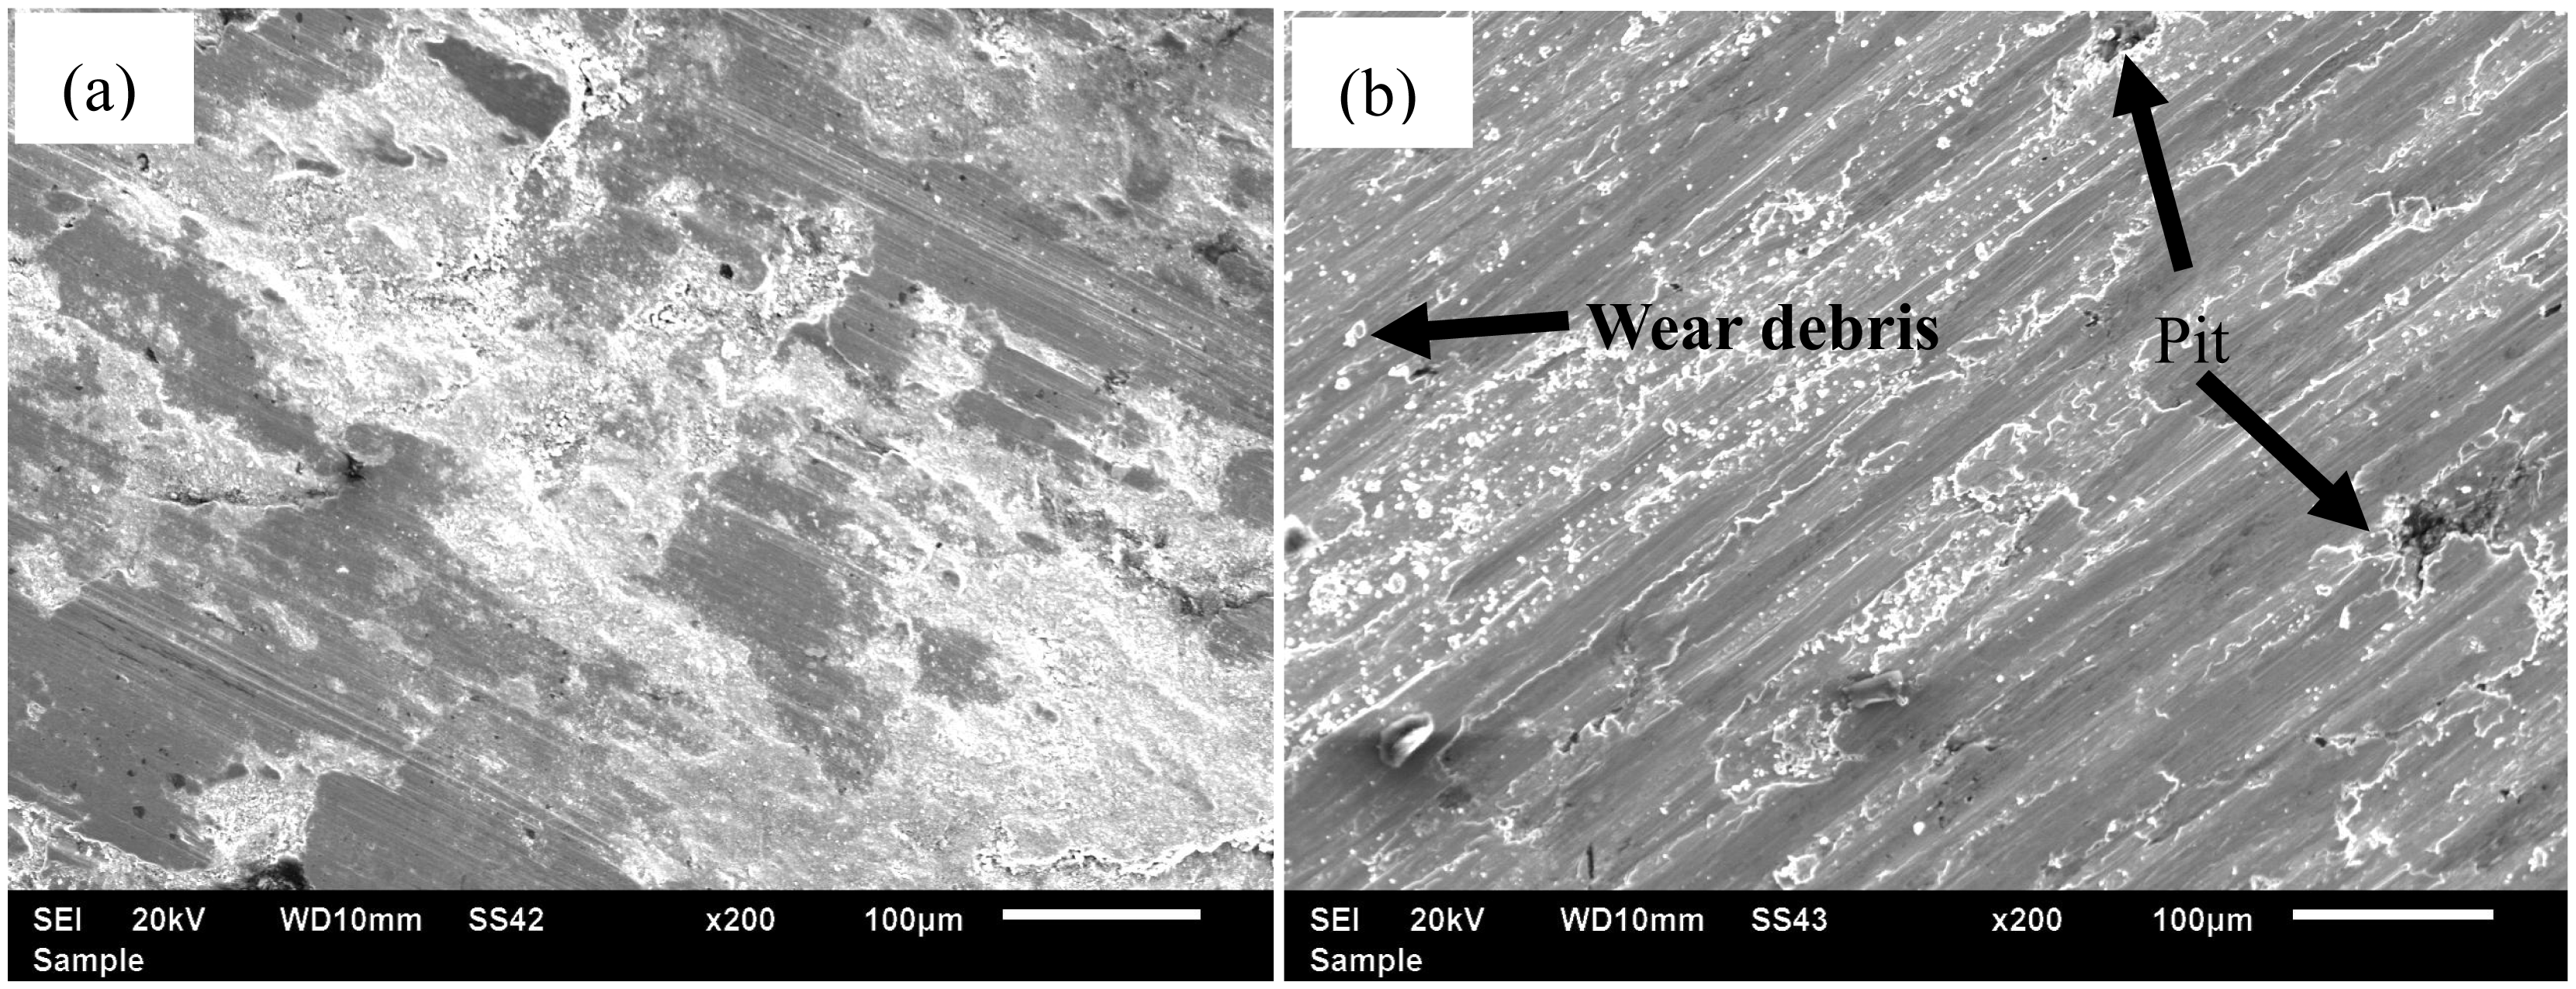
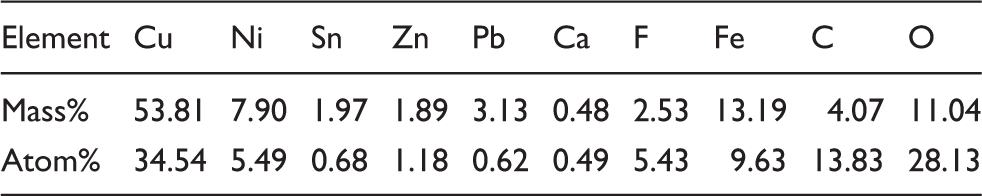
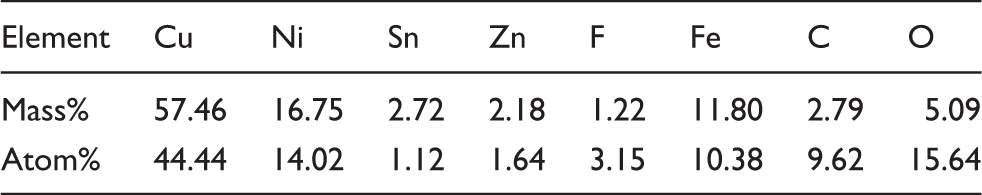
Figure 13 shows the worn micrograph of the sample with hot-dipped PTFE and the EDS energy spectrum analysis of different morphology areas. The EDS energy spectrum analysis of the white area 1 is shown in Table 4. Of all the materials in the sample, not considering the matrix ingredient, the content of Fe is high, and so is the content of O. This indicates that adhesive wear and oxidative wear mainly occur in this area. The reason why adhesive wear occurs in this area is that, in the process of frictional contact, when the thrust on the surface of the copper ruptures, part of it becomes abrasive debris, the other part of it adheres to the friction steel plate. Hence transfer of materials occurs in this way.
The worn micrograph of the sample hot-dipped PTFE. The energy-dispersive X-ray spectroscopic spectrum analysis of area 1 in Figure 13.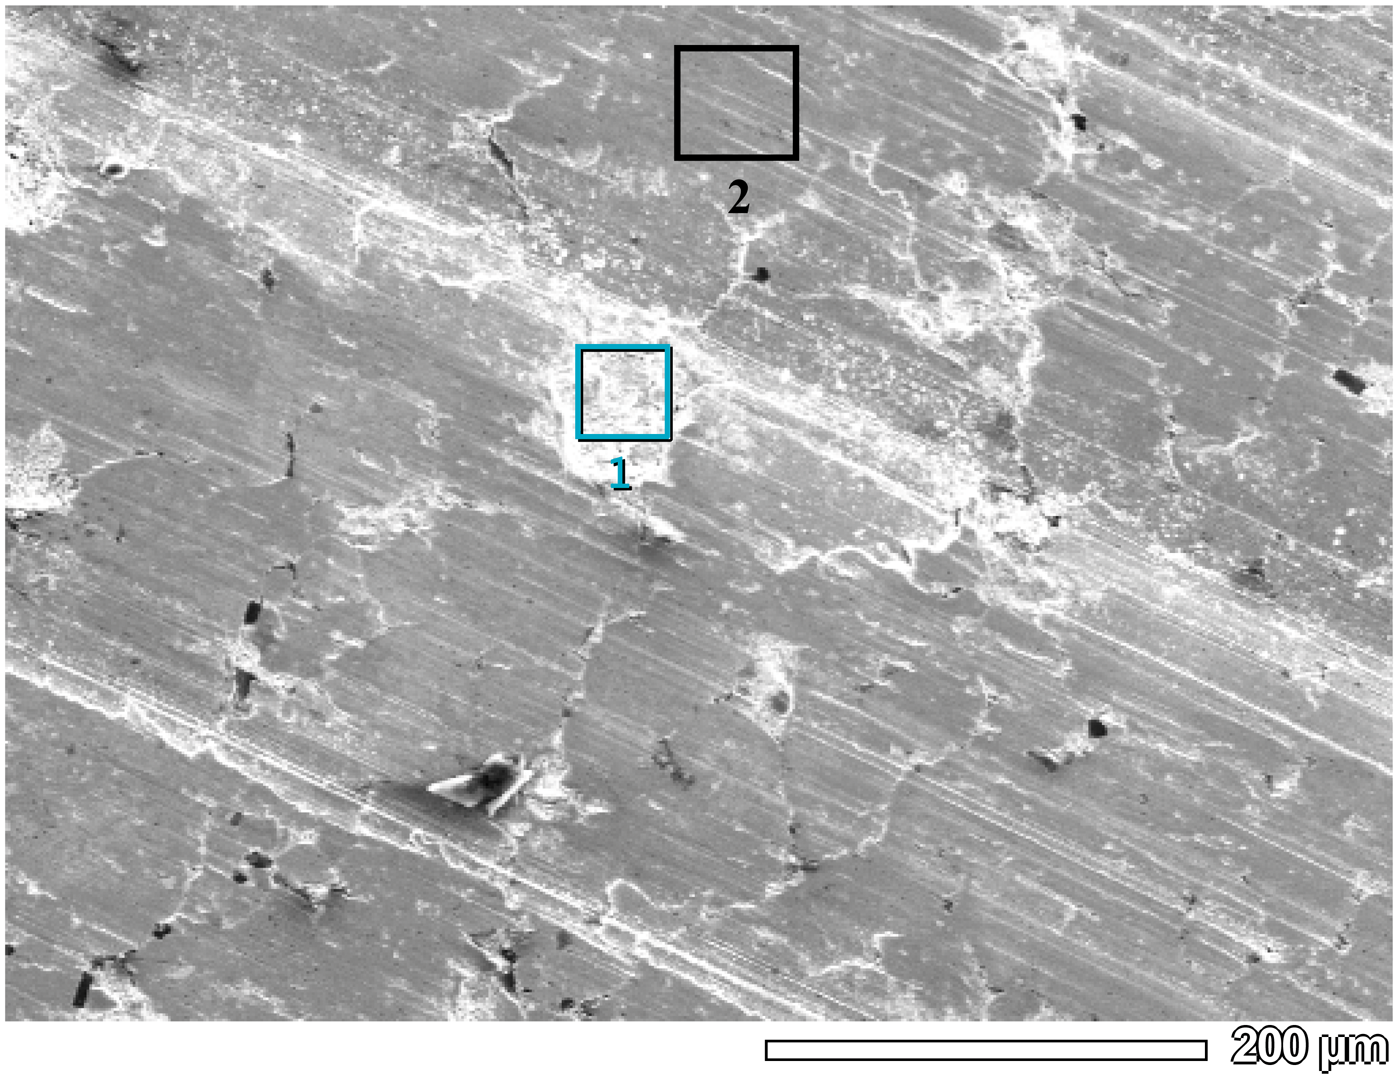
The energy-dispersive X-ray spectroscopic spectrum analysis of area 2 in Figure 13.
Conclusions
The mechanical property of the samples first increases and then declines with the increase in the volume fraction of pore-forming material (NH4HCO3) from 5% to 13%. When the volume fraction of NH4HCO3 is 9%, the mechanical property reaches the maximum. The density of the sample is 5.52 g/cm3, its hardness is 35.5 HV and crushing strength is 148 MPa. The comprehensive performance of this sample is good. The sample containing 9% (volume fraction) of NH4HCO3 was hot-dipped with PTFE in the water bath at 50℃, 60℃, 70℃, 80℃ and 90℃, respectively. The content of PTFE in the samples first increased and then declined with the rise of temperature. When the temperature was 60℃, the atomic percentage of F was the maximum, reaching up to 22.69%. Therefore, 60℃ is the best hot-dipping temperature. The sample hot-dipped PTFE at 60℃ was selected to test the frictional performance. The frictional performance is obviously improved by the PTFE. The sample with hot-dipped PTFE was compared with the sample without hot-dipped PTFE. PTFE effectively reduces the wear loss and friction coefficient of the materials. The wear loss is 6 mg and the friction coefficient is 0.08, which proves that this novel PTFE/copper-matrix self-lubricating composite materials has good oil-free lubricating property.
Footnotes
Conflict of interest
None declared.
Funding
This work was financially supported by the Educational Commission of Liaoning Province of China [LT2010031]; Science and Technology of Shenyang [F11-042-2-00]; and the Fundamental Research Funds for the Central Universities [N100702001].