
Abstract
Reliable delamination characterization data for laminated composites are needed for input in analytical models of structures to predict delamination onset and growth. The double-cantilevered beam specimen is used to measure fracture toughness, GIc, and strain energy release rate, GImax, for delamination onset and growth in laminated composites under Mode I loading. The current study was conducted as part of an ASTM Round Robin activity to evaluate a proposed testing standard for Mode I fatigue delamination propagation. Static and fatigue tests were conducted on specimens of IM7/977-3 and G40-800/5276-1 graphite/epoxies, and S2/5216 glass/epoxy double-cantilevered beam specimens to evaluate the draft standard “Standard Test Method for Mode I Fatigue Delamination Propagation of Unidirectional Fiber-Reinforced Polymer Matrix Composites.” Static results were used to generate a delamination resistance curve, GIR, for each material, which was used to determine the effects of fiber-bridging on the delamination growth data. All three materials were tested in fatigue at a cyclic GImax level equal to 90% of the fracture toughness, GIc, to determine the delamination growth rate. Two different data reduction methods, a two-point and a seven-point fit, were used and the resulting Paris Law equations were compared. Growth rate results were normalized by the delamination resistance curve for each material and compared to the non-normalized results. Paris Law exponents were found to decrease by 5.7 to 47.6% due to normalizing the growth data. Additional specimens of the IM7/977-3 material were tested at three lower cyclic GImax levels to compare the effect of loading level on delamination growth rates. The IM7/977-3 tests were also used to determine the delamination threshold curve for that material. The results show that tests at a range of loading levels are necessary to describe the complete delamination behavior of this material.
Introduction
The most common failure mechanism in laminated composite materials is delamination damage. In order to optimize the use of fiber-reinforced composite materials in primary aircraft structures, damage tolerance under static and fatigue loading must be thoroughly understood. Reliable delamination characterization data for laminated composites are needed to use as input in analytical models of structures to predict delamination onset and growth. The double-cantilevered beam (DCB) specimen, as shown in Figures 1 and 2, is used to measure fracture toughness, GIc, and strain energy release rate, GImax, for delamination onset and growth in laminated composites under Mode I loading. Reference 1 (ASTM D 5528-01, Standard Test Method for Mode I Interlaminar Fracture Toughness of Unidirectional Fiber-Reinforced Polymer Matrix Composites) presents a standardized test method for measuring static fracture toughness, GIc. Reference 2 (ASTM D 6115-97, Standard Test Method for Mode I Fatigue Delamination Growth Onset of Unidirectional Fiber-Reinforced Polymer Matrix Composites) is a standardized test method for determining the onset of delamination and a threshold level, GIth, below which delamination will not start in fatigue. However, there is currently no standard for determining the delamination growth rate in fatigue, once delamination begins. Therefore, a Round Robin test series has been undertaken by ASTM Committee D30 to evaluate a proposed test standard for delamination growth in Mode I specimens under constant amplitude fatigue loading.
3
The work described in this paper was done as part of that Round Robin test series.
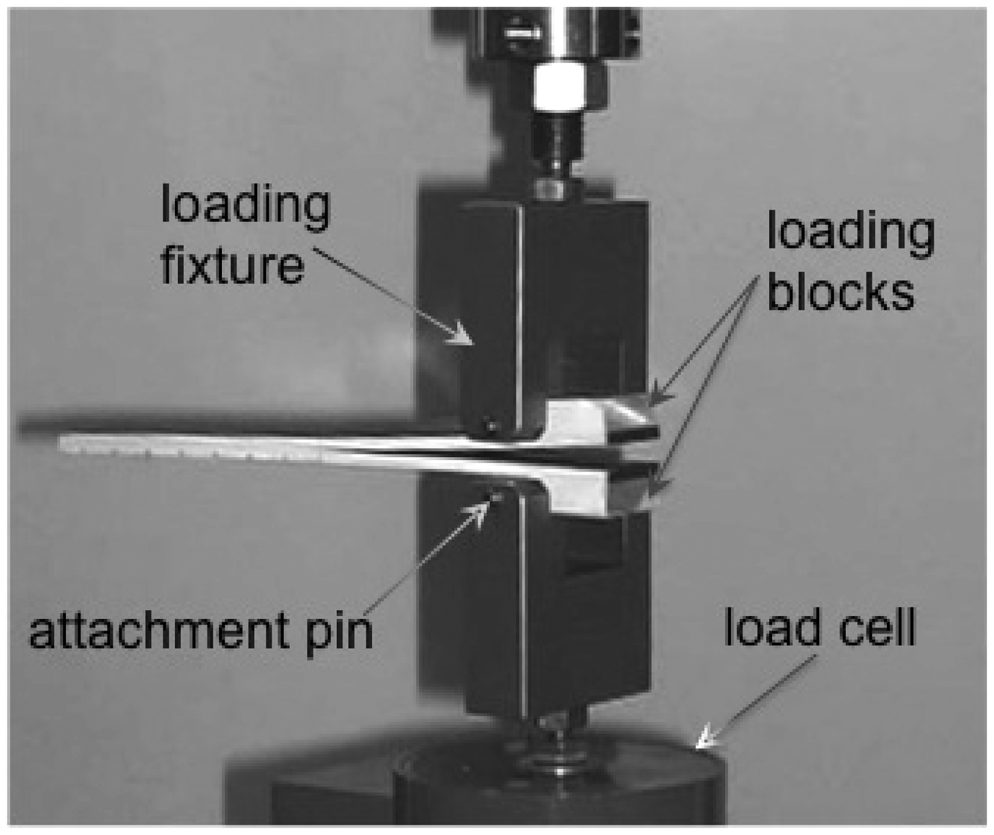
Double-cantilevered beam specimen. Figures are not to scale. Double-cantilevered beam specimen mounted in loading fixture.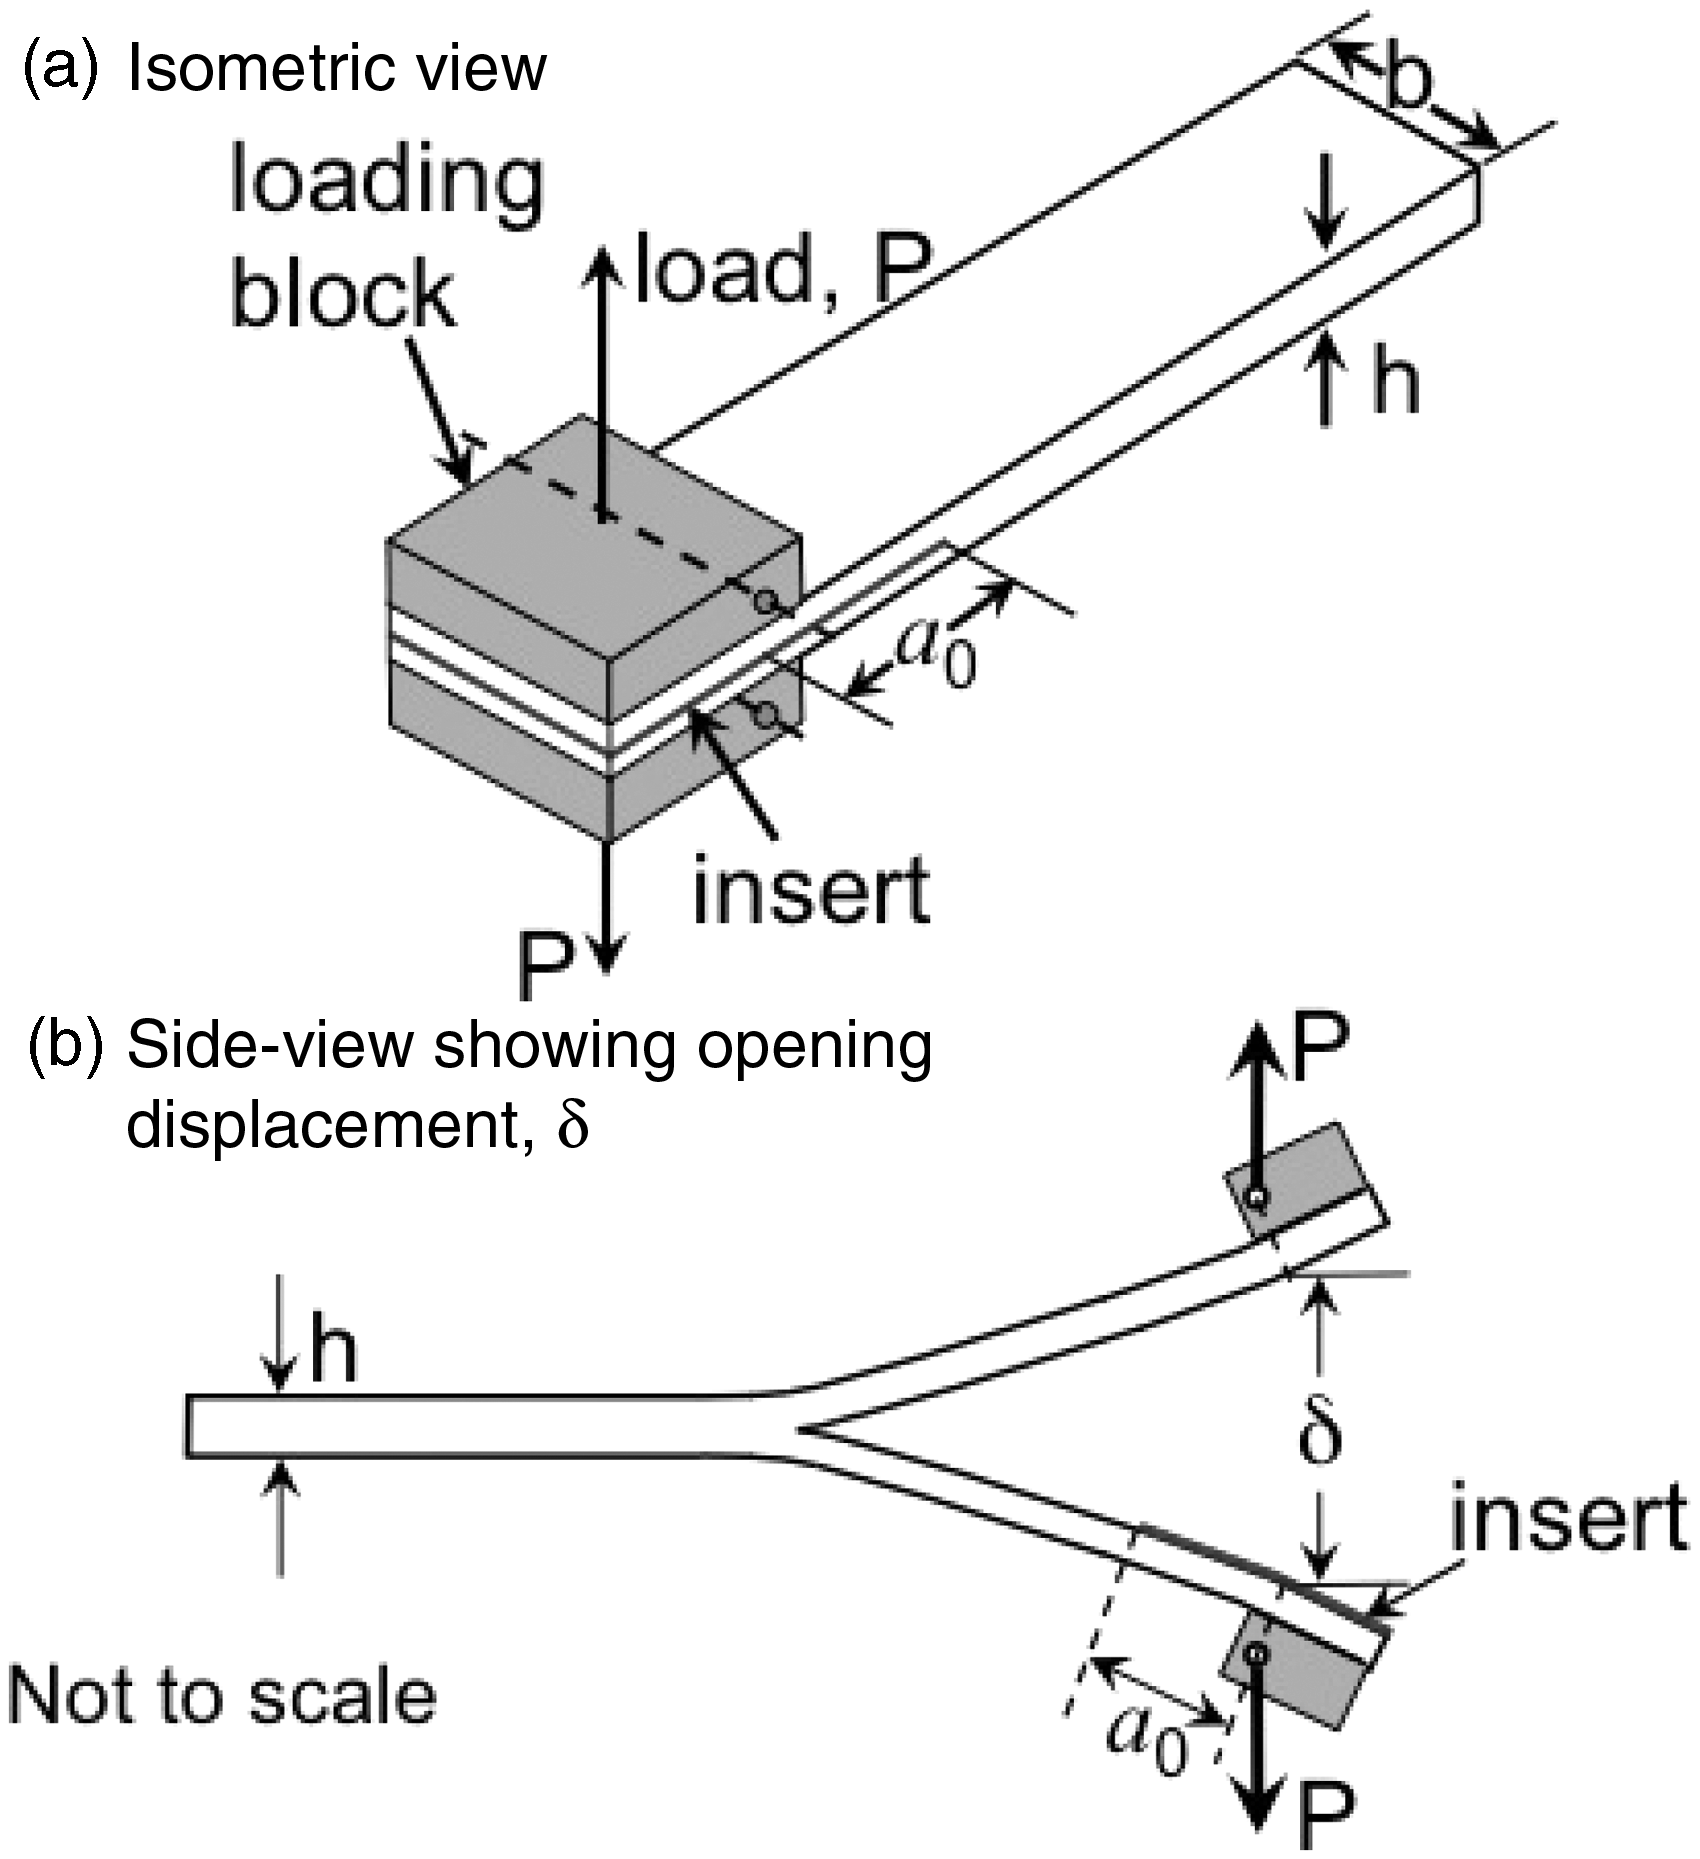
For composite materials, delamination growth has typically been related to the cyclic strain energy release rate, G, using a power law expression,4–6 known as the Paris Law. Because the DCB specimen is unidirectional, some nesting of fibers between adjacent plies can occur, resulting in fiber-bridging at the delaminating interface. This fiber-bridging can cause an artificial increase in the measured toughness as the delamination grows,7–9 which will affect the Paris Law curve fit. However, this fiber-bridging is understood to be an artifact of the specimen, and not a material property. In real structures, delaminations typically grow between plies of dissimilar orientation, so fiber-bridging does not occur. Therefore, in order to be useful in structural modeling, expressions relating the delamination growth rate and strain energy release rate must account for the effect of fiber-bridging. Fiber-bridging under quasi-static loading can be quantified as a delamination resistance (GIR) curve, which can be used to correct the growth data for the fiber-bridging effects.1,3,7–10
Delamination growth in a constant-amplitude displacement-controlled DCB test yields decreasing GImax values. Therefore, delamination growth as a function of G from onset to arrest can be considered to have three phases, as shown in Figure 3: a region of rapid growth at high (but sub-critical) values of G, a linear growth region (characterized by the Paris Law), and a slow growth region where the delamination approaches an arrest point, or threshold, below which delamination will not grow. A full-fatigue characterization equation has been proposed,4,5,9,10 as shown in the figure, to express the complete delamination growth behavior in terms of the maximum cyclic G-value (GImax), the threshold value (GIth), the static fracture toughness (GIc), and the Paris Law constants (A and B). In Refs. 4 and 5, delamination growth onset data from edge-delamination (EDT) and end-notched flexure (ENF) tests were used to generate threshold curves, below which delamination would not initiate. A minimum threshold for no-delamination-growth was assumed to exist at a loading level for which there was no delamination growth at 1 million cycles.
Representative plot of full-fatigue characterization curve.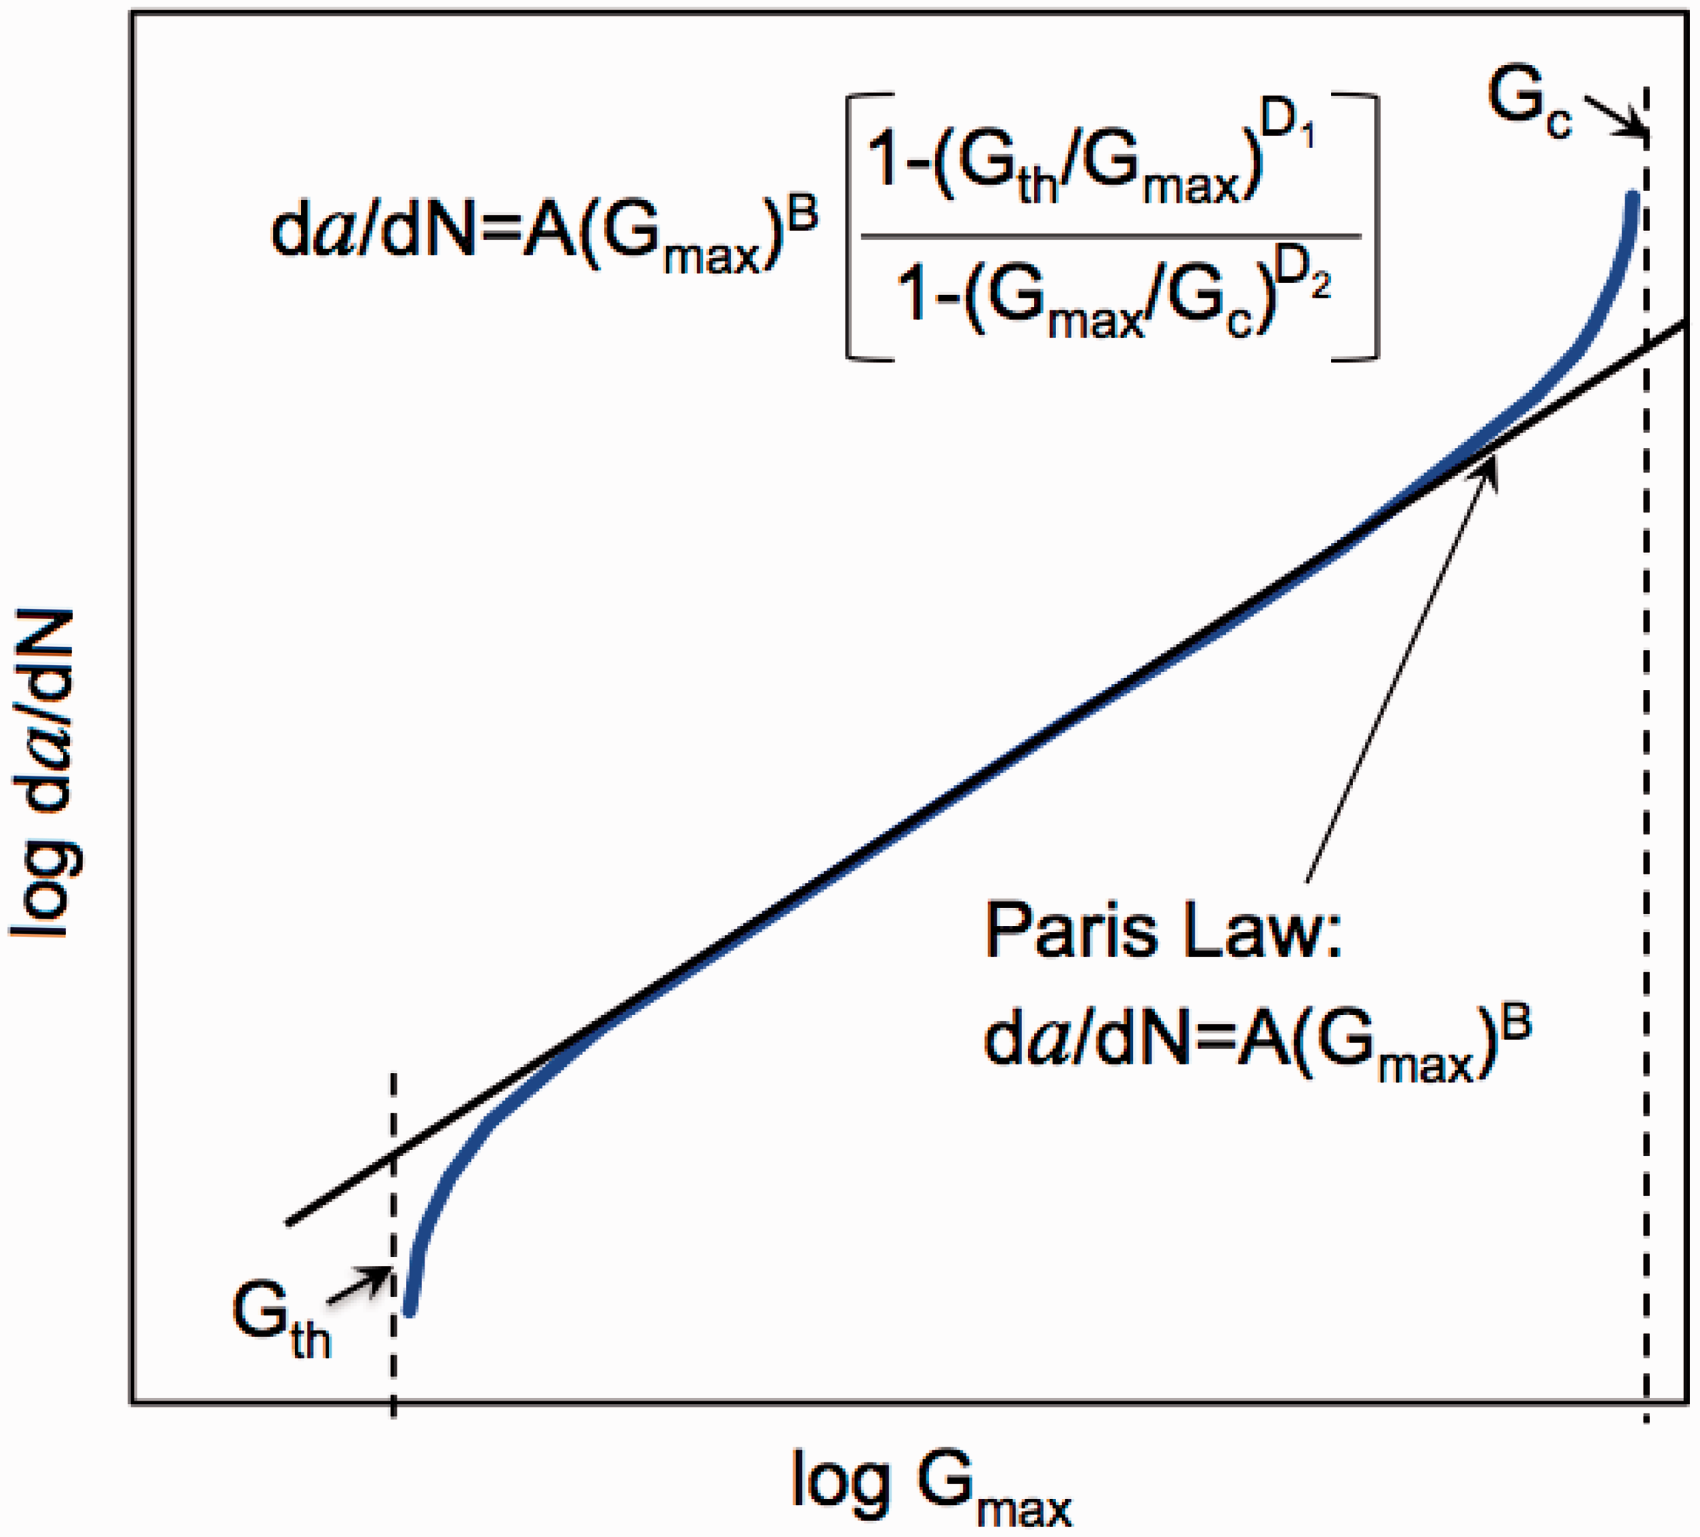
The objectives of the ASTM Round Robin were to determine the effect of data reduction method and fiber-bridging correction on the delamination growth rate in DCB specimens. Specimens of three different materials were tested. Quasi-static tests were first performed to determine the fracture toughness, delamination resistance curve, and test parameters for fatigue loading. Fatigue tests were then conducted at an initial GImax level of 90% of GIc, to determine delamination growth rates, which were expressed in the form of a Paris Law. Both a two-point secant and a seven-point polynomial-fit method were used to reduce the delamination growth data and the resulting Paris Law fits were compared. The delamination resistance curve equations were used to normalize the growth data to account for the effects of fiber-bridging. A Paris Law fit was applied to both the non-normalized and normalized data sets.
An additional objective of this report was to generate a delamination onset curve and a GIth value, to be used in a full fatigue characterization of one test material, and to compare Paris Law results from tests at different initial GImax levels. Additional specimens of that material were therefore tested at 50, 40, and 30% of GIc. The onset of delamination was recorded for these tests and was used to generate a delamination threshold curve for that material. An attempt was made to fit a full fatigue characterization curve to the data, using the complete data set from all GImax test levels, and the GIc and GIth values.
Materials and specimens
Three materials were tested: IM7/977-3 and G40-800/5276-1 (carbon/epoxies), and S2/5216 (glass/epoxy.) The IM7/977-3 and G40-800/5276-1 specimens were 26 plies thick and the S2/5216 specimens were 18 plies thick. Cytec Corporation manufactured the panels and cut them into specimens, which were nominally 20 mm wide and 153 mm long. The specimens were received with loading blocks bonded at the insert end of the specimen as a means to apply the opening displacement. A schematic of the DCB specimen is shown in Figure 1, with the thickness (h), width (b), and initial delamination (a0) indicated. Prior to testing, specimen dimensions were measured using a micrometer, to the nearest 0.01 mm. The average specimen thickness, h, was 3.4 mm for the IM7/977-3 and G40-800/5276-1 specimens, and 4.1 mm for the S2/5216 material. The average specimen width, b, was 20.4 mm for specimens of all three materials. All specimens were manufactured with a thin polytetrafluoroethylene (PTFE) film at the mid-plane at one end. The PTFE insert was 13 µm thick and nominally 63.5 mm long. The initial delamination length, a0, is the distance from the load-point line to the end of the insert (see Figure 1), and was approximately 53 mm. The opening displacement, δ, is measured at the application point, as shown in Figure 1(b). Specimens were dried before testing by using the procedure in ASTM D5229. 11 The dried specimens were stored in a dessicator until testing. Immediately before testing, one edge of the specimen was coated with a thin layer of white paint and marked in 1 mm increments, starting from the tip of the insert and extending to a length of 60 mm.
Experimental procedures
All tests were conducted under displacement control in a small table-top servo-hydraulic test stand using a 100-lb (45.4 kg) load cell. A photograph of the test fixture is shown in Figure 2. The specimens were attached to the test fixtures by means of pins through the loading blocks. The tests were controlled by a computer program, which also recorded the test output data. A 2-Megapixel digital camera was used to monitor the delamination growth, and the image was displayed on a computer monitor. The tests were conducted under room temperature conditions. After completing each test, the specimen was split apart at the mid-plane so that the initial delamination length could be more accurately determined, the post-test delamination length could be measured, and to verify that the delamination grew evenly across the specimen width.
Static tests
In order to determine the fracture toughness, GIc, of each material, quasi-static tests were performed on specimens of each material before fatigue testing. Static tests were also necessary to determine compliance constants for fatigue data reduction and the delamination resistance curve, GIR. Static tests were conducted according to ASTM Standard D5528. 1 Displacement was applied at a rate of 1.27 mm/min. The computer program recorded load and displacement every 0.1 s. The camera system recorded a photograph of the specimen edge every 0.5 s. Opening displacement, δ, was applied to the specimen until the delamination had grown to at least the 40 mm marker.
Fatigue tests for delamination growth rate
The fatigue tests were conducted according to the specifications of the draft standard, “Standard Test Method for Mode I Fatigue Delamination Propagation of Unidirectional Fiber-Reinforced Polymer Matrix Composites”. 3 Tests were conducted, under displacement control, at a frequency of 10 cycles/s. The ratio of minimum displacement to maximum displacement (R-ratio) was δmin/δmax = 0.1. Prior to fatigue testing, each specimen was loaded quasi-statically to a maximum displacement that was less than the mean cyclic displacement for that test. This was done in order to determine the initial specimen compliance, and to help verify the location of the insert tip.
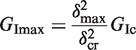
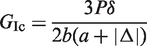
Under constant amplitude displacement control in fatigue, GImax decreases from the initial value as the delamination grows. Therefore, the applied GImax listed for each test is the initial value, and is expressed as a percentage of GIc. Five specimens of each of the carbon/epoxy materials and three specimens of the glass/epoxy were tested at a cyclic GImax level equal to 90% of the average GIc from the static tests. Additional specimens of the IM7/977-3 material were tested at cyclic GImax values of 50, 40, and 30% of GIc. For each desired GImax level, maximum cyclic displacement (δmax) for testing was determined from the relationship
2
Fatigue tests for delamination onset threshold
In addition to measuring delamination growth rates, the fatigue tests of the IM7/977-3 specimens were used to determine the delamination onset threshold curve. The test apparatus, specimen preparation, and procedures required by standard 6115 for delamination growth 2 onset are identical to those specified in the draft standard for delamination growth. 3 Therefore, each IM7/977-3 fatigue test specimen was used to generate both delamination onset data and delamination growth data, by cycling to the onset point (defined as a 1% increase in compliance), and then continuing the fatigue cycling uninterrupted, to generate growth data.
Experimental results and data reduction
Static tests
All data reduction was done using the Modified Beam Theory (MBT) method as described in Ref. 1, where GIc is given by
Double-cantilevered beam load-displacement plot. Static double-cantilevered beam compliance calibration plot.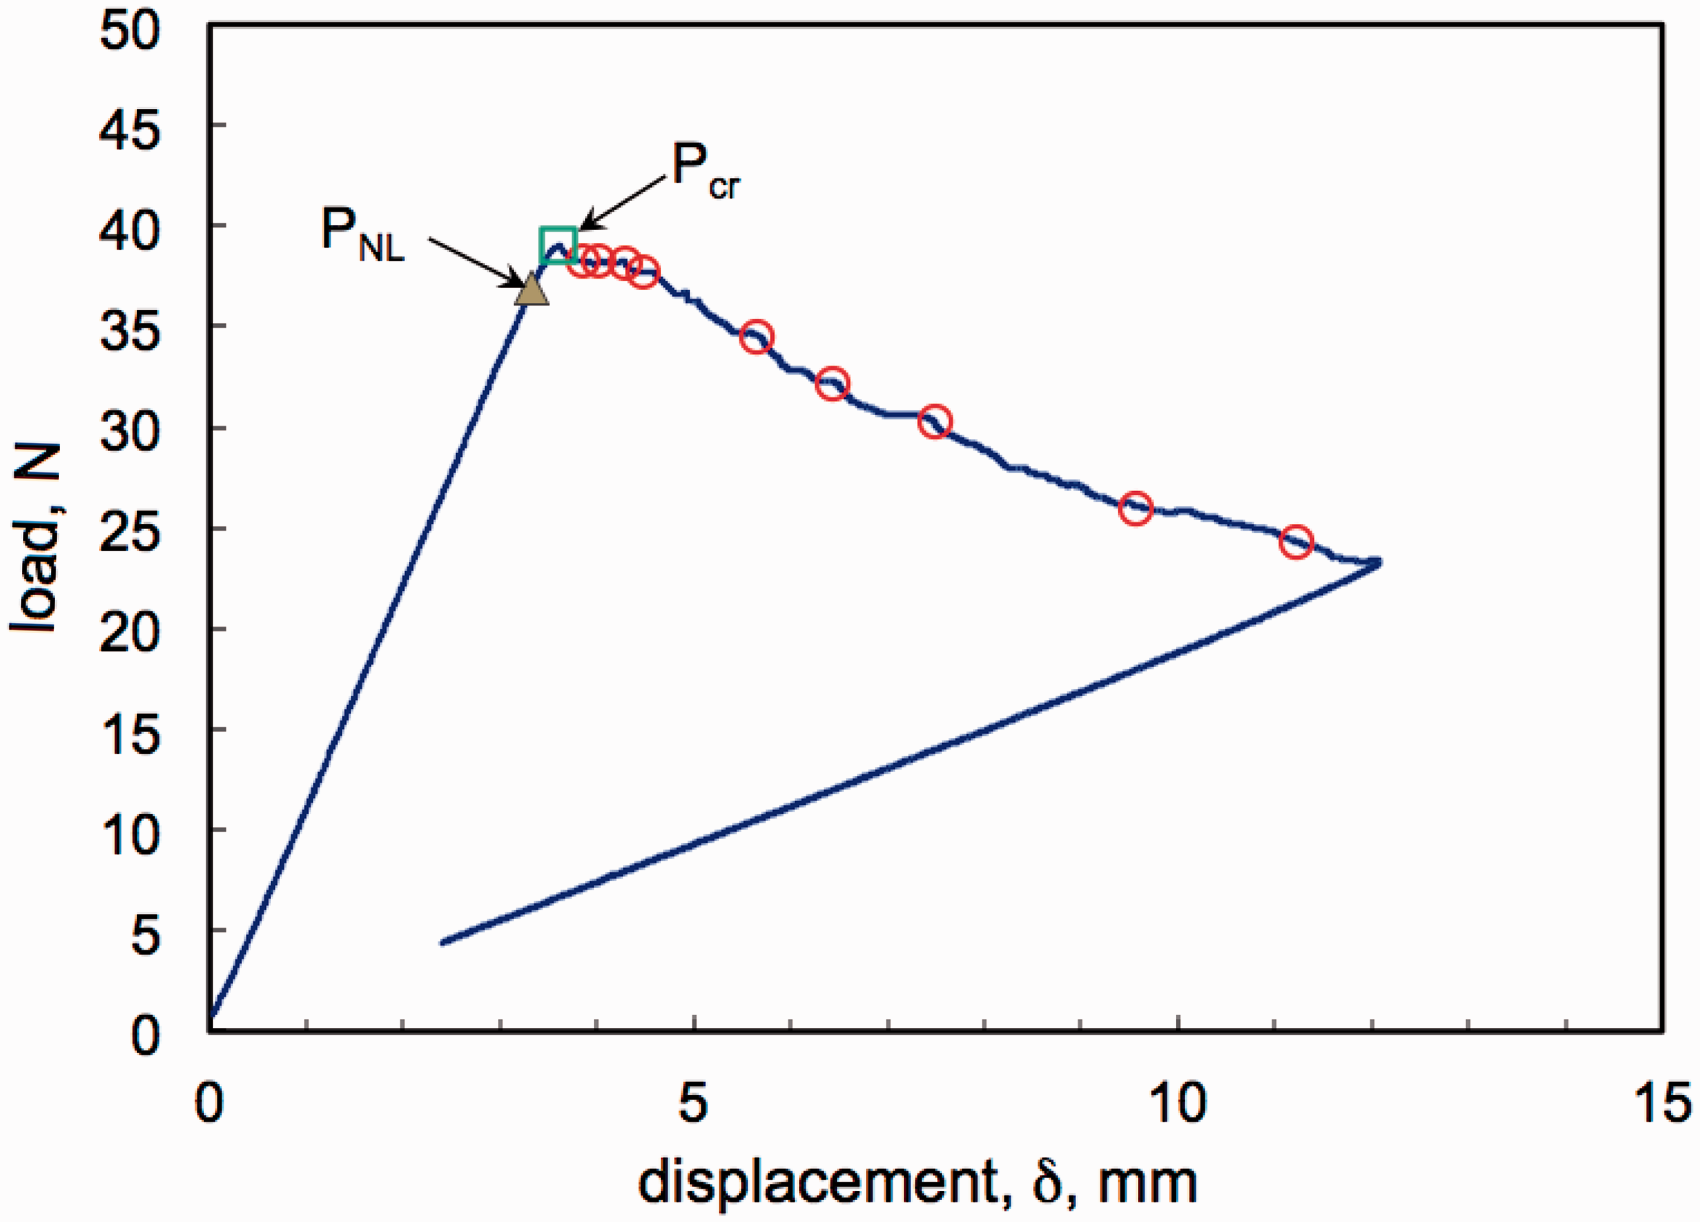

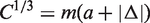
Static DCB data.
Fiber-bridging was observed in the static testing, particularly in the S2/5216 specimens. Figure 6 shows a photograph of an S2/5216 specimen during static testing, showing the extensive fiber-bridging. A main objective of the ASTM Round Robin was to evaluate the effect of fiber-bridging on fatigue delamination growth and the Paris Law. Therefore, the static test results were used to determine a delamination resistance curve equation (R-curve), for each material, to be used in the fatigue data reduction. During the static testing, after the critical displacement point was reached, opening displacement was continued, and GI was calculated as the delamination continued to grow. The calculated G-values were plotted versus the change in delamination length, Δa, to produce the R-curve. Increasing values of GI as the delamination grows indicate fiber-bridging is likely to be occurring in the specimen.
Fiber-bridging in S2/5216 double-cantilevered beam specimen.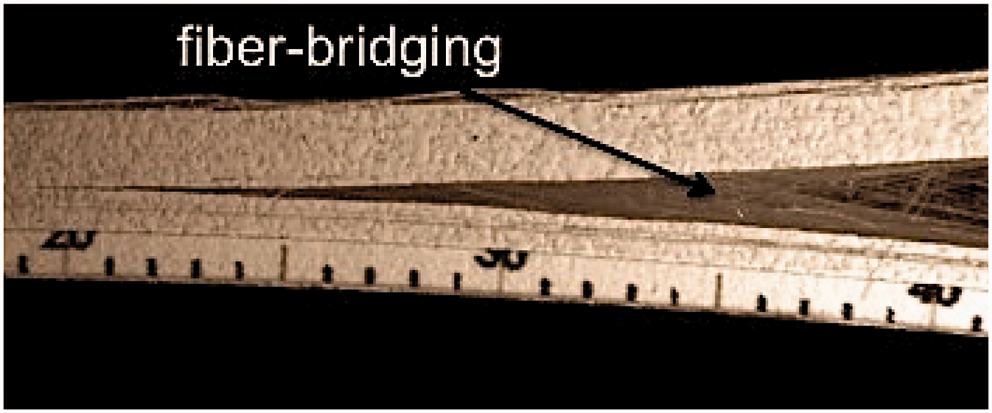
The IM7/977-3 specimens showed an increasing R-curve from initiation until the delamination had grown approximately 15 mm, where GI reached a plateau level of 205.1 J/m2. The G40-800/5276-1 specimens showed an approximately linear R-curve throughout the test, for delamination growth of 50 mm, with no plateau level observed. The S2/5216 specimens also showed an increasing R-curve throughout the loading, with a constant slope for the first 21 mm of delamination growth, followed by another linear region, with a different slope, over the final 30 mm of delamination growth. An example R-curve from each material type is shown in Figure 7. The amount of fiber-bridging observed in the tests corresponded to the steepness of the curves in Figure 7, with the S2/5216 showing extensive fiber-bridging, and the two carbon/epoxies exhibiting very little.
Delamination resistance curves.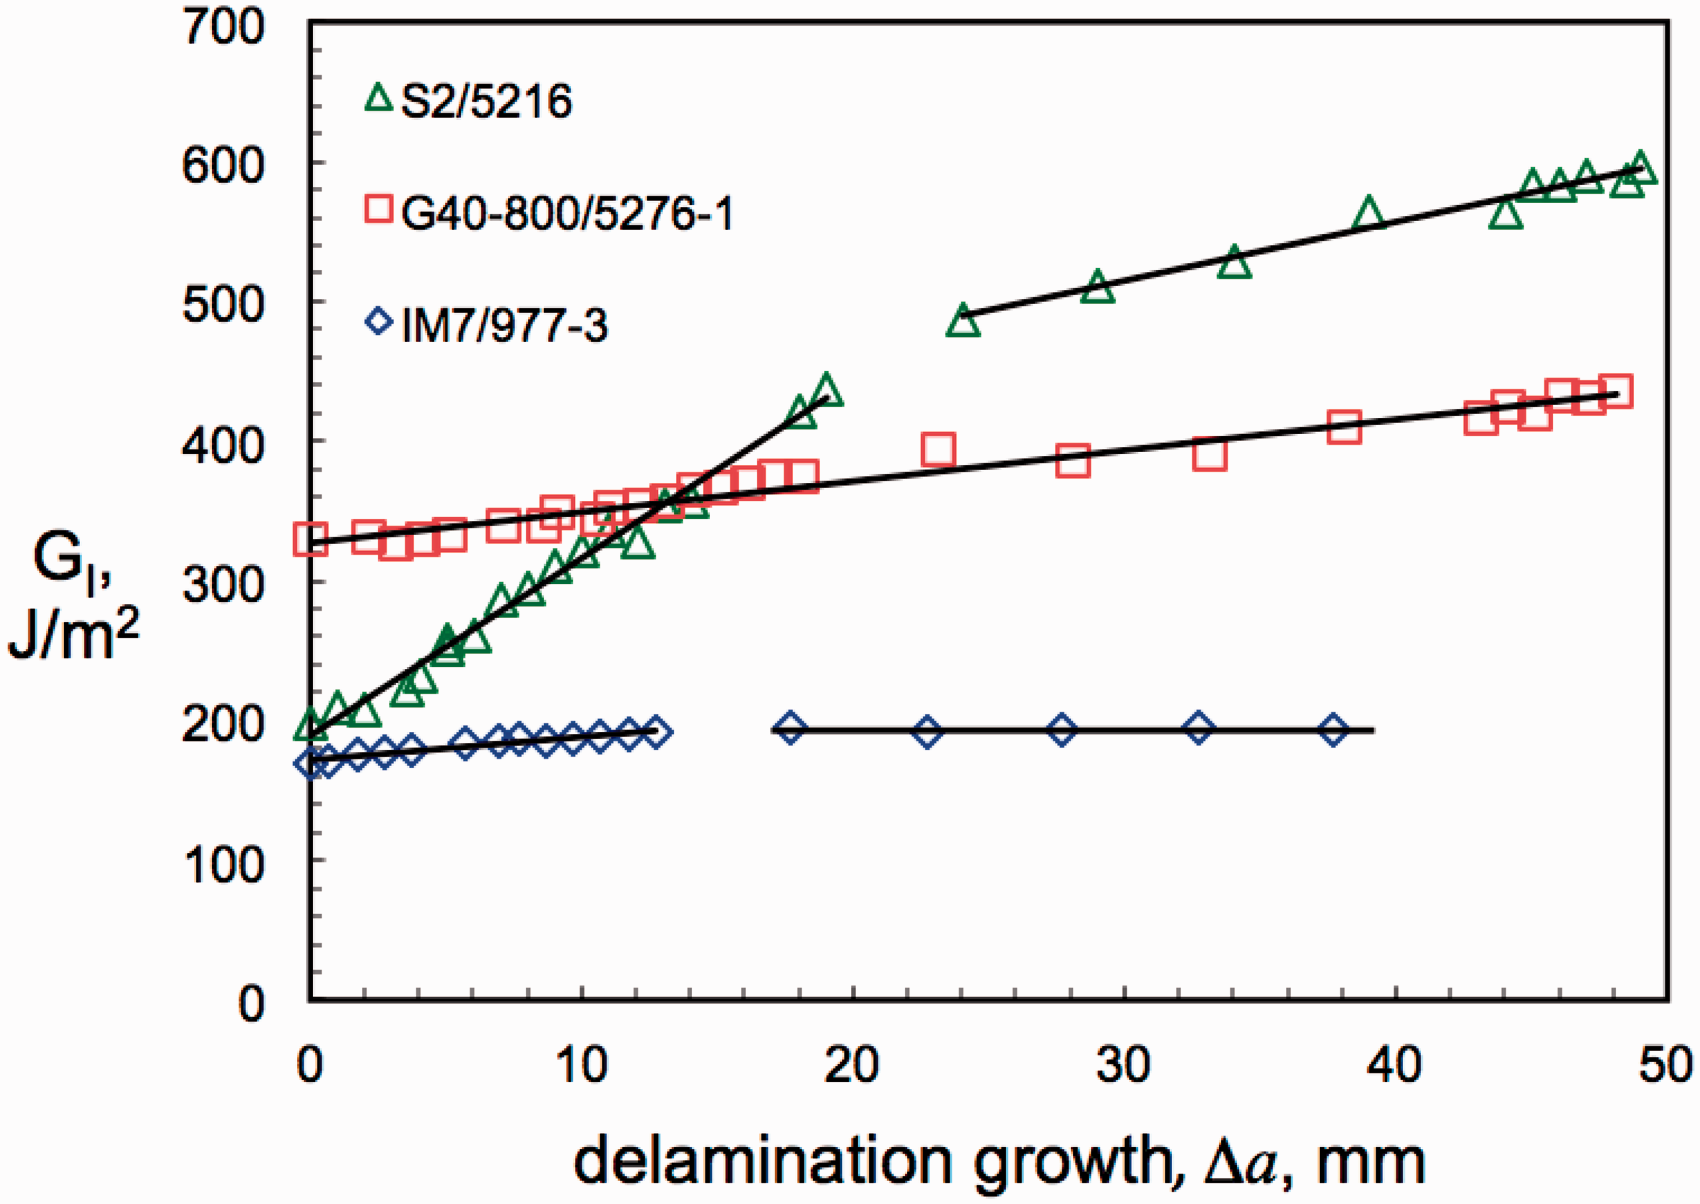
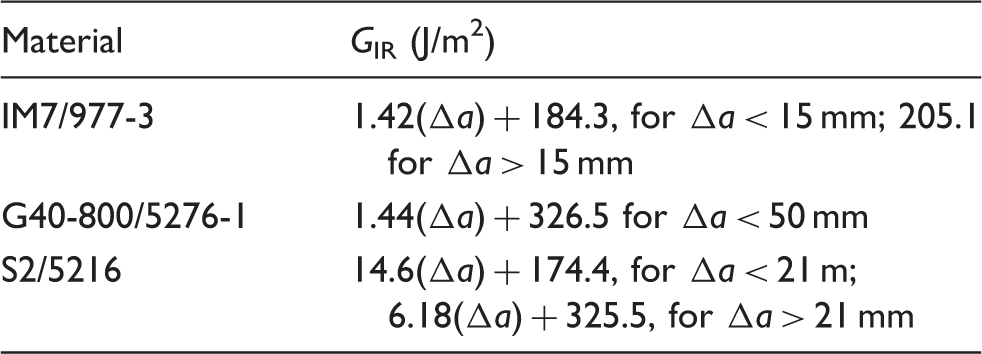
Delamination resistance curve expressions.
Delamination onset
In addition to the specimens tested at 90% GIc, specimens of the IM7/977-3 material were cycled at GImax levels of 50, 40, and 30% GIc to determine a threshold curve for no delamination onset. As specified by Ref. 2, the onset of delamination in each specimen is defined as the point at which the compliance increases by 1%. The initial GImax of the test versus the number of loading cycles to the 1% C increase point is plotted. Tests are conducted at a range of GImax levels to generate the delamination onset curve as shown in Figure 8. The average fracture toughness, GIc, is also plotted on Figure 8, at N = 1. Results at the lower GImax levels are consistent for each load level, but the 90% values are more scattered. The two tests at the highest cycle counts are shown with right-pointing arrows, indicating that these are run-out tests for which no delamination growth occurred.
Delamination onset for IM7/977-3 double-cantilevered beam specimens.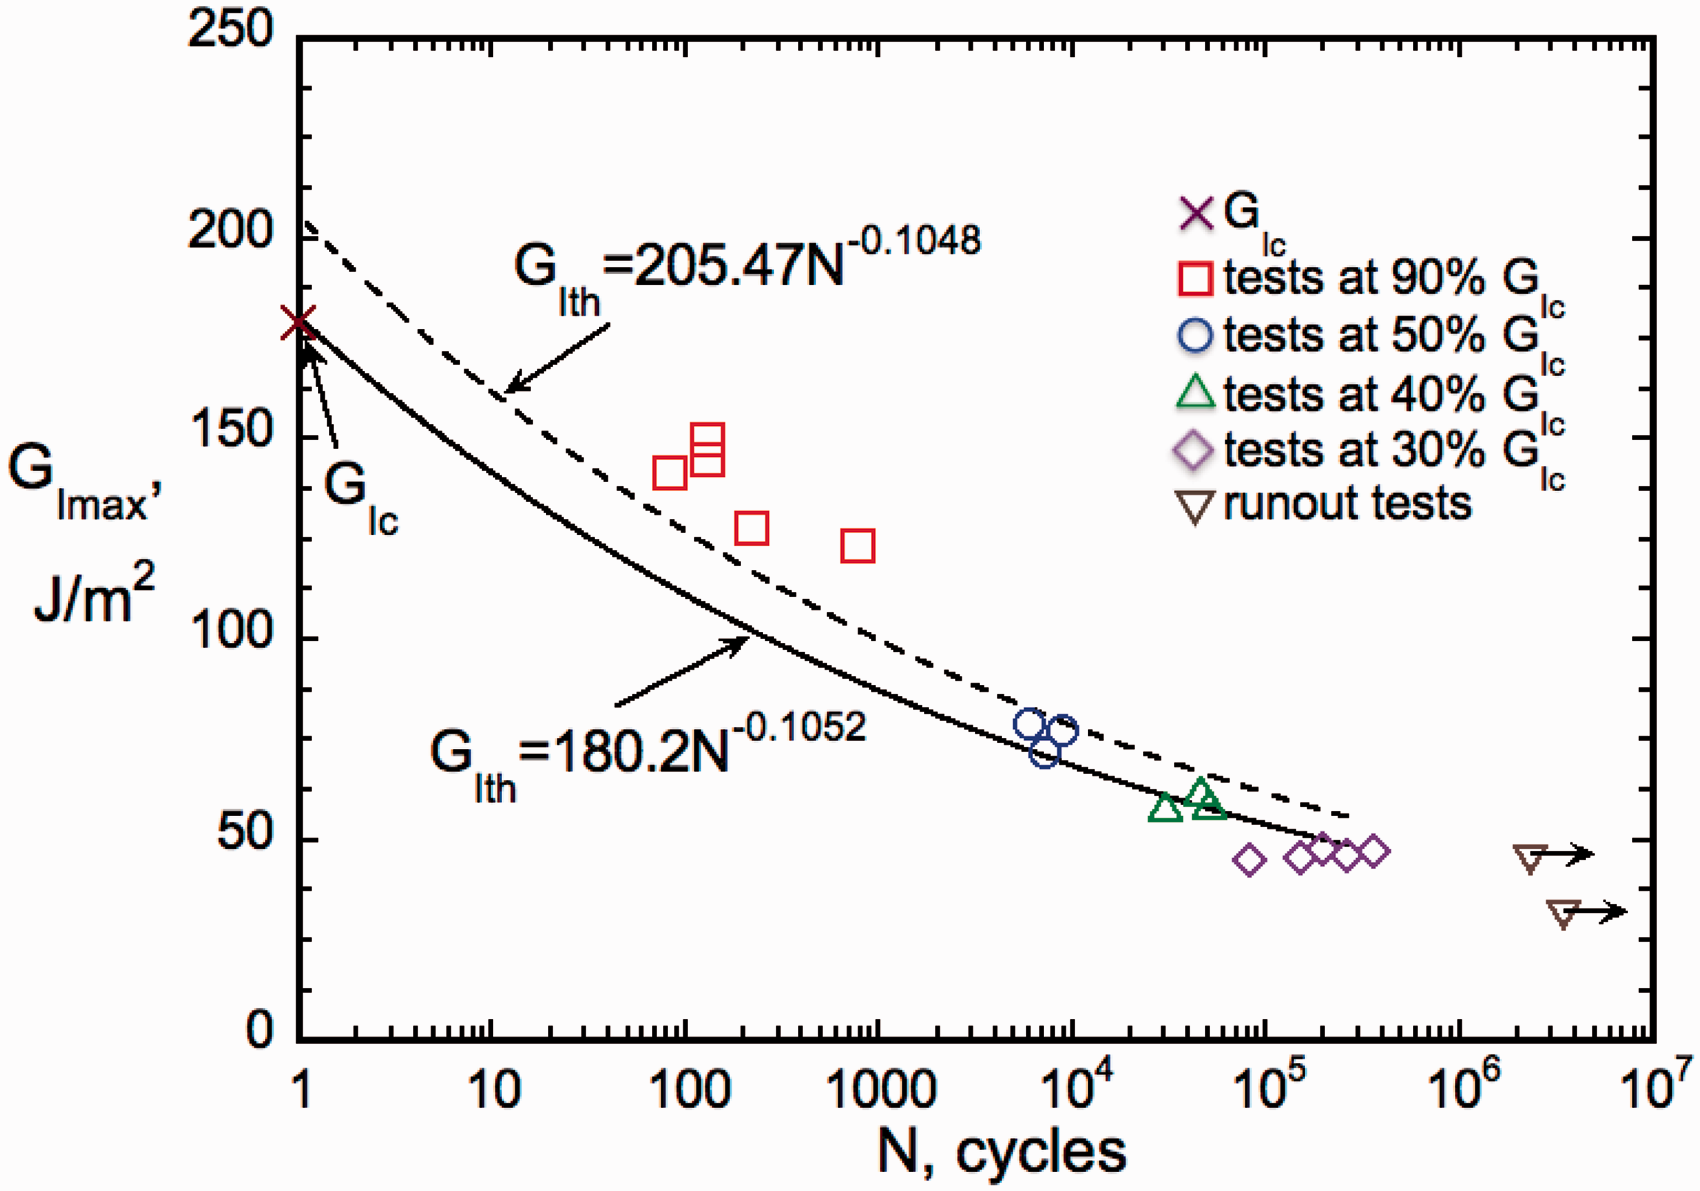
Delamination growth was verified in all the specimens by splitting them apart and inspecting the midplane surface after completion of the delamination growth testing. At the 30% GIc level, there is a wider range of Nonset values, and one specimen was a run-out. These specimens all showed very little delamination growth at the midplane (less than 3.2 mm) during post-test inspection. For the IM7/977-3 specimens, therefore, the threshold for no-delamination-growth appears to be near 30% GIc.
Typically, a power law curve is fit through this data set to give a threshold below which delamination should not occur.4,5 A curve was fit first through the combined static and fatigue data set (excluding the runout tests). The curve fit is shown by the dashed line in Figure 8, which also shows the corresponding equation. A second equation, shown by the solid line, was fit through the data at the lower GImax values only (ignoring the 90% GImax data). Both curves predict delamination onset in the 90% tests at lower cycle counts than were measured in the tests. Because the lower curve fit (solid line) was a better fit to the GIc value, and because it is more conservative, it was used to calculate a threshold value, GIth, at N = 1 × 10⁶ cycles, equal to 42.1 J/m2.
Delamination growth at GImax = 90%GIc
Specimens of each material were cyclically loaded at an initial GImax = 90%GIc to generate delamination growth data. Testing was typically conducted until the growth rate, da/dN, decreased to 2.5 × 10⁻⁶ mm/cycle, but in some cases was continued beyond that point.
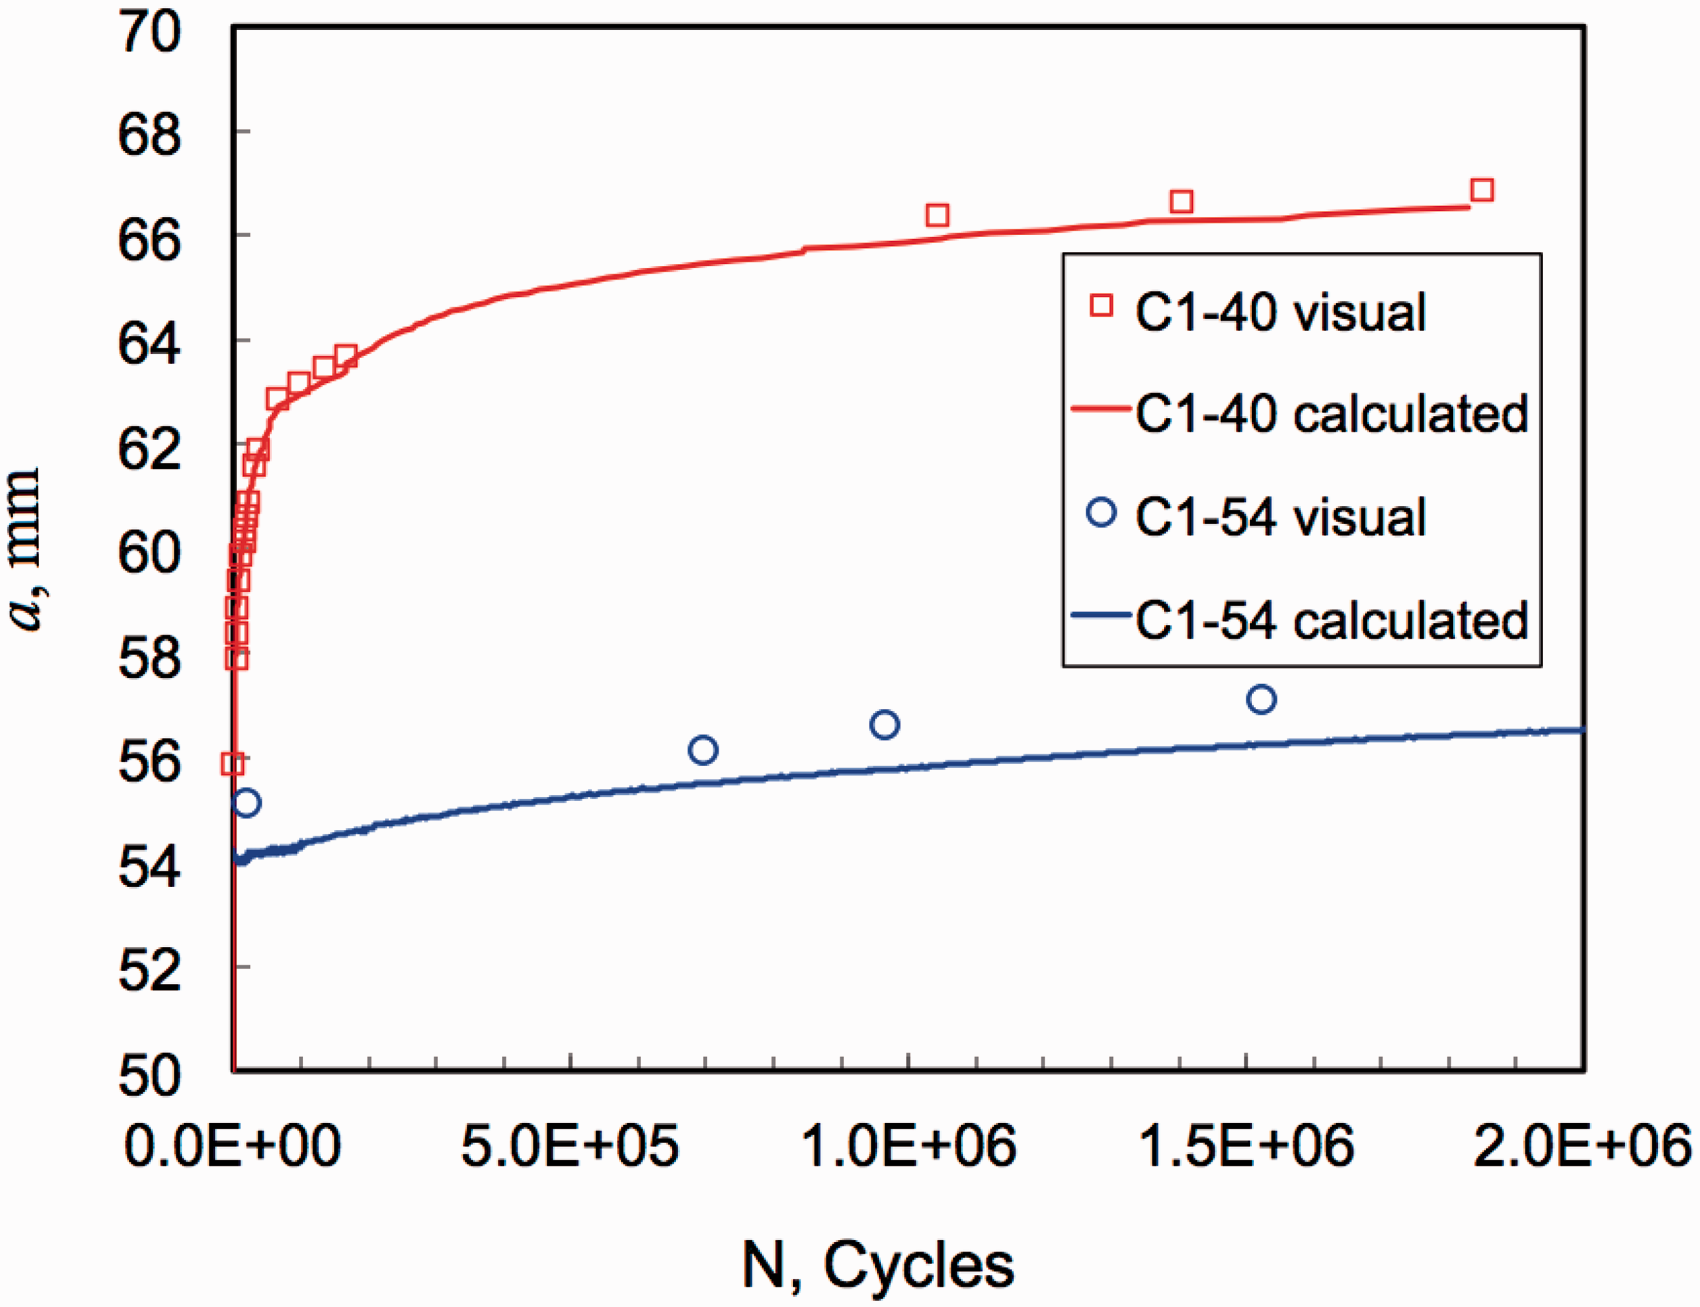
Before calculating the delamination growth rate, da/dN, a parsing routine was applied to the very large raw data files to eliminate noise and reduce the data set to a more manageable size. This parsing routine compared the change in delamination length for each pair of consecutive data lines to a pre-set limit, and eliminated data points for which the delamination length increase was less than this limit. Figure 9 shows an example of C versus N for the raw data set and for the reduced data set. The reduced data and raw data are in excellent agreement. The delamination length, a, at each data point, was calculated from equation (3), using the average values of m and Δ from the static testing, as shown in Table 1, and the compliance data at that point. Figure 10 shows a plot of a versus N for two different specimens of IM7/977-3, showing visually observed values of a, determined from the automated photographs, and the calculated values. For the C1-40 specimen, the agreement between calculated and visually observed values is very good, although there is some difference at the high cycle counts. For the C1-54 specimen, there is a small offset between the measured and calculated values of a, however, the data follows the same trend. The calculated values of a were used for all the data reduction.
Effect of data parsing on compliance data. Comparison of calculated and measured delamination length.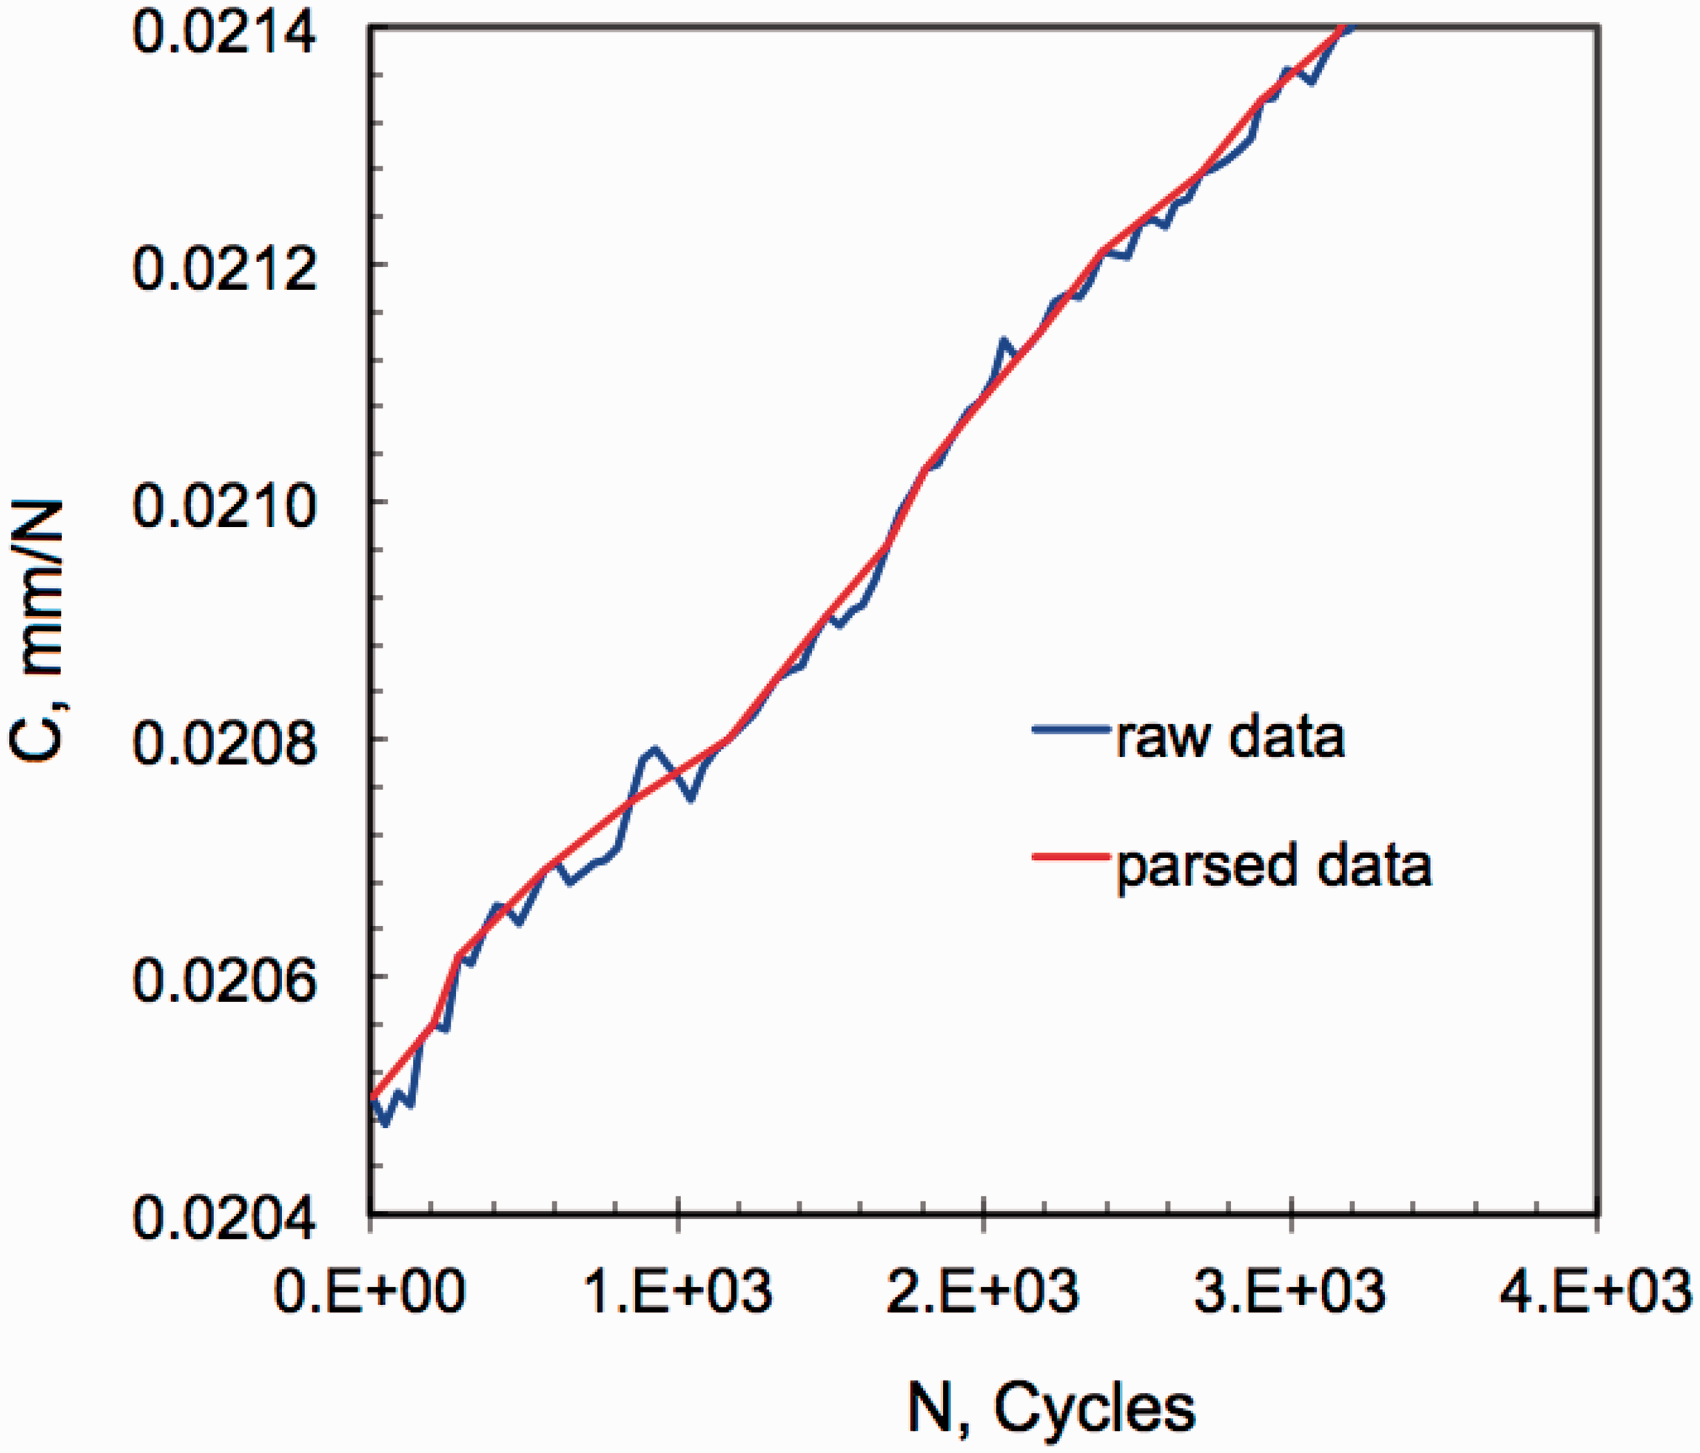
To determine the delamination growth rate, da/dN, the draft standard 3 recommends two data reduction methods - a two-point secant method and a seven-point polynomial method. These calculations were applied to the reduced data sets for all specimens. For the two-point method, da/dN is determined from the slope of the line between two adjacent points on the plot of a (delamination length) versus N (cycle count). The corresponding value of GImax is calculated from equation (2), where a and P are the averaged values from the two data points. The seven-point method calculates da/dN by fitting a second order polynomial to sets of seven successive data points. A complete description of this method can be found in ASTM Standard E647-00. 12
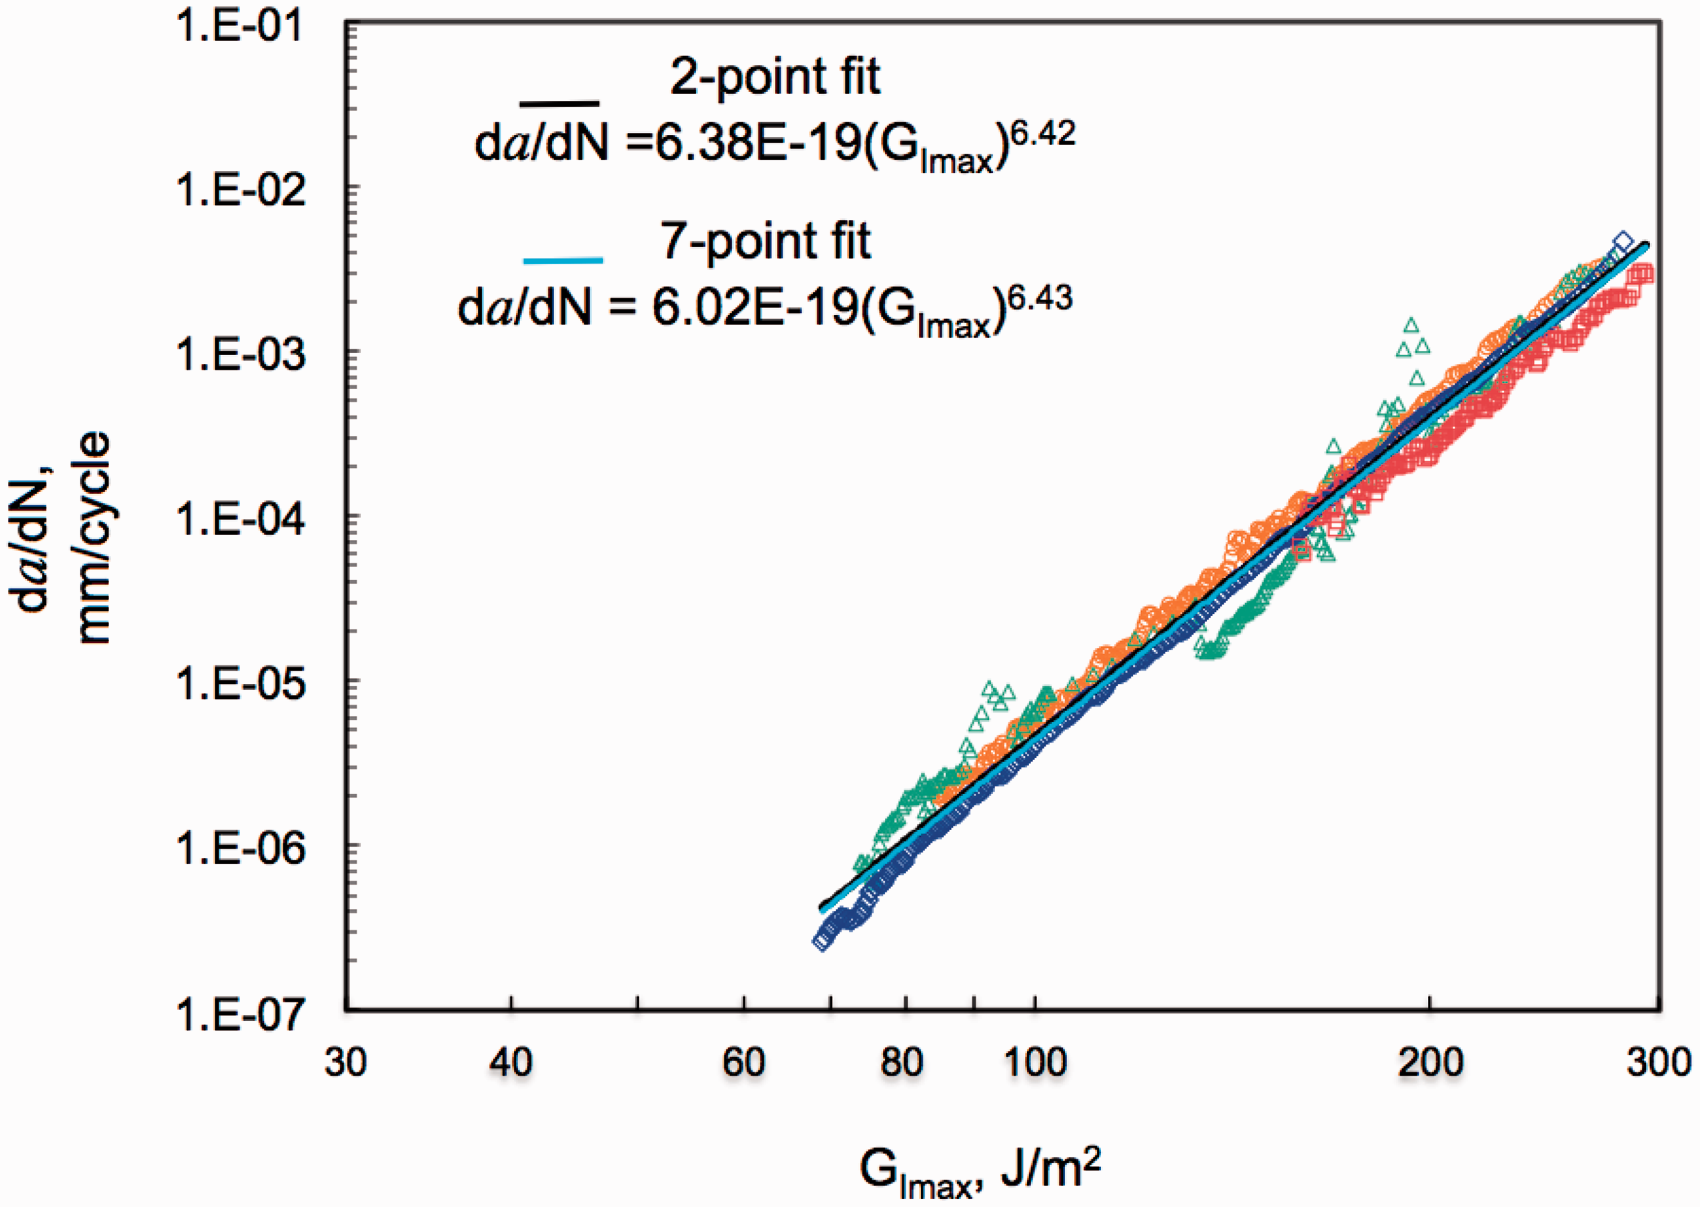
Figure 11 shows GImax versus da/dN for both the two-point and seven-point calculation methods for the S2/5216 material, where the colors and symbols represent the different specimens. The results show good repeatability between the specimens, but there is noticeably more scatter in the two-point reduced data. A Paris Law expression of the form da/dN = A(GImax
B
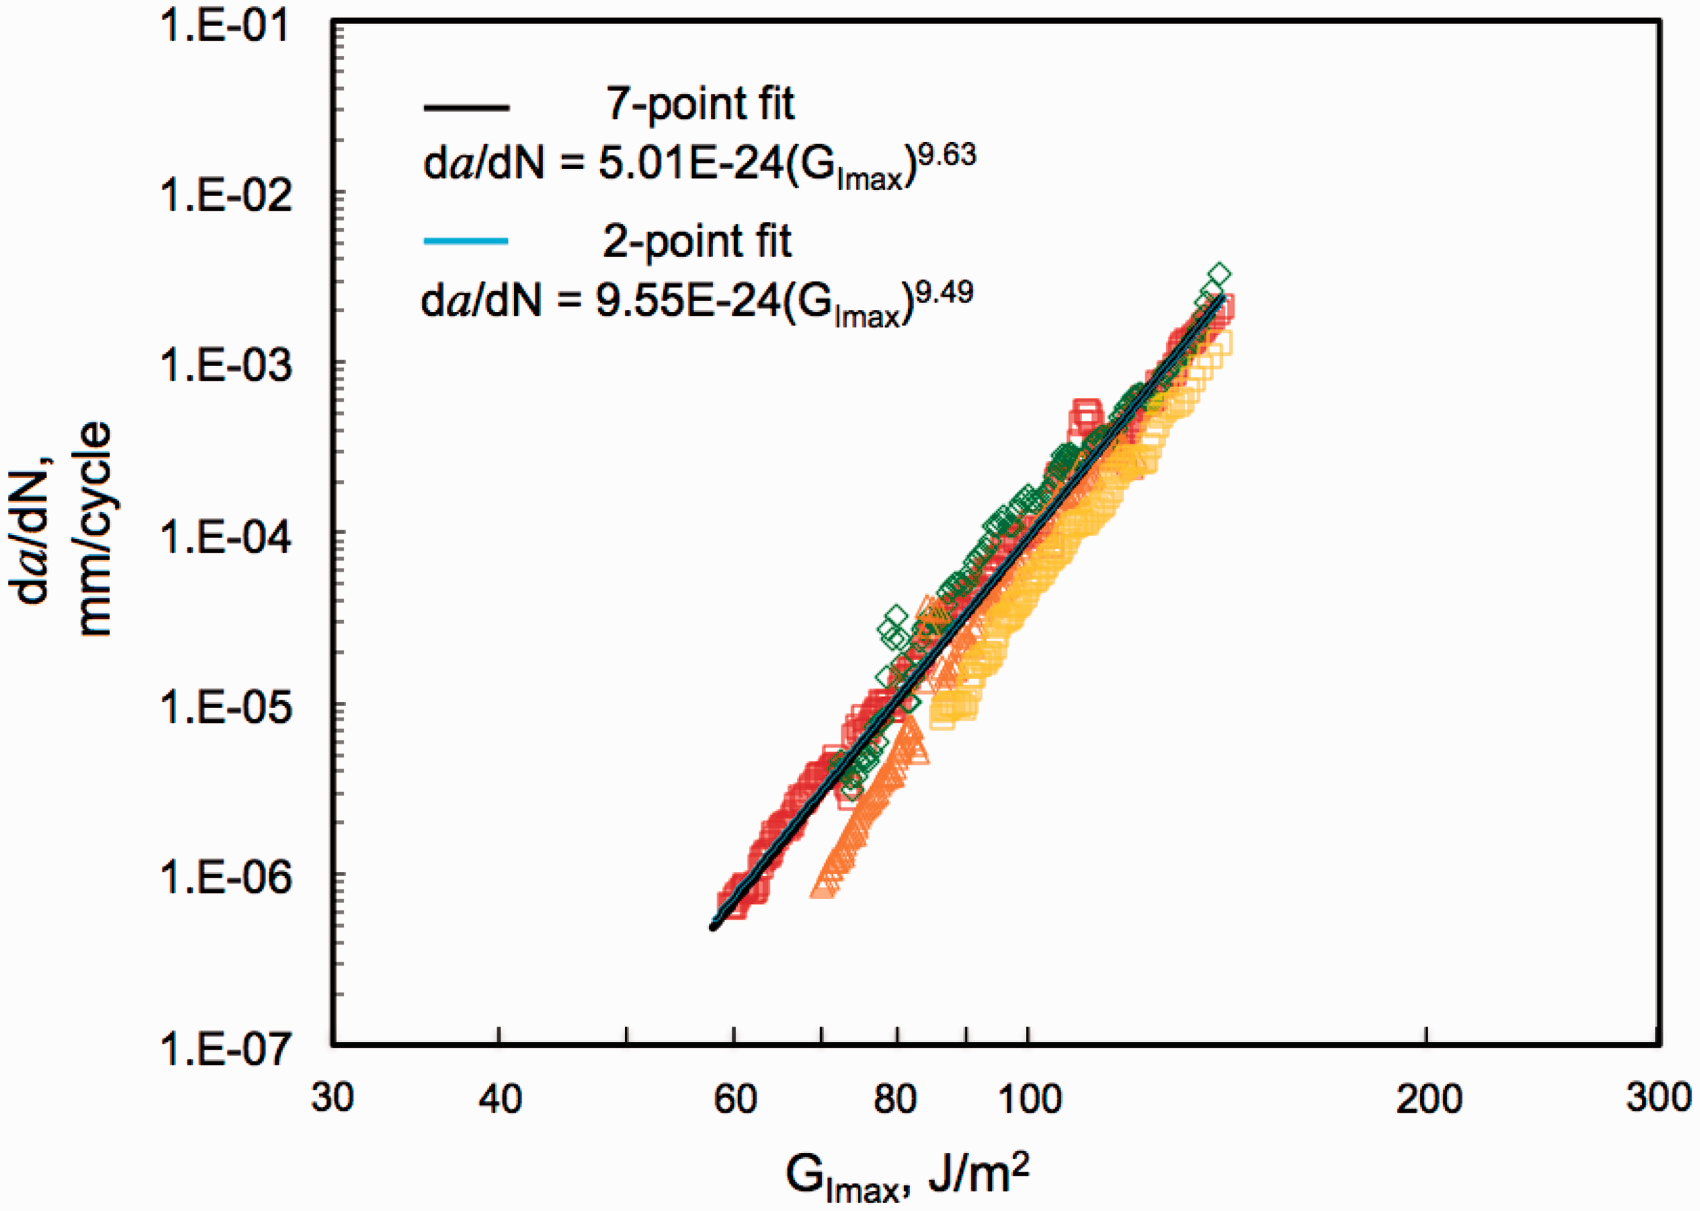
), where B reflects the slope of the line, was fit to the two-point and seven-point results for each specimen. A comparison of the exponents, B, for each calculation method showed a difference of typically 1% or less for any specimen. This comparison was repeated for the other two materials, with similar results. The maximum difference between the power law exponents was 2.4% for all specimens tested. Figures 12 and 13 show GImax versus da/dN data from the seven-point method for IM7/977-3 and G40-800/5276-1 materials, respectively. The IM7/977-3 results in Figure 12 are only those for the IM7/977-3 specimens tested at GImax = 90%GIc, and not those tested at the lower GImax levels. Results for these materials show good repeatability. In Figures 12 and 13, the Paris Law has been fit to the complete data set (using seven-point polynomial data reduction) and is shown in the plot. The Paris Law equation from the two-point data reduction is also shown in each figure for comparison and is within 1.4% for all the materials. Therefore, the seven-point solution method was considered to accurately represent the delamination growth, with less scatter, and was used in the remainder of the data reduction, rather than the two-point method.
Comparison of two-point secant and seven-point polynomial fit data reductions for S2/5216. Each symbol type represents a different specimen. (a) Delamination growth data with two-point fit data reduction; (b) Delamination growth data with seven-point fit data reduction. Delamination growth curve for G40-800/5276-1 double-cantilevered beam specimens. Delamination growth curve for IM7/977-3 specimens at 90%GIc.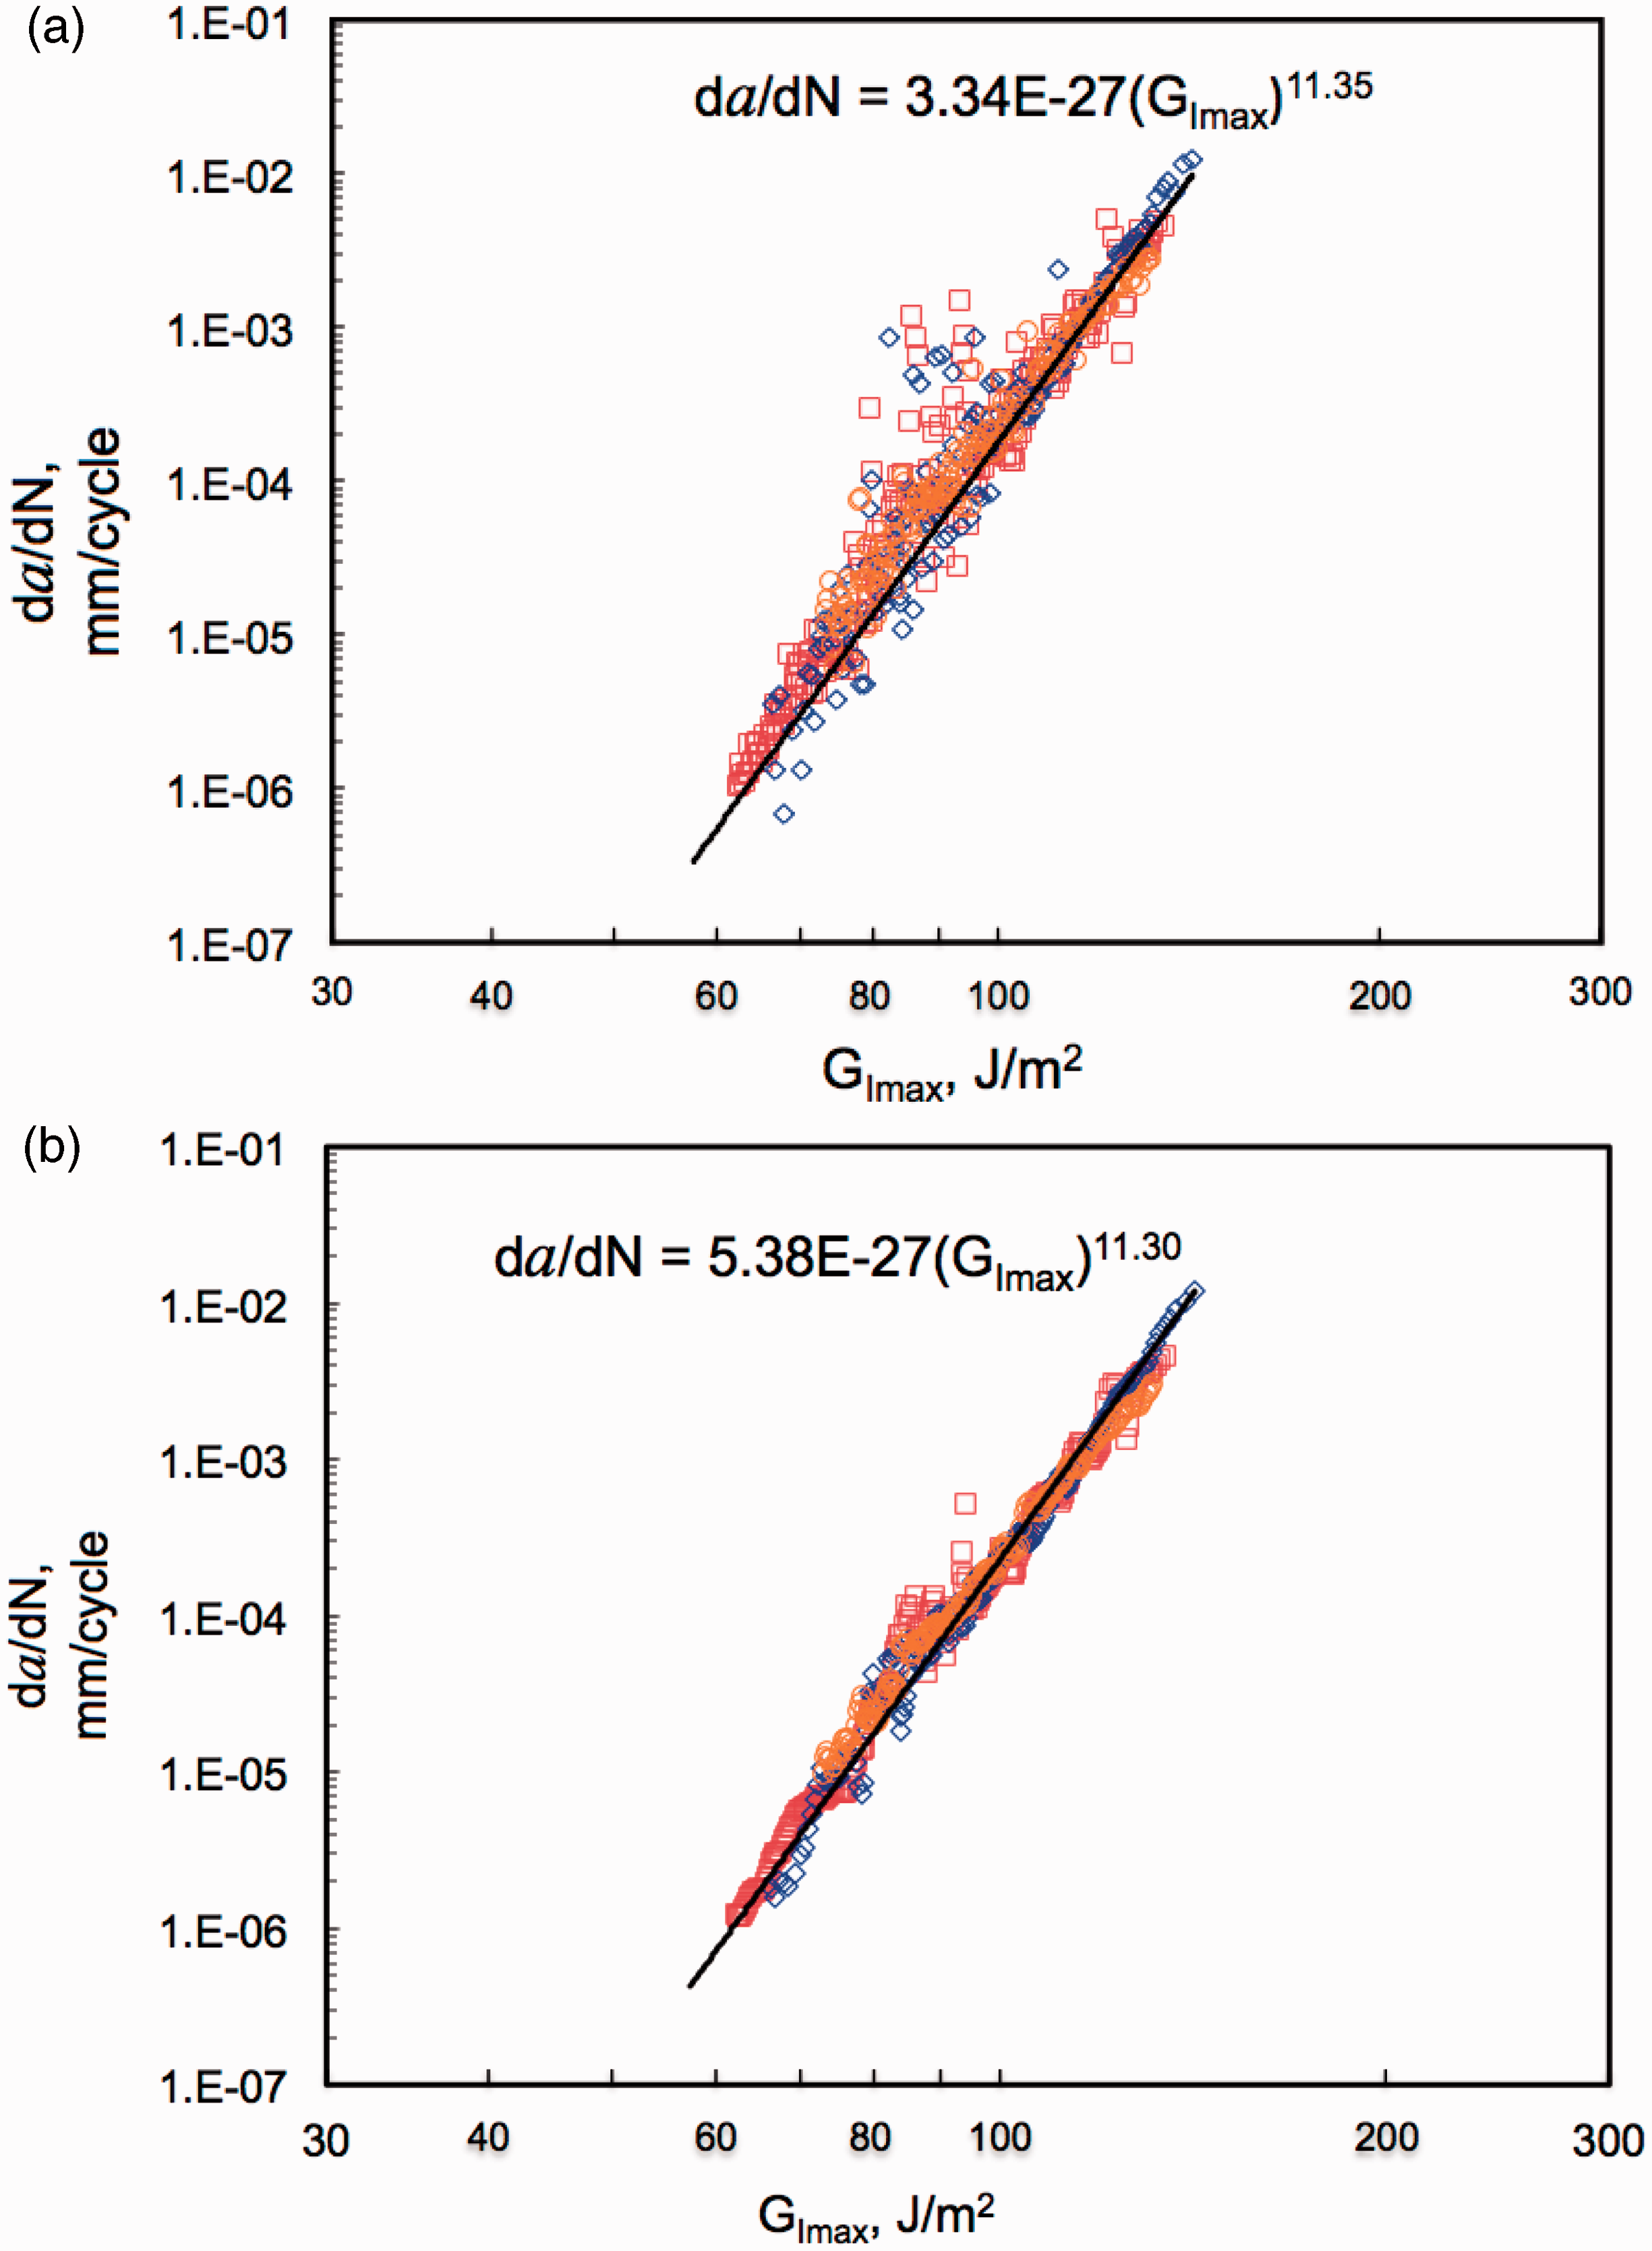
Fiber-bridging and normalized GImax in fatigue
In order to evaluate the contribution of fiber-bridging to the delamination growth results, the GImax data in Figures 11(b)–13 were normalized by the appropriate GIR expressions from Table 2. However, since GImax/GIR has no units, those values were multiplied by GIc for each material to allow comparison with the non-normalized GImax results. This term was called
Normalized and non-normalized Paris Laws for IM7/977-3 specimens tested at 90%GIc. Normalized and non-normalized Paris Laws for G40-800/5276-1 specimens. Normalized and non-normalized Paris Law for S2/5216 specimens. Non-normalized and normalized Paris Law constants.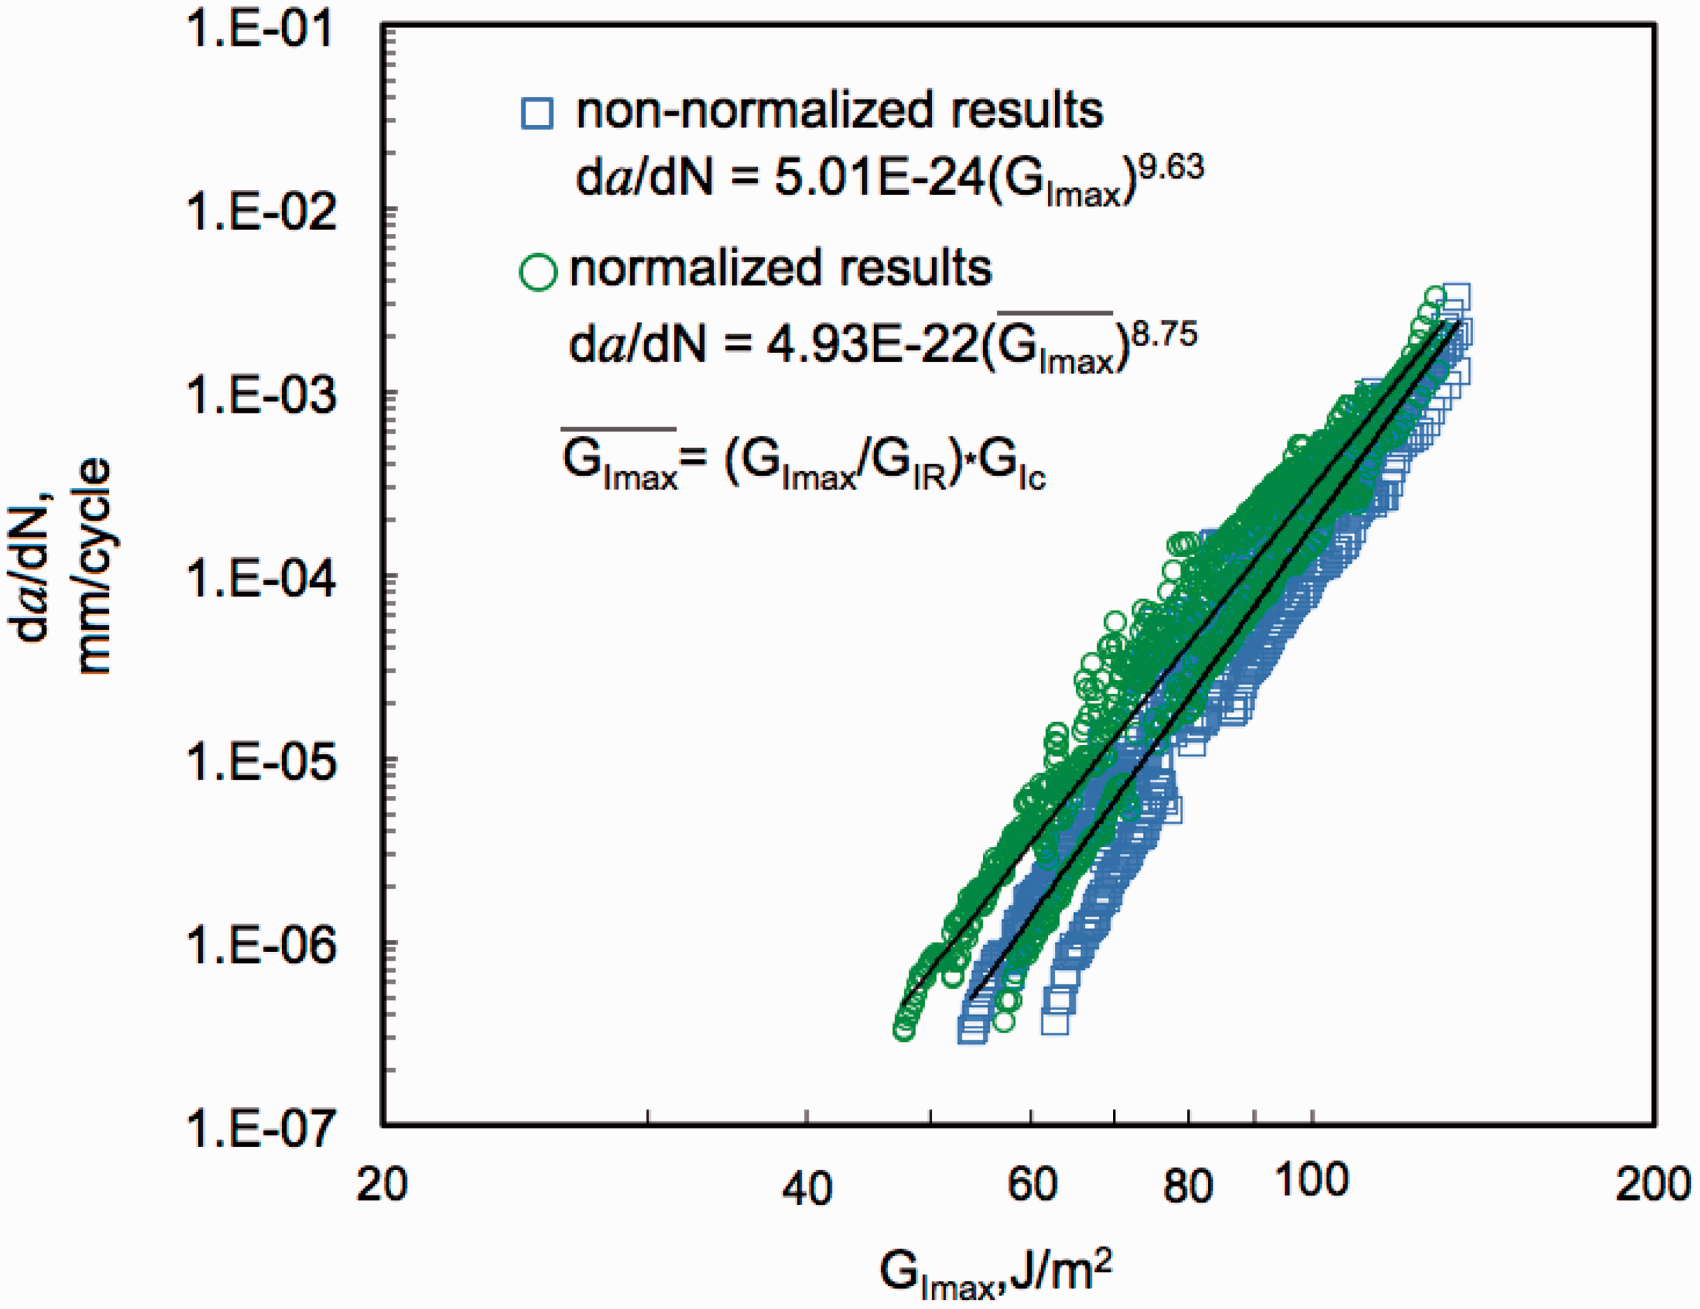
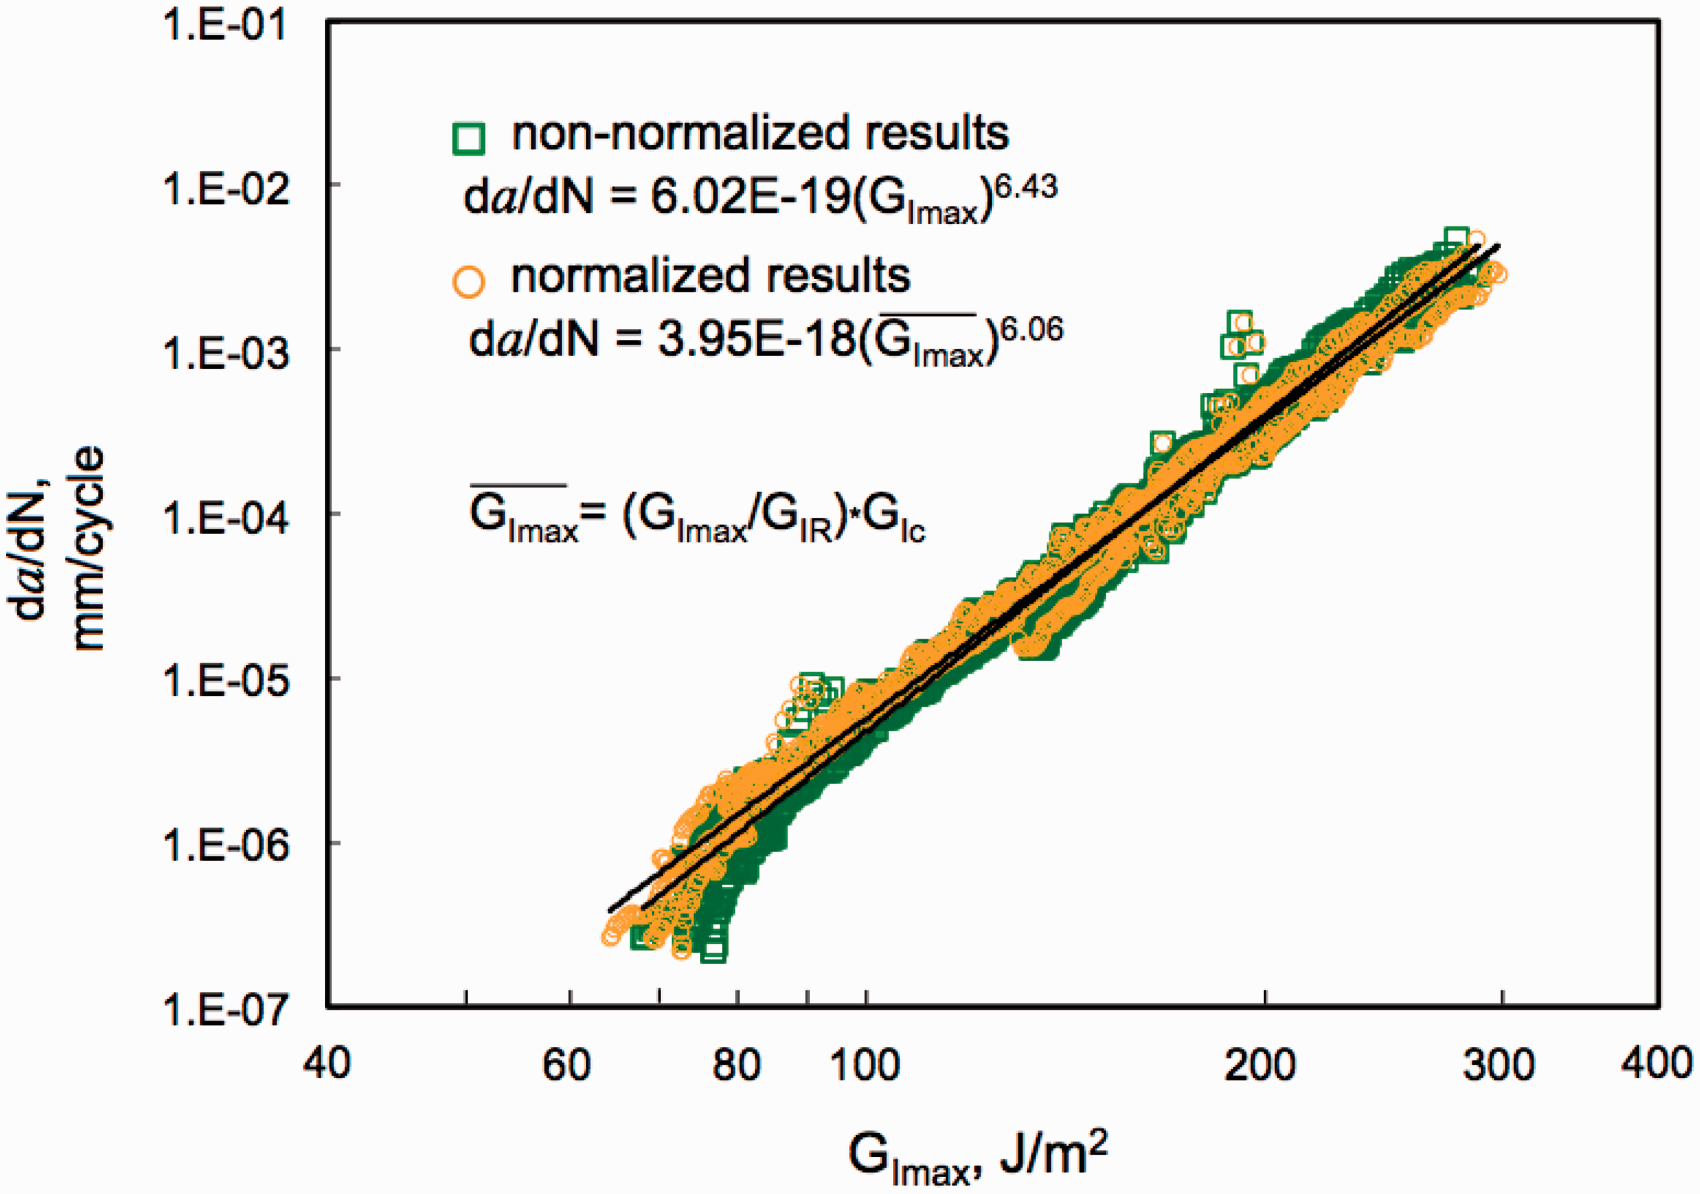
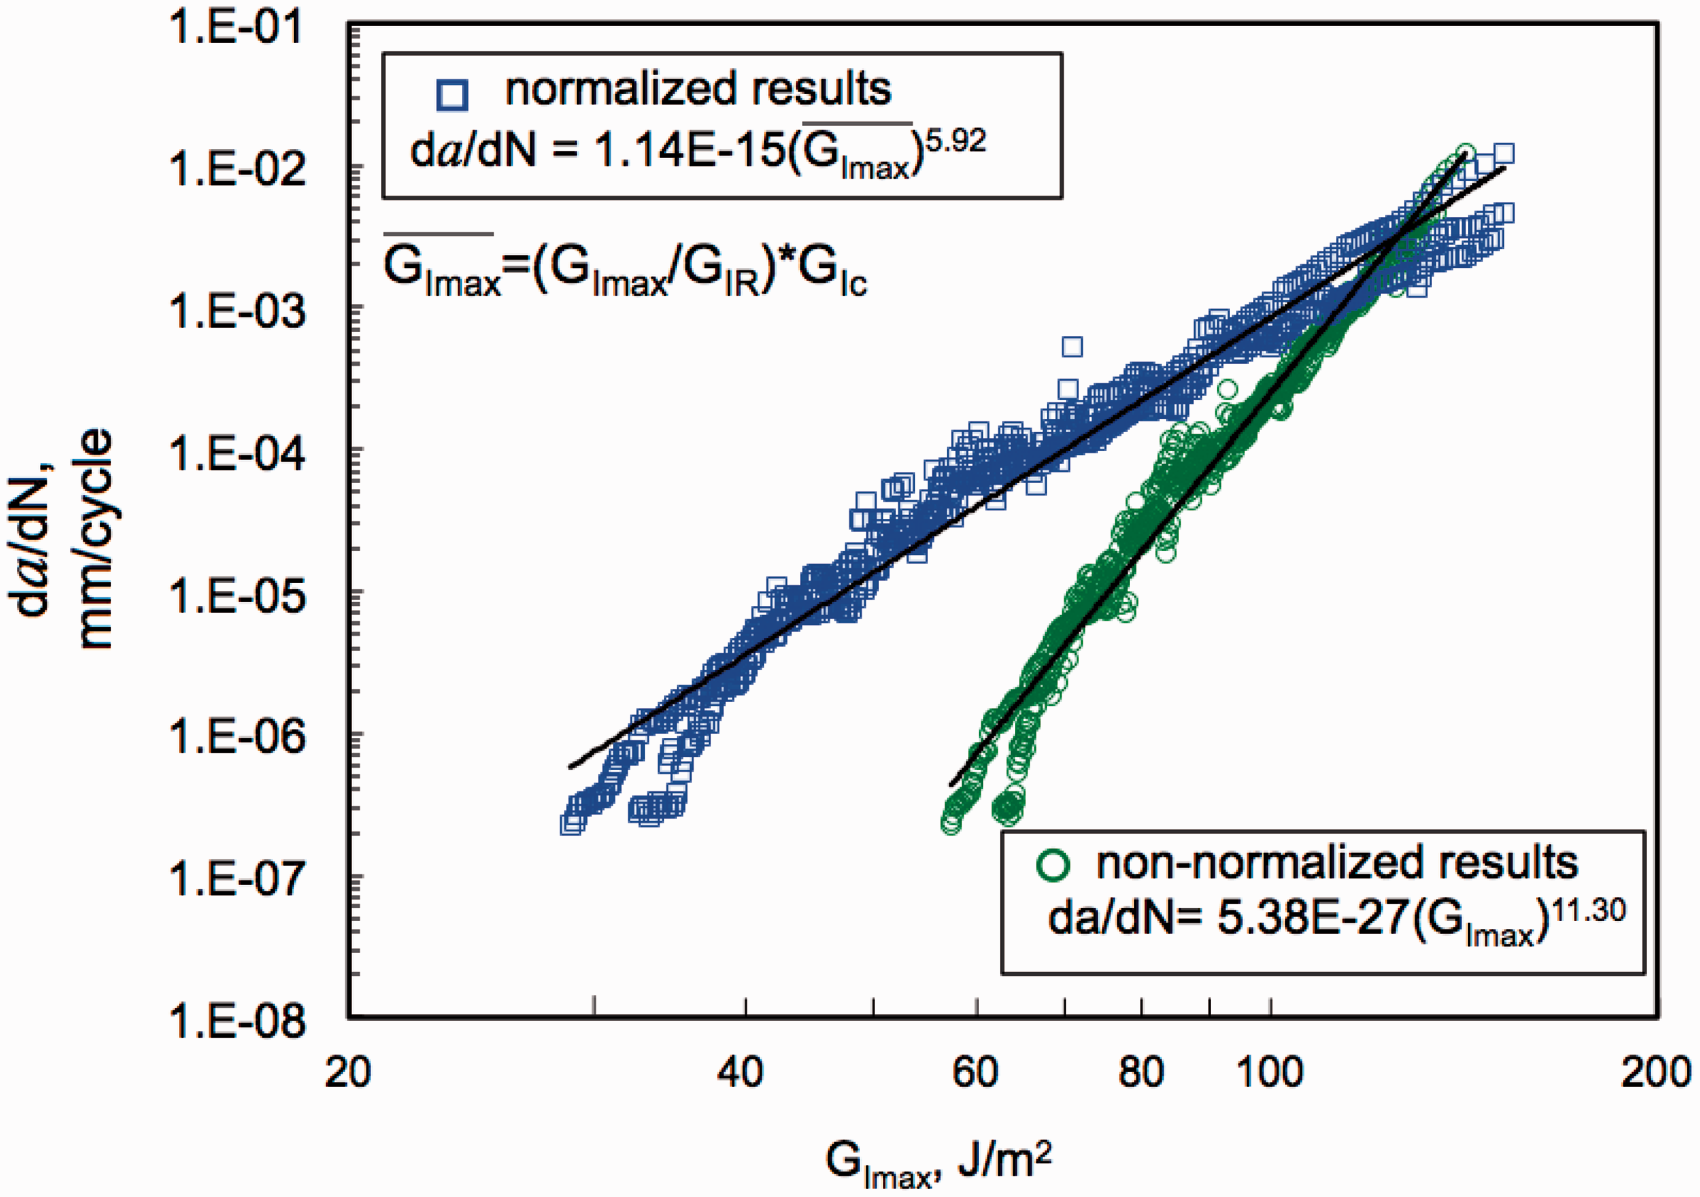
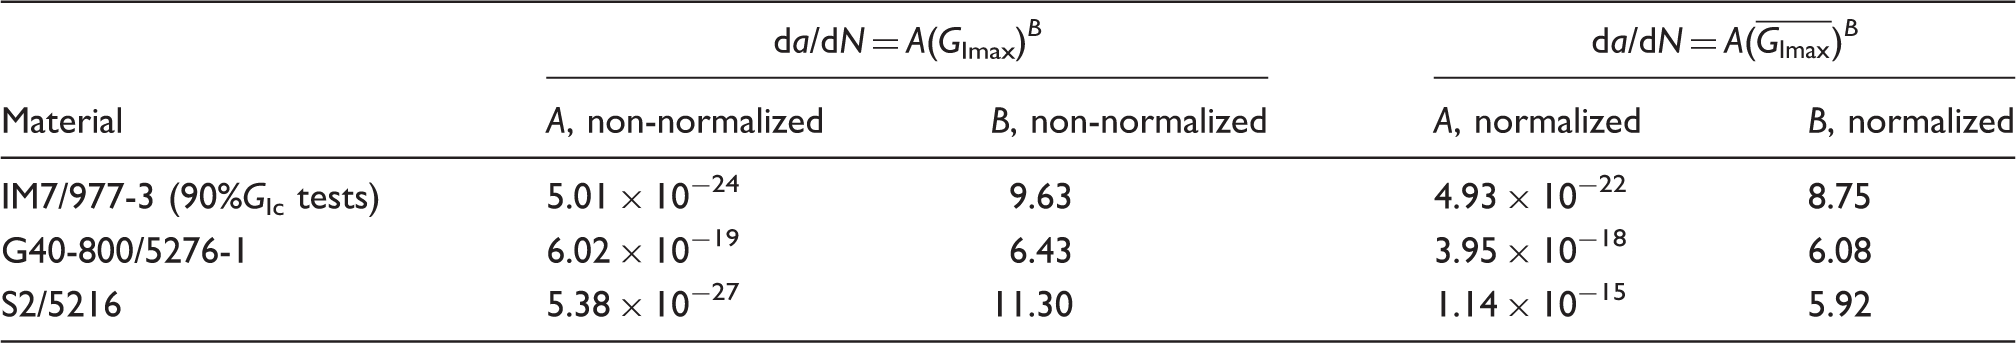
A comparison of the original and normalized B-values for each material shows decreases of 9.1, 5.4, and 47.6% for the IM7/977-3, G40-800/5276-1, and S2/5216 materials, respectively. The magnitude of the reduction corresponds to the amount of fiber-bridging that was observed in the testing, with G40-800/5276-1 showing minimal fiber-bridging, and S2/5216 showing extensive fiber-bridging. A comparison of the data sets in Figure 16 shows that at a given applied GImax level, the growth rate is faster for the normalized data than indicated by the non-normalized results. As the delamination grows and the amount of fiber-bridging increases, the difference between non-normalized and normalized growth rate is more than an order of magnitude for the S2/5216 material. The value of A also changes in the normalized results, which is reflected in Figures 14 and 16 by the shift of the data to the left. Figures 14 and 16 show that the delamination arrest points for those materials are at lower values of GImax than would be indicated by the non-normalized results.
Reference 13 also presents results from the Round Robin testing. In that study, values of B from the non-normalized data were 8.35, 6.97, and 9.80 for the IM&/977-3, G40-800/5276-1, and S2/5216 materials, respectively. The corresponding normalized values were 6.82, 6.31, and 5.5, representing decreases of 18.3, 9.5, and 43.9% for the IM7/977-3, G40-800/5276-1, and S2/5216 materials, respectively. Although the exponent values in the current study differ somewhat from Ref. 13, the magnitude of the reduction due to normalizing the data is similar.
As shown in Figure 16, the effect of fiber-bridging on measured delamination growth rate can be significant. In a structure where delamination is the dominant failure mode, this difference must be recognized and accounted for in the design process. The method of using an R-curve generated in static testing to account for fiber-bridging under fatigue loading is commonly used,8–10 However, the amount of fiber-bridging that actually occurs is likely to be a function of the maximum opening displacement applied to the specimen. Therefore, the practice of correcting fatigue data generated at lower levels of GImax/GIc using an R-curve generated at much higher opening displacements may be overly conservative. The method used herein is useful, however, as a first approach and to qualitatively compare fiber-bridging between different materials.
Delamination growth in IM7/977-3 at a range of GImax levels
Delamination growth rates were also calculated for the IM7/977-3 fatigue specimens tested at an initial GImax below 90% GIc. Figure 17 shows GImax versus da/dN for the complete data set, with results grouped by the initial GImax level. The slopes of most of the data sets are similar to the 90% GIc results, although the position of the curves shifts slightly upward with decreasing initial GImax levels. This can be understood as an effect of fiber-bridging as the delaminations grow. For example, consider a specimen tested at an initial GImax equal to 90% GIc and a specimen tested at an initial GImax of 50% GIc. The specimen tested at 50% GIc will have little-to-no fiber-bridging affecting the initial value of da/dN. However, for the specimen tested at 90% GIc, by the time GImax has decreased to 50% GIc, significant fiber-bridging may have developed, resulting in a slower growth rate, da/dN, compared to the specimen tested at 50% GIc. The same comparison can be made between the specimens at initial GImax of 50 and 40% GIc.
Delamination growth data for IM7/977-3 material at four GImax levels.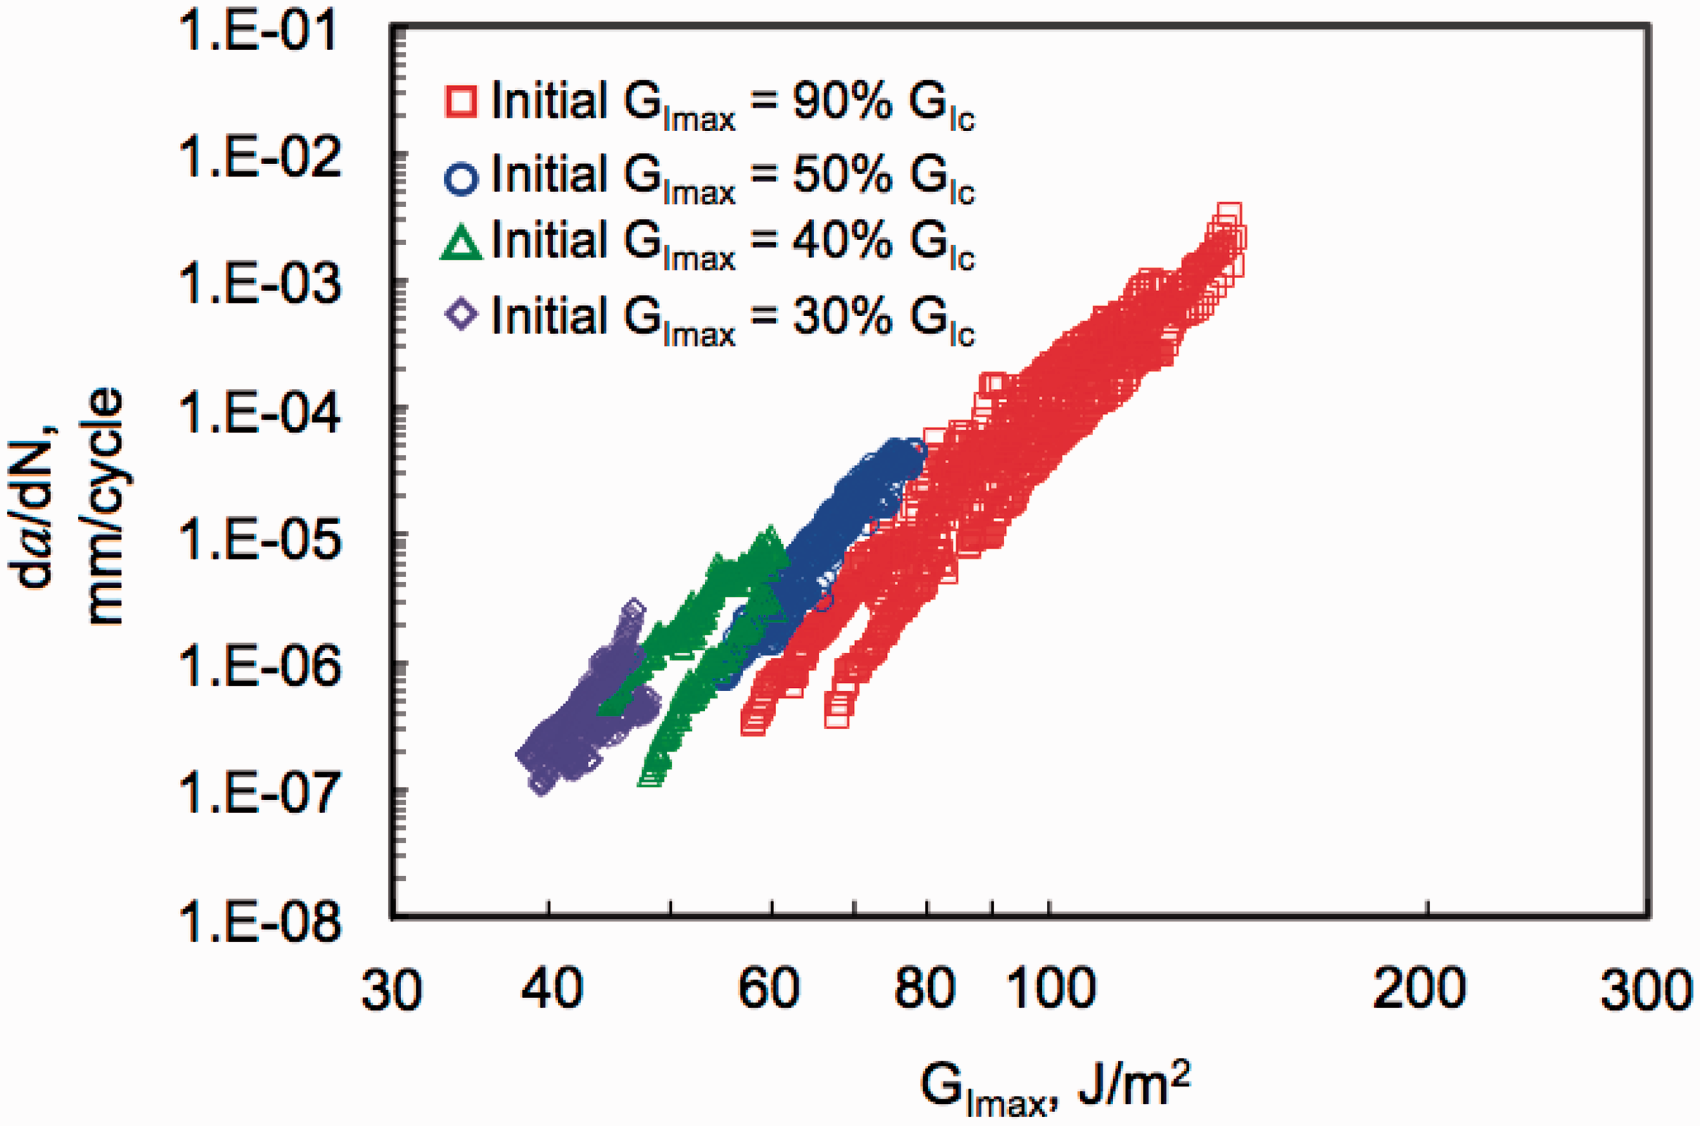
Also, for tests at GImax of 90, 40, and 30%, the data at the lower end appear to be changing slope and tending toward becoming nearly vertical. This would indicate that the delamination growth is arresting at a different G-value for each loading level. This may also be attributable to a greater effect of fiber-bridging in specimens tested at higher GImax levels. The load rate at which this change of slope occurs is approximately da/dN = 5 × 10⁻⁷ mm/cycle for all the load levels. The tests at 50% GIc were not continued long enough to reach a turning point in the slope of the data.
Figure 18 shows the normalized data for the IM7/977-3 specimens, where the specimens are again grouped by initial GImax levels. The offset between the data groups that was observed in Figure 17 is not apparent in the normalized data. Rather, there appears to be a consistent transition between the data at different initial GImax levels. A Paris Law expression has been fit to the combined data set and the equation is shown in Figure 18.
Normalized delamination growth results for IM7/977-3 specimens.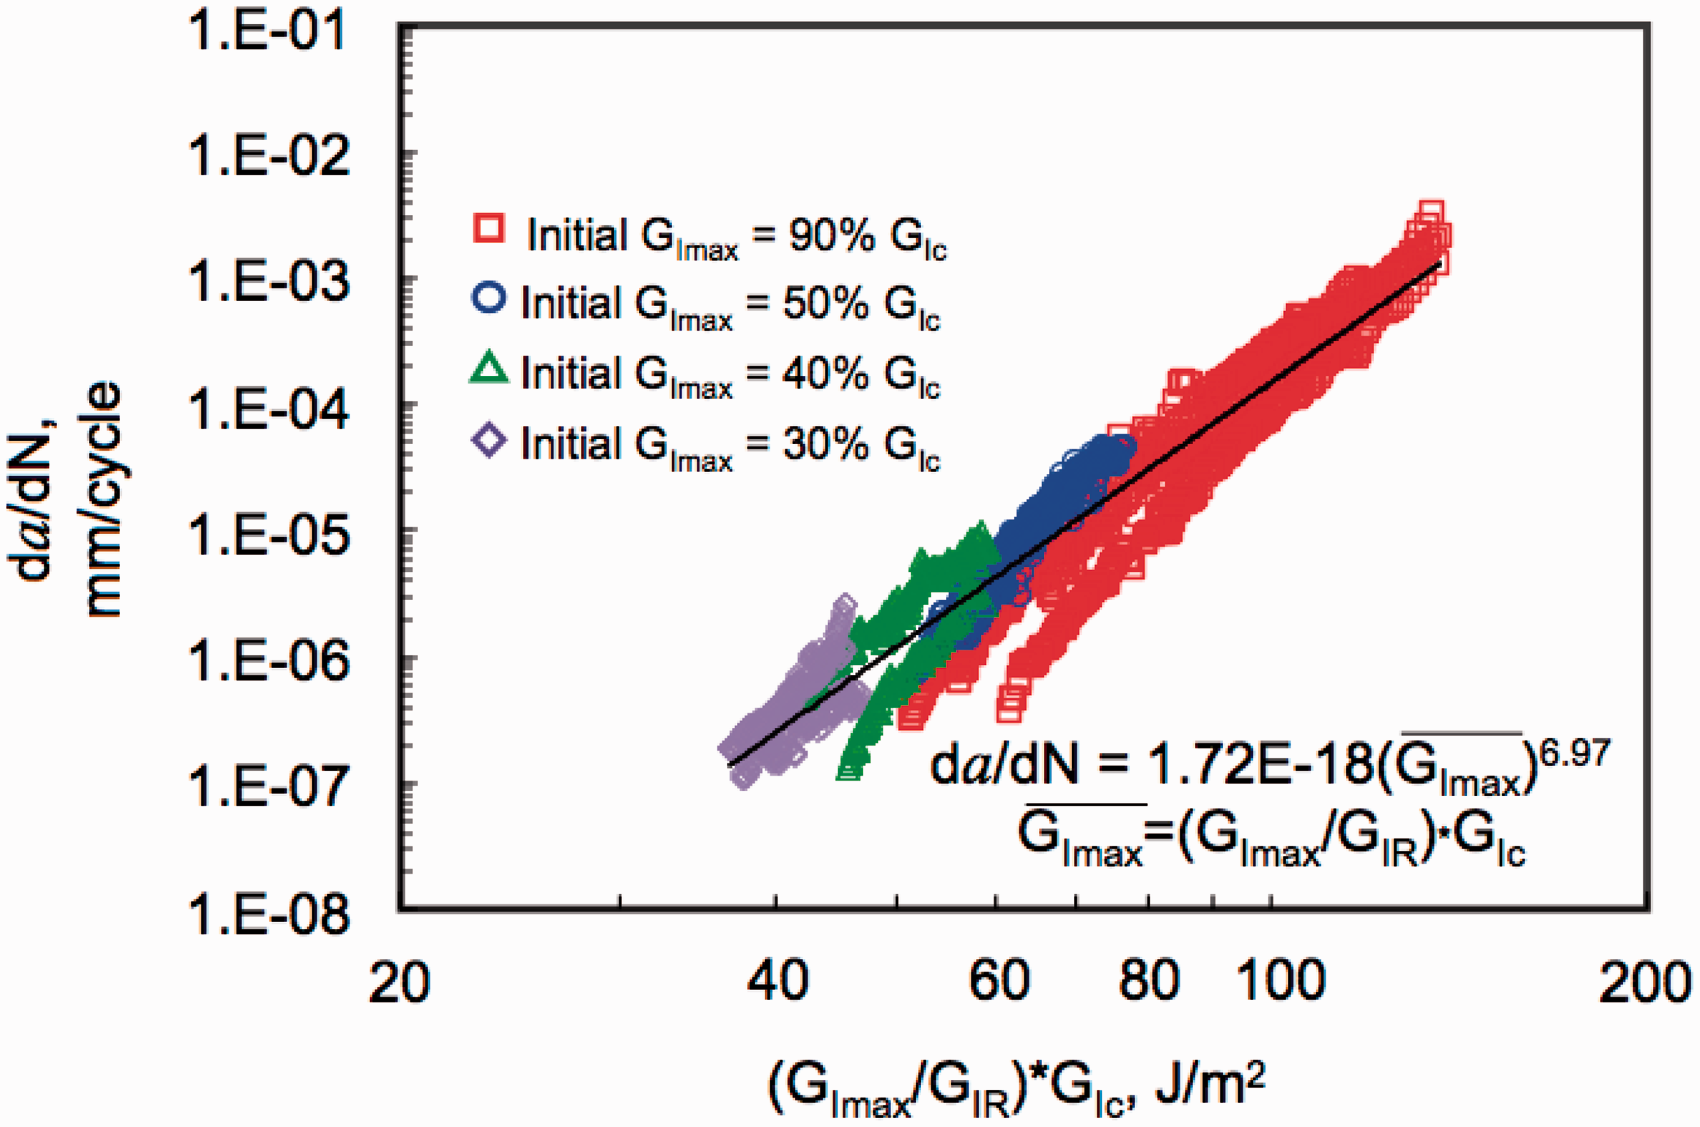
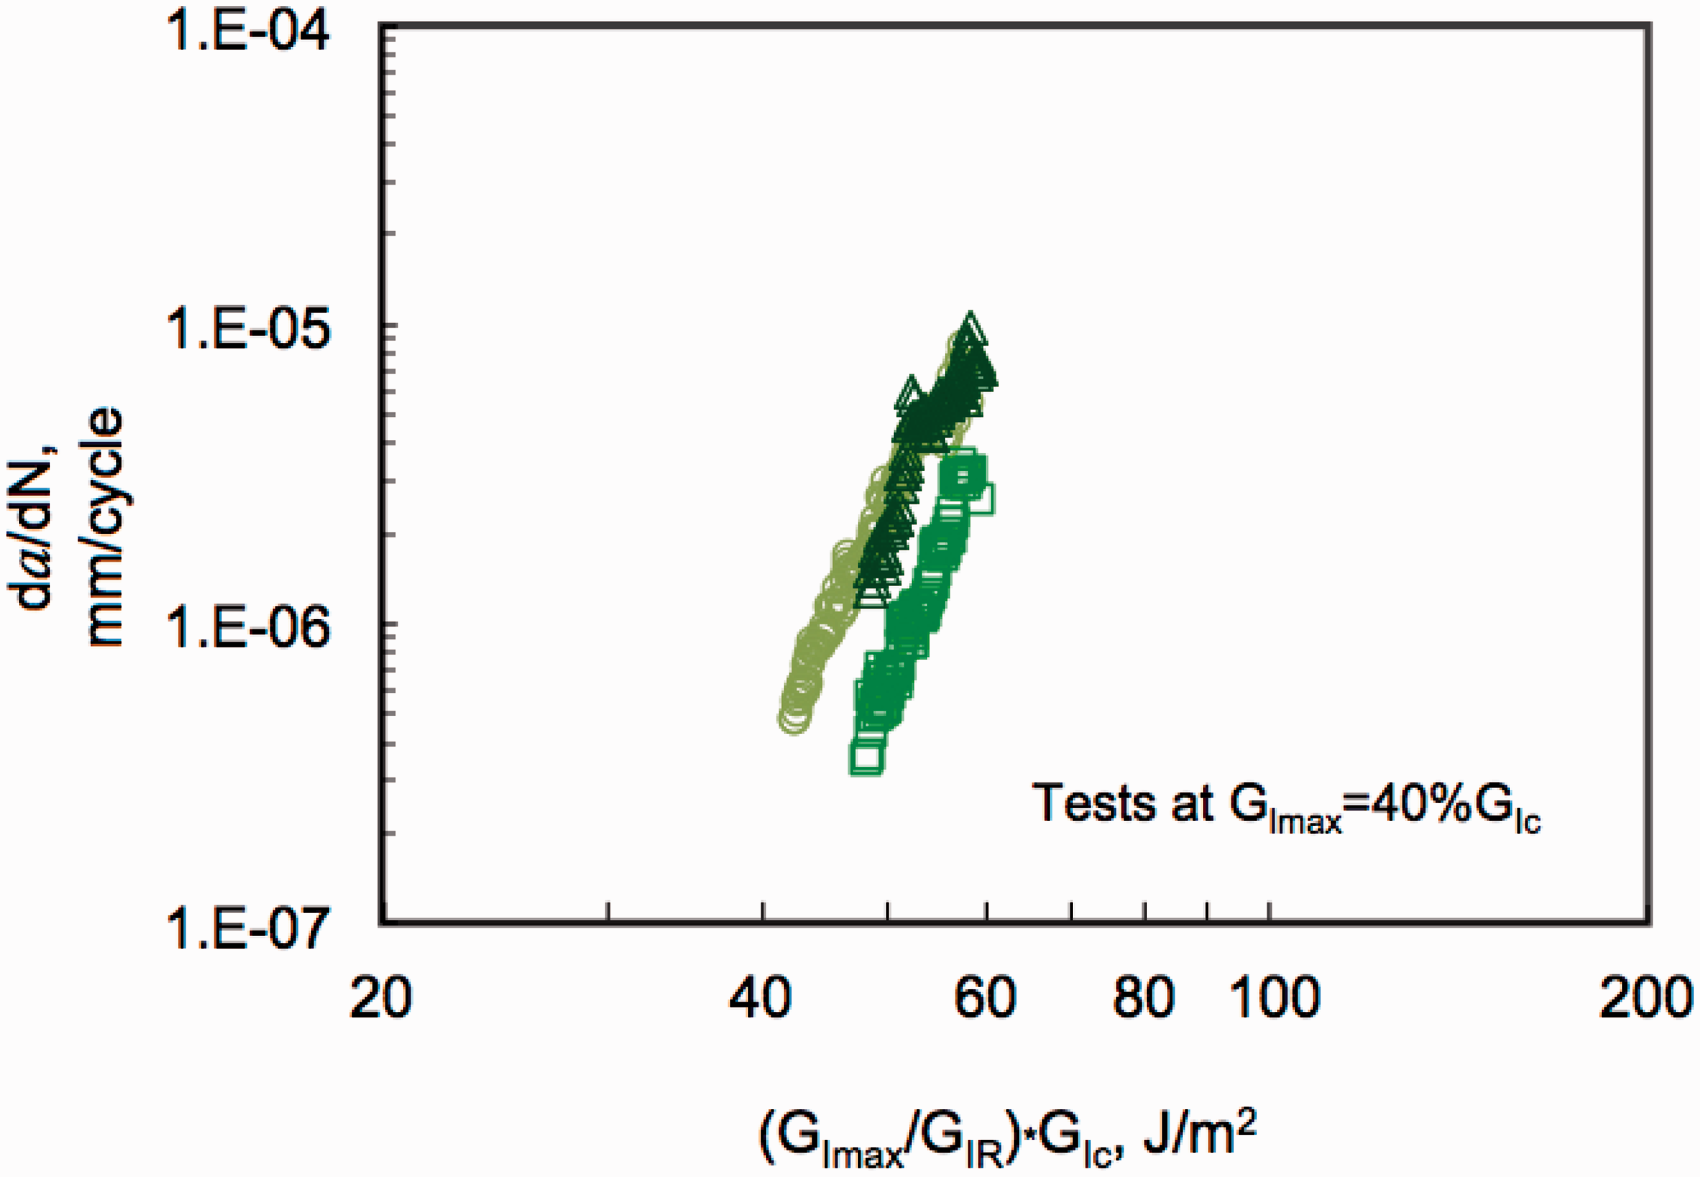
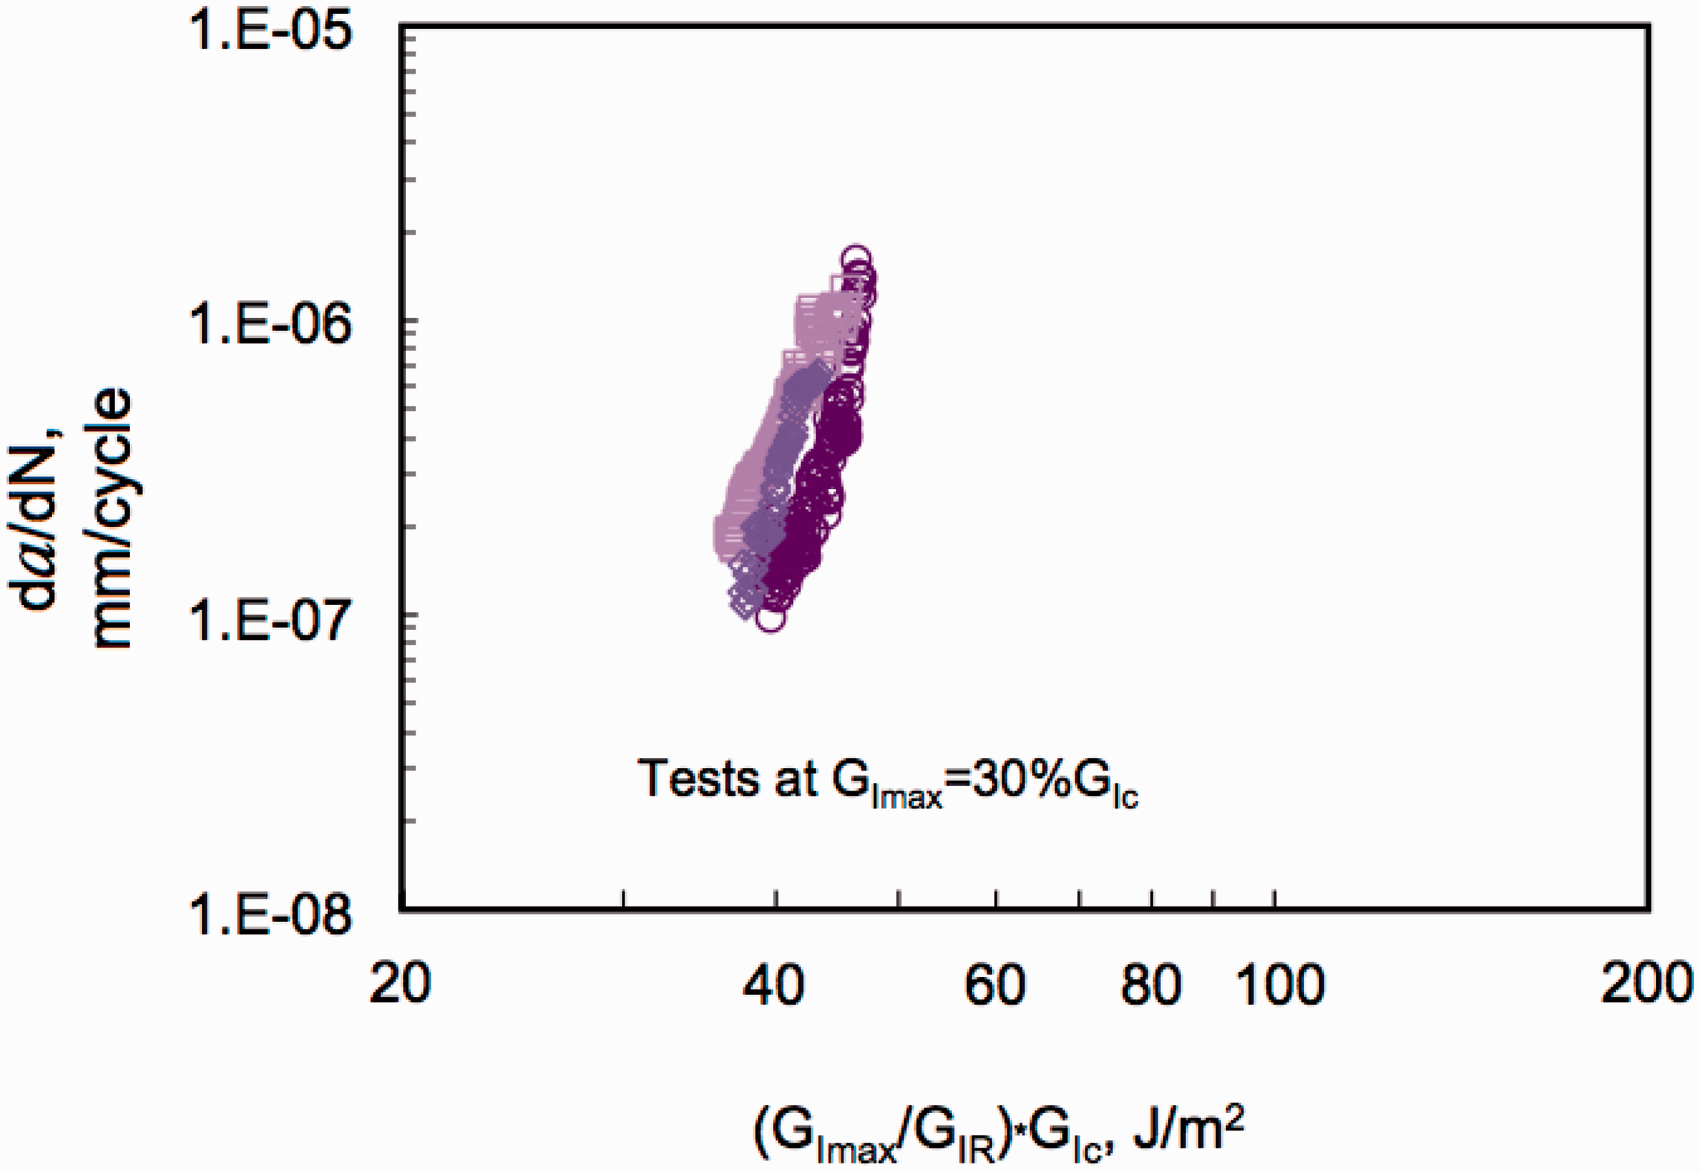
The results for the specimens tested at 50, 40, and 30% are shown in Figures 19–21, respectively. Because the initial growth rate for the tests at 40 and 30% was less than 1.0 × 10⁻⁵ mm/cycle, testing of these specimens was allowed to continue beyond da/dN = 2.5 × 10⁻⁶ mm/cycle. Figure 19 shows excellent repeatability among the 50% specimens. Figures 20 and 21 show that there is more variability in the 40 and 30% results. The results at 30% showed the steepest growth curves, with Paris Law exponents as high as 14.
Delamination growth in three specimens of IM7/977-3 at GImax = 50%GIc. Delamination growth in three specimens of IM7/977-3 at GImax = 40%GIc. Delamination growth in three specimens of IM7/977-3 at GImax = 30%GIc.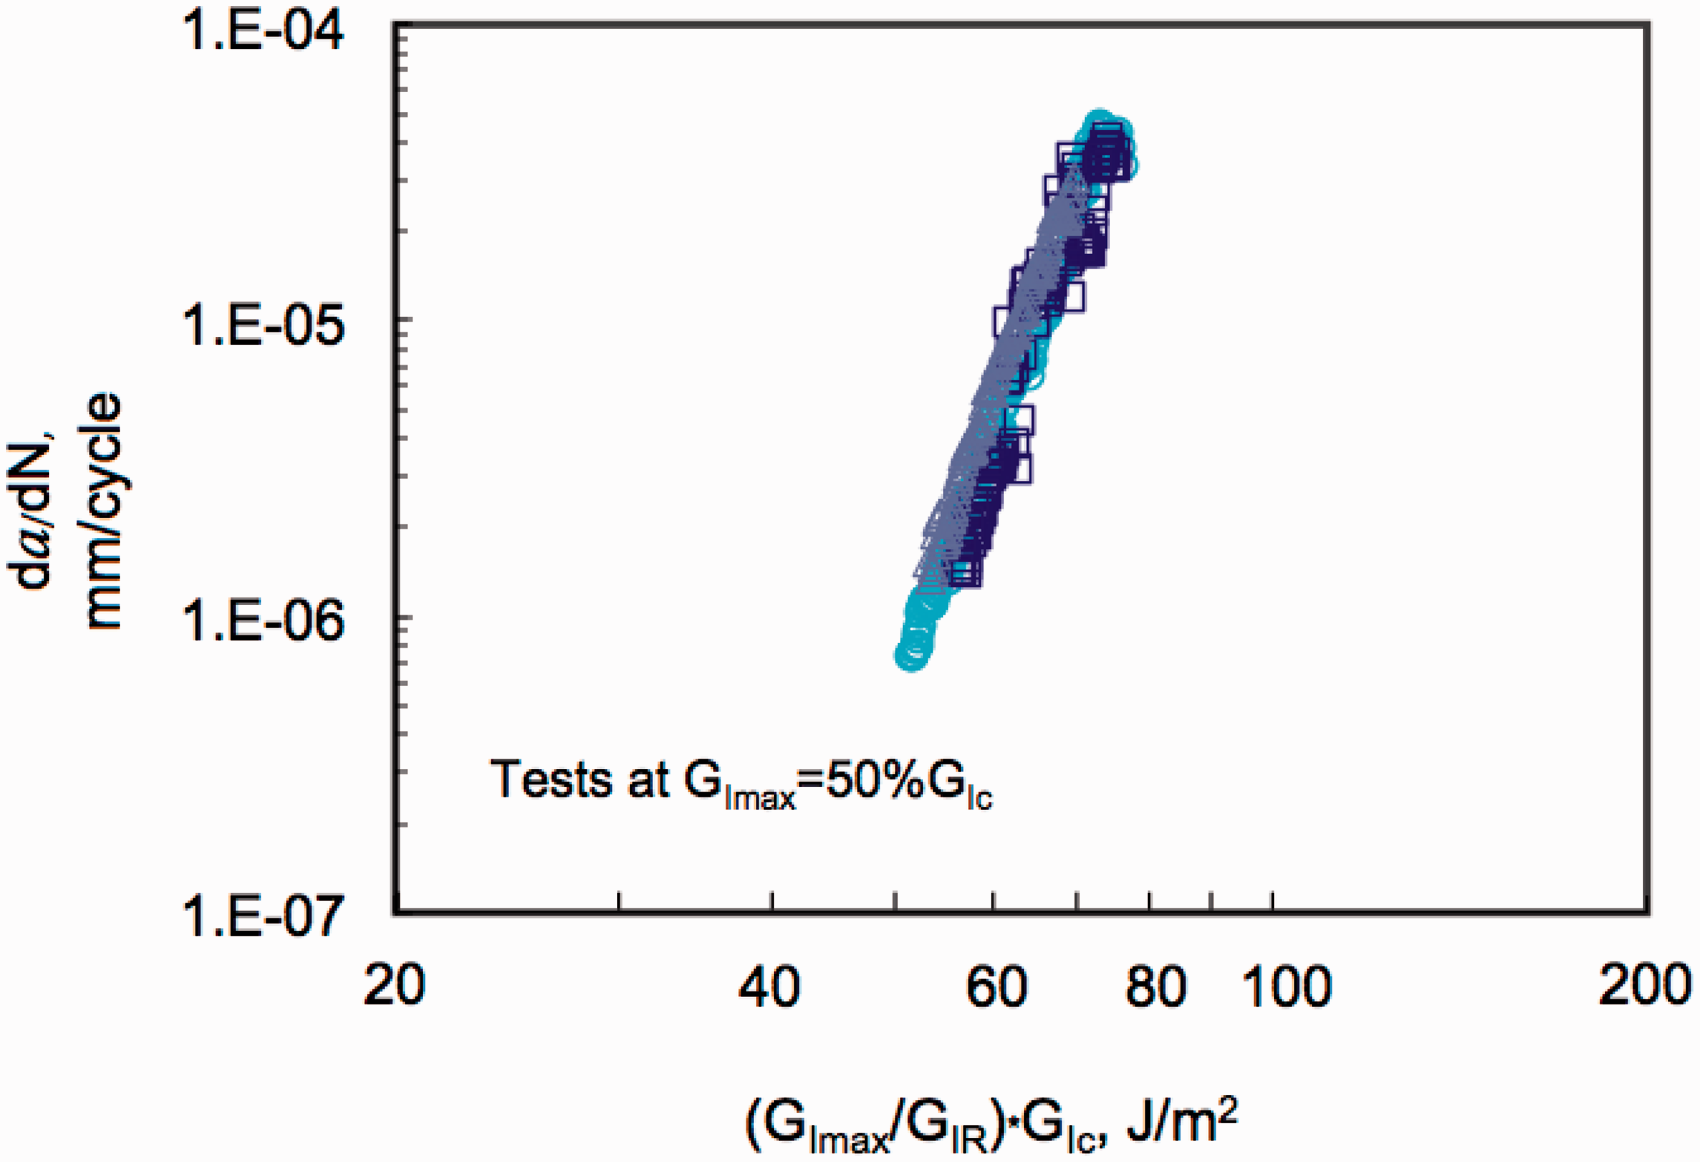
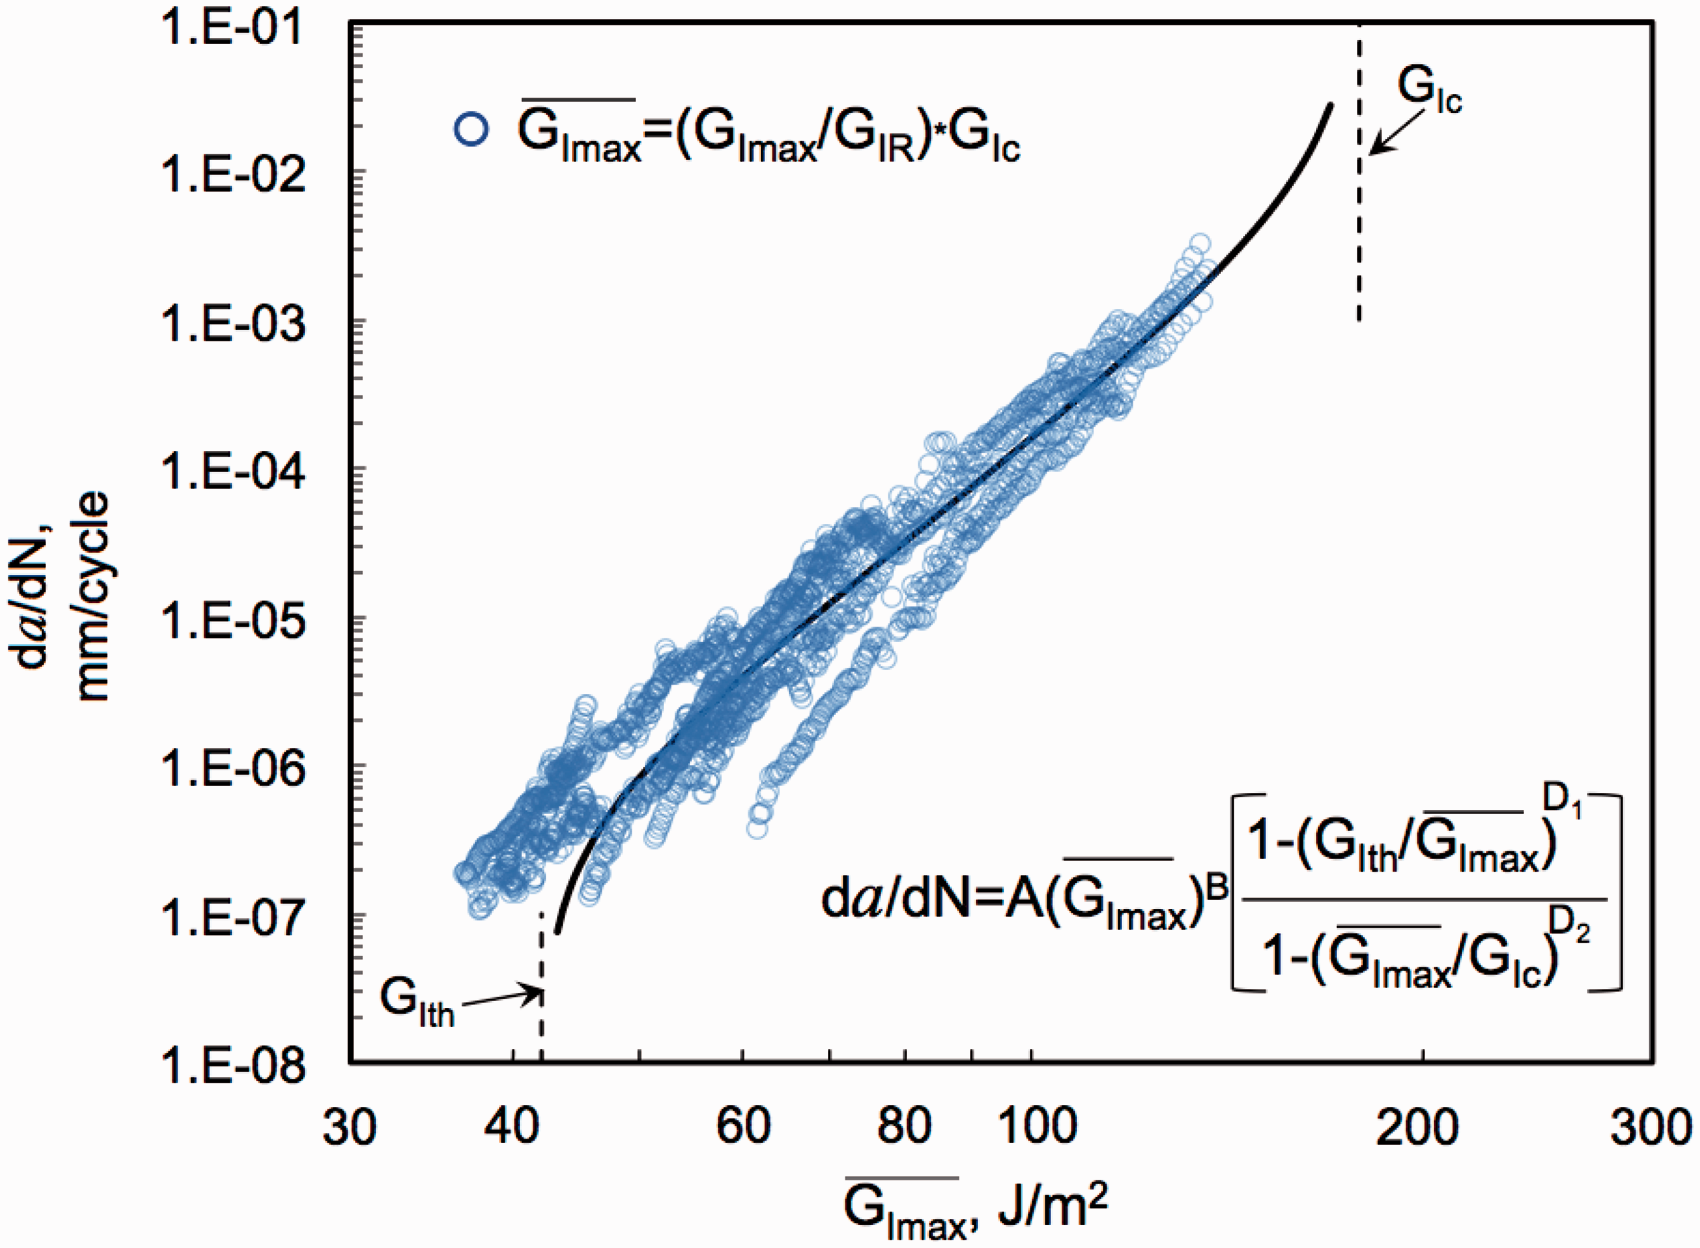
Full fatigue characterization
In Refs. 4, 5, 9, and 10, the equation shown in Figure 3 was postulated as a way to characterize the complete fatigue delamination behavior of a composite material, from onset to delamination arrest. For the Mode I DCB specimen, this equation can be written as
Full-fatigue characterization curve for IM7/977-3 double-cantilevered beam specimens using normalized data.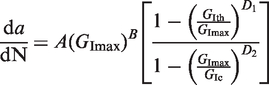
Summary
Static and fatigue tests were conducted on specimens of IM7/977-3 and G40-800/5276-1 graphite/epoxies, and S2/5216 glass/epoxy DCB specimens as part of an ASTM Round Robin to evaluate the draft standard “Standard Test Method for Mode I Fatigue Delamination Propagation of Unidirectional Fiber-Reinforced Polymer Matrix Composites.” Static results were used to generate a delamination resistance curve, GIR, for each material, which was used to determine the effects of fiber-bridging on the delamination growth data. All three materials were tested in fatigue at a cyclic GImax level equal to 90% of the fracture toughness, GIc, to determine the delamination growth rate. Two different data reduction methods, a two-point and a seven-point fit, were used and the resulting Paris Law equations were compared. Growth rates were plotted versus the applied GImax, and versus the normalized GImax, which was determined by dividing GImax by the delamination resistance curve. Additional specimens of the IM7/977-3 material were tested at three lower cyclic GImax levels to compare delamination growth rates. The IM7/977-3 tests were also used to determine the delamination threshold curve for that material. The following observations were made:
There was very little difference in the Paris Law results using the two-point and seven-point data reduction methods. The seven-point method was considered better because of reduced scatter in the resulting plots. The Paris Law exponents for the normalized growth plots were from 5 to 47% lower than for the non-normalized plots, depending on the amount of fiber-bridging in the material type. In a material with extensive fiber-bridging in the DCB test, actual delamination growth rates without fiber-bridging will be significantly faster than indicated by the non-normalized results. Therefore, fiber-bridging must be accounted for in assessing the delamination behavior of a material. Delamination growth data from specimens at different initial GImax test levels were offset. Normalizing the data removed the offset and resulted in a consistent Paris Law for the combined data set. A full-fatigue characterization curve has been proposed as a method to describe delamination from onset to arrest. Such a curve could not be fit through the complete non-normalized IM7/977-3 data set; however, the normalized IM7/977-3 data from specimens at all GImax test levels was used to fit a delamination growth curve over the range of GImax from GIc to GIth.
Footnotes
Conflict of interest
None declared.
Funding
This research received no specific grant from any funding agency in the public, commercial, or not-for-profit sectors.